timdqc migration, - univ-paris1.fr survey on a population-related topic. the ... mr. le van thanh...
TRANSCRIPT

INSTITUTE FOR ECONOMI.C RESEARCH OF HOCHIMINH CITY
NHA XUATBAN eHINH TR! Quae GIA VIE/93/P02 PROJECT 24 Quang Trung - Ha NQi
OT: 8252008 FAX: 84-4-25188 1
TiMDQC
* * *
- Chinh sach, che d9 v~ vay van d~ giai quyet vi~c lam.
TRUNG TAM NGHIEN CUu DAN s6 vA NGUON LAO DONG BO LAO DONG-THVONG BINH vA xA HO!:
- Di dan tt,1 do den Dang Nai va Vung Tau.
z c MIGRATION, .~ z HUMAN RESOURCES,
EMPLOYMENT AND URBANIZATION IN HOCHIMINH CITY
~ NATIONAL POLITICAL PUBLISHING HOUSE
NHA XUAT BAN eHINH TR! Quae GIA 24 Quang Trung - Ho N9i
OT: 8252008 FAX: 84-4-251881
TiMDQC
* * *
- Chinh sach, che d9 v@ vay van d~ giai quyet vi~c lam.
TRUNG TAM NGHIEN CUu DAN s6 vA NGUON LAO DONG BO LAO DONG-THVONG BINH V A xA HO!:
- Di dan tJ.;i do den Dang Nai va Vilng Tau.
INSTITUTE FOR ECONOMI,C RESEARCH OF HOCHIMINH CITY
VIE/93/P02 PROJECT
MIGRATION, HUMAN RESOURCES,
EMPLOYMENT AND URBANIZATION IN HOCHIMINH CITY
NATIONAL POLITICAL PUBLISHING HOUSE


INSTITUTE FOR ECONOMIC RESEARCH OF HO CHI MINH CITY
VIE/93/P02 PROJECT
..
MIGRATION, HUMAN RESOURCES,
EMPLOYMENT AND URBANIZATION
IN HO CHI MINH CITY I ,,' I •
(f,
THE NATIONAL POLITICAL PUBLISHING HOUSE
Hanoi - 1996

TABLE OF CONTENTS
.. PAGETITLE
PREFACE 15
FOREWORD 17
23CHAPTER I:
1.1. Objectives of the study 23
1.2. Study design and methodology 24
1.2.1. Sample frame 24
1.2.2. Listing household 26
1.2.3. Selecting the sample 26
1.2.4. Questionnaire 27
1.2.5. Survey results & an operational
CHAPTER II: DEMOGRAPHIC AND SOCIOECONOMIC CHA.RJ\CTERISTICS OF
.. \ definition of migrants and non-migrants 28
.. (. THE SAMPLED HOUSEHOLD POPULATION 32
2.1. Proportion female 32
2.2. Age structure 34
2.3. Place of birth 37
2.4. Previous place 37
5

2.5. Educational level 39
2.6. Present economic activity status 42
CHAPTER Ill: POPULATION &
MIGRATION IN HO CHI MINH CITY 45
3.1. Population growth in HCMC 45
3.2. Migration rate of HCMC 47
3.3. Registration status of migrants in HCMC 50
3.3.1. Residential status of migrants 52
3.3.2. Residential status by place of origin 58
3.3.3. The residential status and job of migrants 61
CHAPTER IV: MIGRATION HISTORIES 64
4.1. Last place of residence 64
4.2. Marital status of migrants at the time of move to HCMC 66
4.3. Level of education of migrants at the time of move· 68
4.4. Activity status of migrants before migration 68
4.5. Number of moves 71
4 ..6. Reasons for migration 72
4.7. Prior information on HCMC 77
4.8. Secondary migration 78
4.8.1. Number of accompanying persons 78
4.8.2. Number of persons following respondent migrants: 79
CHAPTER V : HUMAN RESOURCES AND
EMPLOYMENT 81
5.1. Human resource 81
,. 5.1.1. Labour force 81
5.1.2. Labor supply: 86
5.1.3. Investment per wOrker: 88
5.2. Adaptation of in-migrants to the labor market of HCMC 90
5.2.1. Job seeking status after arrival
of migrants: 90
5.2.2. Amount of time spent by migrants for finding jobs after their arrival in HCMC 92
5.2.3. Occupation of migrants and non-migrants 94
5.2.4. Average number of working hours in main occupation 98
,. 5.3. Wages and income 99
5.4. Savings and remittances of migrants 111
5.4.1. Savings of migrants 111
5.4.2. Sending money/goods 112
5.4.3. Destination of remittances 114
7 6

CHAPTER VI :FERTILITY AND FAMILY PLANNING OF MIGRA,.lIJTS
6.1. Level and .trend of fertility
6.2. Family planning
117
117
124
I
( ;I
~
6.2.l.Current family planning practices
6.2.2. Reasons for not practicing family planning
CONCLUSION
REFERENCES
124
127
129
135
..
.. 1.
LIST OF TABLES
TABLE TITLE
Expected and actual number of individual respondents by migration status
PAGE
29
2. Distribution of individual respondents by migration "status as per the definition before and after (revised) the survey 30
3. Distribution of sampled population by gender and migratory status 31
4. Distribution of the sampled age and migratory status
population by 33
,. 5. Age structure of migrants at the time of move 35
(.
6.
7
Distribution of migrants by region of previous residence and period of arrival
Average number of years of general
39
education of the sampled household population aged 5 years and above, by migratory status 40
8. Distribution of the sampled population aged 13 years and above by sex and level of tertiary education 41
8 9

9. Present activity status of the sampled male population aged 13 years and above by migratory status. 43
10. The population growth during 1989-1994 47
11. Migration rate during the period 1984-1994 49
12. Percentage of migrants having permanent ~sidential permit by the years entering to HCMC 51
13. Distribution of respondents by registration status and migratory status 53
14. Annual average number of migrants being issued permanent residential permit 57
15. Distribution of respondents having permanent residential permits by the year of entering and last place of origin 59
16. Distribution of migrants having temporary residential permit by the year of entering and place of origin 60
17. Distributions of migrants having permanent residential permit by main occupation and the year of entering. 61
18. Distribution of migrants having temporary residential permit by main occupation and the year of entering. 62
19. Distribution of respondent migrants by
I \ last place of residence and period of
their arrival in HCMC 65
20 Distribution of migrant respondents aged 13 years and above at the time of move by marital status at move and period of arrival 67
.21. Distribution of respondent migrants by
number of moves 71
22. Distribution of migrant respondents by reasons of. their migration and gender. 73
\
23. Distributio~ of migrant respondents by reasons of ~heir migration and region of last place df residence. 74
I 24. Distributiof of migrant respondents by
main reasqns of their migration and period of ~rrival 76
25. Di'tribUtiO~ of respondents having/not having in rmation prior to the move to HCMC %) 77
26. Average .number of persons accompanying and following respondent migrants by
to gender and place of origin 78
27. . Labor force 82
; 28. / Activity status of persons of labor force
{lge of HCMC. 83
Labol'ers working in HCMC 84
Distribution of professional workers by .. level of tertiary education 85
I I
11 10

31. Distribution of migrants by period of arrival and job seeking status after arrival
32. Distribution of migrants by period of arrival and amount of time spent for finding the first job in HCM City since their arrival.
33. Distribution of respondents by gender, main occupations and migratory status
34. Distribution of respondents by migratory . to f ./status and economlC sec r 0 m8J.\,n
occupation I I
35. Average number of working hou~per week of respondent workers in m 'n occupation, by migratory status aid economic sector
I
36. Average income of respondents b~ migration status and gender ,
37. Average income of migrants by t e . industry of main occupation and dod of arrival
38. Average number of migrants' working hours per week by main occupation and period of arrival
39. Average income of respondents by economic sector, sex and migration status
40. Average number of hours worked per
91
93
95
97
99
100
101
\ \
\ 102
• i
1\3 \
week by economic sector, migration status and sex 104
4l. Average wage rate per working hour of employed respondents by gender and migratory status 105
42 . Distribution of workers by migratory status and type of organization of main occupations 107
43. Average amount of yearly saving per worker by migratory status III
44. Proportion of respondents sending money/goods during the last 12 months, by gender and migratory status ll3
45. Distribution of value of money/goods sent by migrants during the last 12 months by receiver of remittances ll5
46. Distribution of the value of money/goods sent by migrants during the last 12 months by main purposes of sending . ll6
47. Number of women and number of children ever-born and children born during the last 12 months , from the 1994 migration survey ll8
48. Age-specific fertility rates as derived
• from the Population Census on April 1, 1989; the Demographic Survey on January 1, 1993; and the Migration Survey on September 1, 1994 120
13 12

49. Distribution of ever- married non-migrant and migrant women and their reported number of children ever born and the
last births by age group 123
50. Percentage of married women age 15-49 years currently using any contraceptive
method, modern or non-modern 125
PREFACE
This study was undertaken within the framework of a United Nations Population Fund ( UNFPA) project in Viet Nam, VIE/93/P02, "Support to Research on Population and Development in Viet Nam". The project, which was partly financed by the Government of France, started in 1993 and involved four Vietnamese research institutes. Each one of them carried out a small quantitative survey on a population-related topic. The analysis of the survey results are being published in four separate reports ( including this one) in English and in Vietnamese.
This monograph was written by Ms. Vu Thi Hong, Mr. Le Van Thanh and Mr. Truong Si Anh under the supervision of Dr. Bach Van Bay, Director of the Institute for Economic Research ( IER) of Ho Chi Minh City. Technical assistance was provided throughout the project by Mr. Patrick Gubry, a researcher at the Centre for Population and Development (CEPED) in Paris and Mr. Jerrold W. Huguet, from ESCAPBangkok.
May, 1996
THE NATIONAL POLITICAL PUBLISHING HOUSE
14 15

FOREWORD
Ho C?hi Minh City .(HCMC), which is located in the south of Viet Nam, plays an important role in industry, commerce, finance, science, technology and education, not only for the South but also for the whole country .
HCMC is a large p:ltential market for the south and the country . As the market economy was developed before the unification of tbe country, the City: has become a focal point for commodity demand and supply, services, labor, and finance for the region. Thus, the City has assumed a very important role and positi~n in terms of the economic development of the region and country.
During the transition from a centralized and planned economy to a market economy beginning after 1986, the economy of HCMC. has developed continuously. The growth rate of the gross domestic product ( GDP ) increased by 9.8% in 1991 and 14.6% in 1994 with an average of 12.9 percent for the period. GDP per capita in USD was 641 in.1991 and 810 in 1994. The growth rate of the GDP in HCMC was 4 - 5 percentage points higher than for the whole country, while the GDP per capita was about three times as high. The city
17

contributes approximately 30 percent of the countrys budget. '
The continuous economy development of HCMC has resulted from economic reform which has been as follows:
(1) The State economic sector has been reorganized, foreign investment has increased significantly, and the private economic sector has developed strongly. Within five years nearly 500,000 people have found jobs, and the unemployment problem in the City has been partially solved.
(2) With economic development, the Government's budget and the budgetary expenditures oJ HCMC and provinces have increased. The infrastructure of the City has been improved and rearranged, and difficulties from the old infrastructure have been gradually eliminated during the development process.
(3) An increase in welfare and improvements in education, medical care and literacy are also the results of economic development. Budgetary expenditures by the City on education, medical care and literacy have been increased. As a result, the illiteracy rate decreased from 7.5 percent in 1991 to 4.6 percent in 1994 (for the population aged 6 years and over). The number of students at all levels has increased, particularly at universities, colleges and training centers. A decrease in the birth rate has led to a decline in the rate of natural increase. The number of hospital beds and houses has increased. The living standard also increased. Monthly
18
average expenditure per head has more than doubled (2.2 times) between 1991 and 1994.
Because of the trends described above, HCMC has become a center for migration flows. While the economic growth of the City is higher than for the country as a whole , the rate of the city's population increase is also higher than the national average.
The urban population of HCMC accounts presently for over 75 percent of the City's total population. The urban area consists of a central area, a periphery and 6 towns. At present, HCMC includes 12 urban districts and 6 periphery districts.
'.
Although HCMC has made a considerable contribution to the country, its rate of urbanization is rather low, its rate of unemployment is high, and its infrastructure system has been deteriorating seriously due to inadequate rehabilitation, leaving little' ~om for expansion and development. Meanwhile, the Government has been carrying out a reform policy in recent years in order to absorb investment capital from the domestic sector as well as foreign enterprises in the fields of manufacturing and services. This has required an adequate
I-
infrastructure system to support these economic activitie:s. This situation has been aggravated by the high population growth rate of the City.
PopUlation, labor, migration, employment and urbanization are subjects which are closely related in a system of urban research. However, they have not yet been studied systematically . They are, therefore, a special
19

subject of a very urgent nature to the City. The Institute of Economic Research of HCMC was assigned by the Study directors of the VIE/93/P02 project to study the subject "Migration, human resources, employment and urbanization in HCMC·.
The study was divided in two stages :
+ The first stage was a State-of-the-art report which discussed such factors as migration, human resources, employment and urbanization, and their interrelationships.
+ The second stage consisted of conducting the survey on migration and employment in HCMC.
We have already prepared two reports on :
(1) State- of- the- art report in 1993, and
(2) Preliminary report on migration to HCMC, after conducting the sample survey in 1994.
This final report analyzes the different aspects of migration into HCMC and makes some proposals on policies to manage and accommodate migration flows into the City.
Contributions to the present study came from:
A. Board of directors from IER:
• Mr. Bach van Bay
• Mrs. Vu thi Hong
• Mr. Le van Thanh
• Mr. Truong si Anh
B. International organizations:
• UNFPA in Hanoi: Assisted by providing funding and monitoring of the project, in particular Ms. Linda Demers, the UNFPA Country Director and Ms. Violette Pedneault provided encouragement and support.
• CEPED in Paris: Assisted with advice on survey design, questionnaires, tabulation and report preparation, in particular Mr. Jacques Vallin and Mr. Patrick Gubry.
• ESCAP in Bangkok: Mr. Jerrold Huguet acted as the international consultant for preparing the questionnaires, tabulation plan and final report.
C. National organtzations:
1. Central organization: The Center for Population and Human Resource Studies of the Ministry of Labor, Invalids and Social affairs, Hanoi.
2. Organizations of HCMC:
• Institute for Economic research (IER): conducted the survey and research with the direct participation of the Urban Section and other researchers of IER.
• Co-operation:
- Statistical office of HCMC.
- Police department of HCMC.
20 21

CHAPTER I OBJECTIVES AND METHODOLOGY
1.1. OBJECTNES OF THE STUDY:
The objectives are:
(1) To understand the demographic and socio-economic characteristics of recent migrants
to HCMC;
(2) To determine the major reasons or
motivations for migration to HCMCj
(3) To understand the adjustment of migrants
to the City environment; .,.
(4) To analyze the major demographic and
socio-economic consequences of migration, such as family identity, marital status, education, economic
activity status, employment and income;
(5) To understand the role of migrants .in their
home place through remittances;
23

\ (6) To compare different aspects of migrants
and non-migrants;
(7) To evaluate the effectiveness of some policies
to restrict migration to the City ; and
(8) To propose a set of recommendations to the City authorities, policy makers and planners.
1.2. STUDY DESIGN AND METHODOLOGY:
Although the unit of study is individual
migrants and non-migrants, it was decided that the basis for the sample would be households in HCMC because of financial, human resource and time constraints. This would,' of course, tend to
exclude many individuals, especially short-term or seasonal migrants, who are not accommodated in a household.
1.2.1. Sample, frame
Ho Chi Minh City is administratively divided into twelve inner and six peripheral districts. The districts are further divided into a total of 282
sub-districts. As migrants of the same place of origin or other characteristics often cluster in
certain areas of the City, it was decided that
samples would be taken from every district so
l
~
..
as to capture as many migrants of different
characteristics and origins as possible. However,
one district, ( Can Gio ) was excluded from the
study since the living conditions there are
extremely difficult, which deter most migrants from
the area. In fact, its population only migrates out
and the district has had very few in-migrants for
years. Thus, two sub-districts were selected at
random from each of the 17 districts, making a
total of 34 sub-districts selected for the further
step of sampling enumeration units.
As a sub-district in HCMC usually contains from
20 to 30 thousand inhabitants, it was not possible
to take all of the 34 sub-districts as the sample
frame to enumerate all the population. Hence, only
one residential block, which usually contains from
400 to 600 households and with the number of
inhabitants varying from 2,000 to 3,000, was
selected randomly from each of the 34 sub-districts.
The population of all 34 blocks formed the sample
frame for the survey and this study.
It was planned that 1,000 individuals would be
selected for interviewing. However, because the
main focus of the study was supposed to be the
migrant population in the City, the ratio of
I 24 25

migrants to non-migrants sampled was decided to
be eight to two (8:2). That is, 800 migrant and 200 non-migrant individuals would be selected and a~ministered individual questionnaires.
1.2.2. Listing of households
In the first stage of the sampling procedure, local authorities in the 34 selected residential blocks were asked to go to every household in their respective areas to record a limited amount of information about each household member, including their name, age, sex, place of birth and number of years of stay in the City. The household slips were then collected and all information was computerized. A total of 19,109 households with more than 94,000 inhabitants were enumerated in
this first stage of the survey.
1.2.3. Selecting the sample:
In accordance with the objectives of the study and based on the records of local authorities, households with at least one member born outside HCMC who had stayed in the City for ten (10) years or less, were defined as migrant households and were extracted. Other households were defined
as non-migrant households, Le., households with
. ( " none of their members born outside HCMC or no one migrating to the City after April 1st, 1984. Thus, 800 migrant and 200 non-migrant households, as per the study design, were selected at random from the total number of 19,109 households listed by local authorities. One migrant aged 15 years or above was chosen at random from each migrant household and administered the
individual migration questionnaire. One member aged 15 years or above in each non-migrant household was chosen at random to respond to the same individual questions, but without the section on migration history.
1.2.4. Questionnaire
In pursuit of the objectives of the study, a
,. questionnaire was designed following an example
from ESCAP, the comments of technical advisors
from ESCAP and CEPED and based on the .,
experience from a previous !ER migration survey
in 1990.
The questionnaire is structured into five sections. Section One, Housing and Household characteristics, contains questions for collecting
basic information on housing conditions and
,L
26 27

( demographic and socio-economic characteristics of
all members of the selected households. Section Two was designed especially for individual migrant that were randomly selected from each of the
households. Most of the information on migration history is included in this section.
Sections Three to Five were designed to collect information on employment, income, remittances and fertility and family planning issues.
1.2.5. Survey results and an operational definition of migrants and non-migrants
When the filled questionnaires were examined,
it was discovered that many records of the local
authorities were not accurate and the migration
status of many individuals was different from that
recorded. This made the determination of some
individuals that were supposed to be migrants
according to the above definition incorrect. Hence,
out of 800 predetermined migrants, 89 persons
were actually born in HCMC and had moved only
within the City and 7 persons had. migrated to
the City· before 1984. According to the definitions
adopted, those 96 persons (89 +7) ~re not migrants.
From the preselected 200 non-migrant
"'f '-,1'
individuals, 151 persons were born in HCMC and 49 persons had migrated to the City before 1984. All of them are non-migrants as defined earlier. The number of respondents by actual and expected migration status is shown in the table below.
Table 1: Expected and actual number of individual respondents by migration status
Actual status I I
Expected status Migrant Non-migrant Total
Migrant 704 96 800
Non-migrant - 200 200
Total 704 296 1000
However, because information on the date of arrival or the number of years of stay in HCMC for both individual respondents and other members of the sample households is available, it would be more useful to define migrants or non-migrants from their place of birth, that is, a migrant is one who was born outside HCMC regardless of the date of hislher arrival. The· migrants are then classified as :
those arriving before April 1st, 1984;
(2) those cOming between April 1st, 1984 and
December 31st, 1989; and
29 28

(3) those coming after December 31st ,1989 to
the date of the survey, i.e., September 1994.
This classification is applied hereafter throughout this study. The new definition results in the following numbers of individuals by migration status:
TctJle 2: Distribution of individual respondents by migration status as per the deimition before and
after (revised) the survey
Before survey defmition Revised definition Non- Migrant Total
migrant
Non-migrant 151 89 240
Before 1984 migrant 49 7 56
Between 1984-1989 migrant 362 362
After 1989 migrant 342 342
200 800 1000Total
Thus, although 800 preselected individuals were
administered the individual questionnaire, only 711 of them are eligible for the analysis of migration
history (which is including 7 migrants coming to HCMC before 1984), such as urban/rural origin, socio-economic and demographic characteristics at
the time of move, employment status, income and
so forth. 89 persons who moved within the City are now incorporated in the category of
non~migrant.
It is worth noting that the definition of migrants and non-migrants by their place of birth as presente'd above treats return migrants as
non-migrants.
Table 3: DistribUtion of sample~ population by gender and migratory status
Migratory status Male Female Unknown
Total .
Non~Jiligrant 1385 1399 3 2787
Before 1984 migrant 404 454 - 858
Between 1984-1989 migrant After 1989 migrant
534 462
598 568
--
1132 1030
Total 2891 2913 3 5807
~;;
" <..', .'
30 31

~!tF
Table 4. Distribution of the sampled household POpulation by age and migratory status
Migra~ry status
CHAPTER II Migrants ,#
Age group Non-zniirant8DEMOGRAPHIC AND SOCIO-ECONOMIC 1984-1989 After 1989
CHARACTERISTICS OF THE SAMPLED Male Fem. Total Male Fern. Male Fern. Total
HOUSEHOLD POPULATION 0-4 11.9 14.1 11.2 - - - 3.7 2.3 2.9
5-9 12.4 9.9 11.2 4.7 5.4 5.0 t).3 4.4 5.2
10-14 7.9 ~··7.6 7.7 ' 9.9 9.5 9.7 7.2 4.4 5.6
2.1. PROPORTION FEMALE 15-19
,.
8.7 8.9 8.8 13.1 11.5 12.3 16.0 17.3 16.7
20-24 11.3 10.9 ILl 14.2 13.6 13.9 23.4- 21.8 22.5While males and females are in almost perfect
25-29 9.1 11." 10.9 14.6 14.9 14.8 11.9 15.0 13.6balance in the non-migrant population, a
30-34 9.9 10.1 10.0 13.7 13.2 13.4 9.5 9.9 9.7predominance of females can be observed among , I , 35-39 9.0 7.8 8.4 7.9 7.5 7.7 5.2 6.2 5.7the migrant population, particularly among those "
,~.~, 40-44 4.8 6.9 '5.9 6.9 7.0 7.0 5.2 4.9 5.1migrating to HCMC after 1989, i.e., 55.1 percent , i"
45-49 3.5 3.5 3.5 3.9 3.7 3.8 3.5 3.5 3.5(table 4). I."~~(. '" 50-54 2.8 3.6 3.1 2.4 4.9 3.7 3.0 1.8 2.3
The proportion of females among the population il&, 55-59 2.4 3.1 2.7 3.8 2.5 3.1 1.7 2.5 2.1
migrating to HCMC between 1984 and 1989 is • 1.660-64 . 3.7 2.3 3.0 1.7 2.3 2.0 0.7 1.2
slightly higher than that collected from the 1989 65+(·) 3.4 5.8 5.0 3.2 4,0 3.6 2.8 4.6 3.8
population census, i.e., 52.8 percent and 50.6 Total 100.0 100.0 100.0 100.0 100.0 100.0 100.0 100.0 100.0percent, . respectively. However, it is still much Samples 1,789 i,853 3,645 534 598 1,132 462 568 1,030lower than that from the 1990 sample survey on
migration in HCMC, i.e., 57.9 percent. The (.) Not including 3 persona whose gender is not knowncomparison of proportions of females from different
3332

· sources shows that males were very likely to be
under-enumerated in the 1990 migration survey.
Nevertheless, the increase in the proportion of
females among the migrant populatiol} from 52.8
percent in the period 1984-1989 to 55.1 percent
in the later period also suggests that fernalE~s tend
to predominate in recent migration flows to
HCMC. This is very much related to a rapid growth
in employment in the light processing industries
such as the textile and food processing industries.
Retail and related activities also attract a number
of women to the City. Many women from the
poorest rural areas come to do housework as family
servants for a new class of richer families in the
City. In addition, a significant number of rural
women migrate to the City and are employed in
occupations such as prostitution or other
"dishonest" services in hotels, restaurants or pubs.
According to an official source of the Department
for Labor and Social Affairs of HCMC, the number
of those migrants has increased in recent years
and most of them' are not registered.
2.2. Age structure
The survey results reconfirm a· distinct
difference in age structure between the
non-migrant and migrant populations. Nearly 35
percent of the non-migrant population are under
age 15 , and the same percentage are in the age
span from 15 to 29 years. This distribution is
very similar to that from the 1989 census .. While
80 percent of the migrants who arrived in the
city ten years ago or more are now at age 30
years and above, 52 percent of the most recent
migrants are concentrated in the age groups 15-29
years, which is 18 percent points higher than
the corresponding proportion in the non-migrant
population. This clearly suggests that recent
migrants are age selective.
'Table 5. Age structure of migrants at the time of move
Arrival period Age group
1984·1989 After 1989
0-14 32.1 19.7
15-29 41.0 52.0
30-49 19.4 19.8
50-64 5.8. 5.6
65+ 1.6 2.8
Total .. Samples
100.0
1,132
100.0
1,030
35 34

An increasing age-selectivity of the migrant
population is well reflected in Table 5, which
indicates the age structure of migrants. at the time
of their last move to HCMC. Until the first half
of the 1980s, all migration flows were dominated
by planned movements. The migration of senior
or experienced staff was often accompanied or
followed in a later period, by their spouse and
children. Planned movements of population from
densely populated provinces in the North were,
however, hou~ehold migration, Le., entire
households moved at once. Thus, the age str,:ucture
of migrants is more or less typical to that of a
usual community with a dominance of young
population..
Household migration began to decrease in the
following period when the number of spontaneous,
single migrants coming to the City looking for
jobs or to improve their education/skills tended to
increase. As these persons were not accompanied
by children under age 15 years, this resulted in
a rapid decrease in the proportion of migrants
in the youngest age group, i.e., from 32.1 percent
between 1984 and 1989 to 19.7 percent in recent
years. The youngest migrants are now replaced by
single migrants in their early productive age span,
i.e., 15-29 years. Persons aged 30-49 years account
for a relatively stable portion among migrants in
both periods, that is, around 20 percent. •
2.3. Place of birth
The survey reveals that only 48 percent of the
sampled population were born in HCMC, which is
a bit lower than the. proportion calculated from
the 1989 census.
Among the migrants born outside of HCMC, the
largest proportion were born in the provinces of
the Mekong River Delta and Red River Delta, Le.,
17.3 and 12.2 percent, respectively. Another 9
percent originated from the Central coast
provinces.
2.4. Previous place
The increasing role of Hanoi fn many aspects
means that HCMC is no longer the only place
that attracts migrants from all provinces in the
country. Although it is still far from assuming
such pulling power as HCMC, Hanoi can now be
37 36

. considered a migration counter~magnet to HCMC.
It primarily attracts migranta from the surrounding
provinces in the Red River delta. This, together
with the fact that planned migration has now been
replaced by spontaneous flows, has resulted in a
rapid reduction in the proportion of people
migrating to HCMC from provinces in the Red
River. delta in the last five years, Le., from 22.0
percent to 18.3 percent (table 6).
Nevertheless, HCMC is still an attractive place
for people in the central provinces, where living
conditions seem to be the hardest in the country.
The proportion of migrants originating from those
provinces increased in the last ten years, from
22.4 to 27.8 percent.
As usual, shorter distance migration of people
from the Mekong River Delta still accounts for
the highest percentage of migrants from all regions
in the country. The number of migrants from the. Mekong River Delta provinces increased slightly
in recent years. Finally, a significant increase is
also observed among the very short-distance
migration flows, t4at is, from the provinces.
38
Table 6. Distribution of migrants by region of previous residence and period of arrival
Arrival period Previous place
1984.1989 After 1989
,32.5 33.6Mekong Delta
22.0 18.3Red River Delta
15.1 15.6Southeastern Region
15.2 19.3Central Coast
7.2 8.5Region IV
1.7 2.11Western Highlands
3.5 .1.8Northern Highlands
0.62.8Overseas 0.00.1Unknown
100.0100.0Unknown 1,132 1,030
Samples
2.5. Educational level
In the Vietnamese statistical system, the general
level of education of the population is classified
for primary and secondary education from grade 1 to grade 12, and tertiary education, any education
and training other than the 12 grades. In Vietnam,
children begin entering grade 1 at age 6 years.
But for the purpose 6f international comparison,
population aged 5 years and above is taken into
account for assessing education levels.
39

better trained than non-migrants. Not taking intoTook 7. Average number ofyea:rs of general education of the sampled household population account the migrants who were transferred to the
aged 5 years and above, by migratory status City in the period between 1975 and 1984 by the Government, most of whom were senior personnel
Average years of general education Migratory status before moving, more migrants are equipped with
Male Freq. Male Freq. tertiary education than non-migrants at all levels. Non-migrant 6.7 1,174 6.7 1,202 The survey results also show that migrants staying 1984-1989 migrant 8.6 584 7.5 598
C' longer in the City achieved higher levels of
Mter 1989 migrant 9.0 445 8.0 555 qualification (table 8). Total 8.0 2,153 7.2 2,355 Table 8. Distribution of the sampled population aged
Source : Sample survey of IER,l994 13 years andabove by gender and level
of tertiary educationAs seen from Table 7, the non-migrant population has fewer years of' general education
Migrants than the migrant population. In particular, a I?ale I..evelof
Non-migrants 1984-1989 After 1989tertiarymigrant on average has ~ or 3 more years of education M I F I Total 1 M 1 F I Total 1 M 1 F ."otalgeneral schooling than a non-migrant counterpart.
This difference is not so apparent among the female l.None 0 18480.51 86.81 83.81 75. .3 1 79.9179.0186.4183.2 2.Tech.worker 5.4 2.6 4.0 4.2 3.0 3.6 5.4 2.3 3.6population.
,# 3.Tech. and
It is interesting that while no obvious trend in vocational
middlethe level of general education is observed among ,- education 6 3 5 2
2.91 3.01 3.01 . 1 . 1 5.714.114.114.1males migrants arriving in the City in different 1.3 0.9 1.1 1.3 0.8 1.0 1.5 1.6 1.54. College
period of time, the figures in Table 7 suggest tha~ 5. University 9.0 6.4 7.7 12.6 6.6 9.4 9.5 5.2 ,7.1
6. Postmore recent female migrant,s tend to have higher university 0.51 0.071 0.11 0.21 0.21 0.21 0.51 0.21 0.3
levels of general education than the previous 0.3 0.2 0,3 0.4 0.0 0.2 0.0 0.2 0.17. Unknown
migrants, though the differential is not great (only Total
0.5 years). Samples 2,7431 4761 534
Source: Sample survey of IER,1994Concerning !tertiary education, migrants are also
4140
i

- -
2.6. Present economic activity status
The survey reveals that the economic participation rate for both males and females is higher among the non-migrant than migrant population. It is because the proportion of persons still attending school is obviously higher in the latter than in the former population. Some migrant females are, on the other hand, in fact family servants but stated they were doing housework, which makes the portion in this category higher
than that of .the non-mi gran t population. Nevertheless, a common feature that can be observed from both the populations is a high percentage of workers, particularly females, running their own business, which was not seen a few years ago (table 9).
However, the vast majority of females, both migrants and non-migrants, are self-employed .It
is seen that a significant portion of non-migrant female employees still prefer to work in the statle-owned sector, while their male counterparts
appear to be more fleXible and many of them have shifted to the private sector . Thus, one fourth of the non-migrant male labor force is now working in private enterprises.
Table 9. Present activity status of the sampled male population aged 13 years and above by migratory
status
j ~,
Migratory status
~' Activity Non·migrants 1984 - 1989 After 1989
status M. F. Total M. F. Total M. F. Total
Active . t, pcpulaJial
Empl~'ed
by Gov't 15.7 22.4 18.7 29.2 26.0 27.6 22.1 16.6 19.3 Employed by private 25.1 14.4 20.1 23.3 13.8 18.8 32.5 25.6 28.9
Self· employed 28.4 36.3 32.1 26.1 40.5 32.5 19.6 36.5 28.4
Employer 1.7 0.1 1.3 1.1 1.3 1.2 0.0 0.3 0.2 Other category 23.2 22.5 22.9 16.6 12.8 14.8 18.6 17.7 17.9
Un· employed 5.9 3.8 4.9 3.7 5.6 4.5 7.1 3.7 5.3
Total 100.0 100.0 100.0 100.0 100.0 100.0 100.0 100.0 100.0
Number 714 626 1,340 356 308 664 280 301 581,. Inactive pcpu· boo
.;. Attending school 13.4 35.8 45.8 58.3 33.0 40.0 73.9 35.3 48.5
House. worker 1.5 43.8 28.3 0.0 39.1 28.0 1.8 41.9 28.2
Others 85.1 20.4 26.4 41.7 27.9 32.0 24.3 22.8 23.3
Total 100.0 100.0 100.0 100.0 100.0 100.0 100.0 100.0 100.0
Samples 201 349 550 120 230 350 111 215 326 -----'
Source: Sample survey offER, 1994
43 42

On the other hand, the increase in spon'taneous migration, as opposed to planned, in recent years also means a reduction in state employees among migrants. Spontaneous (sometimes called illegal) migrants are more likely to be absorbed by private enterprises in the first years of their stay in the City. When there is already a firm foothold on the city ground, many of them prefer to change their jobs or operate their own business, as seen in Table 9.
As for unemployment, it could hardly be said that migrants are more likely to be unemployed than their non-migrant counterparts. Male migrants with more years of stay in the City are even less likely to be unemployed than non-migrants. Moreover, a higher unemployment rate among the recent migrant males than females also implies that males probably change their occupation more often than females in the first years of stay in the City as the survey detects that males could find jobs in a shorter period of time than females after their arrival. Besides, male migrants are more likely to be attracted by private, enterprises while their female counterparts prefer to employ themselves in their as sales, or work as houseservants.
own hold
business sbch assistants or
44
CHAPTER III POPULATION AND MIGRATION
IN HO cm MINH CITY
3.1. POPULATION GROWTH IN HOCHIMINH
CITY
According to the Statistical office, based on a summation of a complete count of household members conducted by local authorities in 1994, the total population of HCMC came to 4,694,000 inhabitants. Time series data from 1989 to 1994 indicate that there has been a continuous rise in population since 1989. In table 10, the total population shown for 1989 comes from the popUlation census of that year, those for 1990 to 1993 are based on a 5 percent sample of the population, and that for 1994 is obtained from 11·
complete summation of a count of household members conducted by local authorities. The fact that the totals are from different sources may well
45

affect their comparability and, therefore, the an average annual growth rate of 4.75 percent
calculation of the annual growth rates. between 1989 and 1994. If that were the case, the net migration rate would have averaged about 3.15 During the period 1989-1994 a high popUlation percent a year. growth rate was recorded. The rate of natural
increase was 1.5 percent in 1989 and 1~90 and Furthermore, as HCMCs economy gradually
about 1.6 percent from 1991 to 1994. This natural develops, the number of visitors to HCMC, foreign
increase in population is consistent with other and domestic alike, has also increased
observations when the economy starts growing. It correspondingly.t·
will take a rather long time for the natural increase Table 10. Population growth during 1989-1994
in population to subside. While the rate of natural ,Ij': 1989 1990 1991 1992 1993 1994increase had yet to decline, this period witnessed
an increase in net migration to HCMC. Population (1000 inhabitants) 3,942 4,113 4,259 4,426 4,582 4,694 I
t The rate of net migration to HCMC may be Annual popUlation
growth rate (%) 5.77 4.34 3.55 3.92 3.52 2.44estimated by subtracting the recorded rate of Annual rate of natural increase from the population growth rate. natural increase(%) 1.53 1.52 1.61 1.61 1.58 1.57
Annual migration The estimates are shown in table 10; According rate (%) 4.24 2.82 1.94 2.31 1.94 0.87 -,to these estimates, the rate of net migration
Source: Statistical year book-Statistical office ofHCMC. declined from 4.2 percent in 1989 to 0.9 percent
in 1994. 3.2. MIGRATION RATE OF HOCIDMINH CITY
Because a high proportion of spontaneous and
temporary migrants are not registered in According to statistical data for 1994, HCMC households, the total population growth rates and occupied only 0.6 percent of total land and 6.4 migration rates are no doubt underestimated. Some percent of the population, but achieved 18.3 percent experts think that the 1994 population of the City of GDP, 29.3 pereent of total industrial production,
was at least 5.0 million. That figure would imply 27.3 percent of total retail sales and 54.2 percent
l
46 47

of export turnover of the country. The GDP per
capita was US$ 679, triple the average GDP for
the country. The monthly average income of a
laborer in HCMC was double the theoretical income
of a laborer in other localities.
According to the result of the sample survey in
1994, for the period 1990-1994, the migration rate
is double that in the period 1984-1989, Le., 1.2
percent compared to 0.7 percent respectively. Of
course, as the survey could cover only migrants
remaining in HCMC, the earlier figure would be
reduced by return migration to a greater extent
than the more current figure.
The migration rate varies from the period of
migration and urban and suburban areas. In particular, the migratioIl: rate during the period
1990-1994 clearly indicates that migrants were
more concentrated in the central than in the
suburban districts of the City. This situation will
change in the future, as population densities of
inner areas become very high, migrants will change
their direction to peripheral districts. However,
the inadequate infrastructure system there will be
one of the .factors deterring most migrants.
Therefare, investment for developing the
infrastructure system is one of the most important measures to which. tQe Government should pay priority attention for re-settlement in HCMC.
Table 11.. Migration rate during the period 1984-1994
Period Period
1984 ·1989 1990 ·1994 ,
Migration rate (%)
• Population census 89 0.7 · • Sample survey of IER, 1994 0.6 1.2
Of which .11 I. 1. Innerdistrici$ o{the City:
- PopUlation cenSus 89 0.7 · • Sample survey of IER, 1994 0.7 1.3
2. Peripheral districi$ ofthe City
• Populat~!>n census 89 0.6 · • Sample survey of IER, 1994 0.2 0.1
Source: • Sample survey of IER in 1994
. • Population census in 1989
The different migration percentages between the two sources of data in the peripheral districts,i~ can be.:explained by the fact that, as said before, many records of the local authorities were not accurate concerning the migration status of many individual in preselected households of the
." peripheral districts. Hence, more people among1:1".
..
48 491

migrants living in peripheral districts were omitted some specific fields such as property trading or than among migrants living in inner districts of business registration. The percentage of legal the City. migrants decreases from 67 percent in the period
1976-1980 to 27 percent in the period since 1991. 3.3. REGISTRATION STATUS OF MIGRANTS IN A large proportion of migrants without permission HOCHIMINH CITY or without registration are considered to be illegal
The complete count of household members in migrants. 1994 revealed that about 800,000 of the total TciJle 12. Percentage of migrants having population of HCMC were living there without permanent residential permits by year of
entering HCMCpermanent residential permits. Among these about 322,000 are migrants since 1976 and 478,000 are 1976-1980 1981-1985 1986-1990 Since 1991
non-migrants (or moved in prior. to 1976). The Fe- Fe- Fe- Fe-Total Total Total Total
male male male maleregistration status of migrants in the City can be Total ofseen from table 12. migrants 82,900 42,200 125,80( 64,900 178,90( 92,100 202,1O( 104,30(1
The data from table 12 show that among 2.Percent
migrants the proportion of those having permanent age of migrants
residential permits is higher than those not having having penna
permanent residential 'permits but this proportion nent residentends to decrease in recent years.. The profound tial permit 67.2 67.9 63.5 64.6 43..6 44.0 26.6 49.8economic reforms throughout the country has 3.Per·.fstimulated the operatiop of a free market and centage
encouraged production by the private sector. It has of migrants
facilitated the Citys rehabilitation and development, without penna·but it has also invalidated the effects of migration nent residenrestricting policies. The migrants no longer tial permitconsider these policies important because it does 32.8 32.1 36.5 35.4 56.4 56.0 73.4 50.2
Source: Complete count of household - Statistical office of HCMC, not influence their living in HCMC except for 1994.
50 51

Some reasons for the decrease are: temporary stay is three or six months and it will
1. At present, for those coming to HCMC, it be extended) is more difficult to obtain the permanent residential
Took 13: Dlstribution of respondents bypermit. registration'status and migratory status
2. Migrants who have stayed in the City for "-'
Migratory statuS Registrationmore years seem to have more advantages in
-
Non- Migrant 1984-1989 After 1989Status obtaining the permanent residential permit. Total Male Fern. Total Male Fern. Total Male Fern.
l.Obtained3. The number of spontaneous migrants in the a perma
later period tends to increase. Hence, some of them nent do not ask permission. residential
permit 81.4 81.5 S1.4 50.6 41.9 57.0 22.2 19.2 24.1 -2. Obtained3.3.1. Residential status of migrants aternporary residential
Residents of HCMC are classified into the permit 16.2 15.5 16.S 47.0 56.1 40.1 62.6 70.0 58.0
following categories: 3.Been ;registered
1. Those who have obtained permanent by local Government 1.7 3.0 0.6 1.7 1.3 1.9 14.9 10.0 17.9residential permit: Who have satisfied the 4. Not been conditions of decree No OB/CT-DB dated March
, re~tered 30th, 1989 in HCMC and were accepted to be by local
.. Government 0.7 - 1.3 O.S 0.7 1.0 0.3 0.8 legal residents. 5. otal 1-00.0 100.0 100.0 100.0 100.0 100.0 100.(] 100.0 100.0
2. Those who have obtained temporary residential 6. ~pIes 296 135 161 362 155 207 342 130 212
permit: Who have not satisfied conditions of the Spurce: Sample survey of IER, 1994 decree but have a permanent p!ace of residence
3\ Those who have been registered by localand permanent job, who are accepted to be
authorities (Sub.department of Police in eachtemporary long term residents (the length of
district): Newcomers who satisfy the conditions of 52
53

the decree or spontaneous migrants who do not satisfy them at all, but are temporarily living in the City for a short time. By City regulations, they have to declare themselves to local authorities.
4. Those who have not been registered by local authorities: Spontaneous migrants illegally living
in HCMC.
From table 13, the registration of migrants to HCMC since 1984 can be summarized as follows:
1. During 1984-1989, many people moved to HCMC. Most of them were assigned by the Government to supply specialized managers and officers after the liberation in 1975, and a little over half of migrants are permanent city residents. However, the trend of spontaneous migrants moving to HCMC without permission of the City Personnel Department resulted in a high percentage of temporary long-term migrants , i.e. 47 percept.
I
Because the policy reform at that time was not
clear, the propo~tion of spontaneous migrants 'Yho were or were not registered and declared offici~ly
)was low, only 2.5 percent.
2. The reform" of the economy has given
opportunities for people to migrate to HCMC. As
a result, among migrants coming to the City since
1989, only 22 percent are permanent residents,
lower than those among migrants coming in the preceding period. The number of migrants with
temporary permits increased to 62.6 % in recent
years. They do not have enough certification for a legal migration (Le., having a residential book
just after arrival in the City). Over two thirds of the migrants coming in the last 5 years could be
considered as illegal migrants. However, they have a place of residence and a permanent job, and were accepted t~ be long-term temporary residents in the City. ~here is another 15 percent of migrants since 1989 who are not registered at all.
3. A majority of non-migrants have permanent residential books, and another 16 percent of
non-migrants have long - term temporary stays. Non-migrants who are living in the City without
permission account for the same percentage as those non-registered among migrants, that is, around 2.5
%. The data suggest t:Qat under the City regulations at the present time, pef;lple who are living in HCMC
can move from one district to another district to
live with their relatives (parents or siblings)
without changing the previous place of residence
and permanent residen~ial book. Therefore they are non-migrants without a ,permanent residential book
"'
54 55

" ,
at the selected place where the survey was conducted.
The situation can be explained by the Decree OB/CT-VB dated March 30th 1989. According to this decree, spontaneous migrants who have a permanent place of residence and job will be permitted to stay in HCMC with a· temporary residential permit.
Looking at the condition for migran:ts to have long-term temporary residence we c~n see the following : .
First : According to Decrees No. 60/CP and No. 61/CP dated July 5th, 1994 by the Central Government, people without permanent residential permits in HCMC can buy a houSe in the City. Moreover, a majority of in-migrants h$ve relatives through secondary migration to HCMC. Thus, the condition of residence will be more easily satisfied than before.
Second : A number of investment programs, local businesses and jOint-venture enterprises with
their foreign partners demand a large number of local workers. The private economic sector can supply a large number of jobs to laborers in the City.
The implementation of the new circular for illegal migrants causes migration flows to HCMC from provinces through out' the country. Officially, people who have a permanent residential book are legal residents· of HCMC. Migrants coming to ..
,. HCMC since 1989 who have obtained or extended r
a temporary permit should be seen as illegal residents. However, they participate in the Citys
I,,~ economic activities and do not cause any se:curity /I'
'v,'\ problem in society.~ ',,;,
~; Table 14: Annual averag6 number of migrants'i': being issued permanent residential permit in
HCMC.
Number of migrants being issued Period of time permanent residential permit
1984-1989 18,700 1990-1994 22,434
#
Source; Police department of HCMC
The number of migrants being issued permanent residential permits by the Police Department in
the period 1984-1989 was less than in the following
period. This can be explained by the fact that
since 1975 many families in HCMC were mobilized
to new economics zone, or back to their homeland.
Because of inadequate policies, more than 70
t"
57 56
/
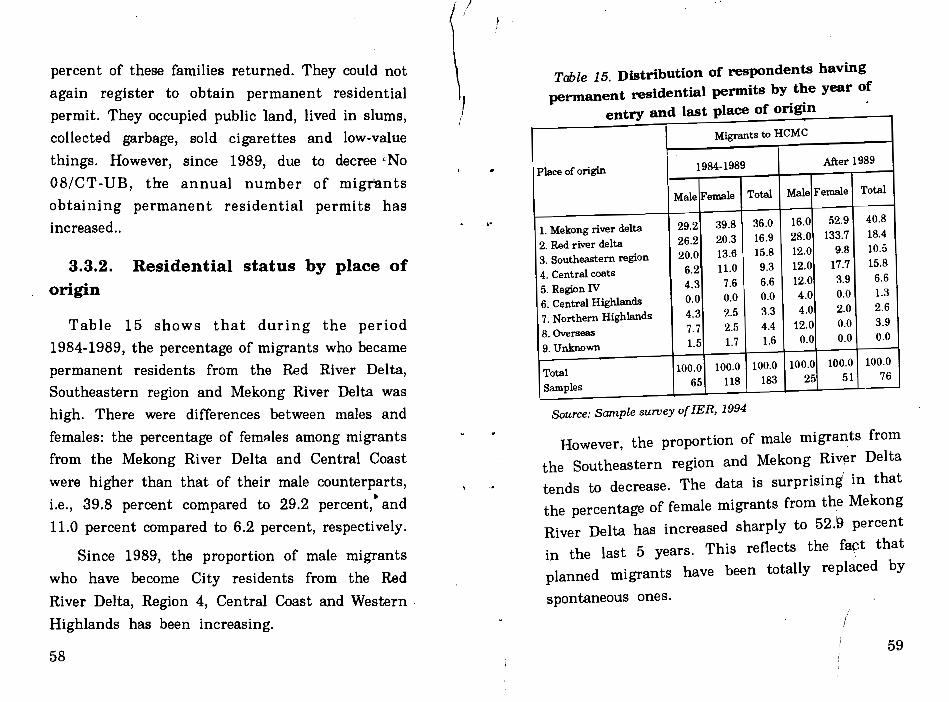
percent of these families returned. They could not Table 15. Distribution of respondents having
again register to obtain permanent residential permanent residential permits by the year of
permit. They occupied public land, lived in slums, ! entry and last place of origin
collected garbage, sold cigarettes and low-value Migrants to HCMC
things. However, since 1989, due to decree "No After 1989• Place of origin 1984·1989
08/CT-UB, the annual number of migrants Total
obtaining permanent residential permits has Male Female Total Male Female
increased.. .' 1. Mekong river delta 16.0 52.9 40.829.2 39.8 36.0
2. Red river delta 26.2 20.3 16.9 28.0 133.7 18.4
9.8 10.53. Southeastern region 20.0 13.6 15.8 12.03.3.2. Residential status by place of
6.2 11.0 9.3 12.0 17.7 15.84. Central coats
origin 5. Region IV 4.3 7.6 6.6 12.0 3.9 6.6
0.0 1.36. Central Highlands 0.0 0.0 0.0 4.0
15 shows that during the period 7. Northern Highlands 4.3 2.5 3.3 4.0 2.0 2.6Table 4.4 12.0 0.0 3.9
8. Overseas 7.7 2.5
1984-1989, the percentage of migrants who became 9. Unknown 1.5 1.7 1.6 0.0 0.0 0.0
permanent residents from the Red River Delta, Total 100.0 100.0 100.0 100.0 100.0 100.0
Southeastern region and Mekong River Delta was Samples 65 118 183 25 51 76
high. There were differences between males and Source: Sample survey ofIER, 1994
females: the percentage of females among migrants However, the proportion of male migrants from
from the Mekong River Delta and Central Coast the Southeastern region and Mekong Riv~r Delta
were higher than that of their male counterparts, tends to decrease. The data is surprising in that
i.e., 39.8 percent compared to 29.2 percent, to and the percentage of female migrants from th~ Mekong
11.0 percent compared to 6.2 percent, respectively. River Delta has increased sharply to 52.9 percent
Since 1989, the proportion of male migrants '.in the last 5 years. This reflects the fact that
who have become City residents from the Red planned migrants have been totally replaced by
River Delta, Region 4, Central Coast and Western spontaneous ones.
Highlands has been increasing.
58 59

i.
This can be explained by the shorter-distance to Table 16. Distribution of migrants having HCMC from these regions.
temporary residential permits by the year of entry and place of origin
3.3.3. Residential status and job of the Migrants to HCMC
migrants Place of origin 1984·1989 After 1989
Table 17. Distributions of migrants havingMale F~male Total Male Female Total permanent residential permits by main
1. Mekong river delta 35.6 48.2 41.8 33.0 43.9 39.3 occupation and the year of entry. 2. Red river delta 20.7 8.4 14.7 14.3 16.3 15.4 3. Central coast 1 4.9 20.5 17.6 19.8 11.4 15.0
Migrants to HCMC 4. South_tern region 12.6 14.5 13.5 15.4 15.5 15.4
I5. Region IV 6.9 4.8 5.9 15.4 5.7 9.8 Main occupation 1984·1989 After 1989
6. Western Highlands 3.5 1.2 2.4 2.2 3.3 2.8 7. Northern Highlands 2.3 1.2 1.8 0.0 3.3 1.9
Male li'emale Total Male Female Total8. Overseas 3.5 1.2 2.4 0.0 0.8 0.5 9. Unknown 0.0 0.0 0.0 0.0 0.0 0.0 I. Agriculture 6.3 2.7 3.3 6.3 8.7 7.7 Total 100.0 100.0 100.0 100.0 100.0 100.0 2. Manufacturing and Samples 87 83 170 91 123 214 construction 23.5 13.7 17.5 12.5 21.7 17.4
3. Transport., post Source: Sample suroey of IER, 1994 and communication 8.5 0.0 3.3 12.5 0.0 5.1
4. Trade and Sales 15.0 34.3 26.6 0.0 30.5 18.0 5. Hotellrestaurant 0.0 0.0 0.0 0.0 0.0 0.0The ,data clearly show that the number of male 6. Services 6.4 16.4 12.6 6.3 8.8 7.71illegal rJiligrants coming from Region IV, the Central 7. Profess. & related 21.3 20.6 21.0 25.0 21.7 23.0
Coast a~d South-eastern region increased during 8. Administrative,
the pasr ten· years (table 16). This reflects the clerical and related 8.5 2.7 5.0 6.3 0.0 2.6 . 9. Family servant 0.0 5.5 3.3 18.8 8.6 12.8fact that \ more people from the provinces of Region 10. Other 10.5 6.8 7.4 12.3 0.0 5.7IV and the Central Coast, which are the poorest
, in the /country are coming to the City for economic Total 100.0 100.0 100.0 100.0 100.0 100.0
reasons. On the other hand, the percentages of Samples 47 73 120 16 23 39
illegal migrants who came from the Mekong River Source: Samplll suroey ofIER, 1994 Delta alld South-eastern region were the highest.
6160

f
Table 18: Distribution of migrants having 1. Most male permanent residents among temporary residential permits by main migrants coming to HCMC during 1984-1989 have
occupation and the year of entry. jobs such as professional and related, construction and transportation, while a large proportion ofMigrants to HCMC
female migrants work in sales, manufacturing, food Main occupation 1984-1989 After 1989 \.
and beverage, personal and family services. Male remale Total Male Female Total j 2. The proportion of permanent residents among
1. Agriculture 2.8 2.0 2.3 3.2 . 1.5 migrants coming after 1989 who work in families 2. Manufacturing and personal services has been increasing both for snd construction 39.4 32.7 33.0 45.5 31.4 37.8 males and females. 3. Transport., post
snd communication 8.5 · 4.6 6.5 1.4 3.8
4. Trade and Sales 19.8 47.0 35.5 12.8 25.7 19.7
5. Hotel/restaurant 2.8 · 1.5 3.2 1.4 2.3
6. Services 8.4 8.2 8.3 14.5 8.6 11.4
7. Profess. &. related 5.6 2.0 3.8 4.8 8.6 6.8
8. Administrative,
clerical snd related 4.1 · 2.0 . 2.9 1.5
9. Family servant 2.8 4.l 3.0 1.6 14.1 9.8
10. Other 5.8 4.0 6.0 8.1 2.9 5.3
Total 100.0 100.0 100.0 100.0 100.0 100.0
Samples 71 62 133 62 70 132 -_... -
Source: Sample 8uroey ofIER, 1994
Observing the occupations of migrants in relation with their residential registration status yields the followings:
62 63

CHAPTER N MIGRATION HISTORIES
As described in the first section of this report,
800 individuals were predefined as migrants, that is, those coming to HCMC after April 1st, 1984, and then administered the migration questionnaire. Examination of the questionnaire then detected that 7 of them actually arrived in the City before April 1st, 1984 and 89 were in fact intra-city migrants that should not be conSidered as migrants by the definition used. Thus, information on the migration history of the individuals was valid for only 704 respondents. They form the population
for the analysis in this chapter.
4.1. LAST PLACE OF RESIDENCE
It can be clearly seen from table 19 that there
is a predominance of migrants from rural areas
in migration flows to HCMC during the last 10
,
years. This reflects well the fact that most of the country's population still live in rural areas where employment opportunities are few and agricultural
I laborers are abundant. In addition, the labor surplus eventually increases when there are improvements
io in agricultural productivity as results of economic reforms and mechanization of agriculture.
Table 19: Distribution of respondent migrants by last place of residence and period
of their arrival in HCMC
Last place of Arrival ooriod I
resident 1984-1989 After 1989
Male Female Total Male Female Total •
Urban 40,0 39. 1 39.5 44.6 36.8 39.8
Rural 60,0 60.9 60.5 55.4 63.2 60.2
Total 100.0 100.0 100.0 100.0 100.0 100.0
~amples 155 207 362 130 212 342 -_........ ~- --~- -- --~
When males and females are examined separately 'by the period of their arrival in the City, it is found that more women are coming from rural areas in the last 5 years than in the preceding 5
years. The proportion of rural women among woman migrants increases from 60.9 percent in the period
1984-1989 to 63.2 percent in the following period
(table 19). In contrast, fewer men were migrating
65 64

to the City from rural areas since 1989. The
proportion of rural male migrants went down from
60 percent in the previous period to 55.4 percent
in those years. This should imply that increasing
mechanization and modernization of agriculture
would primarily release female laborers from field
work. More males are attached to the land because
they are usually the main laborers in the households
and are candidates to inherit parent's land and
other properties. Many men are also likely to find
jobs in industries other than agriculture, such as
agricultural production services, sales of food
products etc., which tend to increase, though still
slowly, in rural areas.
4.2. MARITAL STATUS OF MIGRANTS AT THE
TIME OF MOVE 1'0 HCMC
56 percent of the migrants arriving in HCMC
during the last five years were still single at the
time of .their move (table 20). Though people
nowadays tend to marry later than five or ten
years ago, this proportion is higher than that of
the non-migrant population, Le., 56 compared to
52 percent. In. particular, a distinctly higher
percentage of males than females were single when
66
moving to the city. 'This is because women in , .
rural areas usually get married earlier than men do. As will be seen later, many of the women were
married b&fore· their move and are coming to the
City to piA .their spouse or children.
HoweVer, it can be said that the singles tend
to domi~at& in migration flows more in recent
years, 'as planned migration has been totally
replaced by, spontaneous. This is shown in Table
20.
'Table 20: Distribution of migrant respondents .' aged 13 years and.above at the time of move by
marital .adUfil at. move and period of arrival
Marital .,
Arrival period
status 1984-1989 After 1989
Male Female ' Total Male Female Total
Single 60,2 42.2 51.1 68.0 53.S 56.3
Married 36,8 49.0 42.9 30,5 39.5 39,5
Widowed 0.8 . 5.7 3.3 0.0 3.3 1.7
Divorced!
separated 2.3 3.1 2.7 1.63 .3 2.5
Total 100.0 100.0 100.0 100.0 100.0 100.0
Samples 8133 192 325 128 210 338 _L
67

4.3. LEVEL OF EDUCATION OF MIGRANTS AT
THE TIME OF MOVE
According to the survey, the migrants had on
average 8.3 years of general education before moving
to HCMC, which is distinctly higher than that of
the average rural resident in particular and the
average citizen of the country in general. This
clearly suggests that migrants are among the best
educated inhabitants in both rural and urban areas.
And, as is true everywhere in the country, men
have more years of schooling than women.
However, as is also true for the whole population,
urban or rural y most of the migrants have no education other than the general level (Le., from
grade 1 to grade 12). It is also observed that the
proportion of those with no tertiary
education/training among migrant population tends
to be on the increase in recent years.
4.4. ACTIVITY STATUS OF MIGRANTS BEFORE
MIGRATION
It is worth noting that no precise concept or
definition of employment/unemployment was given
in the survey because of the relatively low level
, pf education of the population, and the complexity
of the subject. Therefore, the economic activity
status of a respondent is largely dependent on
his/her subjective perception of the matter,
especially for unemployment or underemployment,
even though the question about activity status was
broken down into 14 different status. 0' As stated by migrant respondents, 64 percent
had been employed before they moved to HCMC during the last 10 years. A large proportion of them had been self-employed in agriculture or worked for their own family. About one third of the workers were employed in state organizations, institutions or ragencies.
Quite a few bf the migrants had been employed by private firms, permanently or temporarily, before they moved away from their home. The private sector in rural areas is in fact still rather weak and so far employs a limited number of laborers. Workers in the private sector are, however, paid
more than those in other sectors. Hence, fewer of them would feel the need to migrate.
It could be ~aid that it is not common for anyone, especiaUy a peasant, to declare himself
unemployed, whatever economic status he is in.
The "phenomenon" of unemployment began to be
68 69

noted (or recognized) and discussed only recently, during the period of economic reforms. H\!nce, fewer people would have stated unemployed than is really the case. Thus about seven percent of the economically active migrant respondents declared they had been unemployed before migrating to the City. The same percentage were casual or daily workers.
.. A significant proportion of migrantlS, especially
those arriving before 1989, were young, dependent children accompanying their parents or other adult siblings. They were still attending aehool before their move.
The increase in migrants from rural areas is reflected in changes in the economic activity status of migrants over the last 10 years. More persons engaged in farming activities (~elf.employed or unpaid family workers), especially females, were migrating in the period after 1989 than in the previous five years. On the other hand, the replacement by spontaneous migr~ts of planned migrants also resulted in a significant reduction of the number of both state employees and economically inactive persons among the migrants. However, the proportion of those attending school just before their increase in recent years.
who move
had been tends to
70
r--- .
4.5. NUMBER OF MOVES
The sample survey recorded the first and the last moves of migrants and the total number of moves. The data show that the average number of moves was 1.48 for males and 1.39 for females. Ninety-two percent of migrants had made 1 or 2 moves. Among males, 73.4 percent moved once and
,. 25.6 percent moved twice. Among females, 65.2 percent moved once and 19 percent moved twice. Migrants who had moved three times accoun~d for 6.3 and 3.5 percent of males and females, respectively. Instances of more than three moves
are very rare.
Table 21: Distribution of respondent migranU! by numbe!r of moves
TbtalNumber of moves
1 fii9,94 21,76
3 14,56 302
2 I
4 I ,5 0,13
0,50 100,00
6
Total Average number, of
\ 1,43moves I
I
Male Female
73,42 65,18
25,60 18,95
6,25 3,49
. 2,38 3,49" 0,22
0,60 0,44
100,00 100,00
!
I 1,48 1,39
Source : Sample ~uruey of [ER, 1994
71

\
4.6. REASONS FOR MIGRATION
The figures in Table 22 show that the majority
of female migrants to HCMC moved for
non-economic reasons, while a large share of their
male counterparts migrated because of economic
motivations. Nearly 45 pergent of women migrated
to the City along with or to join their spouse or
children who had migrated there some time before,
or to join their husband after marriage. It is worth
noting that after getting married with City
partners, non-resident women are eligible for
obtaining a permanent residential permit and
becoming legitimate city residents. Therefore,
getting married, either be~re or after migration,
is a good way for many wo(men to leg~lly get into
the City. From the side of economic factors, 43.5
percent of men migrated to HCMC for employment
and/or income reason~. However, thi~ figure may
not reflect the reality as many seasonal or
unsuccessful migrants would have left the 'City i
soon after their arrivfl or were not captured in a
household survey like" this.
Table 22. Distribution of migrant respondents by reasons of their migration and sex
Reason of migration Male Female Total
Non-economic factors 44.2 64.4 56.3
Familial 24.6 44.6 36.5
Marital 3.5 9.3 7.0
Educational 15.8 10.5 12.6 .,.J~.
J
Ethnic, religious 0.4 0.0 0.1
Economic Factors 53.4 31.8 40.0
Living conditions 10.2 7.2 8.4
Employment and income 43.5 23.7- 31.7
Others 2.1 4.8 3.7
Total 100.0 100.0 100.0 ",,'.
f , Samples 285 419 704
le
\" It can be seen from Table 23 that the highest
proportions O~I persons moving because of economic reasons come from the central provinces of Region
" IV, Central Coast and Western Highlands, the poorest regions in the country, whereas the highest
proportions of those migrating for family reasons are observed among the short-distance migrants,
t~at is, those from the Southeast Region and
Mekong Delta. It can also be observed that the proportion of those moving for family reasons is
/ especially high among migrants from the provinces
of the Red River Delta. Many of them were probably
73 j
~
72

migrating to the City to join stlite employees thatNu":)~C:C~"""~ r.- ..... 0...,.'3 ~<.O~~oo<Xi ...... f'I'i dO were transferred by the Government~ '" .... ...,. '" ....er.- after 1975.!
6 The highest percentage of people migrating for'9 000000 0 oc c...,.
d~~Qo~o' ·~1Ii employment and better income is seen among those1IlC<!C<! C<! C<!Nr.. ~ 8......... ,.. ., . coming from Region IV, where natural disasters~.... ... Oot:)MMOO oc C<C happen most
r.. 6 I ~g~<.O<.O~o ~d g .... frequently and .poor harvest areC<! ....c2 common. ji- 'IlOO<C .... OC<!C<! 0111 00 ,.§Q) ~~
g~<Xi~olXilXi o~ AnalysiS of 'migrants by period of arrival showsM .... M M g~~ ~~ ....
~ a significant change in motivations for migrationI~ ....! CM<C ..... C .... "l' <') .....0 I>.l.~ oot:)~ e gcvi<XiIXiQcvi....j ...... ~rI}~ M .... g~ among females.
.c'1S l!l M"1 C<! ...III
, d 'i...
1Il .... I.'-or.-00,>00 ......... CM
Table 24 shows that most of the women coming§ ! :8,..-i ~ oQcvi~~ocvio cvir..: g ..... to the City between 1984 and 1989 were....j
~$fr:'; .... C<! ot:)M'g-s, 0 C<! .... Cl .... d non-economic migrants. Fifty-six percent of them.~ ~i NM<CMO<CCO 00 .... CC<!~ ~ ~ d 0 ~Id migrated because of family reasons and only 25",;....jcvi~o~CI'if :: 8° ...8:::""'C'I':l P"""t "If M
.... Cl § I
percent were motivated by economic reasons. Thee'\"l'C<!MOOO'&!~ ~oe>i~o....jC'i \~ :l 0<') dI; proportion of women migrating for employment
~ ~ ............ to ...,. g"l' ~'s&·ae .... f:lnd income significantly increased in the next,
"Cl"'~ QoOMot:)OO<,)"'" I ot:) .... c .... ....&f period, from 18.3 percent to 28.7 percent, while'1S'g ~ .~ 0.1 ~~C'io.t:io~r:-: ~..; g;::!~A M ~Cl =s .... tb~ proportion ofCl ~
those moving for non-economic.. j,f!.a~ ~~~~~t--:~ r.- .... c...,. ::i
t re~,sons went down from 72 to 57 percent..c ~ Jj." j /j:;0 Ol.'-oOot:) ° ~r..: 0)
(0
-= ... ::r: ot:) M M'c g-;.... ~ 'the proportions. of males migrating because of~
Cl .s,..
d ~ ~ ~ diffe\ent motivations remained almost unchanged... l:J ~.9 ~ I:IJ
01 .9 § -'~t1!:B" over )the two periods. The proportion of those~ ~;!:l ~ ~ I:: <\)
!il~1
." i ~_'~~'ii!8~Q) ~ moving because of employment and income rose~ ~ e ~ ~. ~ ~] <:I ~.2 e l!! 1l 5. 'r~ d ~8" Cf.) by only two percent after 1989. Fewer men~ ~ ] r.. ~ ~ ~ ~ ] r9 .S 6 lii-orl} migra~ed for family reasons after 1989 but more
74 75

4.7.PRIOR INFORMATION ON HOCHIMINH CITY men were coming to the City to improve their
Before deciding to move to HCMC, over halfeducational and/or skill level. This change is even of the migrants had information about job/work more conspicuous among female migrants. The opportunities and 63.5 percent had informationproportion of females migrating to improve their relating to living conditions there. education and skills went up by almost four times
in the last 5 years, as compared to the preceding Among the migrants coming to HCMC from period. urban and rural areas, 58.75 and 56.36 percent
respectively, had information about job/workTable 24. Distribution of migrant respondents by
opportunities. In addition, 67.3 percent of migrants'main reasons for migration and period of arrival
from urban areas and 61.20 percent from rural Period of arrival areas had information about living conditions in
HCMC. _It may be concluded that most migrantsReasons for Male Female
I. had prior information about the city before deciding migration to move to it.84-89 After 84-89 After
1989 1989 Table 25: Distribution of respondents having/not Non-economic having infonnation prior to the move to HCMC factors 44.6 43.9 71.9 57.2 Having information Not having infOrmation Familial 29.7 18.5 56.0 33.5
Fe- Ur- Fe- Ur- Ru-Marital 3.9 3.1 11.1 7.6 ) Male Ru- Male
male ban ral male ban ralEducational 10.3 22.3 4.8 16.Q \
1. InformaEthnic/religious 0.7 0.0 0.0 O.~ " tion on job!Economic factors 54.1 53.1 24.6 36·1 " 67.75 49.35 58.75 56.36 32.25 50.65 41.25 43.64work oppor-
Living conditions 11.6 8.5 6.3 8.0 ) tunities
Employment & 2. Inforincome 42.5 44.6 18.3 717 mationOthers 1.3 3.0 3.5 i 6.1 relating to 69.53 59.09 67.33 61.21 30.47 40.91 32.67 38.79
livingTotal 100.0 100.0 100.0 100,0 conditionsSample 155 130 207 21[2
Source: Sample suroey of IER. 1994
7776

4.8. SECONDARY MIGRATION·
4.8.1. Number of accompanying persons
The average number of persons accompanying the respondent migrants was 1.38 (1.33 for males and 1.42 for females), The number of persons accompanying female migrants is greater than those accompanying males because children more often move with their mother than their father.
Migrants from rural areas had more persons accompanying them than those from urban areas (1.43 for respondents from rural areas and 1.29 for respondents from urban areas). Migrants moving in the period 1984-1989 were accompanied by an average of 1.54 persons, nearly triple that of those moving after 1989. This is because migrants to the city after 1989 mostly moved for economic reasons. Because of having to cope with many initial difficulties in accommodation, income, etc. , many migrants moved alone.
Table 26: Average number of persons accompanying and following respondent migrants by sex and place
_... _.............. ,.
By sex By place of origin-.-=--Male Female Urban Rural
1. Accompanying 2. Following persons
1,33 0,48
--
1,41 0,33
-
1,29 0,38 J;J0,40
Source: Sample suroey of [ER, 1994
4.8.2. Number of persons following
respondent migrants
It is also seen from table 26 that the number
of persons following the respondent migrants is
less than the number accompanying them. For Ci!.
male respondents, there were 1.3 persons
accompanying and 0.48 person following. For Jf females, the number of persons following the,?\
migrants was only 0.33. The average number of
persons following the migrant was 0.4. This
average does not vary according to the place of
origin (urban/rural areas).
The respondents moving before 1984 had a
lower number of persons following (0.14) than
those migrating later. This can be explained because
the earlier migrants were mobilized by the ~. Government and they moved to HCMC with their
families, with the result that the number of
persons following the respondent is very small.
Fo·r respondents moving in the peFiod
t 1984-1989, the average number is 0.45 person.
For those moving after 1989, the average number
is 0.32 person. The survey recorde.d that about 18
percent of the respondents had followed a primary
migrant as spouses, children, parents, sibling, etc.;
78 79

22 percent of the respondents coming between
1984 and 1989 followed a primary migrant. However, only about 15 percent of respondents
coming after 1989 have followed a primary
migrant.
The persons following respondent migrants are
usually relatives of the respondent such as parents (18.1 percent ), spouse (9 percent) and children
(18.8 percent). The highest proportion of persons following were siblings (55.6 percent). This
may be because the
living in HCMC for advantageous living provide information
respondent migrants, after
a long time, recognize the conditions of the City and to their siblings who then
decide to also move to HCMC.
. l'
80
CHAPTER V HUMAN RESOURCES AND
EMPLOYMENT
5.1. HUMAN RESOURCES
5.1.1. Labor force
Annual statistic:s show that during 1990-1994,
the proportion of population in working ages
(females of the ages 16 to 55, males 16 to 60)
was 55 percent of the annual average population,
in which the proportion of people capable of
working (according to the standard in VN) was
95-96 percent. Another proportion of people out of
the working a~ category, but capable of working
contributes to enrich the Citys labor force.
However, this also puts pressure on job creation
in the City. I
81

-----
Table 27: Labor force in Ho chi Minh City
Unit: 1,000 inhabitants
1990 1991 1992 1993 1994
1. Total population 4113 4259 4426 4582 4694
2.Total of working aged population
2069 2248 2450 2503 2715
3.Annual increasing 159 179 152 103 212
4:Growth rate of working aged 8.00 8.30 8.60 2.14 8.30 population
Source: Statistical year book , Statistical office of HCMC
The laQor force in working age increased by 646,.000 during 1990 - 1994, on average 161,500 persons per year. The annual labor growth rate was 6.79 percent.
The structure of the labor force' from 1989 to 1994 changed with respect to an increased in the percentage of people employed and a reduction of people unemployed. However, the proportion of people attending school and housewives increased
from 19.8 percent in 1989 to 23.7 percent in 1994.
It can be said that it is difficult for women to
82
find work in the present situation of surplus labor . The percentage of unemployed would be higher than 11 percent if· we took into account the number of housewives who would be willing to
work.
Table 28: Activity status.of persons of labor force age of HCMC
Activity status 1989 1990 1991 1992 .1993 1994
Labor force age in total 100.0 100.0 100.0 100.0 100.0 100.0
Of which :
1. Employed 64.9 68.9 71.9 68.5 68.8 65.2
2. Unemployed
3. Attending School &
housewives 15.3 ·19.6 18.9 19.0 20.1 23.7
4. Employed population
( 1000person) 1,240 1,426 1,616 1,678 1,722 1,770
5. Growth rate (%) . 13.9 12.5 3.8 2.6 2.8
Source: • Population census 1989
- Statistical year book, Statistical office of HCMC
Despite of the rapid growth of the economy and
job prospects, unemployment in the city has not declined much because both planned and spontaneous migration to HCMC has been high in
recent years.
Until December 1994, nearly 1.3 million laborers
83

--
were employed in the non-government economic
sector, Le. 76.1 percent of total laborers working in the City. About 373,000 people were working for the government, that is nearly 22 percent of
all working laborers (table 29).
Table 29: Laborers working in HCMC
Unit: 1,000 persons
1990 1991 1992 1993 1994 ~~-f~
Total % Total % Total % Total % Total %
Working 1,437 68.9 1,600 71.9 1,638 68.5 1,668 68.8 1,698 65.2
laborers ~~~
By: . - 346 21.1 362 21.7 373 21.9
1.State sector
2.Non- - - - - 1,276 77.9 1,278 76.6 1,292 76.1
state
sector
3.Joint - - - - 16 10 29 1.7 34 2.0
jventure, Foreign
ICQmpany I
By: 225 15.7 253 15.8 241 14.7 243 14.6 248 14.6 l.Sector I
2.Sec- 5693 9.6 621 38.8 666 40.6 669 40.1 675 39.7
'tor II
2.Sec· 643 44.7 726 45.4 731 44.7 756 45.3 775 45.7
tor III - --~~ ~~.
Source: Statistical year book, Statistical office of HCMC
84
There are 775,000 persons or 45.7 percent of laborers working in sector III (services); 675,000 persons or' 39.7 percent working in sector II
(industry and construction) and 248,000 persons
or 14.6 percent working in sector I (agriculture and mineral exploitation).
According to the population census of 1989, about 327,000 in HCMC have a tertiary level of
education. Thus, of the 327,000 professional workers, about 29 percent graduated from colleges, universities and post-graduate studies; 26 percent
graduated from technical, vocational or middle education and 45 percent are technical workers.
Table 30: Distribution of professional workers by level of tertiary education
Tertiary education Number
of la borers
Percentage
(%)
1. Colle~, university,
post graduate level
2. Technical vocational
94,640 29.0
middle education
3. Technical workers I
85,484
146,679
26.1
44.9
4. Total 326,803 100.0
Source: Population Census in 1989
85

\
5.1.2. Labor supply
During 1990-1994, the annual growth rate of
the working age population was 6.8 percent while
the growth rate of the employed population was
only 5.4 percent. It is clear that the supply of
workers is higher than the demand.
Since 1990, under the impact of the market
economy, the training system is no longer a
governments monopoly. Many private training
centers have been established and have partly
improved the quality of work. In HCMC, there
are presently 10 government training centers and
another 221 private ones. However, concerning the
quality in accordance with the time and training
process as well as the facilities and utilities for
training programs, the state training colleges are
the best whereas the private ones have not met
the training requirement of 3 to 6 months training
courses. This has limited the training quality.
Furthermore, the training offered does not meet
the demand of the labor market, so that graduates
have difficulty to find relevant jobs. According
to the district reports in 1993, about 57,000
technical and speCialized trainees, as well as 6,480
students from short-term training colleges and
8,100 students from colleges and universitfes have
no work.
The following are findings concerning the labor
force and employment situation in HCMC:
1. Labor supply is surplus to the demand.
2. The growth of the City's economic
development is much higher than labor growth.
However, the quality of working laborers has not
met the demand of economic industries. As a result,
a large proportion of non-skilled laborers (in
particular migrants) work in the informal sector
or are recruited to do casual work (sometimes called
under-employed). This also causes social problems
such as increased criminality, social insecurity and
prostitution. I
3. The development of the market economy has
exacerbated the differences in income of the
different economic sectors. The income gap causes
severe labor competition in the market. S kill ful
laborers move from state to private and foreign
joint-ventures, particularly in construction,
mechanics and transportation. The gap in labor
costs and cost of living in different areas is also
a caUS£! of labor transferring from one economic
86 87

sector to another, and particularly from the provinces to HCMC.
4. The training system is not compatible with the particular requirements of production, leading to the imbalance in labor recruitment and arrangement. The quality and quantity of trainees do not yet meet the demand of many production sectors, particularly where professionals are needed.
5. According to the Statistical Office, the percentage of laborers working· in agriculture is still high, more than 15 percent, which provides only 3 percent of the City's GDP and has declined in the past years. This shows that labor growth in agriculture is not the consequence of the demand, but of the surplus of laborers who are not fully employed, especially in the suburbs of the city. This leads to the conclusion that in agriculture
and in suburban areas, the seasonal work is quite high.
5.1.3. Investment per worker
Investment per worker is defined as the required capital, including fixed and floating capital, for. creating one job. However, data for determining this figure are difficult to obtain, so in this· part
the investment per worker is mentioned in some
areas only.
5.1.3.1. State economic sector:'
According to data from the taxation agency,
total fixed and floating capital in the state economic t · sector is VND 33,210 billions for 1,801 million
(. laborers. So the average allowance per laborer is
18,440 million VND, in which fixed capital is
13,625 million VND. )~
~... ~;!;i In the state economic sector 11,c
average investment per worker is fi .. ;"; VND, in which fixed capital is
~ VND.
in HCMC, the
19,304 million
14,312 million
5.1.3.2. Non - state economic sector
According to the reports of responsible agencies,
the registered capital is 996 billion VND, and
there are about 58,000 workers. So the average
investment per worker is 17,172,413 VND. These
are only general data showing that to create one
job, the minimum investment is 17 million VND.
The capital estimated by the Statistical Office is
lower than for some particular levels. Therefore,
the increasing number of people, of working age
will lead to a large need for capital for job creation
l·
88 89

---
in HCMC. This is a difficult problem for the local unchanged over the past 10 years. Thus, the authorities of HCMC. proportion cJf male migrants looking for jobs
immediately after their arrival in the city decreased
5.2. ADAPTATION OF MIGRANTS TO THE from 64 percent in the period 1984-1989 to 58
LABOR MARKET OF HOCHIMINH CITY percent in the period after 1989.
Table 31: Distribution of migrants by period of5.2.1. Job seeking status after arrival of arrival and job seeking status after arrival
migrants ,. Period of arrival
It is clear that not all migrants are coming to Female HCMC for economic purposes and some of them, 1984· After Total
Male
Job seeldng status 1984· After Total
in particular students and older people, would not 1989 1989 1989 1989
look for employment after their arrival. We can 52.8 49.2Seeking job 63.9 58.5 61.4 45.4
see in Table 26 that only 54 percent of male 50.847.236.1 41.5 38.6 54.6
migrants in the period 1984-1989 have moved for 100.0 100.0 100.0 Not .seeking
100.0 100.0 100.0
employment and income reasons. That proportion 155 130 285 207 212 I 419 Total
Sample
is 12 percentage points higher than among female Source : Sample suroey of [ER, 1994. migrants, which is consistent with the fact that
more women migrated for non-economic reasons. It is true that more migrants from rural areas However, as the proportion of females migrating were migrating because of economic factors than
for economic purposes tends to be on the increase, .. those from urban areas. This is reflected by a the portion of those seeking employment after their higher proportion of individuals looking for arrival has also gone up in recent years ( table employment right after their arrival among 31). In contrast, more men than women tend to migrants departing from rural areas than of their migrate to the City for improving their education counterparts from urban ar~as, Le., 65.5 percent or skill level, while the percentage of those coming compared to 55.8 percent. This difference is, because of economic motivations remains almost however, not seen among female migrants, although
90 91
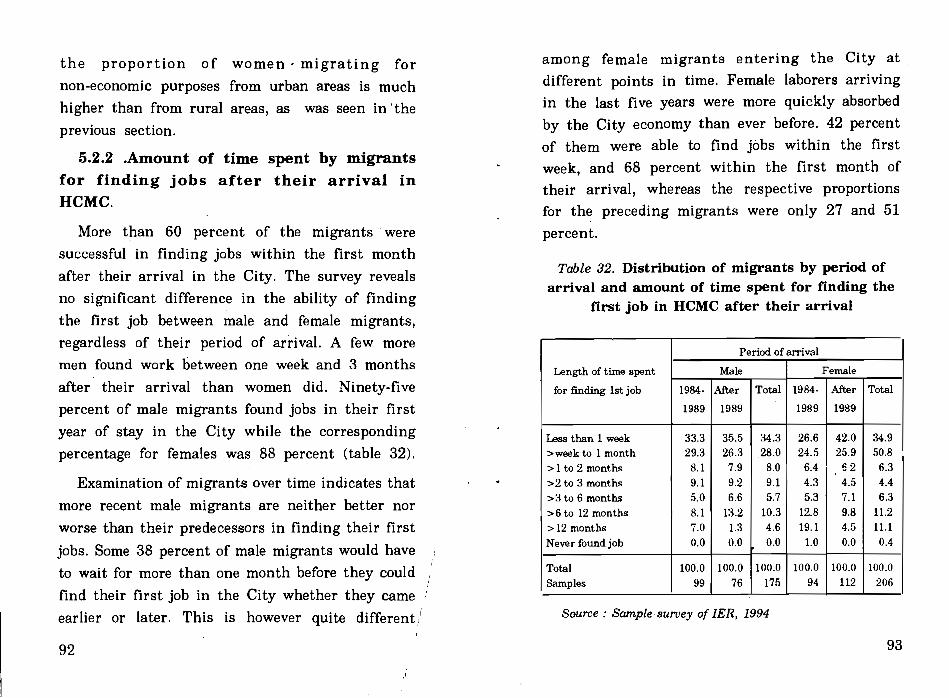
the proportion of women' migrating for
non-economic purposes from urban areas is much
higher than from rural areas, as was seen in 'the
previous section.
5.2.2 .Amount of time spent by migrants for finding jobs after their arrival in HCMC.
More than 60 percent of the migrants' were
successful in finding jobs within the first month
after their arrival in the City. The survey reveals
no significant difference in the ability of finding
the first job between male and female migrants,
regardless of their period of arrival. A few more
men found work between one week and 3 months
after their arrival than women did. Ninety-five
percent of male migrants found jobs in their first
year of stay in the City while the corresponding
percentage for females was 88 percent (table 32).
Examination of migrants over time indicates that
more recent male migrants are neither better nor
worse than their predecessors in finding their first
jobs. Some 38 percent of male migrants would have
to wait for more than one month before they could
find their first job in the City whether they came
earlier or later. This is however quite different/
among female migrants entering the City at
different points in time. Female laborers arriving in the last five years were more quickly absorbed
by the City economy than ever before. 42 percent
of them were able to find jobs within the first
week, and 68 percent within the first month of their arrival, whereas the respective proportions
for the preceding migrants were only 27 and 51
percent.
Table 32. Distribution of migrants by period of arrival and amount of time spent for finding the
first job in HCMC after their arrival
Period of arrival
Length of time 'spent Male Female
for rmding 1st job 1984· After Total 1984· After Total
1989 1989 1989 1989
Less than 1 week 33.3 35.5 34.3 26.6 42.0 34.9 :> week to 1 month 29.3 26.3 28.0 24.5 25,9 50.8 I
:> 1 to 2 months 8.1 7.9 8.0 6.4 £2 6.3 :>2 to 3 months 9.1 9.2 9.1 4.3 4.5 4.4 :>3 to 6 months 5.0 6.6 5.7 5.3 7.1 6.3 :> 6 to 12 months 8.1 13.2 10.3 12.8 9.8 11.2 >12 months 7.0 1.3 4.6 19.1 4.5 11.1
Never found job 0.0 0.0 0.0 1.0 0.0 0.4
Total 100.0 100.0 100.0 100.0 100.0 100.0 Samples 99 76 175 94 112 206
Source: Sample survey of fER, 1994
93 92

As presented earlier, this can be explained by war, and they are stilI working. While most of the fact that the City economy has been growing men are employed as professional and related rapidly in recent years with the industries that workers, and manufacturing workers, almost half primarily absorb female laborers, such as garment, of the women work in trade and sales which have textile, food processing, sales and other services. evolved from the state-owned monopolistic rationing Those industries usually prefer migrant to system of the centraHy planned economy .
.'.~non-migrant females because they can hire the Table 33. Distribution of respondents by gender, former at much, lower cost and thereby they can main occupations and migratory status be more competitive with other producers both in Migratory status
"Mainand outside the City, or with exported goods. ~'
occu- Non.migrants 1984·1989 After 1989Moreover, non-migrant females also tend to refuse
pation Male Fem. Total Male Fem. Total Male Fem. Total many types of occupations which their migrant counterparts would be willing to occupy, such as Admini· family servants, restaurant or bar waitresses. stratiye, lat clerical an
related 2.0 4.7 3.2 4.1 1.6 2.8 1.2 1.7 1.55.2.3. Occupation of migrants and non· Profes·
sional&migrants related 12.2 11.6 12.0 12.4 12.7 12.6 8.2 9.3 8.9t,. Constru-The common feature, of both the non-migrant ction &
manu·and migrant work force is a conspicuous facturing 31.6 20.9 26.6 32.2 22.2 26.5 38.7 28.0 32.5
Agriculconcentration of workers in several categories of ture 10.2 8.1 9.2 3.3 2.4 2.8 4.7 1.7 3.0 Transport,occupations. While the biggest number of male post &
laborers work in manufacturing and construction, communication. 11.2 0.0 4.3 9.1 0.0 4.5 'i. J. 3.5ii·:11trade and sales employ the biggest number of Trade and sales 14.3 33.7 23.4 18.2 38.9 28.8 9.4 33.0 23.2women workers. Table 33 suggests that the highest
t Restaur· ant&hotel 0.0 0.0 0.0 1.7 0.0 1.0 3.5 0.9 2.0proportion of professional and related workers is Services 11.2 9.3 10.9 7.4 13.5 10.5 12.8 7.6 9.9
among migrants coming between 1984-1989. This Family servant 2.0 8.1 4.9 1.7 4.8 3.2 5.9 14.4 10.8
is in accordance with the fact that most of them Others 7.1 3.5 5.4 9.9 4.0 6.9 8.2 2.5 4.9
have been senior government employees and were Total 100.0 100.0 100.0 100.0 100.0 100.0 100.0 100.0 100.0 Samples 98-, 86 184 122 126 248 85 l8! 203transferred to the City after 1975 to strengthen
both its administration and production after the Source : Sample slfruey of [ER, 1994
94 95

Migrants in the later period continued to be absorbed by occupations in manufacturing, construction, trade and sales. Besides, more recent migrants also tend to be employed more in different
types of personal services than before. In particular, the proportion of persons working as hired family servants is extremely high among women coming to the City very recently as compared to those
arriving a few years ago.
Resul ts from this survey confirm that the state-owned sector is no longer the dominant sector of the City economy in terms of the number of workers it employs. In 1989, the population census showed that the state sector still employed more than one third of the work force of the City. However, a number of loss-making state enterprises were closed down or have significantly contracted since. A number of employees were dismissed, laid off or transferred to the private sector, while others decided to operate businesses on their own. Thus, although the majority of men who migrated to the City before 1984, most of whom areno'Y\' relatively old, still keep working for the Government sector, nearly two thirds of total laborers of the City now work for· the private
sector are self-employed.
The survey indicates that the proportion of the self-employed ismuc4 higher among female than
I'"' among male laborers. Moreover, the' portion ofI migrants being employed by private enterprises is
/, also higher in the last 5 years than before. It is also seen that the proportion of hired houseworkers is distinctly higher among the most recent migrants that) among others.
Table 34 . Distribution of respondents by mi~tory status and economic sector of main
I} occupation
Econo- ~igratorystatus 1
mic Non-migrants .1984-1989 After 1989 , sector Male Fern. Total Male Fern. Total ~ale Fern. Total
OwnI, family business 41.8 54.7 47.8 36.9 57.1 47.2 23.5 34.8 30.1 Other's family . business 10.2 8.1 9.2 6.6 5.6 6.1 15.3 20.3 18.2 Private sector 24.5 14.0 19.6 27.9 7.9 17.7 34.1 27.1 30.1 Stateowned
to sector 21.4 22.1 21.7 27.0 27.0 27.0 22.4 16.1 18.7 Collective sector 0.0 0.0 0.0 0.0 2.4 0.0 1.2 1.7 0.5
~'. Foreign-VN joint venture 2.0 1.2 '1.6 1.6 0.0 2.0 2.4 0.0 2.0 Others 0.0 0.0 0.0 0.0 0.0 0.0 1.2 0.0 0.5
Total 100.0 100.0 100.0 100.0 100.0 100.0 100.0 100.0 100.0 ~I11ples 98 86 184 122 126 248 85 118 203
97 96

Nevertheless, it can be also noted that the percentage of state sector employees among male migrants is significantly higher than among male non-migrants. Most of those employees work for
the enterprises of the Central Government which
are located in HCMC.
5.2.4. Average number of working hours
in main occupation
Regardless of their migration status, the people working for their own or another family business have the largest number of working hours per week. State sector employees are among those working the least number of hours per week, Le.,
around 48 hours <table 35).
From a broader view, migrants work harder than non-migrants. Each migrant laborer had on average five more working hours per week than a non-migrant. This could be to a great extent explained by the fact that migrants are more income-oriented than non-migrants. But they are usually paid less than non-migrants. Hence, many
of them are willing to work longer to compensate for their low pay and thereby get better off more quickly. While the hardest non-migrant workers
are those employed for private enterprises, migrants .
98 .
are seen to work longest when they work for their own families or other families as servants, houseworkers, or pieceworkers. It can also be said that women were engaged in their own family business for more hours than men . This is however not anything unusual in Vietnam.
Too le. 35: Average number of working hours per week of respondent workers in main occupation,
by migratory status and economic sector
Migratory status
Economic sector Non-migrant 1984-1989 After 1989
Male Fern. Male Fern. Male Fern. 1------
Own family business 48.7 53.4 59.3 59.0 56.4 61.3
Other's family business 49.2 .45.1 64.6 62.9 47.2 62.1
Private sector 57.9 56.2 56.9 56.6 56.5 57.0
State..owned sector 47.3 47.3 51.2 47.7 48.9 53.6
Collective sector - - - 77.0
Foreign-VN joint
venture 54.0 48.0 52.0 58.7. 48.0 70.0
Others - - - 60.0
Total on average 50.9 51.7 56.7 56.0 53.4 59.2
Samples 86 71 122 126 85 118
Source: Sample survey of IER, 1994
5.3. WAGES AND INCOME
The results of the sample survey show that the
99

income of migrants differs by migration category. city longer, seem to be paid more per month than On average, a male worker among migrants coming their non-migrant counterparts. The data at first between 1984-1989 is paid 544,683 VND per month sight would suggest that non-migrant workers (about US $'50), while a female worker is paid would be more likely to under-report their monthly only 335,942 VND (about US $ 31). A male worker income or they might have under-reported it much
earns 1.6 times more than a female. Monthly income • more seriously than migrant workers would. There
of a male migrant worker coming since 1989 is is probably also an age effect, as the migrants
315,730 VND, while monthly income for a female during 1984-1989 are older than the average
worker is 240,235 VND. A male earns of 1.3 times non-migrant.
the income of a female worker. Table 37: Average income of migrants by the
On average, each male worker receives 437,014 industry ofmain occupation and period ofarrival
(all value in VND 1000) VND (about US $ 39.7), which is 53 percent
Period of arrival higher than what his female counterpart earns. Main occupation 1984·1989 After 1989
Male Fern. Total Male Fern. Total
Table 36: Average income of respondents by 1. Agriculture 1 37,5 200,0 164,3 550,0 275,0 432,1 .migration status and sex. 2. Manufacturing
and construction 657,5 460,0 586,7 451,1 417,6 415,6
Migratory status Male Freq. Female Freq. 3. Transportation, post and communication 642,7 - 642,7 483,3 450,0 478,5
Non-migrant 434,800 50 291,435 39 4. Trade and sales 694,0 498,6 595,2 546,7 597,5 569,0 i
Between 1984 5. Hotel/restaurant 450,0 - 450,0 833,3 300,0 700,0
1989 migrants 544,683 155 335,942 207 6. Services 880,0 972,9 915,0 404,9 331,3 373,5
Mter 1989 migrants Total
315,730 437,014
130 335
240,235 285,359
212 458
7. Professional and related 8. Administrative, clerical and related
875,0
1022,0
418,3
800,0
532,5
968,0
361,2
500,0
205,9
550,0
241,2
533,3
Net income per month in case of all workers in general. 9. Family servant 10. Other
738,3 467,4
580,6 344,0
657,0 429,7
631,3 517,1
472,7 428,0
534,4 490,4
Table 36 could be surprlsmg because migrant Samples 121 126 247 85 118 203
workers, especially those who have stayed in the Source;' Sample suroey of IER, 1994
100 101

Data from table 37 clearly indicate that migrants The result also shows that migrants working
in services earned more than those working incoming to the City in the period 1984-1989 whoworked in administrative, professional and related
other occupations.' Besides, there are significant occupations earned more than similar migrants
differences between males and females in some coming in the following period. This is in
occupations, which cannot be explained by accordance with the fact that many of those who
differences in average number of working hours. migrated to the City in the period 1984-1989 Not taking into account the number of migrantsworked as senior Government officials. working as senior Government officials, in some
categories of occupations the average number ofTable 38. Average number of miil'8.!lts' working working hours of a female worker is higher thanhours per week by main occupation and period
ofarrival that of a male worker. This reflects the fact thata female worker is paid less than a male workerPeriod ofarrival
Main occupation 1984·1989 Mer 1989 while they often work harder in the same
Male Fem. Total Male Fem. Total occupation.
L Agriculture 54.3 56.0 55.0 46.5 47.5 47.0 Table 39 : Average income of migrants by2. Manufacturing economic sectorand construction 56.0 56.4 56.2 51.9 57.8 52.83. Transportation, post, and communication 65.6 . 65.63 9.83 . 39.8 1984·1989 After 19894. Trade and sales ,.57.9 61.5 59.7 63.0 67.8 65.4'6. Hotel/restaurant 48.0 - 48.0 66.7 70.0 68.4
Economic sector
6. Services Male FemMe Male Female53.9 53.1 53.5 58.7 54.1 56.47. Professional 1. Own family business 732,444 634,5813 397,500 606,975and related 50.0 53.0 52.3 45.4 55.8 50.6 2. Others family business 475,000 231,428 434,615 200,008. Administrative, 3. private sector 625,882 353,000 537,931 397,187
clerical and related 48.0 48.0 48.0 48.0 52.0 50.0 4. State owned sector 772,303 510,294 533,947 401,7899. Family se:rvant 46.7 42.2 44.5 48.0 53.1 50.6 .5. Collective sector - - 360,00010. Other 61.2 58.8 60.5 52.3 50.7 51.5' 6. Foreign-VN joint venture 450,000 450,000 450,000 450,000 Samples 121 126 247 85 118 203 7. Other - - 500,000 .
Samples 122 126 85 118 ISource: Sample survey of fER. 1994
102 103

Table 39 shows the average income of migrants in different economic sectors. Migrants in their
own family business or the state-owned sector have higher incomes than those in other sectors. Their
income is approximately 1.5 to 2 times that of migrants in the private sector and in others family businesses.
However, the average number of hours worked per week of a female in those businesses is higher than that of a male ( table 40). In particular, among women coming to the City after 1989, the average number of hours worked in others' family businesses is much higher than that for males.
Table 40: Average number of hours worked per week by economic sector, and time of arrival
1984-1989 Economic sector I
I Male Female Male Female
1. Own family bU$iness 59.31 59.1 56.45 61.29 2. Others family business 64.62 62.85 47.15 62.08 3. Private sector' 56.94 56,60 56.51 57,03 4. State' owned sector 51.51 47.73 48.95 53.57 5. Collective seFtOJ!' 77.00 6. Foreign-VNjoint venture 52.00 58,66 48.00 I 70.00 7. Other 60.00 Samples 12259.1 126 851 118
Source: Sample suroey of IER, 1994
Table 41 clearly indicates a conspicuous differential in wage rate· between male and female
r workers. On average, a. male worker is paid a wage rate 26 percent higher than that of his female
counterpart, i.e.; VND 2,900 as compared to VND 2,300 per hour. This holds true for both
non-migrants and migrants. v
Table 41: Average wage ra~e per working hour(*) of employed respondents by sex and migratory
status
Wagerate(VND per hour) Migratory status
~ Male Freq. Female Freq.t t,
I I, Non-mi~ant 2,400 83 2,300 71
'"
Between 19841989 migrant 3,300 122 2,700 124 After 1989 migrant 2,500 84 2,100 117 Total ,2,900 289' 2,300 312
(*) Net income per working hour in case of ,employee or self-employed worker. l "
~' .r: Not taking into account a limited number of
migrants coming to HCMC before 1984, which would prevent many statistically significant, inferences from' them, figures in Table 41 could~
surprise most analysts. That is, migrant workers,
105 "
104

- --------- -----
/ especially those who have stayed in the City for
more years, seem to be paid more per working hour than their non-migrant counterparts. At first
sight, it would suggest that non-migrant workers
could be more likely to under-report their monthly
income (which is divided by number of working
hours per month to produce wage rate) or they might have under-reported it much more seriously
than migrant workers would. Experience shows that official city residents are subject to many legal obligations, including payment of income
taxes, and hence could have a number of reasons for under-reporting their incomes, while many of
the migrants are not registered and could feel more free to state their incomes.
While it is only an assumption, and there has so far been no evidence that non-migrants could
be more likely to distort information about their
income than migrants, or how big the extent of
income distortion could be, another paradox is
detected when non-migrant and migrant workers
are examined by the type of the organizations
they worked in. It is often hypothesized that most
migrants in cities would be absorbed by enterprises
of the urban informal sector and usually be paid
a much lower wage rate than non-migrants.
However, results from this survey show a different situation. We may simply define informal sector workers as those employed in the enterprises or
businesses which:
(1) are non-state organizations; and
(2) operate in. open space or residential
commercial mixed houses; and .'
(3) employ 10 workers or less.
Table 42 . Distribution of workers by migratory status and type of organization of main
occupations
Type Migratory status
oforgaNon-migrants 1984-1989 After 1989
nization
Male Fern. Total Male Fern. Total Male Fern. Total
Informal 62.7 64.8 63.8 52.4 60.5 56.5 54.8 60.7 57.8
Formal 37.3 35.2 36.2 47.6 39.5 43.5 45.2 39.3 42.2
Total 100.0 100.0 100.0 100.0 100.0 100.0 100.0 100.0 100.0
" Samples 98 86 184 122 124 246 84 117 201
Sample survey of IER, 1994
It is seen from Table 42 that more of the
non-migrant laborers work in informal sector
enterprises than the migrants. The proportion of
informal sector employees among migrants even
107 106

appears to be on the decrease as they stay longer
in the City. Nevertheless, data: from the survey
reconfirm that informal sector workers are paid
less than their counterparts in the formal sector.
This together with the higher percentage of
informal sector workers among the non-migrants
than among the migrants could explain to some
'extent the lower average wage per hour of the
formers . .It should also be noted that recent female
migrant workers are paid less than their
non-migrant counterparts. This is becaus~, as seen
previously, a number of them are employed as
family workers, Le., servants, assistants, piece
workers etc., and they are usually paid the lowest
wages.
In any case, regardless of whether or not income
information is more likely to be distorted among
non-migrants than migrants, it could be said that
migrants improve their wage rate as they stay
longer in the City. This is probably because as
time passes, they can eventually find better jobs
than in the first years'-
When asked to compare income earned at the
time of the survey and that earned at the same
time last year, income improvement seems to be
more conspicuous among migrants, in parti.cular
the most recent ones. 25 percent of non-migrants
stated they receive more· this year than last. year.
43 percent of them did not see any improvement " in their income. 18 percent of them even
complained that their earnings declined. ...
As expected, recent migrants have undergone
the most important changes in their economic
status. As their income in the previous place of
residence would be quite low, almost half of the
migrants had greater monthly income now than
at this time last year. 23 percent reported their
income was the same and only 7 percent complaiped
of lower income.· The migrants that have stayed
in the City for years were, on the other hand,
not at the same level of success any more. Nearly
one· fourth of them even saw their income declining
as compared to that earned at the same time last
year. Only one third of them reported improvement
in their income.
In general, fewer women stated income
improvement than, men. The largest proportion of
those complaining. of their income falling are1'..'.,.".'.... • « 109
1.
108

women that employed themselves in their own
family business.
All this, however, is not to say that migrants,
except those who migrated before 1984, are
financially better off than non-migrants. It is worth
keeping in mind that this is a household survey
in which individuals were selected from households
and administered most of the questions. This
implies that most of the single, unregistered and
very likely unsuccessful individual migrants that
might not be accommodated in households, could
not be captured by the survey. Those captured in
this survey might be more or less successful
migrants and it is not surprising that they might
do better than non-migrants. Therefore, in .,order
to have a proper look at the problems of
employment, income and related issues of migrants,
and to' make a comparison between migrants and
non - migrants, a ~tudy of a more specific type
would be necessary. The study should cover all
types of migrants, including short-term and
seasonal migrants, with a more careful and
deliberate design for studying the problems
mentioned above.
5.4. SAVINGS AND REMITTANCES OF
MIGRANTS
5.4.1. Savings of migrants
Table 43. Average amount of yearly saving per worker by migratory status
Unit: VND
Migratory status Mean Freq.
Non-migrant 387,961 157 Between 1984-1989 1,141,173 248
After 1989 1,003,468 203 Total (average) 925,396 608
On average, the yearly saving of respondents was about 925,396 VND. The data showed that
those who have stayed longer in the city seem to
have saved more money. It is not surprising that , yearly saving was much higher among migrants
than among n(ln-migrants, by 'almost 3 times. This fact is related to the fact that migrants earn more than non-migrants.
The ratio of yearly saving to yearly income was
11 percent. In particular the saving ratio is higher
among migrants after 1989 than among those
110 111

.
1''..'
., ft'
~,coming in the preceding period, Le. 13.4 percent ~. relatives or friends living in other cities/provincescompared to 12.2 percent respectively. ~\ " each year, which is more than one percent higher
5.4.2. Sending money/goods
Data collected by the . survey show that, in
general, more males than females sent money for
goods during the last 12 months to their relatives/
friends living outside HCM City. On the other
hand, the proportion sending is much higher among
migrants than among non-migrants. 20 percent of
male and 13 percent ot female migrants coming
to the City after 1984' sent money/goods out of
the City at least once during the 12 months before
the interview (table 44), 21 out of 100 male
migrants from rural areas sent money back to their
home place each year, which is '3 percent higher
than the proportion sending among male migrants
from urban areas. The proportion of rural females
sending is also significantly 'higher than among
their urban counterparts, Le., 15 percent as
compared to 10 percent, respectively.
The analysis of the value of money/goods sent
by respondents reveals an opposite trend for male
and female migrants. On average, women sent 5.4
percent of their annual total income to their
than what their male counterparts sent. On the
other hand, male migrants appeared to send more Iri
of .their annual earning in the first years of stay
in the City. Men migrating to the City after 1989
sent 7.2 percent of their yearly income to their "
relatives, whic~ is over half of their yearly saving
while those arriving earlier. sent only 4.4 percent
of their income each year.
Toole 44. Proportion of respondents sending money/goods during the last 12 months, by sex
and migratory status
Proportion sending
Male FemaleMigratory status
Freq. Barn- Per- Freq. Sarn- Per
pIes cent pIes cent
Non-migrant 4 114 3.5 2 126 1.6 Between 84-89 migrant 31 155 20.0 27 207 13.0 After 1989 migrant . 26 130 20.0 29 212 13.7 Total 61 399 15.0 58 545 10.7
'
As opposed to men, women seem to send more
of their income as they experienced more years of
113 112

living in the City. Thus, during the past 12 months
women migrating before 1984 sent back to their
home place lOA percent of their yearly income,
which is almost double the proportion sent by
those migrating to the City in the last 5 years.
5.4.3. Destination of remittances
Because only a limited number of non-migrants
and of migrants coming to the City before 1984
sent money/goods during the past 12 months, only
migrants arriving after 1984 are considered for
further analysis of remittances .. It could be said
that a great part of the value of money/goods was
sent to the migrants' parents (table 45). While it
demonstrates that relationship to· parents is
supreme to most people, it could also be exaggerated
to some extent because the senders would prefer
to send all remittances to different family members
in one package and parents are usUally those the
remittances are addressed to. Migrants then tend
to report only the addressed persons without any
break-down in ?rder to avoid long and compliGated
conversations. Thus, in most cases, receivers other
than parents, are often those living in other places
than the parents' house.
Table 45. Distribution of value of money/goods sent by migrants during the last 12 months by
receiver of remittances (all value in VND thousand)
Receiver Value Percent !
Spouse/children
Parents
Siblings
Parents -/brother-/sister-in-Iaw
Other relatives
22,352
122,600
7,450
9,000
100
13.4
73.6
4.5
5.4
0.1
Others 4,992 3.0
Total 1 66,494 100.0
A significant proportion of the remittances, 13 percent, was sent to respondents' spouses or children. As will be seen later, most of these remittances were sent to support their education.
As the people· originating from rural areas
dominate among the migrants, it is not surprising that 59 percent of the remittances were sent to
rural areas.
More than 91 percent of the money/goods sent by migrants during the last 12 months were
supposed to support their family daily living
expenses. This' indicates that living standards in
114 115

their place of origin are still very low and daily
expenses should be given priority. This is also consistent with the fact that the value of remittances sent by migrants was limited and not
likely enough for usage for other than daily expenses. Only a limited proportion of the remittances was sent to their dependents to support their education (table 46).
Table 46. Distribution of the value of money/goods sent by migrants during the last 12
months by main purposes of sending ( all value in VND thousand )
Main purpose Value Percent
To support daily subsistence 51,950 91.3
To support family business 2,600 1.6
To cover cost of education
and health care 3,752 2.2
Others 8,192 4.9
Total 166,494 100.0
Source : Sample survey of [ER, 1994
CHAPTER VI FERTILITY AND FAMILY PLANNING
OF MIGRANTS
6.1. LEVEL AND TREND OF FERTILITY
In the 1994 migration survey, all ever-married
women aged 15-49 years in the sampled households
were asked about children ever-born and the last
birth that occurred to them. There were 960
ever-married women among the 1,967 women aged
15-49 years ( 989 non-migrant and 978 migrant
women) . In order to estimate the fertility level
of the City female population as a whole, all the
numbers were weighted by factors based on the
non-migrant/migrant female population ratio
derived from the population survey which was
conducted by the Statistical Office of HCMC
117 116

between June 1994 and June 1995 1 Results are method, l with an adjustment factor calculated asshown in Table 47. a weighted average of P(2)/F(2), P(3)IF(3) and
P(4)IF(4). The adjusted ASFRs are presented inTook 47. Number of women and number ofchildren ever·born and children bom during the
Table 48, which also shows fertility patternsderived from the Population Census (April 1, 1989)last 12 months, from the 1994 migration survey. and the Demographic Survey conducted by theStatistical Office of HCMC on April 1, 1993. It
Ever I No of No of Average "
should be noted ,that the ASFRs are all adjusted Age All married children children no. of
group women women ever born in Ave~age births
using the P IF Ratio Method and refer roughly toborn last 12 parity. in last the fertility level in September 1988; September
months 12months 1992; and March 1994, respectively.
(1) (2) (3) I (4) (5) (6)= I (7)= Thus, Table 48 provides apparent evidence of(4)/(2) (5)1(2) a steady decline in the fertility level in HCMC15-19 303 22 25 8 0.0818 0.0263 during the period 1988-1994. The total fertility20-24 359 81 92 19 0.2577 0.0537
25-29 375 204 261 46 0.6968 0.1233 rate declined from 2.14 in 1988 to 2.07 in 199230-34 333 213 347 17 '1'.0399 0.0523 and further to 1.89 in 1994. This suggests that35-39 263 186 . 430 13 1.6334 0.0500 fertility declined more rapidly .in the last two years40-44 220 16~ 470 13 2.1395 0.059145-49 115 85 321 0 2.7952 0.0017
than in the preceding four years. While the fertility Total pattern in 1992 is almost identical to that fromL--_--L.!_19?7 1 960 1 1946 I 117 11 . I Note: Numbers are weighted.
the 1989 census, the fertility pattern in 1994,would imply that the fertility structure of HCMCBased on the data collected, age-specific fertility women changed substantially between 1988 andrates were then estimated using the PIF ratio 1994. It is unlikely that the age-specific fertility
1. The SJ,lrvey recorder 4,401,114 persons, of w~ich 2,305,914were females, including 218,576 females migrating to HCMC 1. UN, indirect Techniques for Demographic Estimation between 1984 and 1995. Manual X. New York, 1983, Pp. 27-41.
118 119

pattern would have changed so much in two years.
The anomalies in the 1991 pattern have probably resulted from a combination of sampling variance,
some age misreporting, and the relatively low proportion of women ever-married in the 1994 survey.
Table 48. Age-specific fertility rates as derived from the Population Census on April I, 1989;
the Demographic Survey on January I, 1993; and the Migration Survey on September I, 1994.
Age group 1988 1992 1994
(1) (2) (3) (5)
15·19 0.0279 0.0138 0.0309 20·24 0.0974 0.0956 0.0622 25·29 0.1277 0.1293 0.1251 30·34 0.1036 0.1086 0.0518 35·39 0.0495 0.0469 0.0517 40·44 0.0209 0.0186 0.056045·49
0.OQ12 0.0009 0.0011t--- TFR , -
2.14 2.07 -
1.89 -
One of the major objectives of the 1994 migration survey was to examine differences between migrants
and non-migrants in many respects. However, because the survey covered only a limited number
of individuals that form the basis of the in-depth
analyses, comparisons of the characteristics
between some categories of the respondents may
not be valid, or the results must be interpreted
with great caution. This limitation applies to the
I. analysis of fertility level for migrants and
non-migrants. Indeed, as shown in Table 49, only
f. small numbers of ever-married women fall in the
age groups 15-19 and 40 years or above, and few
of them reported giving birth during the 12
t months prior to the survey. Thus, the average
number of births in the past 12 months per woman ~- in those age groups would be very sensitive to
sampling errors and we decided not to use the
information on the last births for comparison of
fertility level between non-migrant and migrant
females. Instead, information on children ever-born
would provide a better idea of possible differentials
in fertility level, although it does not distinguish
the most recent fertility patt-erns.
Table 49 compares the average number of
children ever born to non-migrant and migrant
females by age group. It appears that the number
of children ever born to migrant women is
under-reported as the average number of children
ever-born to women ages 45-49 is lower than that
of women ages 40-44 years. Otherwise, there is no
121 120

r-r---- evidence that data collected from migrants are more O>CI:!CI:!C'<IC'lCI:!lO
~.€ ""' I 00 C'I <D 0> 0'> Cl:! to~ g. ~ Cl:!l-<DOOlO.t:) ~ 0..... • C'I to C'I 0'>likely to be subject to response errors than data ~ a - ooO~~C'i~
«t~ ~ gathered from non-migrants or vice versa. Under Q.l I ~ .5 C't 1! _a & ("j 0 Cl! ........ 0 .q. <D .0 to Cl:! C'I ..... I t-
..... C'I..... <Dthe assumption of the same response errors for "' ....,£;""t:: .....
~ :. Zll]19 a ~ ;.l~the two populations, the two data sets,particularly .....C ttJ. I' . .... I:- ..... C'I.t:) 00>01 '<I'El 0 ~in columns 6 and 11, suggest that recent migrant ~~. ! :;3 ... I'!:l
6)1 .q.~~;:!;~0'> ~
~females give birth later than their non-migrant '5 ~ z1l0 C _ 'Q t::
counterparts. Given that final fertility level is ; .~ s ~I ..... lO 0 0 <D .t:) Cl:! C'I ~ ~ ..... '<I'I:-.o ..... t--°l.o
00 ..... ..... '<I'~ Q.l
significantly dependent on a womans age of giving 1::$ ~ j ~ t:: 0000'> Cl:! t-- .0 <DI 00the first birth, this can be considered an ~'g '-1 00 Cl:! 0'> lO 00 I:- '<I' t- .... ~ t-- ..... C'I ..... ..... 0>
~ ~ ~ indication that recent migrant females will e C ~
S• 0So.
probably have fewer children than the C ~ C'I ..... .0 t-- ·0 <D '<I' ~.~ ~1t--OOMlO""''<I'
~ t ... ~ e ~~g~~~~non-migrants, which is consistent with the results Q.l > ~ 0.. ooo~~C'iC'i .... Q.l «t from a similar survey on migration conducted by C C t:: rn
......- C'I ..d~ ~ El 0 (!) ..... ""I ~ '<I' 0> MOOt-- t-- 0 I 00IER in 1990. e '0 ::s ,",..d "" t:: lO C'I lO
So.. -.... ... z1l~.! a ..0 ----4Among recent migrant women now aged 35 years ~. -B a
Q.l .... !;ii..... Cl:!t-- ..... Cl:! '<I'CI:!O> 0 13.;:; El 0 ~ ~..... '<I' Cl:! t-- C'I '<I' <D 0 "".... 0or above, most would have had their first or second '" ::s ... I'!:l.q. .......... C'lC'I ..... 0 ~ o So. '= z 1l 0 ......~ birth before they migrated to HCMC. Nevertheless, S ! ~ ~ := a ... ~t:: ..... 0'>C'lt--t--00'<l' 00 ~
QI .~ ~ .-..... MOO 0> 00 '<I' 00 ;:jthe data show that their fertility level is probably .. ::I ::I >'"'", M .......... '<I' q):S C I'!:l 1ii 0 ~ "-So. '0 e ~ 0lower than that at their rural place of origin, "t; B
.... So. t:: 0> '<I't--O>I:-'<I' 0>and not much higher than the level for non-migrant Q 0 ~I ;!; ~ ~ !e ~ ::: .0 ~I~
0> E.=.. ~ El females. This probably indicates that female ~ f ~
~
:.E~-+------------~~I
~ .!:: 0.. 0>'<1'0>'<1'0>'<1'0>migrants are different from rural women and ~ ..... C'lC'lMM'<I' '<I' ~I~~~ t6o~ot6oth
confirm the results of the 1990 migration survey ~~ ..... C'lC'lMM'<I''<I' E-'
(Truong Si Anh, 1993).
123122

, 6.2. FAMILY PLANNING
methods, which include the IUD, pills, sterilization
and condoms, from non-modern methods, which6.2.1. Current family planning practices include traditional methods, withdrawal and other
The survey collected hi formation on family unclassifiable methods1. planning practices only from currently married women aged 15·49 years, Le., not including widowed Table 50. Percentage of married women age
and divorced/separated women. Thus, 859 women, 15-49 years currently USing any contraceptive method. modern or non-modern .regardless of their migration status, were asked
whether or not they were currently practicing any Demographic survey 1993 Migration survey 1994(")
family planning method and, if so, what method Age Non- Non-Any Modern Any Moderngroup modern modernthey were using and for how long. Women who method method method method
method method reported not currently using any contraceptive
1.915-19 18.8 12.5 6.3 23.6 21.7 method were also asked about the major reason for
20·24 47.1 2B.4 IB.7 54.4 33.3 21.1 not practicing one. 22.225·29 66.5 43.1 23.4 68.7 46.5
30-34 74.7 46.6 2B.l 69.3 52.1 17.2In analyzing family planning practices of 26.735-39 79.5 50.8 28.7 72.7 46.0
women, we apply the same weights. as were used 40-44 69.8 41.7 28.1 66.9 46.4 20.5
in the previous section. Results are shown in 45-49 24.9 19.2 59.B 30.7 29.1 ...__ . ----
...- ..~ Table 48. 42.0 24.9 66.4 44.7 21.7All ages 66.9
..--~-..
Overall, 66.4 percent of married women reported Note: (*) Figures are weighted.that they were currently using' some family
planning method. This is almost identical with In 1994, some 45 percent of all married women the result from the 1993 demographic survey. In
aged 15-49 were currently using some modern family planning programs, more attention is paid to the contraceptive methods which prove to be 1. There is also evidence that some respondents in fact were of higher reliability and effectiveness tharl the not practicing any family planning method but reported
positively (any often failed to specify the method) because they others. Hence, it is useful to distinguish modern thought they might have trouble when responding negatively).
124 ,,' 125t i''t ~.
~

f.
contraceptive method, which is almost 3 percentage
points higher than the respective percentage in
1993. Among the modern methods, the' IUD is
traditionally the favorite method in Vietnam and
the proportion of women who were using the IUD
increased from 43.8 percent in 1993 to 50 percent
in 1994. Use of other modern methods remained essentially stable.
Taking into account the fact that the largest
quantity of condoms in Vietnam is sold in HCMe,
the percentage using condoms appears to be rather
low, Le., only 5 percent. Nevertheless, it is still higher than the proportion recorded in the 1993
demographic survey, i.e., 3.8 percent. It is also
evident that the percentages using any. modern
method in all age groups, except that of 35-39
years have increased remarkably since the
preceding survey. More specifically, the most
impurtant increases are recorded in the age groups
15-19 and 45-49. This would contribute
considerably to the decrease in fertility level which
was observed in the previous section. Also, this is
consistent with the higher percentage of all births
occurring to women in the age span 25-29.
About 22 percent of married women were using
non-modern contraceptive methods. Except for the
last age group, 45-49, in the 1993 survey, a common
pattern in both the 1993 demographic survey and
the 1994 migration survey is that older women
are more likely to use non-modern methods than , \~
younger ones. Over time, the overall proportion
using non-modern methods is decreasing. This is
likely associated wi th the increase in the supplies of modern contraceptives and family planning services and a wider choice of means available to
users (NCPFP and GSO, 1995).
6.2.2. Reasons for not practicing family
planning '~l'
In this survey, all women who reported they
were not currently using contraception were asked the main reason for not doing so. Unfortunately,
~ one third of the respondents did not give any clear
answer. Nevertheless, further analysis shows that
womefi who did not give a reason already had, on •
average, well above 2 children.
Over 45 percent stated they were not using
contraception because they did not have the desired
number of children. Indeed, they had only 0.7
children per woman on average at the time of the
survey. Another 10 percent did not practice family
127 126
planning because they wished to have at least one
boy or girl in the family, although they already had about 2 children on average.
Other reasons thought to prevent couples from
practicing family planning, such as availability of services and contraceptive means, health conditions, religion, lack of knowledge and SO on, seem to be less important and account for less
than 8 percent of the cases.
Thus, this survey is still far from satisfactory in revealing the reasons for couples not practicing contraception, which would be essential to the on-going family planning programs success.
• CONCLUSION
, ,
Analyzing the population growth, employment situation and income in relation to migration during the period 1984-1994, gives us the followings:
1. Migration to the City has some positive
contribution in changing the population and labor
force composition of the City. The results of the
sample survey show that net migration has a great influence on the population structure as well as
i population growtl! and labor force expansion,
leading to employment problems. " The migrants that were allocated to the City
by the Government, have raised education and
qualification levels in the City. Again illegal
migrants who are more flexible and positive than
non-migrants in economic activities, have probably
stimulated the economic development of the City
128 129

as they have done in some other Asian countries
in the previous decade.
2. We have known that migration to big cities
has been an inevitable phenomenon in the process
of urbanization, because they offer more jobs, higher
living standards and more facilities. The condition
and factors which tend to attract people to the
City such as employment, housing, public utilities,
etc. may not be forthcoming in the next 10-15
years. Therefore, if there are no effective solutions,
the urban management of HCMC will face many
difficulties and it would be impossible to build a
clean and beautiful city.
3. The pull of HCMC has been rather strong
as has been the push from other provinces.
Although the city authority has issued many severe , '
regulations, illegal migrants have not been
effectively prevented from coming in. In the context
of the market economy and economic reform
policy, residence regulations cannot be an effective
instrument to prevent migrant inflows to the City.
Further, it should be noted that m~rriage as a
reason for migration tp the ,City is permitted by
current Government regulations and has tended to
increase in, recent years. Secondary migration is
decreasing due to migrants following their relatives
or friends to the, city, but has not tended to stop in recent years.
All these together indicate that planned or
spontaneous migration flows will go along with
• the process of development of HCMC. However,
the pattern, size, structure and consequences of migration will depend on the process lof the pull
of the City as well as the push from the rest of the country.
It should be noted that the present policy of
direct controls of migration have not worked well.
So in order to solve the above mentioned problems,
, the Central Government should carry out ~ continuously a full package of policies to restrict
large migrant inflows. from other provinces. These
• policies will have to be based more on economic and less on direct controls:
+ Migration to HCMC is related closely to the Souths development. The City's population and
employment problems should be solved with the
long term planning of Dong Nai, Song Be, Tay
130 131

Ninh, Ba Ria· Vung Tau and other provinces of
the Central region.
The Central Government should pay more
attention to investment in rural areas to raise the
living standards of those regions as well as to
reduce the economic gap between rural and urban
areas:
+ The Government should also develop regional
industrialization and urbanization planning systems\
in order to create eCQnomic centers and systems
of small-towns outside the biggest cities as a buffer
attracting a part of the migration from rural to
urban areas. For example, some small cities and
towns could be developed in the Red River region,
Central _region and Mekong River Delta region for
decentralizing Hanoi, HCMC and Da Nang City.
These projects of the Central Government should
change the current situation in order to raise the
living standards of the provincial population so as
to limit migration to the biggest cities in general
and to HCMC in particular.
+ On the other hand, for short- term planning
the City authority can take some measures to deal
i t
! i ,i I
! !
J.
';.,f' ':~i'
with the consequences caused by the migrants.
Some basic measures are:
a. Accept the major part of migrants who have
already been able to adapt to urban living and
participate in official economic activities of the
city and have permanent place of residence (by
the Citys recent regulations, they are long-term • temporary r~sidents with temporary residential
permit).
b. It should be noted that we do not have
information about unsuccessful individual migrants
that might not be accommodated in a household,
and therefore could not be captured by tbe survey.
Therefore, we should take a full study all types
of migrants, including short-term and seasonal migrants in order to have a proper look at all
4 aspects of migrants. Such a study should give full
information about migrants and yield a full
package of policies (including overall plans,.. regulations on urban management, and migration controls).
Finally, the results of the survey are very helpful
for the leaders of the City to clearly understand
the socio-economic characteristics of migrants, and
the links with the changing population structure,
I 133132 ",~ ;\',:,"i'.~~
.},) ~:

human resources, employment and urbanization. Based on the study, the' evolution of migration in the future could be estimated for the period 2000-2010. This would be used as a ,base for the
projection of economic development of the City in. the future. "
"
'.
REFERENCES
Truong Si Anh, 1994. Internal Migration To Hochiminh City: Patterns, Consequences and Policy Issues. Hochiminh City: Institute for Ecomonic Research of HCM City.
IER, Migration to HochiMinh City: PrdJlems, issues and resolutions, VIE/89/P03 project, Hochiminh City, 1992.
Statistical Office of Hochiminh City, Statistical year books from 1989 to 1994, Hochiminh City.
GSO, 1991. Results from General Population Census on April 1, 1989. Hanoi: the Publishing House.
Statistical Office of HCM City, 1994. Results from Demographic Survey on April 1, 1993. Hochiminh City.
NCFPF and GSO, 1995. Results from Demographic Survey on April 1, 1993. Hanoi: the Publishing House.
Statistical Office of HCM City, 1995. Results from population Survey 1994-1995. Hochiminh City.
Labour and Social Affairs Department of Hochiminh City. Annual reports. Hochiminh City.
134 135

, \
! I
) " I
,I f '1
t ~ Officer-incharge
NGUYEN PHUC KHANH Editors: vu THIEN CHUY
LE MINH HOAI
Cover disign, : CAO QUY
Proof reading: LE MINH HOAI
In 1050 cutin, kM 13xl9cm, qU X1.l'i1ng in Nxb Chfnh trj. qu6c gia
S6in: S6XB: 81/CTQG.
In xong vs. nl)p luu c~u thang 6-1996.
, ~ .. , j
136