tim woods horticulture agricultural economics. u.s. produce farm cash receipts source: vegetable...
TRANSCRIPT

Tim WoodsHorticulture
Agricultural Economics

U.S. Produce Farm Cash Receipts
Source: Vegetable & Melons Situation and Outlook, ERS, 2010

Produce Acres in U.S.
Agricultural Economics

Figure 1. Comparative Tree Fruit and Nut Sales: 2000-2010
0%
50%
100%
150%
200%
250%
KentuckyRegion
Figure 2. Comparative Vegetable Sales: 2000-2010
0%
50%
100%
150%
200%
250%
Kentucky
Region
Source: Adapted from ERS data, regional sales includes WV, VA, OH, IN, IL, AR, TN
Agricultural Economics

Percent Vegetables Imported Percent Vegetables Imported to U.S. Marketsto U.S. Markets
Item 1985 1995 2005 2009e
Broccoli 0.6 3.7 7.4 10.7
Bell Peppers 23.7 19.1 27.1 52.0
Tomatoes 24.0 30.5 37.9 43.6
Cucumbers 36.3 38.3 49.5 54.6
Squash 19.2 29.7 41.4 46.7
Cantaloupe 12.2 25.6 34.1 34.3
All Fresh 9.1 12.5 16.1 21.7
Source: USDA-ERS

---Markets--- 2003 2009Farmers’ markets 52% 52%On-farm markets 50% 41%Cooperatives 15% 2%Non co-op wholesale 17% 15%Internet 2%Direct to grocery 21% 15%Direct to restaurant 12% 8%Auction 9% 19%CSA 3% 4%
Kentucky Produce Marketing Channels: Farms Selling More Than 10% into One Channel
(2003 and 2009)
Source: Kentucky Produce Marketing and Planting Intentions Survey, 2004, 2010
Agricultural Economics

Produce AuctionsFive auctions active in KY350 vendors selling in
2008, 700+ in 2010Growing in KY, OH, MO,
PARegional information on
“wholesale” pricesBuyers primarily resellersAttracting order buyers
from larger marketsPrice reports help buyers
and sellers
Agricultural Economics

U.S. Farm Markets and Direct Market SalesVegetables & Melons
Source: Census of Agriculture, various years; USDA-AMS 2010
$ m
illio
n
Agricultural Economics

Kentucky Direct Market Sales
Source: Census of Agriculture, various years
Million $
Source: KDA and UK estimates

Kentucky Farm Markets
Source: KDA and UKAgricultural Economics

On-Farm Retail Markets
2010 – 107 registered markets
Agricultural Economics

Kentucky CSA’s• 35 CSAs in 2009, 41 in 2010• Average share size: 60• Most fairly new
– 74% started since 2002
• Most offer ½ shares ($275)• Full share average $508• Only a few offer
shareholder work discounts
Agricultural Economics

Number of Wineries 2008State 1993 2003 2006 2008KY 0 4 31 40TN 7 15 21 25AR 2 4 4 5MO 10 22 56 56IL 7 23 63 40OH 7 26 76 77VA 6 25 107 81WV 1 2 14 13PA 16 31 104 102MD 5 5 12 21NC 3 16 54 45IN 5 17 30* 36
Source: State Departments of Agriculture and weekendwinery.com
Continues to increase:KY 2010: 66 Wineries
Agricultural Economics

Agricultural Economics

Sales to Restaurants
• Rapid growth in KDA Restaurant Rewards program
• 2008: 35 institutions• 2010: 100+
Agricultural Economics

Organic Produce?
• Broader interest in organic food• 20% annual growth for last 10 years
– $14 B 2005– $21 B 2008– $24.8 B in 2009
• Organic food sales channels (08/10):– 47%/54% Conventional Supermarkets– 44%/40% Natural Food Stores– 9%/6% Direct Marketed
• Fresh produce accounts for 42%/38% of all organic food sales• 1/3 of organic produce sold under contract• Trend towards larger growers & direct to retailer sales• Still tiny in KY: 111 farms (all products)
Sources: Dimitri & Greene, 2002; USDA ERS-Oberholtzer, Dimitri & Greene, 2005; Organic Trade Assoc., 2004; Tondel & Woods, 2006; Greene et al 2009; Greene at al, 2010, Food Facts – Organic Trade Assoc. June, 2010. Agricultural Economics

Value of KY Hort Crops Total
Agricultural Economics
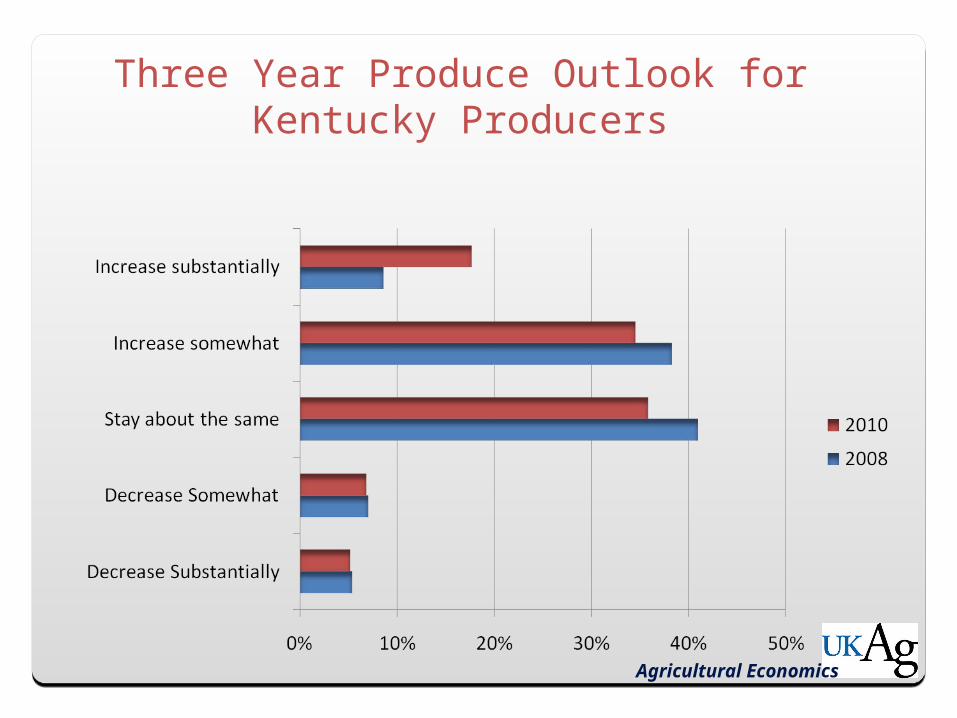
Three Year Produce Outlook for Kentucky Producers
Agricultural Economics
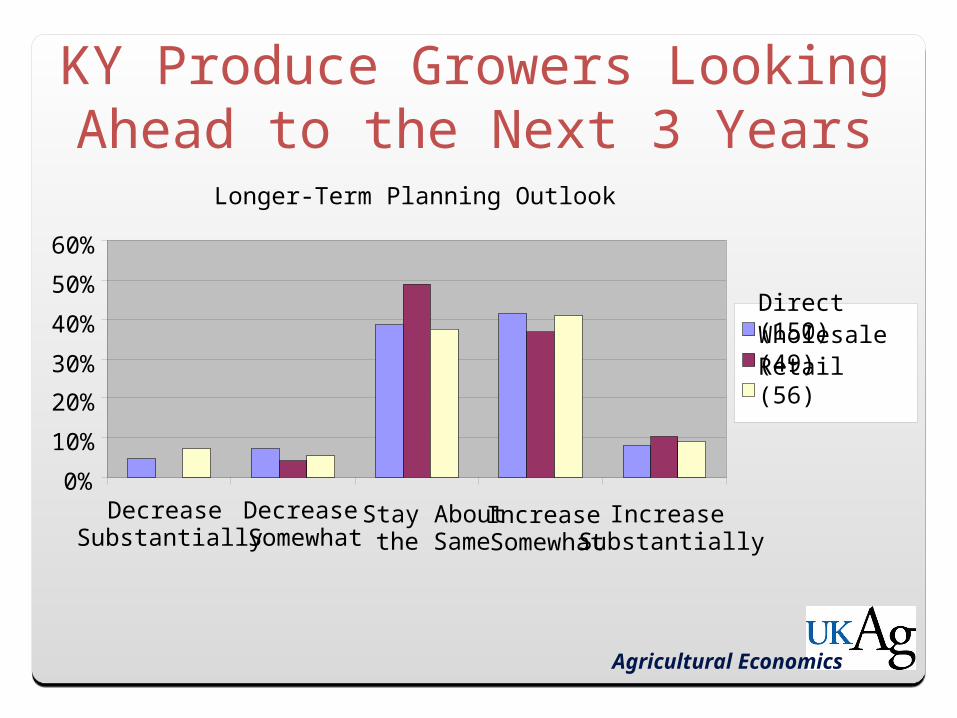
KY Produce Growers Looking Ahead to the Next 3 Years
0%
10%
20%
30%
40%
50%
60%
DecreaseSubstantially
DecreaseSomewhat
Stay Aboutthe Same
IncreaseSomewhat
IncreaseSubstantially
Direct (150)Wholesale (49)Retail (56)
Longer-Term Planning Outlook
Agricultural Economics