tilburg university trends in cost of major eye diseases to ... · pdf filediagnosis of amd,...
TRANSCRIPT

Tilburg University
Trends in cost of major eye diseases to medicare, 1991 to 2000
Salm, Martin; Belsky, D.; Sloan, F.A.
Published in:American Journal of Ophthalmology
Publication date:2006
Link to publication
Citation for published version (APA):Salm, M., Belsky, D., & Sloan, F. A. (2006). Trends in cost of major eye diseases to medicare, 1991 to 2000.American Journal of Ophthalmology, 142(6), 976-982.
General rightsCopyright and moral rights for the publications made accessible in the public portal are retained by the authors and/or other copyright ownersand it is a condition of accessing publications that users recognise and abide by the legal requirements associated with these rights.
- Users may download and print one copy of any publication from the public portal for the purpose of private study or research - You may not further distribute the material or use it for any profit-making activity or commercial gain - You may freely distribute the URL identifying the publication in the public portal
Take down policyIf you believe that this document breaches copyright, please contact us providing details, and we will remove access to the work immediatelyand investigate your claim.
Download date: 24. May. 2018
●
ecp●
gm●
LMNpM●
wU2cb●
cMpOI
ErmpewpV
A
AH
Cf
9
Trends in Cost of Major Eye Diseases toMedicare, 1991 to 2000
MARTIN SALM, MA, DANIEL BELSKY, BA, AND FRANK A. SLOAN, PHD
ticht
hMMorcflcehSwa
cluRbcomcatbt
T
tCU
PURPOSE: To estimate impacts of physician-diagnosedye diseases (age-related macular degeneration (AMD),ataract, diabetic retinopathy, and glaucoma) on Medicareayments in the periods 1991 to 1995 and 1996 to 2000.DESIGN: A retrospective cohort study to estimate pro-
ram payments per capita and in total for each of theajor eye diseases and the four eye diseases in total.METHODS: Data from the 1994 and 1999 Nationalong-Term Care Survey (NLTCS) and medical claims toedicare from 1991 to 2000 were merged with theLTCS. Medicare payments for eye-related procedures on
ersons with and without major eye diseases as reported onedicare claims and self-reported data from NLTCS.RESULTS: Overall, the burden of major eye diseasesas to increase Medicare spending by $4.8 billion (1999SD) in 1991 to 1995 and by $4.5 billion in 1996 to000. The most expensive eye disease was cataract,osting Medicare $3.8 billion in 1991 to 1995 and $3illion in 1996 to 2000.CONCLUSIONS: Prevalence of major eye diseases in-
reased over time, but the effect of major eye diseases onedicare payments decreased, mainly as a result of lower
ayments for cataract surgery in the later years. (Am Jphthalmol 2006;142:976–982. © 2006 by Elsevier
nc. All rights reserved.)
YE DISEASE DISPROPORTIONATELY AFFECTS THE EL-
derly, who account for more than half of the personsvisiting ophthalmologists.1 The population is aging
apidly, with the number of persons aged 65� expected toore than double from 2000 levels by 2035.2 As the
opulation ages, overall spending on health care services isxpected to rise as a consequence.3–6 Increased spendingill almost inevitably lead to further pressures to reducerivate and public personal health care expenditures.ision care will be no exception. Accurate information on
Supplemental Material available at AJO.com.ccepted for publication Jul 28, 2006.From the University of Mannheim, Institute for the Economics ofging, Mannheim, Germany (M.S.), and the Duke University Center forealth Policy, Durham, North Carolina (D.B., F.A.S.).Inquiries to Frank A. Sloan, PhD, Box 90253, 114 Rubenstein Hall,
menter for Health Policy, Duke University, Durham, NC 27708; e-mail:
© 2006 BY ELSEVIER INC. A76
he costs of eye diseases principally responsible for visualmpairment, age-related macular degeneration (AMD),ataract, diabetic retinopathy (DR), and glaucoma, andow such costs are changing over time will be important tohe decision-making process.
Previous studies of the cost of eye disease to Medicareave focused on a single disease,7,8 and some have usededicare data from secondary sources.8,9 One study10 usededicare data more than 20 years old to evaluate the cost
f all ophthalmic surgery. There is more as well as moreecent information on the cost of eye care in otherountries;11–23 however, these studies rely on small samplesrom few clinical settings or estimates of disease preva-ence, sometimes combined with a projected or modeledourse of illness, to calculate costs, and they typicallyxamine only one disease. Clinical samples from only aandful of hospitals present problems for generalization.tudies of single diseases have excluded costs associatedith comorbid eye diseases. Most importantly, none of thebove studies documents trends in costs.
This study estimates the costs to Medicare of AMD,ataract, DR, and glaucoma on the basis of a nationalongitudinal sample of Medicare beneficiaries followed forp to 10 years. It includes costs of common joint diagnoses.ather than summing procedure costs, we estimated costsy calculating counterfactuals—costs incurred by Medi-are beneficiaries who were identical on a number ofbservable characteristics but were not diagnosed with aajor eye disease. In this way, we avoided attribution of
osts for procedures that would also have been used inbsence of the study diagnoses. The total annual cost ofhe four eye diseases to Medicare in 1996 to 2000 was $6.7illion (1999 USD), less than such annual costs for 1991o 1995, which were $7.4 billion (1999 USD).
METHODS
HE SAMPLE CONSISTED OF MEDICARE BENEFICIARIES PAR-
icipating in the 1994 and/or 1999 National Long-Termare Survey (NLTCS), a national household survey of theS elderly, and Medicare claims and enrollment data,
erged with the NLTCS. This study was conducted withLL RIGHTS RESERVED. 0002-9394/06/$32.00doi:10.1016/j.ajo.2006.07.057

itbcpwnp1va1stbwtdeMepdMNs
pcaBMgCScdsP
tIv
fmCaMr
owtyfi
OtttcwsTfinpiifi
nGchDwapdMstipwatt
capfcswAatcpiAicewdA
V
ntuitional review board approval. The sample frame forhe NLTCS is a national random sample of Medicareeneficiaries aged 65� years. In 1994, the NLTCS sampleonsisted of 19,171 persons. For respondents in this sam-le, we used information on all years from 1991 to 1995 forhich Medicare payment data were available. The totalumber of person-year observations for the 1991 to 1995eriods was 80,488. The 1999 NLTCS sample consisted of9,079 persons which included both respondents inter-iewed in 1994 who survived to the 1999 survey and weredded to the randomly selected sample from which the999 NLTCS sample was drawn, as well as about 5,000ample persons who turned 65 between 1994 and 1999. Forhe 1996 to 2000 sample, we used information on all yearsetween 1996 and 2000 for which Medicare payment dataere available. The total number of person-year observa-
ions for the 1996 to 2000 period was 74,477. Paymentata are not reported in Medicare claims for beneficiariesnrolled in Medicare risk plans. Persons enrolled in aedicare risk plan for more than six months in a year were
xcluded from our analysis. Medicare enrollment filesrovided data on demographic information, dates of firstiagnosis of AMD, cataract, DR, and glaucoma, andedicare payments made on behalf of sample persons. TheLTCS provided information on nursing home residence
tatus, race, and years of education.Diagnosis of AMD, cataract, DR, and glaucoma were
rovider coded and identified from ICD-9-CM diagnosisodes (codes listed in Supplementary Appendix A avail-ble at AJO.com). By using Medicare claims files from Part
and outpatient physician visits, we estimated annualedicare payments related to AMD, cataract, DR, and
laucoma for each person in each year, on the basis ofPT24–29 or ICD-930–32 procedure codes in vision care (seeupplementary Appendices B and C available at AJO.om). All payments were converted to constant 1999 USollars by multiplying nominal payments with the Con-umer Price Index in 1999, and dividing by the Consumerrice Index for the current year.We imputed values for missing data on years of educa-
ion and race by using a sequence of regression models.33
mputations were obtained by means of imputation andariance estimation software.34
We used linear regression to estimate the effects of theour major eye diseases on Medicare payments. We esti-ated separate regression models (Stata 8.0, StataCorp,ollege Station, Texas, USA) for the 1991 to 1995 periods
nd 1996 to 2000 periods. The dependent variable wasedicare payment for a beneficiary per year for vision care
elated to the four diseases.For the cost analysis for each disease, we included a set
f independent variables; separate variables indicatedhether the observation was in the year of first diagnosis,
he year after first diagnosis, years 3 and 4 of diagnosis, orear 5� after diagnosis. The count of number of years after
rst diagnosis started in the year of first diagnosis (year 1). pTRENDS IN COST OF MAJOR EYE DISEASOL. 142, NO. 6
nce a sample person was diagnosed with an eye disease,he person was assumed to have the disease for the rest ofhe observational period or for life. We also controlled forhe effects of joint diagnoses of the most common types:ataract and glaucoma, and cataract and AMD. Personsith a joint diagnosis had a diagnosis of both conditions at
ome time in the past, not necessarily at the same date.he date of a joint diagnosis was defined as the time of therst diagnosis for either disease. Medicare claims data didot report information on diagnosis before 1991; thus,atients with a first diagnosis before 1991 could only bedentified as having first been diagnosed in 1991. Wencluded an independent identifying variable for personsrst diagnosed in 1991 for each disease.We also controlled for age, gender (male), race (white vs
onwhite), years of education, and the Diagnostic Costroup (DxCG, Inc, Boston, Massachusetts, USA) score
omputed from the diagnoses and procedures the beneficiaryad in the previous year, except for the eye diseases.34 ThexCG score is a comprehensive measure of overall health,hich is predictive of future health care spending on behalf ofn individual. The DxCG score was calculated for eacherson for every year from 1991 to 2000 and was based oniagnosis and procedure codes recorded on sample persons’edicare claims in the previous year (DxCG risk adjustment
oftware, analytic guide release 6.0). In addition, we con-rolled for nursing home residency and the number of monthsn the current year a person was enrolled in a Medicare risklan. In our estimation procedure, observations wereeighted to reflect the elderly Medicare population in 1994nd 1999, respectively. We estimated robust standard errorshat allow for a possible correlation in Medicare payments forhe same person in different years.
We used a counterfactual approach to calculate Medi-are payments attributable to AMD. A counterfactualpproach aims to compare payments on behalf of sampleersons, who except for not having a diagnosis of AMD,or example, are identical to AMD patients. These personsould be called “AMD patients without an AMD diagno-is.” Once we calculated the costs for an “AMD patientithout AMD,” we calculate the costs attributable toMD as the difference in cost for the actual AMD patient
nd the “AMD patient without AMD”. This counterfac-ual design differs from previous approaches that simplyalculate cost for procedures used on behalf of AMDatients without employing a control group of otherwisedentical patients. Calculating total costs incurred byMD patients includes costs patients might have incurred
n the absence of the diagnosis, for example for the care ofomorbidities not related to AMD or for routine eyexams. Without controlling for the costs AMD patientsould have incurred had they not suffered from theisease, previous estimates inadvertently attribute costs toMD that are more properly attributed to other reasons.We used the same approach to calculate mean annual
ayments per Medicare beneficiary attributable to the three
ES TO MEDICARE, 1991 TO 2000 977

oc1waadtN
s
M
v$e1cwtccdtfcgs
mrew
e1Ay1qM1asm2oMbT$oM11d
pP
endic
9
ther eye diseases, and all four eye diseases combined. Weomputed the burden of eye diseases separately for 1991 to995 and 1996 to 2000. In our calculations, observations wereeighted to reflect the elderly Medicare population in 1994nd 1999, respectively. To calculate total program paymentsttributable to each of the four eye diseases and to all fouriseases combined, we multiplied per beneficiary payments byhe number of aged Medicare beneficiaries in the year of theLTCS survey (1994 and 1999).We used a sample of 200 bootstrap runs to calculate
tandard errors of mean payments.
RESULTS
EAN ANNUAL PAYMENT PER MEDICARE BENEFICIARY FOR
ision care (in 1999 USD) was $236 during 1991 to 1995 and202 during 1996 to 2000 (Table 1). The eye diseasesxamined in this study were quite common. In the 1991 to995 period, 3.4% of sample persons had a Medicare claimontaining a diagnosis of AMD in the current year, 23.8%ith cataract, 0.8% with DR, and 6.9% with glaucoma. A
otal of 1.1% of sample persons had a diagnosis of bothataract and AMD, and 2.3% had both cataract and glau-oma. In 1996 to 2000, diagnosis rates were higher for alliseases; the share of persons with a diagnosis of eye disease inhe current year was 4.5% for AMD, 26.2% for cataract, 1.3%or DR, 8.5% for glaucoma, 2.6% for a joint diagnosis ofataract and glaucoma, and 1.3% for a joint diagnosis oflaucoma and AMD. In 1991 to 1995, the mean age in the
TABLE 1. Characteristics of Medicare Beneficiaries Partic
Characteristic
Medicare payment for vision care† (in 1999 USD) 2
Fraction of claims in year with recorded diagnosis of
AMD
Cataract
Diabetic retinopathy
Glaucoma
Cataract and AMD
Cataract and glaucoma
Age
Male gender
White
Years of education
DxCG score
Nursing home resident
Months enrolled in risk plan
Observations 80,4
AMD � age-related macular degeneration; DxCG � diagnostic c
*Sample means account for population weights.†Payment on behalf of procedure and device codes listed in App
ample was 73.8 years; 42.5% of sample beneficiaries were i
AMERICAN JOURNAL OF78
en; 85.5% were white; and 4.5% were nursing homeesidents. On average, the beneficiaries had 11.1 years ofducation. In 1996 to 2000, mean age was 74.4 years; 88.9%ere white; and nursing home residency decreased to 4.0%.Although there are some differences in the parameter
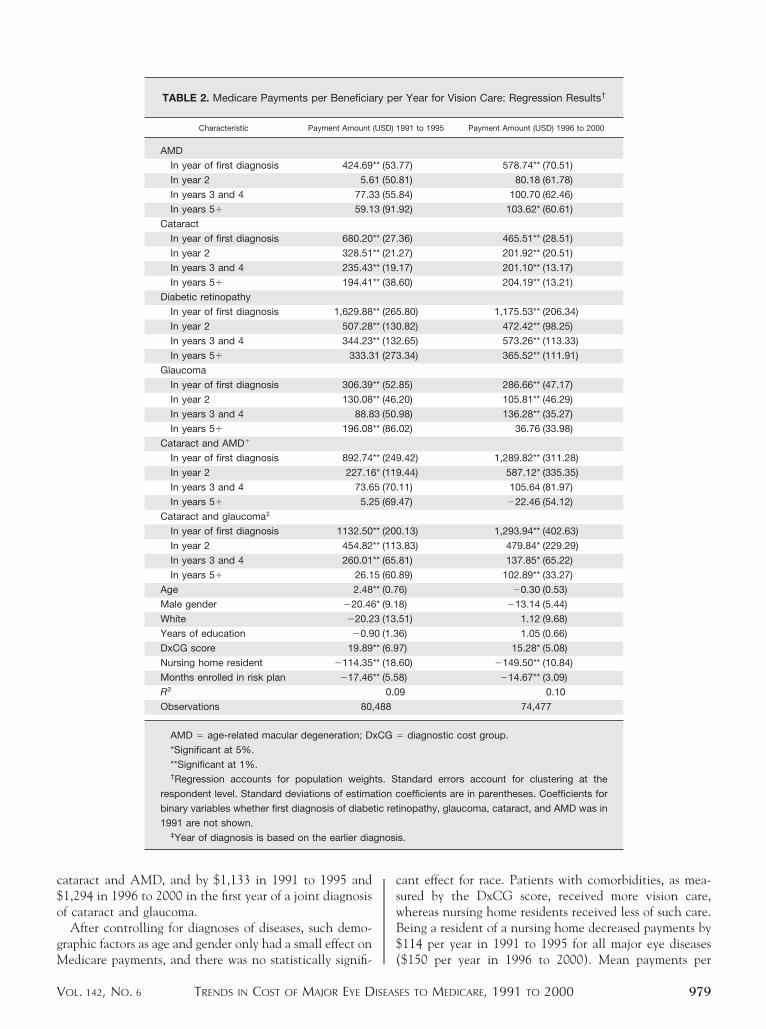
stimates, patterns in key variables are similar between991 to 1995 and 1996 to 2000 (Table 2). A diagnosis ofMD increased Medicare payments (1999 USD) in the
ear of first diagnosis by $425 in 1991 to 1995 and $579 in996 to 2000. The rise in Medicare payments in subse-uent years was lower. A diagnosis of cataract increasededicare payments in the year of diagnosis by $680 in
991 to 1995 and by $466 in 1996 to 2000. The effect ofcataract diagnosis on Medicare payments were lower in
ubsequent years, but in years 5� of the diagnosis, pay-ents were still $194 in 1991 to 1995 and $204 in 1996 to
000. Among the four eye diseases, those with a diagnosisf DR had the highest spending per diagnosed person.edicare payments in the year of diagnosis were increased
y $1,630 in 1991 to 1995 and $1,176 in 1996 to 2000.he effect on payments in subsequent years decreased to333 in 1991 to 1995 ($366 in 1996 to 2000) in years 5�f the diagnosis. A diagnosis of glaucoma increased ofedicare payments by $306 in 1991 to 1995, and $287 in
996 to 2000 in the year of first diagnosis and by $196 in991 to 1995 and $37 in 1996 to 2000 in year 5� of theiagnosis.There were important interaction effects of Medicare
ayments for both glaucoma and AMD with cataract.ayments were increased by $893 in 1991 to 1995 ($1,290
g in 1994 and/or 1999 National Long-Term Care Survey
1991 to 1995 Period 1996 to 2000 Period
SD Mean* SD
1327.6 201.66 963.70
4 0.209 0.045 0.238
8 0.453 0.262 0.460
8 0.096 0.013 0.115
9 0.280 0.085 0.304
1 0.123 0.013 0.136
3 0.171 0.026 0.175
5 7.674 74.410 8.141
5 0.484 0.426 0.485
5 0.318 0.889 0.290
7 3.656 11.163 3.674
9 0.885 0.841 1.063
5 0.266 0.040 0.240
8 0.003 0.102 0.004
74,477
roup; SD � standard deviation; USD � United States dollars.
es B and C (available at AJO.com).
ipatin
Mean*
36.37
0.03
0.23
0.00
0.06
0.01
0.02
73.83
0.42
0.85
11.15
0.71
0.04
0.04
88
ost g
n 1996 to 2000) in the first year of a joint diagnosis of
OPHTHALMOLOGY DECEMBER 2006
c$o
gM
cswB$
gnosi
V
ataract and AMD, and by $1,133 in 1991 to 1995 and1,294 in 1996 to 2000 in the first year of a joint diagnosisf cataract and glaucoma.After controlling for diagnoses of diseases, such demo-
raphic factors as age and gender only had a small effect on
TABLE 2. Medicare Payments per Beneficia
Characteristic Payment Amount
AMD
In year of first diagnosis 424.69
In year 2 5.6
In years 3 and 4 77.3
In years 5� 59.1
Cataract
In year of first diagnosis 680.20
In year 2 328.51
In years 3 and 4 235.43
In years 5� 194.41
Diabetic retinopathy
In year of first diagnosis 1,629.88
In year 2 507.28
In years 3 and 4 344.23
In years 5� 333.3
Glaucoma
In year of first diagnosis 306.39
In year 2 130.08
In years 3 and 4 88.8
In years 5� 196.08
Cataract and AMD�
In year of first diagnosis 892.74
In year 2 227.16
In years 3 and 4 73.6
In years 5� 5.2
Cataract and glaucoma‡
In year of first diagnosis 1132.50
In year 2 454.82
In years 3 and 4 260.01
In years 5� 26.1
Age 2.48
Male gender �20.46
White �20.2
Years of education �0.9
DxCG score 19.89
Nursing home resident �114.35
Months enrolled in risk plan �17.46
R2
Observations 80,
AMD � age-related macular degeneration; D
*Significant at 5%.
**Significant at 1%.†Regression accounts for population weigh
respondent level. Standard deviations of estima
binary variables whether first diagnosis of diabe
1991 are not shown.‡Year of diagnosis is based on the earlier dia
edicare payments, and there was no statistically signifi- (
TRENDS IN COST OF MAJOR EYE DISEASOL. 142, NO. 6
ant effect for race. Patients with comorbidities, as mea-ured by the DxCG score, received more vision care,hereas nursing home residents received less of such care.eing a resident of a nursing home decreased payments by114 per year in 1991 to 1995 for all major eye diseases
r Year for Vision Care: Regression Results†
991 to 1995 Payment Amount (USD) 1996 to 2000
77) 578.74** (70.51)
81) 80.18 (61.78)
84) 100.70 (62.46)
92) 103.62* (60.61)
36) 465.51** (28.51)
27) 201.92** (20.51)
17) 201.10** (13.17)
60) 204.19** (13.21)
.80) 1,175.53** (206.34)
.82) 472.42** (98.25)
.65) 573.26** (113.33)
.34) 365.52** (111.91)
85) 286.66** (47.17)
20) 105.81** (46.29)
98) 136.28** (35.27)
02) 36.76 (33.98)
.42) 1,289.82** (311.28)
.44) 587.12* (335.35)
11) 105.64 (81.97)
47) �22.46 (54.12)
.13) 1,293.94** (402.63)
.83) 479.84* (229.29)
81) 137.85* (65.22)
89) 102.89** (33.27)
6) �0.30 (0.53)
8) �13.14 (5.44)
51) 1.12 (9.68)
6) 1.05 (0.66)
7) 15.28* (5.08)
60) �149.50** (10.84)
8) �14.67** (3.09)
9 0.10
74,477
diagnostic cost group.
tandard errors account for clustering at the
oefficients are in parentheses. Coefficients for
inopathy, glaucoma, cataract, and AMD was in
s.
ry pe
(USD) 1
** (53.
1 (50.
3 (55.
3 (91.
** (27.
** (21.
** (19.
** (38.
** (265
** (130
** (132
1 (273
** (52.
** (46.
3 (50.
** (86.
** (249
* (119
5 (70.
5 (69.
** (200
** (113
** (65.
5 (60.
** (0.7
* (9.1
3 (13.
0 (1.3
** (6.9
** (18.
** (5.5
0.0
488
xCG �
ts. S
tion c
tic ret
$150 per year in 1996 to 2000). Mean payments per
ES TO MEDICARE, 1991 TO 2000 979

Mf3dibt$aaa
cvTmtcbfd1
T
bt1s12dhrR
sto(
ivtsrbttb
1tsIipioci
fyrnpftfiat
9
edicare beneficiary for eye disease–related care decreasedrom $227 in 1991 to 1995 to $197 in 1996 to 2000 (Table). Total annual Medicare payments for all four eyeiseases were $7.4 billion in 1991 to 1995 and $6.7 billionn 1996 to 2000, with the largest reduction in paymentseing for cataract; annual Medicare payments attributableo cataract declined from $6.1 billion in 1991 to 1995 to4.8 billion per year in 1996 to 2000. Annual paymentsttributable to glaucoma were $1.3 billion in 1991 to 1995nd $1.2 billion in 1996 to 2000. Such payments for AMDnd DR were substantially lower than this.
Future Medicare payments for vision care depend on twoomponents: (1) the future mean per-beneficiary payment forision care, and (2) the number of Medicare beneficiaries.he aged Medicare population is predicted to grow to 38.2illion in 2010 and 43.8 million in 2015.2 The future
rajectory of per-beneficiary Medicare payments for visionare is unknown. However, if the trend of declining per-eneficiary payments were to continue (linearly) into theuture, total annual Medicare payments for vision care wouldecline to $5.0 billion in 2010 and to $4.4 billion in 2015 (in999 USD).
DISCUSSION
OTAL MEDICARE PAYMENTS FOR VISION-RELATED CARE ON
ehalf of persons with the four major eye diseases amountedo from $6.5 to $7.5 billion (1999 USD) annually during the990s, or about 4% of total Medicare payments overall. Inpite of the growth of the age 65� population during the990s, a trend which is expected to continue throughout the1st century, four total Medicare payments in 1999 USollars actually were lower in the second half than in the firstalf of the 1990s. This largely reflects reductions in Medicareeimbursement rates for cataract care.35,36 Institution of the
TABLE 3. Medicare Payments for V
Payments Attributable To:*
Payments per Medicare Benefici
(in 1999 USD)
1991 to 1995 1996
AMD 15.98 (2.47) 21.6
Cataract 187.25 (6.21) 140.0
Diabetic retinopathy 11.51 (1.86) 17.3
Glaucoma 38.26 (4.18) 36.3
All four diseases 226.65 (7.97) 196.6
AMD � age-related macular degeneration; USD � United States
*Standard errors are in parentheses.†Difference between mean predicted payments with actual preva
prevalence of disease.‡Calculated as payments attributable to disease per Medicare be
1999, respectively.
esource-Based Relative Value Scale (RBRVS) let to a e
AMERICAN JOURNAL OF80
ubstantial drop in reimbursement rates. Reimbursement forhe most commonly coded cataract surgery declined through-ut the decade from $1,092 (1999 USD) in 1991 to $5361999 USD) by 2000.
By contrast, payment for care of beneficiaries with AMDncreased during the period. Photodynamic and anti–ascular endothelial growth factor therapies, the principalreatments for AMD, were introduced after the period ourtudy examines. The increase in costs we documented mayeflect higher utilization of general eye care services byeneficiaries with AMD as well as an increase in rates ofhermal laser treatment. After the introduction of newechnologies and drugs treating AMD, such payments maye expected to increase further.Medicare payments attributable to DR rose over the
990s. There are several possible explanations for thisrend. Attention to ophthalmologic evaluation andcreening of diabetics increased over the study period.37–39
n addition, introduction in the later 1990s of coding forndocyanine green angiography as a diagnostic27 and laserhotocoagulation as a treatment28 likely contributed toncreasing payments. Payments for glaucoma were stablever time. But importantly, until 2006, Medicare did notover the cost of prescription drugs, which are particularlymportant for treatment of glaucoma.
Our study differs from previous research on this topic inour major respects. First, patients were followed for severalears in our study. For all four diseases, there were substantialeductions in Medicare payments as time since initial diag-osis increased. For some diseases, in particular AMD, thisattern plausibly reflects limits in effective therapies, whereasor others, such as cataract, lower payments probably reflecthe existence of effective therapy. Second, rather than con-ne the analysis to a single disease, our analysis incorporatedll four major eye diseases affecting the elderly population. Forhe more prevalent diseases, our analysis allowed for cost
Care: Burden of Illness Estimates
Total Program Payments‡ (in Millions of 1999 USD)
0 1991 to 1995 1996 to 2000
8) 524.12 (81.07) 733.25 (74.21)
5) 6,141.61 (203.75) 4,751.70 (184.956)
2) 377.52 (61.17) 589.72 (55.24)
7) 1,254.89 (137.36) 1,232.04 (87.34)
7) 7,432.24 (261.44) 6,672.53 (253.734)
rs.
of disease and counterfactual mean predicted payments with zero
iary times the number of aged Medicare beneficiaries in 1994 and
ision
ary†
to 200
1 (2.1
4 (5.4
8 (1.6
1 (2.5
5 (7.4
dolla
lence
nefic
ffects when two diseases coexist. Joint diagnoses resulted in
OPHTHALMOLOGY DECEMBER 2006

fccfccsp
saedmcosOtp
auS(Sg(apyheatgtdi
rtdtao
oMtwivnff
plchasrodePbtdwtaam
TITcrImo
V
ar greater additional costs. Third, in disease costing, it isommon not to have a control group. By contrast, our resultsontrolled for what cost would have been absent the diagnosisor the eye disease. Our estimates reflected the difference inosts between persons with and without the diagnosis afterontrolling for all other characteristics. Fourth, the sampleizes were both national and larger than those used inrevious studies.
Our estimates of costs to Medicare for care of cataract areomewhat higher than the $4 billion (1999 USD) reported in
previous study,41 even when one accounts for the differ-nces in study years. The difference may be attributable toifferences in the methodologies of the two studies. Weeasured costs to Medicare from the date of first diagnosis. By
ontrast, the $4 billion estimate in the other study includedphthalmologic services obtained within a time windowtarting from 90 days before surgery to four years after surgery.ur estimates included a period of watchful waiting as well as
he time around surgery and, for some sample persons, aeriod of time extending several years after surgery.
One previous study, examining costs of primary open-anglend exfoliation glaucomas, a narrower definition than the onesed in our study, at 12 hospitals in the United States andweden estimated two-year costs at $2,371 and $2,428 in 19941999 USD) in the United States and Sweden, respectively.15
tudies in other countries found mean annual costs forlaucoma patients of $280 to $423 (Canada, 2001),14 $594The Netherlands, 1996),21 $447 (France, 1991 to 1994),15
nd $705 (United Kingdom, 1991 to 1994).15 Examining allatients with diagnoses of glaucoma, as we did, unsurprisinglyields lower average estimates of charges than do studies ofospital populations,16,21 or including only patients withxtensive follow-up.14 In the case of the results from Francend the United Kingdom, the study sites might have tendedo include service providers treating more severe glaucomasiven the study’s focus on examining the cost of new drugherapies. Further, none of these studies used a counterfactualesign, raising the possibility that some of the treatment costsncluded were for procedures unrelated to glaucoma.
A previous study of the costs associated with severe DResulting in blindness estimated the per person annual costo Medicare and Medicaid in 1990 at $49,899 (costs areerived from previously published estimates43). In additiono focusing on the most expensive cases of the disease, theuthors also included drug costs, which were excluded inur study.We acknowledge several limitations in our study. First,
ur analysis only included costs of care incurred byedicare. Most importantly, we did not include prescrip-
ion drug expense, which, during the observational period,as excluded from Medicare coverage. Second, we did not
nclude such intangible costs as those associated with lowision or blindness. Although such outcomes are fortu-ately uncommon, they are costly to patients and their
amilies when they do occur. More frequent are losses in
unctional status attributable to impaired vision in elderlyTRENDS IN COST OF MAJOR EYE DISEASOL. 142, NO. 6
opulations.44 Third, observed changes in disease preva-ence and treatment utilization may reflect changes inoding practices. Particular diagnoses or treatments mayave become more or less common over the study period asresult of issues unrelated to disease prevalence or severity,
uch as improved diagnostic testing, increased coding as aesult of audit pressures, or the introduction of new billingr claims software. Fourth, technological change is aynamic process, as is third-party payment policy. Thexperience of the 1990s may not be repeated in future years.hasing in of the RBRVS greatly altered Medicare reim-ursement for certain treatments. In particular, the costrends for cataract may not be repeated for technologieseveloped to treat the other eye diseases, many of whichere introduced well after the RBRVS. Finally, our coun-
erfactual design does not ensure that our control group isperfect match. Our estimation is valid only under the
ssumption that we could control for all important deter-inants of payments.40–42
HIS STUDY WAS SUPPORTED IN PART BY THE NATIONALnstitute on Aging, Bethesda, Maryland, Grant 1RO1-AG-17473-01A1.he authors indicate no financial conflict of interest. Involved inollection, management, analysis and interpretation of data, and prepa-ation of the data and revision including references (M.S., F.A.S.);nvolved in collection of data (M.S., F.A.S.); and involved in manage-ent, statistical analysis and interpretation of the data, and preparation
f the manuscript (M.S., D.B., F.A.S.).
REFERENCES
1. Javitt JC, Chiang YP. Preparing for managed competition:utilization of ambulatory eye care visits to ophthalmologists.Arch Ophthalmol 1993;111:1034–1035.
2. Boards of Trustees; Federal Hospital Insurance and FederalSupplementary Medical Insurance Trust Funds. 2005 AnnualReport of the Boards of Trustees, Federal Hospital Insuranceand Federal Supplementary Medical Insurance Trust Funds.URL: http://www.cms.hhs.gov/ReportsTrustFunds/downloads/tr2005.pdf. Access Date: August 15, 2006.
3. Seshamani M, Gray A. Health care expenditures and aging:an international comparison. Appl Health Econ HealthPolicy 2003;2:9–16.
4. Stearns SC, Norton EC. Time to include time to death? Thefuture of health care expenditure predictions. Health Econ2004;13:315–327.
5. Steinman L, Tesler H, Zweifel P. The impact of aging onfuture healthcare expenditure. Working paper 0510, Socio-economic Institute, University of Zurich 2005, Forthcoming.
6. Zweifel P, Felder S, Meiers M. Aging of population andhealth care expenditure: a red herring? Health Econ 1999;8:485–496.
7. Steinberg EP, Bergner M, Sommer A, et al. Variations incataract management: patient and economic outcomes.Health Serv Res 1990;25:727–731.
8. Javitt JC, Canner JK, Sommer A. Cost-effectiveness ofcurrent approaches to the control of retinopathy in type I
diabetics. Ophthalmology 1989;96:255–264.ES TO MEDICARE, 1991 TO 2000 981

1
1
1
1
1
1
1
1
1
1
2
2
2
2
2
2
2
2
2
2
3
3
3
3
3
3
3
3
3
3
4
4
4
4
4
9
9. Javitt JC, Aiello PL, Chiang Y, Ferris FL, Canner JK,Greenfield S. Preventive eye care in people with diabetes iscost-saving to the federal government. Implications forhealth-care reform. Diabetes Care 1994;17:909–917.
0. Frenkel M. Analysis of ophthalmic surgical charges forservices to Medicare recipients: 1980–1985. Arch Ophthal-mol 1989;107:1132–1134.
1. Bernth-Petersen P. Outcome of cataract surgery, IV: socio-economic aspects. Acta Ophthalmol (Copenh) 1982;60:461–468.
2. Bonastre J, Le Pen C, Soubrane G, Quentel G. The burdenof age-related macular degeneration: results of a cohort studyin two French referral centers. Pharmacoeconomics 2003;21:181–190.
3. Calissendorff BM. Costs of medical and surgical treatment ofglaucoma. Acta Ophthalmol Scand 2001;79:286–288.
4. Iskedjian M, Walker J, Civente C, et al. Cost of glaucoma inCanada: analysis based on visual field and physician’s assess-ment. J Glaucoma 2003;12:456–462.
5. Kobelt G, Jönsson L. Modeling cost of treatment with newtopical treatments for glaucoma: results from France and theUnited Kingdom. Int J Technol Assess Health Care 1999;15:207–219.
6. Kobelt-Nguyen G, Gerdtham UG, Alm A. Costs of treatingprimary open-angle glaucoma and ocular hypertension: aretrospective, observational two-year chart review of newlydiagnosed patients in Sweden and the United States. JGlaucoma 1998;7:95–104.
7. Matz H, Falk M, Gottinger W, Kieselbach G. Cost-benefitanalysis of diabetic eye disease. Opthalmologica 1996;210:348–353.
8. Chou SL, Misajon R, Gallo J, Keeffe JE. Measurement ofindirect costs for people with vision impairment. Clin ExpOphthalmol 2003;31:336–340.
9. Meads C, Hyde C. What is the cost of blindness? Br JOphthalmol 2003;87:1201–1204.
0. Muralikrishnan R, Venkatesh R, Prajna NV, Frick KD.Economic cost of cataract surgery procedures in an estab-lished eye care centre in Southern India. Ophthalmic Epi-demiol 2004;11:369–380.
1. Oostenbrink JB, Rutten-van Molken MP, Sluyter-OpenoordtTS. Resource use and costs of patients with glaucoma or ocularhypertension: a one-year study based on retrospective chartreview in the Netherlands. J Glaucoma 2001;10:184–191.
2. Smith AF. The economic impact of ophthalmic services forpersons with diabetes in the Canadian province of NovaScotia: 1996–1996. Ophthalmic Epidemiol 2001;8:13–25.
3. Wang J, Chew PT. What is the direct cost of treatment ofprimary angle closure glaucoma? The Singapore model. ClinExp Opthalmol 2004;32:578–583.
4. American Medical Association. Current procedural terminol-ogy, 1991 (CPT 1991). Chicago, Illinois: American MedicalAssociation Press, 1990.
5. American Medical Association. Current procedural termi-nology, 1995 (CPT 1995). Chicago, Illinois: AmericanMedical Association Press, 1994.
6. American Medical Association. Current procedural termi-nology, 1996 (CPT 1996). Chicago, Illinois: American
Medical Association Press, 1995.AMERICAN JOURNAL OF82
7. American Medical Association. Current procedural termi-nology, Professional Edition, 1997 (CPT 1997). Chicago,Illinois: American Medical Association Press, 1996.
8. American Medical Association. Current procedural termi-nology, Professional Edition,1998 (CPT 1998). Chicago,Illinois: American Medical Association Press, 1997.
9. American Medical Association. Current procedural termi-nology, Professional Edition,1999 (CPT 1999). Chicago,Illinois: American Medical Association Press, 1998.
0. American Medical Association. International classificationof diseases, 9th revision, clinical modification, 1983(ICD-CM 1983). Chicago, Illinois: American Medical As-sociation Press, 1982.
1. American Medical Association. International classificationof diseases, 9th revision, clinical modification, 1999(ICD-CM 1999). Chicago, Illinois: American Medical As-sociation Press, 1998.
2. American Medical Association. International classificationof diseases, 9th revision, clinical modification, 1998(ICD-CM 1998). Chicago, Illinois: American Medical As-sociation Press, 1997.
3. Raghunathan TE, Lepowski JM, Solenberger PW, et al. Amultivariate technique for multiply imputing missing valuesusing a sequence of regression models. Surv Methodol 2001;27:85–95.
4. Raghunathan TE, Solenberger PW, van Hoewyk J. IVEware:imputation and variance estimation software user guide. AnnArbor, Michigan: University of Michigan, Survey ResearchCenter, Institute for Social Research, 2002.
5. American Medical Association. Medicare RBRVS: The phy-sicians’ guide, 1995. Chicago, Illinois: American MedicalAssociation Press, 1994.
6. American Medical Association. Medicare RBRVS: the phy-sicians’ guide, 1999. Chicago, Illinois: American MedicalAssociation Press, 1998.
7. Brechner RJ, Cowie CC, Howie LJ, et al. Ophthalmicexamination among adults with diagnosed diabetes mellitus.JAMA 1993;270:1714–1718.
8. Martin TL, Zhang D, Selby J. Physician and patient preven-tion practices in NIDDM in a large urban managed-careorganization. Diabetes Care 1995;18:1124–1132.
9. Wylie-Rosett J, Basch C, Walker EA, et al. Ophthalmicreferral rates for patients with diabetes in primary-care clinicslocated in disadvantaged urban communities. J DiabetesComplications 1995;9:49–54.
0. Steinberg EP, Javitt JC, Sharkey PD, et al. The content andcost of cataract surgery. Arch Ophthalmol 1993;111:1041–1049.
1. Chiang YP, Bassi LJ, Javitt JC. Federal budgetary costs ofblindness. Milbank Q 1992;70:319–340.
2. Sloan FA, Ostermann J, Brown DS, Lee PP. Effects ofchanges in self-reported vision on cognitive, affective, andfunctional status and living arrangements among the elderly.Am J Ophthalmol 2005;140:618–627.
3. Ellis RP, Pope GC, Iezzoni L, et al. Diagnosis-based riskadjustment for Medicare capitation payments. Health CareFinanc Rev 1996;17:101–128.
4. Shapiro I, Shapiro MD, Wilcox D. Measuring the value ofcataract surgery. In: Cutler DM, Berndt ER, editors. Medicalcare: output and productivity. Chicago, Illinois: University of
Chicago Press, 2001:411–437.OPHTHALMOLOGY DECEMBER 2006

D
V
APPENDIX A.iagnosis Codes Used to Identify Major Eye Diseases
Disease ICD-9 Diagnosis Code
Diabetic retinopathy
Background 362.01
Proliferative 362.02
Unspecified 362.0
Glaucoma
Suspected 365.0, 365.00, 365.01, 365.04
Primary open angle 365.1, 365.10, 365.11, 365.12, 365.15
Narrow angle 364.73, 365.02, 365.2x, 365.61
Other 365.03, 365.13, 365.14, 365.24, 365.3x, 365.4x, 365.5x, 365.6, 365.60, 365.62, 365.63,
365.64, 365.65, 365.8x, 365.9
Cataract 365.51, 366.x, 379.31, 743.30, 743.31, 743.32, 743.33, 743.34, 743.39, V43.1
Age-related macular degeneration
Dry 362.51, 362.57
Wet 362.52, 362.53
Unspecified 362.5, 362.50
TRENDS IN COST OF MAJOR EYE DISEASES TO MEDICARE, 1991 TO 2000OL. 142, NO. 6 982.e1

P
D
9
APPENDIX B.rocedure Codes Used to Identify Major Eye Diseases
Disease CPT or ICD-9 Procedure Codes
For all diseases 90000–90650††, 99201–99499*, (where accompanied by provider specialty code 18 or 41,
costs obtained from Part B records only)
92002, 92012, 92019, 92004, 92014, 92018, 92225, 92226, 92235, 92250, 92392
95.02, 95.03, 95.04, 95.05, 95.06, 16.21, 95.12, 95.11, 95.13, 95.16, 95.31, 95.32, 95.33,
95.36
Diabetic retinopathy
With any ocular complication 92260, 76511, 76512, 76513, 67208, 67210, 67220***, 67227, 67228
With any form of diabetic retinopathy 92287, 92235, 92240**, 92287
14.11, 14.19, 14.21–14.27, 14.29, 14.31–14.35, 14.39
Claims only with 362.02 as primary
diagnosis
67036, 67038, 67039, 67040, 67108, 67109, 67112
14.72, 14.74, 14.79, 15.51-14.55, 15.59, 14.9, 14.41, 14.49
Glaucoma
Any form 65820, 92135**, 92020, 92081–92083, 92100, 92120, 92130, 92140, 65850, 65855, 66150,
66155, 66160, 66165, 66170, 66172‡, 66180, 66185, 66700*, 66701††, 66702†, 66710‡,
66720‡, 66721††, 66740*, 66741††
95.05, 95.21, 95.26, 12.11, 12.14, 12.22, 12.34, 12.35, 12.39, 12.54, 12.55, 12.61–12.65,
12.69, 12.71–12.73, 12.93
Narrow angle only 65865, 65870, 65880, 66500, 66505, 66600, 66625, 66830, 66761, 66762
Other 92287, 65900, 65930
Cataract 66830, 66840, 66850, 66852, 66920, 66930, 66940, 66983, 66984, 66985, 66986, 76516,
76519
13.1, 13.11, 13.19, 13.2, 13.3, 13.4, 13.41–13.43, 13.5, 13.51, 13.59, 13.6, 13.64–13.66,
13.69, 13.7, 13.70–13.72, 13.8
Age-related macular degeneration
Any form 92235, 92240, 92283, 92284, 92287, 67208, 67210, 67218
95.07, 14.21–14.25, 14.27, 14.29, 14.72, 14.74, 14.79
Wet only (362.52, 362.53) 67220**
*Codes first used in 1992.
**Codes first used in 1997.
***Codes first used in 1999.†Codes dropped between 1992 and 1994.††Codes dropped in 1993.‡Codes first used between 1992 and 1994
Codes dropped before 1991 or added and dropped between 1992 and 1994.
Codes included only where associated with provider specialty codes 18 (ophthalmology) or 41 (optometry). Costs for these codes are
included only from Medicare Part B.
APPENDIX C.evice Codes Used to Identify Major Eye Diseases
Disease HCPCS Device Codes
All diseases (eyeglass lenses and frames,
contact lenses, and low vision aids)
V2020, V2025, V2100–V2499, V2610, V2618, V2730, V2755, V2770, V2780, S0500,
S0512, S0513, S0514, V2500–V2599, V2600, V2610, V2615
Glaucoma (aqueous shunt) L8612
Cataract (intraocular lenses) V2630, V2631, V2632, Q1001, Q1002, Q1003, Q1004, Q1005
AMERICAN JOURNAL OF OPHTHALMOLOGY82.e2 DECEMBER 2006

MPaD
V
Biosketch
artin Salm, MA, is a PhD candidate in economics at Duke University, Durham, North Carolina. He is a student ofrofessor Frank Sloan and a research assistant at the Center for Health Policy at Duke University. Dr Salm has recentlyccepted a research position in economics at the University of Mannheim, Institute for the Economics of Aging (MEA).r Salm’s research interests include cost of disease studies, health insurance, and health behaviors.
TRENDS IN COST OF MAJOR EYE DISEASES TO MEDICARE, 1991 TO 2000OL. 142, NO. 6 982.e3

FEP1eeDimmoC
9
Biosketch
rank A. Sloan, PhD, is the J. Alexander McMahon Professor of Health Policy and Management and Professor ofconomics at Duke University, Durham, North Carolina, since 1993. He is the former Director of the Center for Healtholicy, Law, and Management at Duke (CHPLM) that originated in 1998. Dr Sloan was the Director of CHPLM from998 to 2004. Professor Sloan did his undergraduate work at Oberlin College, Oberlin, Ohio, and received his PhD inconomics from Harvard University. Before joining the faculty at Duke in July 1993, Professor Sloan was a researchconomist at the Rand Corporation and served on the faculties of the University of Florida and Vanderbilt University.r Sloan was Chair of the Department of Economics at Vanderbilt from 1986 to 1989. Dr Sloan current research interests
nclude alcohol use and smoking prevention, long-term care, medical malpractice, and cost-effectiveness analyses ofedical technologies. Professor Sloan also has a long-standing interest in hospitals, health care financing, and healthanpower. He has served on several national advisory public and private groups. Dr Sloan is a member of the Institute
f Medicine of the National Academy of Sciences and was recently a member of the Physician Payment Reviewommission.
AMERICAN JOURNAL OF OPHTHALMOLOGY82.e4 DECEMBER 2006