tilburg university essays on financial intermediation and ... · concept of murabaha or mark-up...
TRANSCRIPT

Tilburg University
Essays on financial intermediation and markets
Farooq, M.
Publication date:2011
Link to publication
Citation for published version (APA):Farooq, M. (2011). Essays on financial intermediation and markets. Tilburg: CentER, Center for EconomicResearch.
General rightsCopyright and moral rights for the publications made accessible in the public portal are retained by the authors and/or other copyright ownersand it is a condition of accessing publications that users recognise and abide by the legal requirements associated with these rights.
- Users may download and print one copy of any publication from the public portal for the purpose of private study or research - You may not further distribute the material or use it for any profit-making activity or commercial gain - You may freely distribute the URL identifying the publication in the public portal
Take down policyIf you believe that this document breaches copyright, please contact us providing details, and we will remove access to the work immediatelyand investigate your claim.
Download date: 15. Aug. 2019

MOAZZAM FAROOQ
ESSAYS ON FINANCIAL
INTERMEDIATION AND MARKETS

ISBN: 97890 5668 294 1
© 2011 Moazzam Farooq
No part of this publication may be reproduced, stored in a retrieval system of any nature, or transmitted in any form or by any means, electronic, mechanical, now known or hereafter invented, including photocopying or recording, without prior written permission of the author.
ESSAYS ON FINANCIAL
INTERMEDIATION AND MARKETS
PROEFSCHRIFT
ter verkrijging van de graad van doctor aan de Universiteit van Tilburg, op gezag van de
rector magnificus, prof. dr. Ph. Eijlander, in het openbaar te verdedigen ten overstaan van
een door het college voor promoties aangewezen commissie in de aula van de Universiteit
op vrijdag 16 september 2011 om 10.15 uur door
MOAZZAM FAROOQ
geboren op 12 december 1979 te Karachi, Pakistan.

Promotores: Prof. dr. Steven Ongena
Dr. Lieven Baele
Promotiecommissie: Prof. dr. Thorsten Beck
Prof. dr. Vasso Ioanniduo
Dr. Alberto Manconi

To:
My Parents, Naheed, Waseem, Nawal,
Nazia, Mubashir and Mudassir

vi
Acknowledgements
It is unconventional to open Ph.D. dissertation with a gloomy note, but the most
overwhelming event while working on this dissertation was - loss of my sister. She
passed away five months ago in a road accident on her way back to home from university
where she was at ABD stage of Ph.D. in chemistry. The food supplements that she gave
me to keep me energetic considering my unruly eating habits outlived her, may her soul
rest in eternal peace.
This thesis benefited a lot from help and support of many people, and I would like to
express my sincere thanks to all of them. I am grateful to my supervisors Prof. Steven
Ongena and Dr. Lieven Baele for their constant support and guidance. I am lucky to have
them as my supervisors; they made working on this thesis a very pleasant experience.
Both Steven and Lieven are wonderful persons and have a lot more than impressive
research track records. Steven is exceptional, all those who know him would agree with
this. He often surprised me with his ability of working on a several projects at a time and
quickly getting to work after travelling long distances. More impressive thing about him
is that he creates opportunities for others and gives them a lot of personal space. Just to
quote a small example, whenever he visited my office I noticed him deliberately glancing
away from my computer monitor. Lieven was always very supportive. His crisp and clear
thinking helped a lot in improving the thesis and his rational approach towards religion
always made me to see the religion from different perspectives.
I am also thankful to Prof. Thorsten Beck, Prof. Vasso Ioanniduo and Dr. Alberto
Manconi for being part of my dissertation committee, and providing valuable comments

vii
and suggestions. Their support is not limited to this alone. I am grateful to Thorsten for all
the support that he provided as head of European Banking Center, Vasso for helping me
with implementing duration models, and Alberto for giving very useful tips regarding
presentation.
I would like to thank my friends, colleagues and officials at CentER Graduate School,
European Banking Center, Finance Department - Tilburg University, Higher Education
Commission- Government of Pakistan, International Monetary Fund, Nuffic and State
Bank of Pakistan for providing enormous support. I trust they will recognize themselves.
Higher Education Commission, Government of Pakistan and State Bank of Pakistan also
deserve special thanks for providing financial support and generous study leave that
allowed me to pursue Ph.D..
I owe a word of gratitude to Dutch people in general, who are so easygoing and
hospitable that not learning Dutch never became a problem during my stay of almost five
years in the Netherlands. I am also thankful to them for showing me practical
implementation of many Islamic values (!) in daily life. It was satisfying to note that those
values, when implemented, have a very positive bearing on the quality of life.
I would also give a special thought and thanks to members of my family - my parents,
siblings, cousins and wife - who have been a constant source of unconditional support,
encouragement, and inspiration throughout my life.
Moazzam Farooq Tilburg. June 28, 2011

viii
Contents
1 INTRODUCTION ............................................................................................................ 1
2 LITERATURE SURVEY AND ANATOMY OF ISLAMIC BANKING ................... 4
2.1 Introduction ................................................................................................................. 4
2.2 Structure of Islamic Banks .......................................................................................... 7
2.3 Islamic Banking Products ......................................................................................... 10
2.4 Review of Empirical Literature: ............................................................................... 23
2.5 Conclusions ............................................................................................................... 32
3 OF RELIGION AND REDEMPTION: EVIDENCE FROM DEFAULT
ON ISLAMIC LOANS ................................................................................................... 34
3.1 Introduction ............................................................................................................... 34
3.2 Islamic Banking and Loan Default ........................................................................... 38
3.3 Data and Identification Strategy ............................................................................... 43
3.4 Empirical Results ...................................................................................................... 55
3.5 Conclusions ............................................................................................................... 77
4 FINANCIAL REFORMS AND MONETARY POLICY TRANSMISSION
IN SUB-SAHARAN AFRICA ....................................................................................... 96
4.1 Introduction ............................................................................................................... 96
4.2 Literature Review ..................................................................................................... 97
4.3 Data and Methodology ........................................................................................... 100
4.4 Empirical Results .................................................................................................... 110
4.5 Conclusions ............................................................................................................. 121
5 FINANCIAL CONSTRAINT AND STOCK RETURNS - EVIDENCE FROM
G-7 COUNTRIES ......................................................................................................... 129
5.1 Introduction ............................................................................................................. 129
5.2 Literature Review ................................................................................................... 133
5.3 Data ......................................................................................................................... 135
5.4 Methodology and Empirical Model: ....................................................................... 140
5.5 Empirical Results and Discussion .......................................................................... 145
5.6 Conclusions ............................................................................................................. 165
6 REFERENCES ............................................................................................................. 176

1
1
Introduction
This thesis comprises four papers, the first paper, "Literature Survey and Anatomy of
Islamic Banking", provides an overview of Islamic banking products and documents a
survey of empirical literature on Islamic banking. Following the financial crisis, there has
been a renewed interest in Islamic banking. This interest was accompanied by an influx of
practitioner and academic literature on the subject. More importantly, new empirical work
has emerged that sheds light on the empirical validation of theory that existed long before
and various aspects of Islamic banking as it is practiced. Aim of this paper is to study key
products used in Islamic banking and survey existing literature on the subject to set ideas
in perspective. Survey of empirical work is the focus of this paper; however, reference to
the theoretical work is made as well whenever necessary. This paper also serves as a
preamble to the second paper which is an empirical paper on Islamic banking.
The second paper, "Of Religion and Redemption: Evidence from Default on Islamic
Loans" is a joint work with Lieven Baele and Steven Ongena. This paper compares
default rates on conventional and Islamic loans using a comprehensive monthly dataset
from Pakistan that follows more than 150,000 loans over the period 2006:04 to 2008:12.
2 Introduction
The results suggest that the default rate on Islamic loans is less than half the default rate
on conventional loans. Islamic loans are less likely to default during Ramadan and in big
cities if the share of votes to religious-political parties increases, suggesting that religion –
either through individual piousness or network effects – may play a role in determining
loan default.
The third paper "Financial Reforms and Monetary Policy Transmission in Sub-Saharan
Africa", studies interest rate pass-through in selected Sub-Saharan African countries and
links the speed of pass-through to the ongoing financial reforms. The empirical results
suggest that (a) in all SSA countries, save South Africa and Swaziland, interest rate pass-
through is weak both in terms of initial and long run responses and pass-through is not
static over time, (b) major differences in pass-through in different countries exist in the
sample, and (c) financial reforms positively affect interest rate pass-through albeit with a
lag.
The fourth and final paper "Financial Constraint and Stock Returns - Evidence from G-7
Countries", analyses the contribution of a Financial Constraint (FC) factor in explaining
cross-sectional variation in expected stock returns in G-7 countries and attempts to relate
this factor to the differences in GDP growth rates and development of banking sector and
equity market. The results show that Financial Constraint factor is significantly positive
for portfolios with smaller firms or value firms. The Financial Constraint factor is
especially significant for portfolios at the intersection of Small-Value firms. The
significance of Financial Constraint factor persists across all G-7 countries and in sub-
periods as well. This factor does not replace any of the three standard Fama-French
Factors as they remain significant when the Financial Constraint Factor is introduced.
These results also confirm the presence of a size and value factor in G-7 markets.

Essays on Financial Intermediation and Markets 3
Moreover, cross-country differences in the GDP growth rates, banking sector
development, and equity market development do not appear to have any noticeable effect
on the size or significance of the coefficient of FC factor. However, in sub-periods within
a country, there is some evidence of a relationship between the GDP growth rate and the
coefficient of FC factor as generally higher average GDP growth rate coincides with
bigger and more significant coefficient of FC factor. This paper lends support to a broader
asset pricing model including the Financial Constraint factor along with the standard
Fama-French factors. These findings have important implications for asset pricing.

4
2
Literature Survey and Anatomy of
Islamic Banking
2.1 Introduction
Islamic banking is an offshoot of Islamic economics. Muhammad Iqbal and Sayyid Abu
Al-A’la Maududi from India and Pakistan, and Baqir Al-Sadr and Sayyid Qutb from the
Arab world are credited with and sometimes accused of pioneering the concept of Islamic
economics in 1940’s and 1950’s (El-Gamal (2003), Kuran (1996)). Kuran (1996) credits
Sayyid Abu'l-A'la Maududi with coining the term Islamic economics.
Al-Sadr (1982) succinctly defines Islamic Economics as ‘the way Islam prefers to follow
in the pursuit of its economic life and in the solution of its practical economic problems in
line with its concept of justice'
Among other more subtle differences with mainstream economics, the most striking
difference of Islamic economics is prohibition of riba1. Riba is generally translated as
interest and in this chapter, I will use the term interest to denote riba.
1 Riba is generally translated as interest, but it has a broader scope. There is near unanimous consensus among Islamic jurists that the interest in conventional banking is riba.
Essays on Financial Intermediation and Markets 5
Interest is personified in key operations of banks, therefore, attention of scholars was
swiftly shifted to the ways and modes of Islamization of banking operations. Uzair (1955)
devised the first model of an Islamic bank on the basis of two tier mudaraba2. The
concept of murabaha or mark-up based financing as a mode of Islamic finance crept in
later in 1976. Since its introduction, the mark-up based modes have been predominant
form of financing in the Islamic financial institutions. (Khan (1996)).
The prohibition of interest is canonical3, one stated reason of this prohibition is fair and
just treatment of parties in a transaction4. However, proponents of Islamic economics and
banking have vigorously attempted to provide economic justifications of this prohibition
by advancing arguments against interest based on efficiency, stability and growth (Siddiqi
(1983)). Some scholars believe that interest based transactions are unjust because rate of
return for the lender is pre-specified or guaranteed whereas the rate of return for the
borrower is stochastic. This view is favored by Maududi (1961), Maududi (st. 1950),
Siddiqi (1967) and Siddiqi (1988). However, in general the rate of return that a lender
ends up earning is not necessarily pre-determined or guaranteed in a conventional loan
transaction. In most of the lending transactions to commercial entities, lenders are entitled
to receive higher of the principal plus interest or the salvage value of firm. Thus in the
event of losses in excess of equity of a borrowing firm, the lenders to that firm share in
losses.
2 Mudaraba is a form of partnership in which capital is provided by one party and skills/labour by the other. We will define and describe mudaraba later in the paper.
3 “That is because they say: ‘Trading is only like riba,’ whereas Allah has permitted trading and forbidden riba.” (Al-Quran, 2:275). From this verse, it follows that Quranic stance is that likeness of trading (on credit) and riba does not make interest valid, interest is prohibited based on divine authority.
4 "O you who believe! fear Allah and give up what remains of your demand for interest, if you are indeed believers. If you do it not, take notice of war from Allah and His Messenger: but if you repent you shall have your capital sums; deal not unjustly and ye shall not be dealt with unjustly" (Al Quran, 2:278-279)

6 Literature Survey and Anatomy of Islamic Banking
If fixed returns of one party is the real cause of injustice and the only reason for the
prohibition of interest, then naturally a non-interest based Islamic banking system has to
be modeled on profit and loss sharing (PLS) basis. This belief was the reason why
theoretical models of Islamic banking were based on PLS and still considered as ideal or
true modes of Islamic banking by scholars like Usmani (1998) and Siddiqui (2002)
among many others.
Other scholars disagree with the view that it is the fixed nature of interest that is at the
core of prohibition of interest. Homoud (1974) held this opinion, and pioneered the use of
mark-up based modes in Islamic banking, Ismail (1989) also attests this opinion (Khan
(1996)). Usmani (1998) considers mark-up based modes as Islamic, but cautions that non-
PLS modes should be used only when necessary. El-Gamal (2007) describes the
prohibition of interest as prohibition of ‘unbundled credit’ and contends that the essence
of this prohibition lies in economic efficiency considerations (El-Gamal (2000)). El-
Gamal (2007) proposes, that the solution of implementing the form and substance of
Shari’ah lies in adoption of mutual structures of financial intermediation.
It may be noted that while promoting Islamic economics or banking, both the jurists and
economists make appeals to economic and/or social benefits. The earlier text in favor of
Islamic economics often portrays the lender as an exploitative character that takes
advantage of the poor borrower and enjoys guaranteed returns. Later this characterization
was somewhat changed, where bank was depicted as exploiting depositors by giving
unfair returns and exploiting borrowers by giving expensive loans (see Maududi (st.
1941), Maududi (st. 1950), Maududi (1961) and Siddiqui (2002)).
Rest of the chapter proceeds as follows, Section I provides an overview of the structure
of Islamic banks, Section II describes key Islamic banking products used by Islamic

Essays on Financial Intermediation and Markets 7
banks to mobilize deposits and provide financing, in Section III I provide a survey of
empirical literature on Islamic banking and Section IV concludes.
2.2 Structure of Islamic Banks
A simplified balance sheet of a typical Islamic bank is given in Figure 2.1. The balance
sheet has been deliberately simplified for the sake of exposition.
Islamic banks fund themselves with equity, profit and loss sharing checking deposits
(saving accounts), profit and loss sharing term deposits (also called Investment Accounts)
and non-return paying current deposits (qard). Both types of profit and loss sharing
deposits are legally not a liability of the bank and their nominal amount is not guaranteed,
but for the purpose of capital adequacy requirements, these deposits are treated as liability
Figure 2.1
Simplified version of balance sheet of a hypothetical Islamic bank
Cash & Balances Qard
Investments Saving Accounts
Term Deposits
Financing
Murabaha Shareholders' Equity
Ijarah
Ijarah wa's Iqtina
Istisna
Salam
Diminishing Musharakah
Modaraba
Musharakah
Fixed Assets
Uses of Funds Sources of Funds

8 Literature Survey and Anatomy of Islamic Banking
of the bank rather than a part of equity. In the rest of the chapter, I will refer both of these
accounts as PLS deposits.
Qard is considered as a loan to the bank, it does not earn any return but the bank
guarantees its nominal value.
Banks use these funds to finance their assets that include cash, investments and financing
products that are permissible according to Shari’ah and are described in the next section.
In the absence of qard and equity, Islamic banks act as manager of the funds provided by
PLS depositors and participate in the profit generated from the operations. However,
Islamic banks do have equity and qard as well, and they generally comingle these funds
with the PLS deposits. In this case other than managing the funds of depositors, banks
also invest their own funds (equity), and also take a leveraged bet by using qard as well to
fund their financing/ investing activities.
It is important to note that qard is solely a liability of the bank, not a liability of PLS
depositors. In the event of loss, the PLS depositors absorb losses proportional to their
share in financing/ investments made by the bank. To illustrate this, suppose an Islamic
bank has PLS deposits of $ 45, qard of $45, equity of $10 and it makes an investment of
$100 in a risky asset. Suppose the value of this asset is reduced to $90, as a result the
bank suffers a loss of $ 10. This loss will be distributed proportional to the share of
investment of each party in the following way. PLS depositors will absorb loss of $4.5,
and bank will absorb a loss of $5.5 ($1 on equity and $4.5 on the qard invested by bank).
It may be noted that, in a conventional bank, the bank has to absorb the total loss of $10
so, the presence of PLS deposits provide extra cushion to the bank to absorb losses by
decelerating the erosion of equity.

Essays on Financial Intermediation and Markets 9
If the investment in the risky asset results in a profit of $10, and the bank and PLS
depositors have agreed to a profit sharing ratio of 50-50 then the respective shares of the
bank and depositors in the profit will be as follows. The bank will keep the profit
proportional to her own investment, that is, $5.5 ($ 1 on equity, and $4.5 on the qard that
bank invested in the assets on its own risk). Moreover, from the return accrued on the
share of investment of PLS depositors ($4.5), the bank will keep a share of $2.25 as its
share as manager (mudarib), thus PLS depositors will receive $2.25. Qard providers, by
definition do not participate in the profits generated by the bank.
A graphical depiction of the impact of changes in the value of bank’s asset on the value of
PLS deposits, equity and qard is given in Figures 2.2 and 2.3.
Figure 2.2This Figure shows the impact of changes in the value of a hypothetical conventional and Islamic bank’s
assets on the value of PLS deposits and equity of an Islamic bank and deposits and equity of a
conventional bank.
Both banks are assumed to have deposits of $90, and Equity of $10. All $100 available with the bank are
invested in a risky asset. The profit sharing ratio between Islamic bank and her depositors is 50-50.
Conventional bank pays a guaranteed flat interest of 8% to her depositors.
0
20
40
60
80
100
120
0 20 40 60 80 100 120 140
Va
lue
of
Dep
osi
ts a
nd
Eq
uit
y
Value of Bank's Assets
Islamic PLS Deposits Islamic Equity Conventional Deposits Conventional Equity
10 Literature Survey and Anatomy of Islamic Banking
2.3 Islamic Banking Products
I am not the first to define and describe contracts used in Islamic banking, but my
approach is different. In describing the contracts, where necessary, I draw a parallel
between Islamic and conventional contracts and highlight features that differentiate
Islamic contracts from their conventional counterparts. In doing so, I conjecture regarding
the influence of those differentiating features on pricing of the products and likely
influence on the behavior of users of the products. I limit myself to describe only those
products that are most commonly used by Islamic banks.
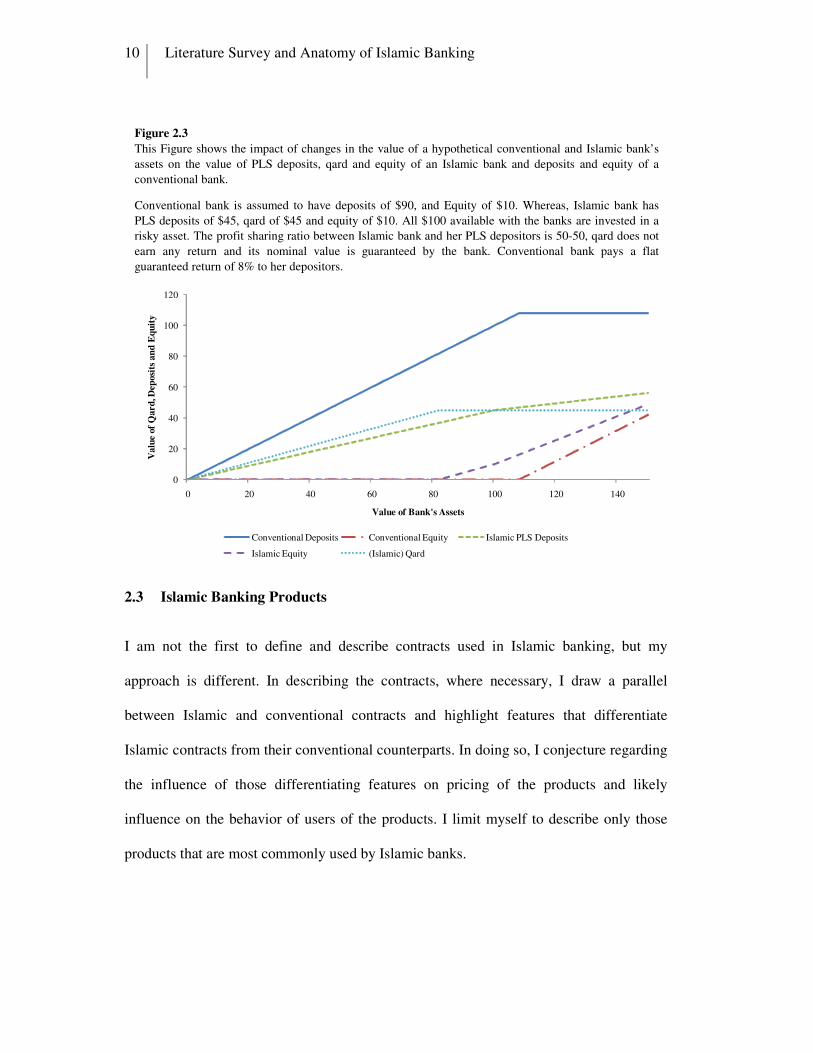
Figure 2.3
This Figure shows the impact of changes in the value of a hypothetical conventional and Islamic bank’s
assets on the value of PLS deposits, qard and equity of an Islamic bank and deposits and equity of a
conventional bank.
Conventional bank is assumed to have deposits of $90, and Equity of $10. Whereas, Islamic bank has
PLS deposits of $45, qard of $45 and equity of $10. All $100 available with the banks are invested in a
risky asset. The profit sharing ratio between Islamic bank and her PLS depositors is 50-50, qard does not
earn any return and its nominal value is guaranteed by the bank. Conventional bank pays a flat
guaranteed return of 8% to her depositors.
0
20
40
60
80
100
120
0 20 40 60 80 100 120 140
Va
lue
of
Qa
rd
, Dep
osi
ts a
nd
Eq
uit
y
Value of Bank's Assets
Conventional Deposits Conventional Equity Islamic PLS Deposits
Islamic Equity (Islamic) Qard
Essays on Financial Intermediation and Markets 11
2.3.1 Qard:
In Islamic tradition, qard (loan) is considered as a charitable activity, as such it does not
carry any interest or excess payment other than the principal amount. Depending on the
terms agreed between borrower and lender, qard may be payable on demand or at a
specific time. The lender can charge an administrative fee to cover administration costs
and may also demand collateral. At the time of returning the loan, the borrower may, and
is encouraged to, return more than the principal amount at her own will.
Qard is generally used by Islamic banks to mobilize non-return bearing checking
accounts (current accounts). On rare occasions, Islamic banks also lend on qard basis.
Although, current account holders place their deposit with the bank as benevolent loan,
but it is straightforward to understand that they do not necessarily do this as an act of
charity towards bank, because they can always find more needy persons than a bank.
Most probably, they hold current accounts with the bank to be able to use the payment
and safekeeping services of bank.
2.3.2 Mudaraba:
Mudaraba can be used both as a mode of financing and as a mode of accepting PLS
deposits. Most commonly it is used as a mode of accepting PLS deposits and rarely as a
mode of financing. Usmani (2002) defines mudaraba as:
“This is a kind of partnership where one partner gives money to another for investing in
a commercial enterprise. The investment comes from the first partner who is called “Rab-
ul-Maal” while the management and work is an exclusive responsibility of the
other, who is called “Mudarib” and the profits generated are shared in a
predetermined ratio”
In a mudaraba, profits can be shared in any proportion between the mudarib (working
partner) and rab-ul-maal (financier). Expenses incidental to the business are paid by

12 Literature Survey and Anatomy of Islamic Banking
mudaraba, that is, they are expensed out of the revenues generated by the business before
proportioning profits. In the event of a loss, the partners share in losses in the same form
in which they made contribution to the mudaraba. That is, all financial losses are strictly
borne by the financier, unless they are caused by negligence or fraud of the working
partner and the working partner incurs a loss of efforts invested in mudaraba. The
financier has only financial interest in the partnership and cannot interfere in the business
activities, unless authorized to do so by the working partner. The liability of financier is
limited to her investment. Hence, the legal status of financier in a mudaraba can be
compared to limited partner in a conventional partnership.
When working partner in a mudaraba is a limited liability company, for example a bank
registered as a limited liability company, then all partners enjoy limited liability. In this
case the legal status of mudaraba is comparable to Limited Liability Limited Partnership.
2.3.2.1 Mudaraba when Working Partner is a Legal Person:
There is a unanimous consensus of jurists that in the event of a loss in mudaraba, the
financial loss is exclusively borne by the financier, whereas, the working partner incurs
loss in the form of lost efforts5. This concept has been advanced as fair sharing of losses
and is straightforward to understand when working partner is a natural person. However,
it is less clear how the working partner will lose efforts, when it is a legal person, for
example a bank6. It is important to clarify ‘who’ is the bank/ mudarib in this case, what
efforts does it exert that will be lost and how a legal person can lose efforts?
5 Mudarib or working partner is liable for financial losses only if the losses are incurred by his/her negligence or when he/she ultravires the authority given by the rab-ul-maal or financier
6 Terms and conditions of PLS Account of Al Baraka Bank, Pakistan state: “In the event of loss in business/investments, that may occur without any fault or negligence on part of the Bank, all Investors of the Investment Pool shall share loss on pro rata basis and the Bank shall loose (sic) the share for its effort.”, available at http://albaraka.com.pk/products/terms-cond/terms_conds.pdf

Essays on Financial Intermediation and Markets 13
Bank management and employees exert efforts, but they are distinct from the bank and
receive salaries for their efforts and do not lose efforts when the bank incurs a loss.
Directors on Board of a bank have dual role of investors and agent of shareholders. For
agency services, the directors receive a fee and do not lose it if the bank incurs a loss.
Directors in their capacity as shareholders (and other shareholders) are investors and do
not exert efforts, so they also cannot lose efforts, in the event of a loss. Moreover, unlike
mudarib, the shareholders seek a return on investment, not a return for offering skills.
Bank as a legal person exerts efforts through employees and directors and both of these
groups do not lose their efforts when bank incurs losses.
If bank is defined as a combination of and provider of infrastructure including technology
and management (including employees) in the form of legal entity bank, then it will
deemed to be the responsibility of the bank to pay for the costs incurred in providing
these services7. In this case, the financier (rab-ul-maal) will share in the revenue (not net
profit) of the bank before deducting any administrative costs8. If there is a loss, then the
bank will lose any amount spent on the infrastructure and salaries.
It may be noted that if the above description is correct then mudaraba where mudarib is a
legal person differs from the classical mudaraba (where mudarib is a natural person). In
the former certain expenses (salaries of employees) are borne by mudarib, whereas in the
later all expenses related to business are borne by the business. The implication of this
treatment is that, in classical mudaraba, all financial losses are borne by mudarib,
whereas if the mudarib is a legal person then mudarib is exposed to financial losses if the
business produces zero or negative returns.
7 In the same way as a natural person in the role of mudarib is responsible for his/her upkeep
8 Some direct costs, for example auditor’s fee, may still be deducted from revenues.
14 Literature Survey and Anatomy of Islamic Banking
The discussion on the implications of a legal person as mudarib has escaped literature;
however, in practice Islamic banks appear to follow the modus operendi detailed above.
Relevant financial statements suggest that many Islamic banks operating in Pakistan and
other countries share revenues9 (before deducting administrative expenses) with their
depositors.
2.3.2.2 Mudaraba, Moral Hazard and Corporate Governance:
There are a couple of related issues concerning mudaraba10 that have gained a lot of
attention in literature. These issues are related to presumably high agency costs in
mudaraba, lack of protection of PLS depositors from moral hazard and corporate
governance issues arising out of this (see El-Gamal (2003)). Higher agency costs and
asymmetric information are also advanced as the most convincing arguments of the
supremacy of interest based lending over profit and loss sharing (Freixas and Rochet
(2008)).
When PLS deposits in an Islamic bank are based on mudaraba, then PLS depositors are
legally not creditors of the bank, and as such they are not covered by the protection of
being the primary claimants, that is generally available to creditors. PLS depositors are
residual claimants as they share in profit and loss of the bank but unlike shareholders they
cannot appoint a director on the board of bank, hence they do not have any say in the
affairs of the bank. Mudawi (1985), Khan (1986), Sadr and Iqbal (2001), EI-Din and
Ibrahim (1991) and Khan (1989) also express concerns about moral hazard in PLS
schemes.
9 Terms and conditions of PLS deposits use varying terminology like income, profit, gross profit, gross income without defining how that profit is calculated.
10 Islamic banks use Mudaraba both on asset and liability side. However, more commonly mudaraba is used to offer return earning saving accounts and term deposits (collectively PLS deposits), therefore, mostly reference is made to mudaraba as it applies to the relationship between PLS depositors and bank.

Essays on Financial Intermediation and Markets 15
Contract theory suggests that these concerns are misplaced and surface from ignoring an
important feature of mudaraba contract in general and mudaraba based deposits in
particular. That is, unlike shares, deposits are redeemable11. Fama and Jensen (1983)
contend that this feature equips the principals (depositors) with the ability to
independently deprive the management of controlling their assets. Principals with such
ability are often not interested in appointing a director on the board, because it is
irrelevant for them. To exercise similar power, shareholders need to rely on a sufficiently
liquid stock market, and/or a market for takeovers, and/or coordination and consent of
other shareholders, and reliance on Board of Directors to whom they delegate their
powers.
Moreover, controlling agency problems is important when interests of principal and
agent are not aligned. Under mudaraba, instead of a fixed remuneration, the
principal(depositor) shares profit with the agent (bank), therefore, the interests of Islamic
bank/shareholders and depositors are more aligned as compared to the interests of a
conventional bank and its depositors.
In Figures 2.2 and 2.3, I graphically show that the interests of depositors and
shareholders/bank are more aligned in Islamic banks than in conventional banks.
2.3.3 Murabaha or Bai Mu’ajjal:
Bai Mua’jjal means a credit sale or sale with deferred payment. Islamic banks routinely
use credit sales as a mode of financing by purchasing an asset at spot price from suppliers
and selling the same on credit to their customer (I will refer these customers as borrower
11 In general both saving accounts and term deposits are redeemable. For term deposits, the depositors may have to forego part or all of accrued/ expected profit.

16 Literature Survey and Anatomy of Islamic Banking
in the rest of the chapter) at a marked up price. In doing so, they usually appoint the
borrower as their agent to purchase the underlying asset. Because of her involvement in
purchase of asset from supplier, the borrower knows the profit margin of the bank. A sale
in which the seller discloses the purchase price and profit margin is called murabaha in
Arabic, therefore, such marked up credit sales by Islamic banks are commonly referred to
as murabaha.
Murabaha is the most extensively used mode of financing by Islamic banks.
Interestingly, it also draws intense criticism from practitioners and academicians alike.
The criticism on murabaha is based on its resemblance with interest-based financing and
its lack of ability to restore the economic order that Islamic economists promise viz a viz
prosperity, justice, equity and the like. However, as discussed earlier in introduction, the
claims of theological superiority of PLS over mark-up are mainly founded on the personal
opinions of jurists and economists.
Most jurists sanction the permissibility of mark-up based financing, but share the
frustration of many economists over heavy reliance of Islamic banks on murabaha. Often,
it is murabaha that prompts scholars to refer Islamic banking as ‘functionally
indistinguishable from conventional banking’ (Khan (2010)), ‘net result does not differ
much from interest-based transactions’ (Usmani (1998)), ‘a more realistic approach
would be to conclude that Islamic products differ from their conventional counterparts in
the same manner that Kosher water bottles differ from most other bottled water:
certification by certain religious figures’ (El-Gamal (2003)) or out rightly call for its
elimination, ‘I would prefer that Bai' Mu'ajjal is removed from the list of permissible
methods altogether’ (Siddiqi (1988)).
There are subtle differences in an interest-based contract and murabaha contract that are
often ignored in comparing these two contracts. However, these differences are

Essays on Financial Intermediation and Markets 17
economically meaningful as they can change the nature of the contracts and induce the
contracting parties to take different actions under the two contracts.
One distinguishing feature of murabaha is that although at the time of contract any price
can be fixed for the underlying asset yet, once the contract is made, price cannot be
changed anymore. Since a murabaha contract creates a debt, therefore, subsequent
change in price (of debt) constitutes riba. This has two repercussions; firstly, if after
taking say a five-year financing under murabaha contract the borrower wants to prepay
the whole amount after one year (hoping to refinance it at cheaper rate), she will have to
payback originally negotiated price that includes the markup for entire five years, I show
this graphically in Figure 2,4.
In murabaha financing, the borrower does not have the option of prepayment and
refinancing. If this option is not priced in the value of murabaha contract and if
murabaha is for medium to long term then Islamic banks may want to give murabaha
financing to those borrowers who have higher chances of renegotiating favorable terms in
future, for example, new but healthy borrowers who do not have negotiating power now
because they do not have an established credit history but are expected to perform well
and able to negotiate more favorable terms later. One the other hand, the borrowers for
whom this option is more valuable would favor a variable rate product over murabaha.
What happens in reality is an empirical question that I do not address here.
The other implication of the inability to change price in a murabaha contract is that, the
bank cannot charge more if the loan has to be renegotiated to say extend the repayment
period. If Islamic bank extends the maturity of a murabaha contract then this would
effectively lower the markup rate on the financing. In contrast to this, in an interest-based
loan, the bank can extend the maturity of loan and still earn same (or more) interest rate.
This is depicted in Figure 2.5.

18 Literature Survey and Anatomy of Islamic Banking
A corollary of this prohibition of change in the price of murabaha contract is that in the
event of delinquency, in principle, bank cannot charge any penalty to the borrower. To
contain moral hazard on part of borrower, Islamic banks are allowed to charge penalties
on delinquencies, but the bank must give away the penalties that it collects in charity.
This may induce Islamic banks to better screen borrowers to avoid providing free credit to
the delinquent borrowers when the due amounts are delayed or unpaid. On the other hand,
when there is a need and a choice, it may induce borrowers to delay payments for
murabaha / Islamic financing rather than conventional loans hoping that the Islamic bank
would be more willing to waive penalties to leave the borrower in more credit worthy
condition to be able to recover at the least the contracted amount.
Figure 2.4
The Figure displays the present value of a murabaha contract and a loan contract with nominal value of
100 and initial interest/markup rate of 10% fixed for the entire duration of loan/murabaha. The red line
show the present value of the above murabaha when immediately after disbursement the borrower has the
opportunity to renegotiate the contract at 5%, but cannot take it because of the lack of prepayment option
in murabaha. I assume a flat yield curve and assume that the discount rate is the same rate at which
The dashed line shows the present value of a conventional loan in similar situation, where the borrower
avails the renegotiation opportunity.
80
100
120
140
0 1 2 3 4 5
Pre
sen
t V
alu
e of
Lia
bil
ity
Time
Murabaha at i = 10% or Loan Murabaha, i decreased to 5%

Essays on Financial Intermediation and Markets 19
2.3.3.1 Pricing of Murabaha Contract:
Suppose that delinquency does not exist and in the absence of delinquency, the price of
Loan is L and the value of the option to prepay the loan is O, then fair price of Murabaha
contract (M) should be:
M = L – O
Now assume that the probability of delinquency is non-zero with expected loss of E(P)
resulting from the delinquency, also assume that in the event of delinquency, the bank can
charge a late payment fee P such that expected value of P is also E(P) and price of Loan
with delinquency will be:
L* = L
Further assume that the expected loss from delinquency in murabaha financing is also
E(P), and like conventional bank, Islamic bank can charge a penalty P with expected
Figure 2.5The Figure shows the impact of extension of maturity of a murabaha and conventional loan on its yield. I
assume that the for conventional loan, in the event of extension, the bank charges same interest rate for
the extension period as it is charging before extension. In case of murabaha, the total amount payable to
the bank cannot be changed if the bank agrees to extend the maturity.
0%
2%
4%
6%
8%
10%
12%
0 1 2 3 4
An
nu
al
Eff
ecti
ve
Inte
rest
Rate
Maturity Extension(in Years)
Loan Murabaha

20 Literature Survey and Anatomy of Islamic Banking
value E(P), but the Islamic bank must give this penalty in charity. In this case the value of
murabaha (M*) for the Islamic bank is
M* = L* - E(P)
Whereas the cost of murabaha for customer of Islamic bank ( M**) is:
M** = M* + E(P)
In the presence of delinquency risk, in murabaha transactions, dead weight costs12 exist
in the form of penalty that is a cost for the borrower but not revenue for the bank.
Depending on their respective elasticity of the demand for religiosity the bank
(shareholder), depositors and borrower must share this cost as a piety premium.
Shareholders can fulfill their demand for religious investment by investing in non-bank
shares, so primarily this cost must be shared between depositors and borrowers, so the
price of murabaha (Md) in the presence of delinquency will be:
L – O > Md > L – O + E(P)
2.3.4 Ijarah and Ijarah wa’ Iqtina:
Ijarah is a rental contract similar to a conventional lease. In ijarah, the ajir (lessor) allows
the mustajir (lessee) to use an asset in return for rentals. During the period of lease, the
lessor remains the owner of the asset and all risks and rewards of the ownership accrue to
her; whereas, the lessee enjoys the risks and benefits of the user of leased asset. If the
leased assets are damaged by accident then lessor bears the loss, conversely lessor is
responsible for insurance. If the assets are damaged by the negligence of the lessee or if a
third party incurs a loss from the use of assets then lessee is responsible for such losses,
conversely lessee is responsible for third party liability insurance.
12 Note that this is a dead weight cost for bank and customer not for society.

Essays on Financial Intermediation and Markets 21
Leased asset must be non-consumable (depreciation is disregarded). Rentals may vary
over time and lease agreement can be terminated with the mutual consent of lessee and
lessor or it can be terminated by lessor if the lessee contravenes any terms of lease. A key
difference between a conventional lease and Islamic lease (ijarah) is that in the latter, the
lessee does not need to pay rentals if the asset becomes unusable due to accident or
change in law. For example, if a lessor leases deep water drilling equipment or nuclear
power plants under ijarah and subsequently, government restricts deep water drilling or
nuclear power plants rendering the equipment unusable then the lessee is no more liable
to pay the rentals.
Pricing ijarah contract, given the price of a conventional lease contract, is
straightforward. The price of ijarah is the price of a conventional lease plus appropriate
premium to insure the lessor’s ownership related risks.
Ijarah wa'Iqtina is similar to an ijarah contract as described above. The difference
between the two is that in the former, at the termination of lease contract, the lessee
becomes owner of the asset either for free (when lessor gifts the asset to the lessee) or
after paying a pre-agreed price (Baele, Farooq et al. (2010)). Apart from the difference
that, insurance is the responsibility of lessor, ijarah wa'iqtina is comparable to a
conventional financial lease.
2.3.5 Musharakah:
Musharakah is a relationship between two parties or more, who contribute capital to a
business, and share the profits and losses. All providers of capital are entitled to
participate in management, but not necessarily required to do so. The profit is distributed
among the partners in pre-agreed ratios, while the loss is borne by each partner strictly in
proportion to respective capital contributions.

22 Literature Survey and Anatomy of Islamic Banking
Bank and customer enter into a musharakah agreement by investing a certain sum of
capital in the business for a specified period of time so by definition it has a limited life.
Step by step procedure involved in using musharakah as a mode of financing is detailed
in Chapter 3 and Baele, Farooq et al. (2010). For more discussion on the rules of
musharakah please refer to Usmani (1998).
2.3.6 Diminishing Musharakah:
In a diminishing musharakah contract, a bank and her client participate in the joint
ownership of a durable asset (property or equipment). The customer leases the asset and
the bank and customer share the rentals according to their respective ownership in the
underlying asset. The customer also undertakes to purchase parts of the assets over a
period of time at agreed upon dates and price. The ownership of the asset thus gradually
transfers from the bank to the customer. Please refer to Baele, Farooq et al. (2010) for
detailed steps involved in diminishing musharakah transaction.
In diminishing musharakah contracts, banks normally do not charge market rent, neither
do they sell their share in underlying property at the market price. Instead in practice, to
ensure market returns, banks index the rent of underlying property to a benchmark market
interest rate, they also fix the sale price of their share in property to match the returns on
conventional mortgage. It will be an interesting exercise to use historical housing rent and
price data to compare the risk and returns of a diminishing musharakah contract assuming
that the bank charges market rents and sells her shares at market price with the risk and
return of diminishing musharakah as it is practiced.
Essays on Financial Intermediation and Markets 23
2.4 Review of Empirical Literature:
2.4.1 Efficiency:
Efficiency of the Islamic banking has been a concern for scholars, because several
products used in Islamic financing are considered as inefficient by their very nature like
PLS products or because of using superfluous contracts to engineer products similar to
conventional loans, for example murabaha. El-Gamal and Inanoglu (2005) study bank
efficiency in Turkey both in terms of cost-function frontier analyses and labor efficiency
analysis. Using 11 years of data from 1990-2000, they find that Islamic banks in Turkey
are relatively efficient in terms of extension of credit as well as their hiring practices. El-
Gamal and Inanoglu (2005) do not interpret the economic relevance of the differences in
efficiency that they observe, however, they contend that Islamic banks are more efficient
owing to lower ratio of non-performing loans. An interesting finding in their paper is that,
Islamic banks utilize the more efficient hiring techonology of foreign banks, however,
from cost frontier point of view they look similar to domestic private banks that are more
efficient at this front. These findings are not surprising, as in Turkey most of the Islamic
banks are foreign owned but unlike foreign owned conventional banks, that rely on
investment in government bonds, Islamic banks engage in credit operations like domestic
conventional banks.
Al-Deehani, Abdel Karim et al. (1999) show that due to mudaraba based deposits,
Islamic banks can increase their market value without increasing risks. Their simulations
show that a 10% increase in the Investment Account financing results in a first year
increase of 1.6% in market value of the banks. Other empirical studies also suggest that
Islamic banks are not necessarily inefficient (see Bashir (1999), Iqbal (2001); Agaoglu
(1994), Samad (1999)).

24 Literature Survey and Anatomy of Islamic Banking
Contrary to this Moktar, Abdullah et al. (2006) find that from 1997 to 2003, although
technical and cost efficiency of Islamic Banks in Malaysia has increased over time but
Islamic banks still lag behind their conventional counterparts. They also note that full-
fledged Islamic banks are relatively more efficient than Islamic windows of conventional
banks and the technical and cost efficiency of full-fledged Islamic banks is not different
from those of conventional commercial banks. Average cost efficiency of conventional
and Islamic banks in their sample is 87.6% and 86.0% respectively. Further breakup of
these figures reveals interesting information, the average cost efficiency of conventional
commercial banks, full-fledged Islamic banks and Islamic branches of conventional
commercial banks is 87.7%, 87.7% and 85.4% respectively in their sample. This suggests
that full-fledged Islamic and conventional commercial banks are equally cost efficient,
however, the Islamic braches of conventional commercial banks are less cost efficient and
drag the overall results of Islamic banks. It is imperative to note that the efficiency
computations for Islamic branches must be interpreted with caution because the intra-
bank transactions between the Islamic branches and the parent commercial bank may not
necessarily be at arm’s length. If this is true then the ‘actual’ cost efficiency of Islamic
branches may in fact be higher (or lower). Their results show similar results for the
technical efficiency of conventional and Islamic banks.
Study by Sufian (2006), explains the difference in the efficiency in the Malaysian Islamic
banking sector. Using Data Envelopment Analysis on Malaysian Islamic banking data
from 2001-2004, he finds that domestic Islamic banks are more efficient than foreign
Islamic banks, but scale inefficiency dominates pure technical inefficiency within the
Malaysian Islamic banking sector. He estimates that the average pure technical efficiency
of foreign and domestic Islamic banks was 90.7% and 94.8% respectively in his sample,
whereas the average scale efficiencies for these groups were 75.2% and 91.0%

Essays on Financial Intermediation and Markets 25
respectively. This suggests that Islamic banks can gain some efficiency by changing scale
of their operations, if possible.
There are big cross-country differences in the efficiency of Islamic banks. In a cross-
country study covering 14 countries from 1999-2001, Brown (2003) finds that the most
efficient Islamic banks are consistently found in Iran, Brunei and Yemen (fully efficient).
Malaysian banks were fully cost efficient in 1999 and 2000 and the least cost efficient
countries are Indonesia and Sudan (38% - 68% efficiency). He suggests that the different
operating environments and financial reporting practices in each country might be driving
these results.
In a recent study employing data from 10 countries over the period of 1996-2002,
Abdul-Majid, Saal et al. (2010), find that Islamic banks are technically inefficient as
compared to their conventional counterparts. On average, Islamic banks operate at 41.8%
below their potential output levels as compared to conventional banks that operate at
16.3% below their potential. This substantially low level of efficiency of Islamic banks is
mainly driven by Sudan and Yemen as Islamic banks in these countries operate at
extremely low efficiency levels. Furthermore, the efficiency of Islamic banks varies
significantly across countries. They find the Islamic banks in Sudan and Yemen to be
least efficient and those in Bahrain and Bangladesh to be the most efficient in 10
countries that they analyze. It should be noted that this study classifies the Islamic
banking in Yemen as the least efficient according to the estimates of Brown (2003), banks
in Yemen were fully efficient. Contrary to the study of Abdul-Majid, Saal et al. (2010),
using data from 2001-2006 encompassing 21 countries, Bader, Mohamad et al. (2008) do
not find any significant difference between the overall efficiency of conventional and
Islamic banks. The differences in the results of these studies can be attributed to different
efficiency measures, samples and periods

26 Literature Survey and Anatomy of Islamic Banking
In a broader study spanning 141 countries and covering period of 1995-2007, Beck,
Demirgüç-Kunt et al. (2010) find Islamic banks to be more efficient in the larger sample
comprising all countries, but less efficient than conventional banks in countries where
Islamic and conventional banks co-exist. They report 6.4 % lower cost-income ratio and
0.9 % lower overhead costs for Islamic banks as compared to their conventional
counterparts. These differences are economically meaningful compared to the mean value
of 62% for cost-income ratio and 3.5% for overhead costs. However, in countries where
both Islamic and conventional banks co-exist, Islamic banks have a 3.5 percentage point
higher cost-income ratio and 0.3 percentage points more overhead costs than conventional
banks. The lesser efficiency of Islamic banks as compared to the conventional banks
where both banks coexist might be related to the presence of relatively younger Islamic
banks in those countries, with higher establishment related costs in the initial years and a
need to spend more to gain traction and compete with the relatively mature conventional
banks with established brands, clientele and systems. Another reason for this difference
could be relative strength of conventional banks to harness efficiency from economies of
scale and scope that might not be available to relatively younger Islamic banks.
The literature on efficiency does not provide any conclusive evidence of the absolute
superiority of Islamic or conventional banks in terms of their efficiency. The results are
overall mixed, with Islamic banks more efficient in some forms or countries and less in
others. This suggests that, both Islamic and conventional banks have potential to gain
efficiency in different regions or by employing certain structures.
2.4.2 Performance:
It is a long held idea that profit and loss sharing system is inherently more stable and will
perform better than an interest based system. Using Bahrain Islamic Bank (BIB) as a case,

Essays on Financial Intermediation and Markets 27
Turen (1996) shows that during the period of analysis this bank offered a higher risk
adjusted return as compared to commercial banks operating in Bahrain and argues that the
profit sharing concept of Islamic banking can achieve a higher profitability and
lower risk than conventional commercial banks. He reports average gross income to risk
weighted assets ratio of 3.85% and 7.88% for conventional banks and BIB respectively
during 1980’s.
Al-Deehani, Abdel Karim et al. (1999) argue that because of the profit sharing provisions
with the depositors, Islamic bank can to increase their market value and return on equity
without incurring any additional financial risk. Using a sample of 12 Islamic banks they
provide empirical evidence in support of their theoretical argument. Their simulations
show that a 10% increase in the Investment Account financing results in first year
increase of 1.6% in market value of the banks.
2.4.3 Financial Stability:
The proponents of Islamic finance argue that financial intermediation based on Islamic
principles would bring in greater stability in domestic economy, financial markets and
even in international economy. (Siddiqi (2006); Zaher and Hassan (2001); Nigel (1998);
El-Gamal (2000)). There is, however, a dearth of studies to empirically test this
hypothesis.
Employing Z-scores to test the relative strength of banks in 18 countries from 1993-2004,
Čihák and Hesse (2010) find significant differences in the z-scores of conventional and
Islamic banks. They also report differences in strength of small and large Islamic banks,
they find that small Islamic banks are financially stronger than small and large
commercial banks, whereas, large Islamic banks are weaker than large commercial banks.
The z-scores calculated by them for large conventional and Islamic banks are 19.5 and
28 Literature Survey and Anatomy of Islamic Banking
12.9, whereas, z-scores for small conventional and Islamic banks are 17.2 and 25.0
respectively. They attribute their findings to the challenges of credit risk management, in
large Islamic banks, related to PLS based financing. However, PLS based financing form
a very small part of the overall credit portfolio of Islamic banks and is unlikely to drive
this result.
In a sample of 22 countries covering the period from 2001 till 2008, Abedifar, Tarazi et
al. (2010) also find that small Islamic banks are safer relative to small conventional banks
with respect to credit risk, but this does not hold for large Islamic and conventional banks.
In their estimates, small Islamic banks have 2.6% lower infection rate as compared to
small conventional banks. They argue that a possible explanation for this finding is that
small Islamic banks might be attracting more Islamic oriented and risk averse customers
with lower propensity to default.
In a broader study covering 141 countries over the period 1995-2007, Beck, Demirgüç-
Kunt et al. (2010) note that Islamic banks are better capitalized with average capital-asset
ratio 2.5% higher than conventional banks. This difference is economically large given
mean capital-asset ratio of 10.8% in the sample. However, despite better capitalization,
they do not find significant difference between the stability of Islamic and conventional
banks.
Using loan level data from Pakistan covering the period from 2006 to 2008, Baele,
Farooq et al. (2010) find that as compared to conventional loans, on average Islamic loans
are less likely to default. They show robust evidence that the default rate on Islamic loans
is less than half of the default rate on conventional loans.
The literature thus suggest that the structure of banking sector and the size and
organization of Islamic banks may influence the health of Islamic banks with consistent
evidence that small Islamic banks are stronger than small conventional banks. This does

Essays on Financial Intermediation and Markets 29
not hold for large Islamic and conventional bank, where large conventional banks are
equally or more stable than large Islamic banks.
2.4.4 Islamic Banking Deposits and Monetary Policy Shocks:
Proponents of interest-free banking purport that interest-free economies are destined to
have relatively more monetary stability than interest based economies because interest-
free system ties the credit to assets that reduce bubble formation and speculation.
There is little empirical research on the impact of monetary policy shocks on the deposits
of Islamic banks viz-a-viz conventional banks. Some survey studies suggest that deposits
in Islamic banks may be more resilient to monetary policy shocks (Khan (2010), and
Gerrard and Cunningham (1997)). Gerrard and Cunningham (1997) document that over
60% of the Muslim customers of Islamic banks declared that they will not withdraw
deposit even if the bank does not pay any return. This is suggestive of relative
insensitivity of the depositors of Islamic banks to the changes in interest/return rate and
can have important implications for the conduct and transmission of monetary policy.
Contrary to these results, Yusof, Abd. Majid et al. (2009) provide some empirical
evidence from Malaysia to show that balance sheets of Islamic banks are more sensitive
to monetary policy changes as compared to those of conventional banks. This suggests
that the impact of monetary policy shocks can be more destabilizing for Islamic banks as
compared to their conventional counterparts.
2.4.5 Islamic Bank Customers:
Theologically, conformity to the prohibition of interest is not a matter of choice for
Muslims, however, practically they can choose between Islamic and conventional banks.
Traditionally analysts have argued that pious Muslims are the primary users of Islamic
financial products (Pepinsky (2010)). What motivates customers to bank with Islamic
30 Literature Survey and Anatomy of Islamic Banking
banks or what type of customers an Islamic bank chooses is an empirical question,
therefore, I turn to the empirical evidence available in literature.
Gerrard and Cunningham (1997)’s study suggests that religious motivations may govern
the choice of bank or staying with an Islamic bank in turbulent times. In their study, in
Singapore, in response to a survey question, 62.1 per cent of Muslims said that they
would keep their deposits with the Islamic banks if their bank did not make sufficient
profits to give a return on deposits. As compared to this, 66.5 per cent of non-Muslims
said that they would withdraw their deposits in such a case.
Pepinsky (2010) suggests that class, not piety, is a determinant of the use of Islamic
banking in Indonesia. He recognizes that if banking products (deposits) are just more
expensive than conventional banking products then a correlation between incomes and
banking choice only suggests that sensitivity to price is a declining function of income.
He rejects that this is the case quoting that the returns on conventional and Islamic
deposits in Indonesia are same.
However, due to the profit and loss sharing provisions, if Islamic deposits are marginally
more risky than conventional deposits, and returns on both types of deposits are same
then it follows that risk-adjusted returns on Islamic deposits are lower than risk-adjusted
returns on conventional deposits. If this is correct, then the inferences drawn by Pepinsky
(2010) warrant a revisit.
Using a survey of Pakistani depositors, Khan and Khanna (2010) find that indeed besides
religiosity, wealth also matters in banking with an Islamic bank. Khan (2010) finds that
growth rates of deposits of Islamic banks are substantially higher than that of
conventional banks, average about 13.5% during the sample period compared to 1-2% for
other banks, and that this higher growth rate is resilient to financial crisis.

Essays on Financial Intermediation and Markets 31
Regarding bank choice in commercial setting, Ongena and Şendeniz-Yüncü (2011) find
that Islamic banks deal with young, multiple-bank, industry-focused and transparent
firms.
These papers suggest that there can be rational or economic reasons for people and firms
to choose Islamic banks, however, religiosity does influence this choice.
2.4.6 Islamic Banking and Judicial Uncertainty:
Islamic contracts need to conform to two laws, the law of the land and the Shari’ah.
Because of this additional requirement of compliance and because Shari’ah is considered
to be indefinite and open to interpretation, concerns has been raised regarding additional
judicial risk in Islamic financial contracts (see, for example Jobst (2007)). To unscramble
this issue further, it is important to distinguish between the cases where the contracts are
entered into so called Islamic countries or secular countries and if this risk arises out of
the cross country differences in legal opinions.
In secular countries, the law of the land is not subservient to Shari’ah. In case of any
conflict the law of the land prevails, therefore, Islamic financial contracts entered into
secular countries have as much judicial uncertainty as any other secular financial
contracts as both are governed by the same laws and statues.
Islamic laws may be interpreted differently in different countries or by the adherents of
different schools of thoughts, but this holds for secular laws as well. The set of (secular)
laws and their specific interpretation and implementation may differ substantially across
different countries, therefore, the cross country judicial uncertainty surrounding Islamic
(financial) contracts equally applies to secular contracts as well.

32 Literature Survey and Anatomy of Islamic Banking
It is important to highlight that uncertainty regarding the interpretation of law is not
specific to Islamic laws, Rosenfeld (1998) notes “So long as laws must be applied and
legal disputes adjudicated, legal interpretation cannot be avoided”. Moreover, within
individual countries the school of thought of the majority of the population is considered
by courts to decide the legal disputes and as Yefet (2009) notes, if there are competing
interpretations then the interpretation that is compatible with the constitution is applied .
It has been shown in other contexts that, courts consistently interpret the Islamic laws and
then consistently use that interpretation as a precedent for subsequent decisions (Yefet
(2009)).
In Islamic countries (where Shari’ah is declared as the supreme law), secular financial
contracts may be subject to more judicial uncertainty as either the plaintiff, the defendant
or the court may invoke Shari’ah, this is documented by Yefet (2009) in a different
context.
This suggests that Islamic financial contracts may not have a higher judicial risk than
their conventional counterparts.
2.5 Conclusions
Islamic banking is a promising and burgeoning field, but most of the literature has so far
been focused on theological or economic justification of the notion, theoretical models,
and practitioner’s literature with little attention to empirical evidence. Most of the
empirical work is devoted to comparing the efficiency of Islamic banking with
conventional banking. There is specially a dearth of empirical literature concerning
product pricing, significance of certain provisions of Islamic contracts on the behavior of
contracting parties, resilience of Islamic banking to monetary policy shocks or its
insulation from contagion affecting other banks. More empirical literature can further our

Essays on Financial Intermediation and Markets 33
understanding of Islamic banking, and can give useful insights that can be used in
conventional banking as well. I hope to see more empirical literature in the field of
Islamic banking related to these issues.

34
3
Of Religion and Redemption:
Evidence from Default on Islamic
Loans13
3.1 Introduction
Islamic banking is one of the fastest growing parts of the financial sector. Doubled in
size since 2006 and already accounting for $900 billion or more than 1% of the global
banking market (Financial Times, May 12, 2011), “the global potential of the Islamic
banking market is conservatively estimated at $4,000 billion, according to Moody’s
Investor Service” (Financial Times, July 8, 2008). The financial crisis may have
spurred its growth and potential market share even further, as observers claim the
“principles based on religious law insulate the industry from the worst of the financial
13 This chapter is based on Baele, Farooq et al. (2010). The authors acknowledge the data support from State Bank of Pakistan, however, all views expressed here are those of authors and do not necessarily represent the views of State Bank of Pakistan or its subsidiaries

Essays on Financial Intermediation and Markets 35
crisis” (Washington Post, October 31, 2008; see also the International Monetary Fund
report by Hasan and Dridi (2010)).
Yet despite the fast growth of Islamic banking and the imperative claims made about
the built-in protection against excessive risk-taking by financial institutions, no
research (we are aware of) so far has investigated the default rate of individual
conventional versus Islamic loans. This lack of evidence should not come as a surprise,
because the identification challenges, and corresponding data requirements, faced by
such an analysis are steep. Borrowers seeking Islamic financing and banks granting it
may differ from their conventional counterparts in many observable and unobservable
characteristics. Whether therefore the difference in credit risk in conventional and
Islamic financing is mainly due to compliance with the principles of Islamic law (the
Shari’ah) per se, or is due to borrower, loan contract and/or bank characteristics that
are independent of any Islamic rulings remains an open question we aim to address in
this chapter.
The data set we employ covers all business loans that were outstanding in Pakistan
during the period 2006:4 to 2008:12. The Credit Information Bureau (CIB) database,
that we use, is maintained by the Consumer Protection Department of the State Bank of
Pakistan and is also analyzed in Khwaja and Mian (2005), Mian (2006), Khwaja and
Mian (2008), and Zia (2008) for example. The country and sample period provide a
unique setting to analyze the credit risk in Islamic loans.14
14 We henceforth employ the term “Islamic loan”, for ease of writing and in accordance with practice of the Credit Information Bureau (CIB) of the State Bank of Pakistan. The CIB maintains uniform records on conventional and “Islamic loans” (and even imputes an implied interest rate for the latter category). As we review briefly later “Islamic loans” involve no interest payments and almost always consist of multiple underlying contracts. For these and various other reasons scholars are often hesitant to label many of the Islamic financial products we will study as “loans” (Kuran (2004)) or even as “Islamic” (see the discussion in Pepinsky (2010) and Khan and Khanna (2010) for example).

36 Of Religion and Redemption: Evidence from Default on Islamic Loan
Pakistan may be one of the few countries in the world where both well-developed
conventional and Islamic banking sectors have co-existed for a considerable period of
time.15 Though the characteristics of borrowers, loan contracts and banks may differ
between conventional and Islamic loans, their co-existence in Pakistan offers a unique
opportunity to assess the effect of religion on the loan default rate. The majority of
Islamic loans granted in Pakistan are simple and standard equivalents to conventional
loans, and therefore comparable to these conventional loans and to similar Islamic
loans in other countries. Quite a few firms and banks repeatedly and concurrently
engage in both conventional and Islamic type financing providing unique opportunities
for advanced empirical identification. During the sample period loans continued to be
first liberally granted and then increasingly started to default.
Estimating a variety of empirical models, we find robust evidence that Islamic loans
are less likely to default. This effect is not only statistically significant, but also
economically relevant. The hazard rate on Islamic loans (in various duration models) is
on average less than half the hazard rate on conventional loans. For the same borrower
taking both conventional and Islamic loans from the same bank, the hazard rate on
Islamic loans drops to one fifth the hazard rate on conventional loans. These findings
hold in a variety of specifications that contain pertinent combinations of borrower, loan
contract and bank characteristics, and year*month, borrower, bank and borrower*bank
fixed effects.
The elimination of interest in all its forms or Riba in Islamic banking, and the resultant
structuring of Islamic loans into, among others, deferred-sale and lease-like contracts,
15 Pakistan is the second most populous Muslim country in the world (behind Indonesia). It has 185 million inhabitants, of which 95 percent are Muslim (Source: CIA Factbook). It shares a long history with Bangladesh and India. These countries combined account for one third of all Muslims in the world.
Essays on Financial Intermediation and Markets 37
may provide only a partial explanation for this robust finding. We cannot exclude the
possibility that borrowers may also feel a more acute conflict with their individual
religious beliefs or those of their fellow believers when defaulting on an Islamic loan
(Iannaccone (1998) and Guiso, Sapienza et al. (2006)). Suggestive on this account is
our finding that Islamic loans are less likely to default during Ramadan and in big cities
− where family and other social networks may be weaker and the distinction between
religious and other political parties may be more acute − if the share of votes to
religious-political parties increases.
Our study aims, therefore, to contribute to a wider literature (Barro and McCleary
(2006)) that investigates how religion helps to explain differences in economic growth
across countries (Barro and McCleary (2003)), former colonies (Grier (1997)), regions
(Landes (1999)), and early European cities (Dudley and Blum (2001)), and how
religion may unidirectionally determine economic development (Barros, Berglof et al.
(2005), Barro and McCleary (2006)), through its potential impact on investor protection
(Stulz and Williamson (2003)), economic attitude (Guiso, Sapienza et al. (2003)),
entrepreneurship (Audretsch, Bönte et al. (2007)), human capital formation (Becker and
Wößmann (2009)), occupational organization (Richardson and McBride (2009)), work
ethic (Spenkuch (2011)), and/or risk aversion (Hilary and Hui (2010)).
The rest of the chapter proceeds as follows. Section I explains the basic tenets of
Islamic banking and their relevance for loan default. Section II introduces the data, our
identification strategy, and duration models. Section III discusses the empirical results.
Section IV concludes.

38 Of Religion and Redemption: Evidence from Default on Islamic Loan
3.2 Islamic Banking and Loan Default
3.2.1 Islamic Banking
Islamic Banking refers to a system of banking or banking practices that is consistent,
both in objectives and operations, with the Shari’ah. The main principles are either
directly based on the Qur’an and the sayings and actions of the prophet Mohammed, or
on a growing body of Islamic jurisprudence that is being developed by Islamic scholars.
The key distinguishing feature of Islamic banking is the prohibition of interest (riba):16
Islamic banks are not allowed to offer a fixed rate of return on deposits and are not
allowed to charge interest on loans, or any positive, fixed, predetermined rate of return
that is guaranteed regardless of the performance of the investment.
Ideal modes of Islamic financing are based on the profit-and-loss sharing (PLS)
paradigm (we provide details on the different types of Islamic financing in Appendix 3-
A). Examples include Musharakah (partnership where all partners invest both money
and expertise) and Mudarabah (partnership with some partners investing only money
and others only their skills/labor). The ex-ante fixed rate of return common in
conventional loan products is replaced by a return that is uncertain and dependent on
the borrowing company's realized profits, which make these two financing structures
compatible with Shari’ah principles. Notice that both Musharakah and Mudarabah
bear very little resemblance with interest-bearing contracts in conventional banking,
which would make it problematic to compare their respective default rates. In practice,
16 See El-Gamal (2001) for a detailed discussion of riba. Other important principles include the prohibition to: (i) invest in sinful activities (such as businesses involving alcohol, firearms, pork products, or adult entertainment); (ii) unequal exchange of money for debt (without an underlying real asset); (iii) speculate, bet, or gamble; (iv) trade the same object between the buyer and seller; and (v) engage in contracts with preventable uncertainty (see e.g. Jobst (2007)).

Essays on Financial Intermediation and Markets 39
however, PLS contracts only constitute a small share of the market for Islamic loans
products. In fact, in our sample, less than 3 percent of all Islamic loans are based on the
PLS principle.17
Instead, Islamic banks have developed lending structures that, while being Shari’ah
compliant, largely mimic the characteristics of conventional lending products. In a
Murabahah contract (similar to a term loan), the bank first purchases a real asset from a
supplier, and consequently sells it in a different contract at a marked-up price to the
borrower. Interest rate payments are implicit as the borrower pays the markup price in
installments over a period of time or in lump sum at maturity of the contract. This
contract is permissible because trade in general is allowed and also the bank is
technically exposed to risk between the moment it takes legal possession of the
underlying asset (first contract) and the moment it transfers the asset to the borrower
(second contract), even if in practice this moment is often very short.
Similarly, Islamic leasing products have been developed. In case of Ijarah, the bank
buys an asset for a customer and then leases it to the customer for a certain period at a
fixed rental charge. Islamic law allows rent to be charged because the customer enjoys
the usufruct of the good while the bank bears the risk of ownership. Ijarah wa'Iqtina is
similar to an Ijarah contract except that it allows for the possibility that the customer
becomes owner of the good at the end of the lease contract, either for free (gift) or at a
pre-agreed price. Finally, in a diminishing Musharakah contract, a financier and his
17 Often quoted reasons include agency problems, lack of well-defined property laws, the restrictive role of shareholders in management, or a disadvantageous tax treatment. Many banks, facing competition from conventional banks, may consider PLS contracts as being too risky. See also Bashir, Darrat et al. (1993) and Dar and Presley (2000), among others. The low share of PLS lending contracts is not specific to Pakistan. Chong and Liu (2009), for instance, find that only 0.5 percent of Islamic loans in Malaysia adopt the PLS paradigm.

40 Of Religion and Redemption: Evidence from Default on Islamic Loan
client participate either in the joint ownership of a property or an equipment. What is
different, however, is that the share of the financier is divided into a number of units,
which at pre-agreed moments in time will be purchased by the client. Each period, the
client’s share increases until all units are bought and he fully owns the property or
asset. Rent is paid to the financier according to his remaining share in the project.
3.2.2 Default on Conventional and Islamic Loans
The previous section showed that the most popular Islamic lending products are
functionally identical to conventional loan products.18 Does this mean that we should
also expect their default rates to be similar? Clearly, Islamic loans are structured
differently and are governed by different contracts than conventional loans. Moreover,
there can be different motivations to prefer one form of banking over the other. For
example borrowers may choose conventional over Islamic banks because of easy
accessibility or specific product needs. If proximity of the closest bank branch or
suitability of product is the overriding reason to choose one type of loan over the other,
we do not necessarily expect that the default rate on either type of loans will
systematically differ.
Nevertheless competing hypotheses can be formed regarding the motivation for
preferring one form of credit over the other and the expected default rates associated
with that choice. The existence of Islamic banking per se is based on religion and for
borrowers taking an Islamic loan plainly is a real economic decision (i.e., “putting your
money where your mouth is”). An Islamic loan is – after all – a financial product with
18 Apart from being functionally identical, conventional and Islamic loans are also subject to a similar tax treatment in Pakistan, in contrast to Malaysia for example where Islamic financing enjoys tax advantages.

Essays on Financial Intermediation and Markets 41
certain characteristics one of which is its accordance with the Shari’ah. The text that
prohibits interest payments, i.e., Al Quran and Hadith, also prohibits the
misappropriation of other people’s properties (i.e., “the eating other people’s money in
an unlawful way”). Those who choose to stick to one rule (i.e., the avoidance of interest
payments) are expected to have a higher propensity to follow the other rule (i.e., do not
default) as well. Therefore, if borrowers obtain Islamic loans because of their religious
motives then they are expected to default less on their loans (we return to this
conjecture later in the chapter).
Borrowers likely base their borrowing and default decisions on a rational comparison
of the associated costs of the respective loan contracts. They, when choosing a loan,
also take into account the expected cost of default. Banks can charge a penalty to a
borrower defaulting on an Islamic loan, but unlike with a conventional loan they have
to give that amount to charity.19 Islamic lenders should, therefore, be reluctant to
impose penalties to keep the borrower in a more solvent state. This makes the expected
cost of an Islamic loan default for a borrower lower than the expected cost of a
conventional loan default. Therefore, those who have a higher probability of default
should prefer Islamic over conventional loans and we should observe a higher rate of
default on Islamic loans.
On the other hand, lenders may set the penalties on conventional loans lower than on
Islamic loans to attract fees from borrowers that are expected to being only temporarily
19 If a client does not fully pay on the due date or soon after, and hence is delinquent and “defaults”, the price cannot be changed under Islamic rulings nor can penalty fees be charged. In order to deal with the associated moral hazard of the clients (i.e., “the incentives (that) exist for default and abuse” (Iqbal (1987)), it is therefore nevertheless possible under Shari’ah to charge a penalty, but only if the money is given to charity. If the Islamic bank incurs a real loss (and not simply the opportunity cost of a delayed payment) then an external arbitrator can also allow the bank to actually keep (part of) the penalty.

42 Of Religion and Redemption: Evidence from Default on Islamic Loan
unable to repay their loan commitments. Islamic loan contracts may further result in a
swifter loss of access for the borrower to the financed object (a car, for example) than a
conventional loan, especially when the latter is uncollateralized. In both cases the
probability of default of an Islamic loan may be lower.
Like borrowers, banks base their lending decisions on a rational comparison of the
associated costs and benefits. Loan officers at banks granting Islamic loans may for
example target young and more risky borrowers to reap future business and higher
returns, or they may be less experienced in assessing credit risk and less sensitive about
the credit quality of their borrowers in general. In all these cases we will observe a
higher rate of default on Islamic loans.
On the other hand, banks may be more concerned about the judicial risk when granting
Islamic loans (Jobst (2007)). Not only can Islamic borrowers turn to Shari’ah courts,
which rule on a case-by-case basis, but they can also seek redress in regular courts
which may also turn the Shari’ah when faced with an Islamic loan (see Hussain (2011)
for a primer on the Pakistani court system). To avoid this “double jeopardy” banks may
screen Islamic borrowers more strictly or evergreen non-performing Islamic loans by
rolling them into new Islamic loans or even conventional loans. All these actions will
likely mitigate (or at least delay) Islamic loan default. But the opposite is also true and
conventional loans may be challenged on the basis of the Shari’ah.
In sum, our analysis will need to rely on a variety of borrower, loan contract and bank
controls and fixed effects to account for both observed and unobserved borrower, loan
contract and bank heterogeneity. However, our definition of loan default (detailed later)
and the wide-spread presence of standardized loans in our dataset all but rule out the
relevance of the discussed judicial risk for our estimates.

Essays on Financial Intermediation and Markets 43
3.2.3 Empirical Literature
Though the characteristics of borrowers, loan contracts and banks may differ between
conventional and Islamic loans, their co-existence in Pakistan offers a unique
opportunity to assess the effect of religion on the loan default rate. We are not the first
to empirically study Islamic banking − we summarize relevant papers in Table 3.1.
With a few exceptions most studies indicate there are no significant differences
between conventional and Islamic banks in their business orientation, efficiency, asset
quality, or stability for example (see Beck, Demirgüç-Kunt et al. (2010) for a
comprehensive study).
Yet our study, as far as we are aware, is the first to access individual loan data to
empirically investigate the differences between conventional and Islamic lending at the
contract level, in particular with respect to each loan’s repayment performance. A
decisive step in our otherwise straightforward identification strategy exploits the
concurrent repayment over time of both conventional and Islamic loans by the same
borrower to the same bank.
3.3 Data and Identification Strategy
3.3.1 Data Description
We analyze loan level data obtained from the Consumer Protection Department (CPD)
of the State Bank of Pakistan that maintains the domestic credit registry, i.e., the Credit
Information Bureau (CIB). The monthly available data covers all business loans
outstanding in Pakistan from 2006:4 to 2008:12, including both the run-up to and the

44
Table 3.1. The table summarizes selected empirical work on Islamic banking.
Paper Sample Analysis
Countries Period # Obs. At Level Explains Finds (w.r.t. differences between
conventional and Islamic banks / loans)
Imam and Kpodar (2010) 117 1992-2006 1,520 Country - Year Presence Identifies various factors of diffusion
Mohamad, Hassan et al. (2008), Bader, Mohamad et al. (2008)
21 1990-2005 80 Bank Efficiency No differences
Chong and Liu (2009) Malaysia 1995:04-2004:04 109 Month Average interest rates
Islamic deposits are not interest-free, but are closely pegged to conventional deposits
Čihák and Hesse (2010) 18 1993-2004 2,347 Bank - Year Z-score Bank strength
Small Islamic > small commercial Large commercial > large Islamic Small Islamic > large Islamic
Abdul-Majid, Saal et al. (2010) 10 1996-2002 Bank - Year Technical inefficiency
Islamic banks are more technically inefficient
Abedifar, Molyneux et al. (2011)
22 2001-2008 1,230 Bank - Year Bank stability, loan risk
No differences in insolvency risk; for Islamic banks lower loan loss reserves or problem loans but more frequent write-offs and lower recovery
Weill (2010) 17 2000-2007 1,301 Bank - Year Bank market power (Lerner)
Islamic banks have somewhat less market power
Beck, Demirgüç-Kunt et al. (2010)
141 1995-2007 25,000 Bank - Year Various bank measures
Few significant differences in business orientation, efficiency, asset quality, or stability
Ongena and Şendeniz-Yüncü (2011)
Turkey 2008 16,056 Bank - Firm Firm bank choice Islamic banks deal with young, multiple-bank, industry-focused and transparent firms
Pepinsky (2010) Indonesia 2008:05/06 2,548 Consumers Views on Islamic Finance
Islamic identity matters, not piety
Khan and Khanna (2010) Pakistan 2008 9,078 Customers at two banks
Opening bank account
Religiosity and wealth matters when opening an Islamic bank account
Khan (2010) Pakistan 2006:06-2009:03 995 Bank - Account Growth deposit accounts
Islamic deposit accounts grow faster than conventional ones
This chapter Pakistan 2006:04-2008:12 603,677 Loan - Month Loan default Islamic loans less likely to default
Essays on Financial Intermediation and Markets 45
financial crisis20 itself (for 16 months each if one takes 2007:08 as the start date of the
crisis). All loans were granted in the local currency, the Pakistani rupee (code: PKR. 1
USD ~ 79 PKR, 1 EUR ~ 110 PKR on December 31st, 2008).
All banks in Pakistan are required to consult the CIB to verify the credit history of a
loan applicant if the application exceeds PKR 500,000, and this requirement is similar
for conventional and Islamic loans. The CIB data set is also, therefore, thought to be of
good quality and has already been studied in different contexts by Khwaja and Mian
(2005), Mian (2006), Khwaja and Mian (2008), and Zia (2008) for example.21
For each loan contract the CIB records the identity code and total exposure of the
borrower and his location and industry. While we do not have financial information on
the borrowers other than the precise loan characteristics, we do know that each
borrower meets a specific threshold of financial soundness and is required to have a
debt to equity ratio of 4:1 or better, and a current ratio of at least 1. Deviations from
these requirements are allowed only in exceptional cases.
The CIB further reports key loan characteristics, such as the exact financial loan
product name, default status, maturity, collateralization, whether cash is immediately
20 As the financial sector still maintains limited, albeit growing, linkages with global financial markets, Pakistan has been relatively well-insulated against contagion coming from international financial markets (Mansoor Ali (2009)). Actually Pakistan underwent a phase of fiscal tightening and a stringent monetary stance with discount rates remaining relatively high for the entire sample period (discount rates remained at 15 percent till April 2009), to address significant macroeconomic imbalances in the domestic economy, rather than as a response to the financial crisis and global economic slowdown.
21 As in these papers we do not observe loan need and/or demand to account for the “double” selection bias, in the spirit of Heckman (1979), as in Cerqueiro (2009), Chakravarty and Yilmazer (2009), and Ongena and Popov (2011) for example. Neither do we observe loan applications to study the approval of applications and/or loan granting as in Brown, Kirschenmann et al. (2010), Jiménez, Ongena et al. (2011), and Puri, Rocholl et al. (2011) for example. But we are mainly interested in the differential loan default probabilities and control for observed and unobserved loan contract, borrower, bank, borrower-bank and time heterogeneity with combinations of characteristics and fixed effects. We also do not investigate riskiness at the bank or system level where Islamic deposit taking and limits on hedging and trading may be important.

46 Of Religion and Redemption: Evidence from Default on Islamic Loan
disbursed or whether the loan is contingent, loan use for export or agricultural
purposes, the approved limit and the remaining outstanding amount. The loan rate is
also available for a subset of loans. Finally, the CIB records a unique and matching
code for the lending bank and the branch where the loan is granted.
Our analysis of individual loan performance commences from the point when a unique
credit decision is made. We therefore focus on new loans and loans that are renewed,
extended or altered during the sample period. If a borrower obtains two different credit
lines for example then both are considered as separate loans. During our 32-month
sample period there are 1,238,574 loan-months related to distinct new loans out of a
total of almost 4 million loan-months involving 107 financial institutions. Table 3.2
provides the sample details.
We discard all loans given to the federal, provincial or local governments, financial
intermediaries, autonomous bodies and public sector enterprises because these non-
corporate borrowers either cannot default on domestic currency loans, or have different
default dynamics that are beyond the scope of this chapter. We also exclude from our
Variable Number of Observations Unit
All new loans granted 1,238,574 loan - months
Minus loans to non-corporates 363,221 loan - months
Minus micro, special and non-bank loans 252,047 loan - months
Sample loans observed each month 603,677 loan - months
Conventional 571,478 loan - months
Islamic 32,199 loan - months
Loans 152,730 loans
Borrowers 22,723 borrowers
Banks 40 banks
PKR = Pakistani Rupee. 1 USD ~ 79 PKR , 1 EUR ~ 110 PKR (December 31, 2008).
The table reports the composition of the sample. The sample period runs from 2006:04 to 2008:12.
Loans to non-corporates include loans to financial intermediaries, public sector enterprises, local,
provincial or federal governments, and other autonomous bodies. Micro, special and non-bank loans
comprise loans smaller than PKR 50,000, loans larger than PKR 419,000,000, infrastructure and
other special loans, and loans granted by financial institutions that are not registered as banks.
Table 3.2: Sample Composition

Essays on Financial Intermediation and Markets 47
analysis micro loans of less than PKR 50,000 (retaining them does not alter results),
loans larger than PKR 419,000,000, infrastructure and other special loans, and loans
granted by financial institutions that are not registered as banks.
Our final dataset consists of 603,677 complete loan-month observations, which
corresponds to 152,730 loans granted to 22,723 borrowers by 40 different banks.22
Around 5 percent of our sample involves Islamic loans (32,199 loan-months), that are
granted either by one of the six Islamic banks in our sample (15,153 loan-months) or by
an Islamic branch or subsidiary of one of the twelve “mixed” banks that offer both
conventional and Islamic loans (17,046 loan-months). All bank names (and types) are
listed in Appendix 3-B. As of December 2008 there were 8,225 conventional and 514
Islamic bank branches.
About 43% of the Islamic financing in our sample is Murabahah financing, about 22%
is Diminishing Musharakah, and about 24% is Ijarah and Ijarah wa'Iqtina. The pure
profit and loss sharing (partnership) contracts, Mudaraba and Musharakah, constitute a
very small fraction of the market, i.e., only 2% and 1%, respectively.
Crucially for our identification strategy is the observation that within the sample period
quite a few borrowers and banks have balance sheets containing both conventional and
Islamic loans. As indicated in Table 3.3 in total 91,008 loan-months involve borrowers
that obtain both loan types, while in total 378,649 loan-months involve one of the
twelve mixed banks. For 17,381 loan-months the same borrower within the sample
period obtains conventional and Islamic loans from the same bank.
22 This attrition we face (which is also caused by data availability) from 107 financial institutions to 40 banks is similar to Khwaja and Mian (2008) who study 42 banks out 145 financial institutions.
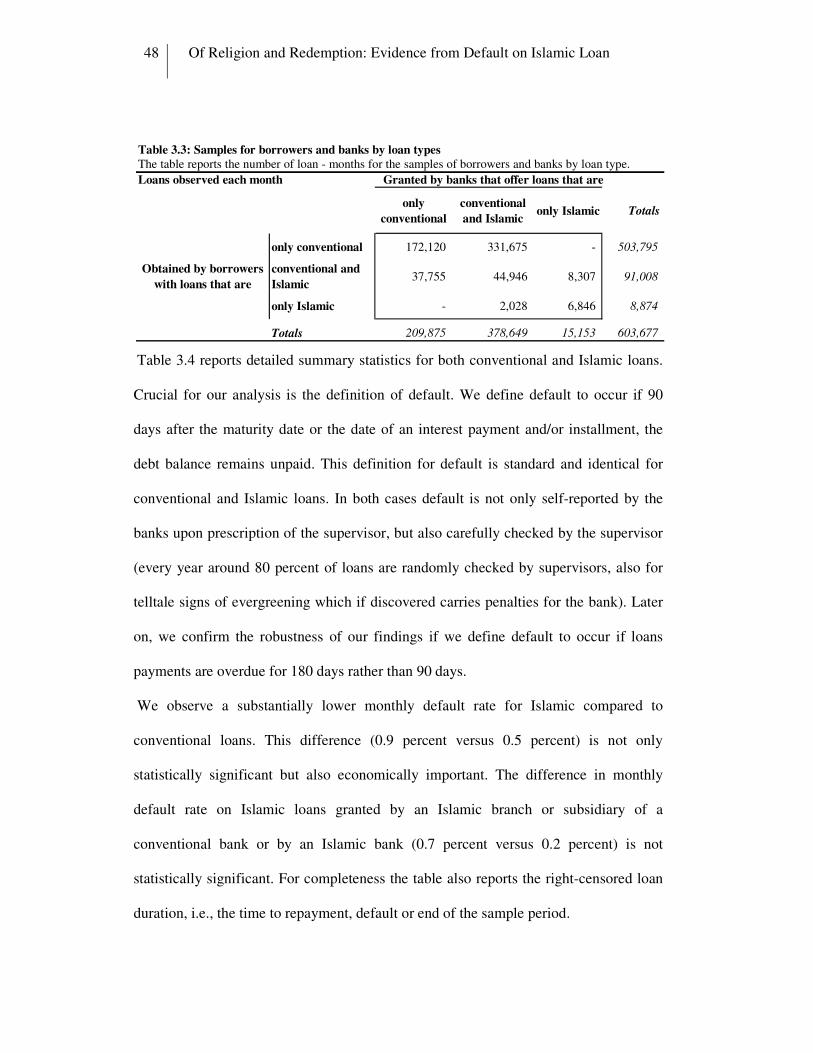
48 Of Religion and Redemption: Evidence from Default on Islamic Loan
Table 3.4 reports detailed summary statistics for both conventional and Islamic loans.
Crucial for our analysis is the definition of default. We define default to occur if 90
days after the maturity date or the date of an interest payment and/or installment, the
debt balance remains unpaid. This definition for default is standard and identical for
conventional and Islamic loans. In both cases default is not only self-reported by the
banks upon prescription of the supervisor, but also carefully checked by the supervisor
(every year around 80 percent of loans are randomly checked by supervisors, also for
telltale signs of evergreening which if discovered carries penalties for the bank). Later
on, we confirm the robustness of our findings if we define default to occur if loans
payments are overdue for 180 days rather than 90 days.
We observe a substantially lower monthly default rate for Islamic compared to
conventional loans. This difference (0.9 percent versus 0.5 percent) is not only
statistically significant but also economically important. The difference in monthly
default rate on Islamic loans granted by an Islamic branch or subsidiary of a
conventional bank or by an Islamic bank (0.7 percent versus 0.2 percent) is not
statistically significant. For completeness the table also reports the right-censored loan
duration, i.e., the time to repayment, default or end of the sample period.
Loans observed each month Granted by banks that offer loans that are
only
conventional
conventional
and Islamiconly Islamic Totals
only conventional 172,120 331,675 - 503,795
Obtained by borrowers
with loans that are
conventional and
Islamic37,755 44,946 8,307 91,008
only Islamic - 2,028 6,846 8,874
Totals 209,875 378,649 15,153 603,677
The table reports the number of loan - months for the samples of borrowers and banks by loan type.Table 3.3: Samples for borrowers and banks by loan types

Essays on Financial Intermediation and Markets 49
We measure the size of the borrower as the natural log of the sum of all credit facilities
(loan limits) that are granted to a borrower by all banks. Borrowers with Islamic loans
are larger and are located more often in big cities than other borrowers.
Conventional and Islamic loans statistically differ in all contract characteristics at the
one percent level, though the differences are often economically small. According to
the means conventional loans have a shorter maturity (15 versus 18 months), are less
likely to be collateralized (93 versus 99 percent) and to involve an immediate cash
disbursal (74 versus 82 percent) or a durable / fixed asset (14 versus 27 percent), are
more likely to be for export or agricultural purposes (11 versus 4 percent and 4 versus 0
percent), and are smaller (PKR 23 versus 35 million) than Islamic loans. Interest rates,
which we observe for 239,943 loan-months (i.e., 40 percent of our sample), are on
average 2 percentage points lower for conventional than for Islamic loans. The medians
point in a similar direction. Both conventional and Islamic loans can have a fixed or a
variable “interest rate” (called “mark-up rate” in case of Islamic loans).
Conventional loans are proportionally more often granted by government, specialized,
domestic or large banks than Islamic loans. In absolute terms most conventional and
Islamic loans are granted by privately (often internationally) owned and domestically
incorporated banks, such as Meezan, Standard Chartered, RBS, Dubai Islamic,
Emirates Global for example.
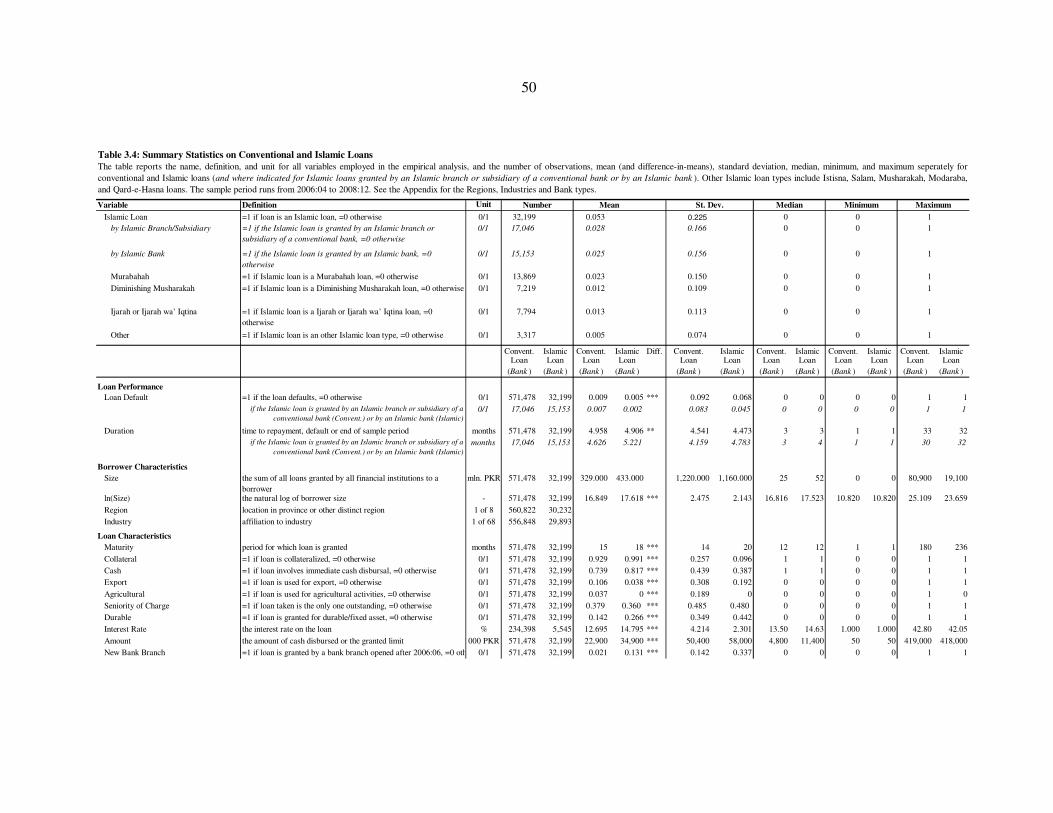
50
Variable Definition Unit
Islamic Loan =1 if loan is an Islamic loan, =0 otherwise 0/1 32,199 0.053 0.225 0 0 1
by Islamic Branch/Subsidiary =1 if the Islamic loan is granted by an Islamic branch or
subsidiary of a conventional bank, =0 otherwise
0/1 17,046 0.028 0.166 0 0 1
by Islamic Bank =1 if the Islamic loan is granted by an Islamic bank, =0
otherwise
0/1 15,153 0.025 0.156 0 0 1
Murabahah =1 if Islamic loan is a Murabahah loan, =0 otherwise 0/1 13,869 0.023 0.150 0 0 1
Diminishing Musharakah =1 if Islamic loan is a Diminishing Musharakah loan, =0 otherwise 0/1 7,219 0.012 0.109 0 0 1
Ijarah or Ijarah wa’ Iqtina =1 if Islamic loan is a Ijarah or Ijarah wa’ Iqtina loan, =0
otherwise
0/1 7,794 0.013 0.113 0 0 1
Other =1 if Islamic loan is an other Islamic loan type, =0 otherwise 0/1 3,317 0.005 0.074 0 0 1
Convent. Islamic Convent. Islamic Convent. Islamic Convent. Islamic Convent. Islamic Convent. IslamicLoan Loan Loan Loan Loan Loan Loan Loan Loan Loan Loan Loan
(Bank ) (Bank ) (Bank ) (Bank ) (Bank ) (Bank ) (Bank ) (Bank ) (Bank ) (Bank ) (Bank ) (Bank )
Loan Performance
Loan Default =1 if the loan defaults, =0 otherwise 0/1 571,478 32,199 0.009 0.005 *** 0.092 0.068 0 0 0 0 1 1
if the Islamic loan is granted by an Islamic branch or subsidiary of a
conventional bank (Convent.) or by an Islamic bank (Islamic)
0/1 17,046 15,153 0.007 0.002 0.083 0.045 0 0 0 0 1 1
Duration time to repayment, default or end of sample period months 571,478 32,199 4.958 4.906 ** 4.541 4.473 3 3 1 1 33 32
if the Islamic loan is granted by an Islamic branch or subsidiary of a
conventional bank (Convent.) or by an Islamic bank (Islamic)
months 17,046 15,153 4.626 5.221 4.159 4.783 3 4 1 1 30 32
Borrower Characteristics
Size the sum of all loans granted by all financial institutions to a
borrower
mln. PKR 571,478 32,199 329.000 433.000 1,220.000 1,160.000 25 52 0 0 80,900 19,100
ln(Size) the natural log of borrower size - 571,478 32,199 16.849 17.618 *** 2.475 2.143 16.816 17.523 10.820 10.820 25.109 23.659
Region location in province or other distinct region 1 of 8 560,822 30,232 1.969 1.972 2 2
Industry affiliation to industry 1 of 68 556,848 29,893 31.446 31.814 36 34
Loan Characteristics
Maturity period for which loan is granted months 571,478 32,199 15 18 *** 14 20 12 12 1 1 180 236
Collateral =1 if loan is collateralized, =0 otherwise 0/1 571,478 32,199 0.929 0.991 *** 0.257 0.096 1 1 0 0 1 1
Cash =1 if loan involves immediate cash disbursal, =0 otherwise 0/1 571,478 32,199 0.739 0.817 *** 0.439 0.387 1 1 0 0 1 1
Export =1 if loan is used for export, =0 otherwise 0/1 571,478 32,199 0.106 0.038 *** 0.308 0.192 0 0 0 0 1 1
Agricultural =1 if loan is used for agricultural activities, =0 otherwise 0/1 571,478 32,199 0.037 0 *** 0.189 0 0 0 0 0 1 0
Seniority of Charge =1 if loan taken is the only one outstanding, =0 otherwise 0/1 571,478 32,199 0.379 0.360 *** 0.485 0.480 0 0 0 0 1 1
Durable =1 if loan is granted for durable/fixed asset, =0 otherwise 0/1 571,478 32,199 0.142 0.266 *** 0.349 0.442 0 0 0 0 1 1
Interest Rate the interest rate on the loan % 234,398 5,545 12.695 14.795 *** 4.214 2.301 13.50 14.63 1.000 1.000 42.80 42.05
Amount the amount of cash disbursed or the granted limit 000 PKR 571,478 32,199 22,900 34,900 *** 50,400 58,000 4,800 11,400 50 50 419,000 418,000
New Bank Branch =1 if loan is granted by a bank branch opened after 2006:06, =0 otherwise0/1 571,478 32,199 0.021 0.131 *** 0.142 0.337 0 0 0 0 1 1
Diff.
Table 3.4: Summary Statistics on Conventional and Islamic Loans
The table reports the name, definition, and unit for all variables employed in the empirical analysis, and the number of observations, mean (and difference-in-means), standard deviation, median, minimum, and maximum seperately for
conventional and Islamic loans (and where indicated for Islamic loans granted by an Islamic branch or subsidiary of a conventional bank or by an Islamic bank ). Other Islamic loan types include Istisna, Salam, Musharakah, Modaraba,
and Qard-e-Hasna loans. The sample period runs from 2006:04 to 2008:12. See the Appendix for the Regions, Industries and Bank types.
Number Mean St. Dev. Median Minimum Maximum
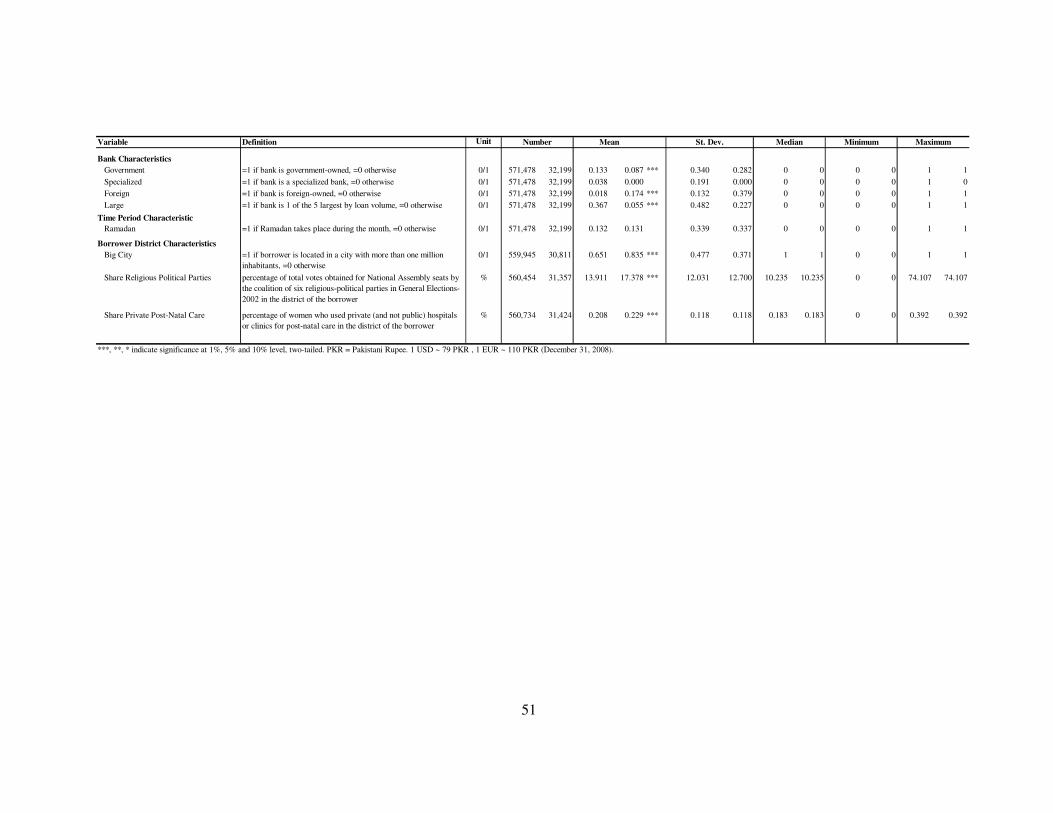
51
Variable Definition Unit
Bank Characteristics
Government =1 if bank is government-owned, =0 otherwise 0/1 571,478 32,199 0.133 0.087 *** 0.340 0.282 0 0 0 0 1 1
Specialized =1 if bank is a specialized bank, =0 otherwise 0/1 571,478 32,199 0.038 0.000 0.191 0.000 0 0 0 0 1 0
Foreign =1 if bank is foreign-owned, =0 otherwise 0/1 571,478 32,199 0.018 0.174 *** 0.132 0.379 0 0 0 0 1 1
Large =1 if bank is 1 of the 5 largest by loan volume, =0 otherwise 0/1 571,478 32,199 0.367 0.055 *** 0.482 0.227 0 0 0 0 1 1
Time Period Characteristic
Ramadan =1 if Ramadan takes place during the month, =0 otherwise 0/1 571,478 32,199 0.132 0.131 0.339 0.337 0 0 0 0 1 1
Borrower District Characteristics
Big City =1 if borrower is located in a city with more than one million
inhabitants, =0 otherwise
0/1 559,945 30,811 0.651 0.835 *** 0.477 0.371 1 1 0 0 1 1
Share Religious Political Parties percentage of total votes obtained for National Assembly seats by
the coalition of six religious-political parties in General Elections-
2002 in the district of the borrower
% 560,454 31,357 13.911 17.378 *** 12.031 12.700 10.235 10.235 0 0 74.107 74.107
Share Private Post-Natal Care percentage of women who used private (and not public) hospitals
or clinics for post-natal care in the district of the borrower
% 560,734 31,424 0.208 0.229 *** 0.118 0.118 0.183 0.183 0 0 0.392 0.392
***, **, * indicate significance at 1%, 5% and 10% level, two-tailed. PKR = Pakistani Rupee. 1 USD ~ 79 PKR , 1 EUR ~ 110 PKR (December 31, 2008).
Number Mean St. Dev. Median Minimum Maximum

52 Of Religion and Redemption: Evidence from Default on Islamic Loan
3.3.2 Duration Model
3.3.2.1 Intuition
This section develops the econometric methodology employed in analyzing the time
until repayment or default of the individual bank loans, or “loan spells”.23 The hazard
function in duration analysis provides us with a suitable method for summarizing the
relationship between the time to default and the likelihood of default. The hazard rate
effectively has an intuitive interpretation as the per-period probability of loan default
provided the loan “survives” up to that period.
Repayment of a loan or the sample period’s end may prevent us from ever observing a
default on this loan. Such a loan spell can be considered right censored. Not knowing
when the default would occur, means we are unable to observe the “true” time to
default for these loan spells. With no adjustment to account for censoring, maximum
likelihood estimation of the proportional hazard models produces biased and
inconsistent estimates of model parameters. Accounting for right-censored observations
will be accomplished in duration analysis by expressing the log-likelihood function as a
weighted average of the sample density of completed loan spells and the survivor
function of uncompleted spells. As the sample period runs from 2006:04 to 2008:12,
but the median loan maturity is only twelve months, about 5% of all loans are right-
23 As in McDonald and Van de Gucht (1999). Loans to small firms typically carry a relatively short maturity, often without early repayment possibilities; hence, we choose to ignore early repayment behavior captured in their competing risk model. Heckman and Singer (1984), Kiefer (1988) and Kalbfleisch and Prentice (2002) provide comprehensive treatments of duration analysis. Shumway (2001) and Duffie, Saita et al. (2007) discuss and employ empirical bankruptcy models. See also the application to the duration of bank-firm relationships in Ongena and Smith (2001) and Degryse, Kim et al. (2009), on which we base our discussion.

Essays on Financial Intermediation and Markets 53
censored because of the sample period’s end. As our sample consists out of only new
loans granted from 2006:04 onwards, there is no left censoring problem.
3.3.2.2 Terminology
We begin by introducing terminology common to duration analysis and then describe
the hazard function estimators. Let T represent the duration of time that passes before
the occurrence of a certain random event. In the econometrics literature, the passage of
time is often referred to as a “spell,” while the event itself is called a “switch”, which in
this case will be the switch to the default state. A simple way to describe the behavior
of a spell is through its survivor function:
)()( tTPtS ≥= ,
which yields the probability that the spell T lasts at least to time t. The survivor
function equals one minus the cumulative distribution function of T.
The behavior of a spell can also be described through the use of the hazard function.
The hazard function determines the probability that a switch will occur, conditional on
the spell surviving through time t, and is defined by:
)(
)()(log)(lim)(
0 tS
tf
dt
tSd
t
tTttTtPt
t=
−=
∆
≥∆+<≤=
→∆λ ,
where )(tf is the density function associated with the distribution of spells. Neither
the survivor function nor the hazard function provides additional information that could
not be derived directly from )(tf . Instead, these functions present economically
interesting ways of examining the distribution of spells.
The hazard function does provide a suitable method for summarizing the relationship
between spell length and the likelihood of switching. When )(tλ is increasing in t, the
hazard function is said to exhibit positive duration dependence, because the probability

54 Of Religion and Redemption: Evidence from Default on Islamic Loan
of ending the spell increases as the spell lengthens. Similarly, negative duration
dependence occurs when )(tλ is decreasing in t, and constant duration dependence
indicates the lack of a relation between )(tλ and t.
3.3.2.3 Estimators
When estimating hazard functions, it is econometrically convenient to assume a
proportional hazard specification, such that:
)exp()()),(,(
lim)),(,( 00
tt
Xtt
tXtTttTtPtXt βλ
ββλ ′=
∆
≥∆+<≤=
→∆
where tX is a set of observable, possibly time-varying explanatory variables, β is a
vector of unknown parameters associated with the explanatory variables, )(0 tλ is the
baseline hazard function, and )exp( tXβ ′ is chosen because it is nonnegative and yields
an appealing interpretation for the coefficients, β. The logarithm of )),(,( βλ tXt is
linear in tX . Therefore, β reflects the partial impact of each variable in X on the log of
the estimated hazard rate.
The baseline hazard )(0 tλ determines the shape of the hazard function with respect to
time. The previous equation can be estimated without specifying a functional form for
the baseline hazard. The Cox (1972) partial likelihood model bases estimation of β on
the ordering of the duration spells. Because it specifies no shape for )(0 tλ , we refer to
the Cox (1972) partial likelihood model as “semiparametric.”
Two commonly used parametric specifications for the baseline hazard are the Weibull
and the exponential distributions. The Weibull specification assumes:
1
0 )( −= αλαλ tt ,
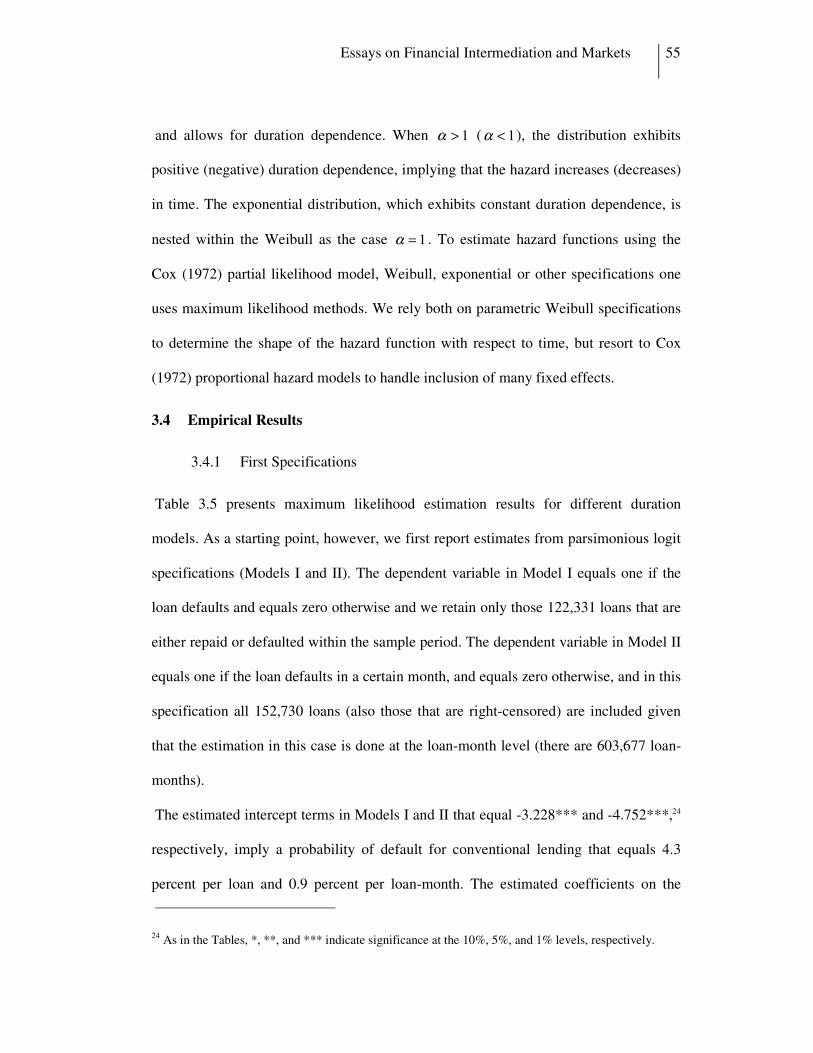
Essays on Financial Intermediation and Markets 55
and allows for duration dependence. When 1>α ( 1<α ), the distribution exhibits
positive (negative) duration dependence, implying that the hazard increases (decreases)
in time. The exponential distribution, which exhibits constant duration dependence, is
nested within the Weibull as the case 1=α . To estimate hazard functions using the
Cox (1972) partial likelihood model, Weibull, exponential or other specifications one
uses maximum likelihood methods. We rely both on parametric Weibull specifications
to determine the shape of the hazard function with respect to time, but resort to Cox
(1972) proportional hazard models to handle inclusion of many fixed effects.
3.4 Empirical Results
3.4.1 First Specifications
Table 3.5 presents maximum likelihood estimation results for different duration
models. As a starting point, however, we first report estimates from parsimonious logit
specifications (Models I and II). The dependent variable in Model I equals one if the
loan defaults and equals zero otherwise and we retain only those 122,331 loans that are
either repaid or defaulted within the sample period. The dependent variable in Model II
equals one if the loan defaults in a certain month, and equals zero otherwise, and in this
specification all 152,730 loans (also those that are right-censored) are included given
that the estimation in this case is done at the loan-month level (there are 603,677 loan-
months).
The estimated intercept terms in Models I and II that equal -3.228*** and -4.752***,24
respectively, imply a probability of default for conventional lending that equals 4.3
percent per loan and 0.9 percent per loan-month. The estimated coefficients on the
24 As in the Tables, *, **, and *** indicate significance at the 10%, 5%, and 1% levels, respectively.

56 Of Religion and Redemption: Evidence from Default on Islamic Loan
Islamic Loan dummy that equal -0.500*** and -0.612***, respectively, suggest that the
odds ratio almost halves when a loan is Islamic (results are unaffected when we add
borrower, loan, and/or bank characteristics to the logit specifications).
Because we want to account for duration dependence, our main empirical results are
established using duration models. Columns III to VI report results from a duration
model that uses the Weibull distribution as a baseline hazard function.25 In all
parametric models errors are clustered at the borrower level. Model III features only the
Islamic loan dummy (and an intercept) and in Model IV we add borrower size as well
as 7 borrower region and 67 borrower industry dummies (all regions and industries are
listed in Appendix 3-C) and loan characteristics. In Model V, we additionally control
for bank type and time (i.e., year*month) fixed effects. In Model VI, we distinguish
between Islamic loans that are granted by Islamic branches/subsidiaries of conventional
banks and Islamic loans that are granted by Islamic banks.
The coefficient for the Islamic Loan dummy is negative and highly statistically
significant in all specifications. This is the first main result: The hazard rate is
substantially lower for an Islamic than for a conventional loan. This effect is robust (we
will show) to many additional controls, including borrower, bank, and borrower*bank
fixed effects and is economically large. Though we return later to
25 In the next step we employ Cox proportional hazard models where the baseline hazard is left un-parameterized (we also estimate accelerated failure time models with a log-logistic distribution; results are similar and not further reported).
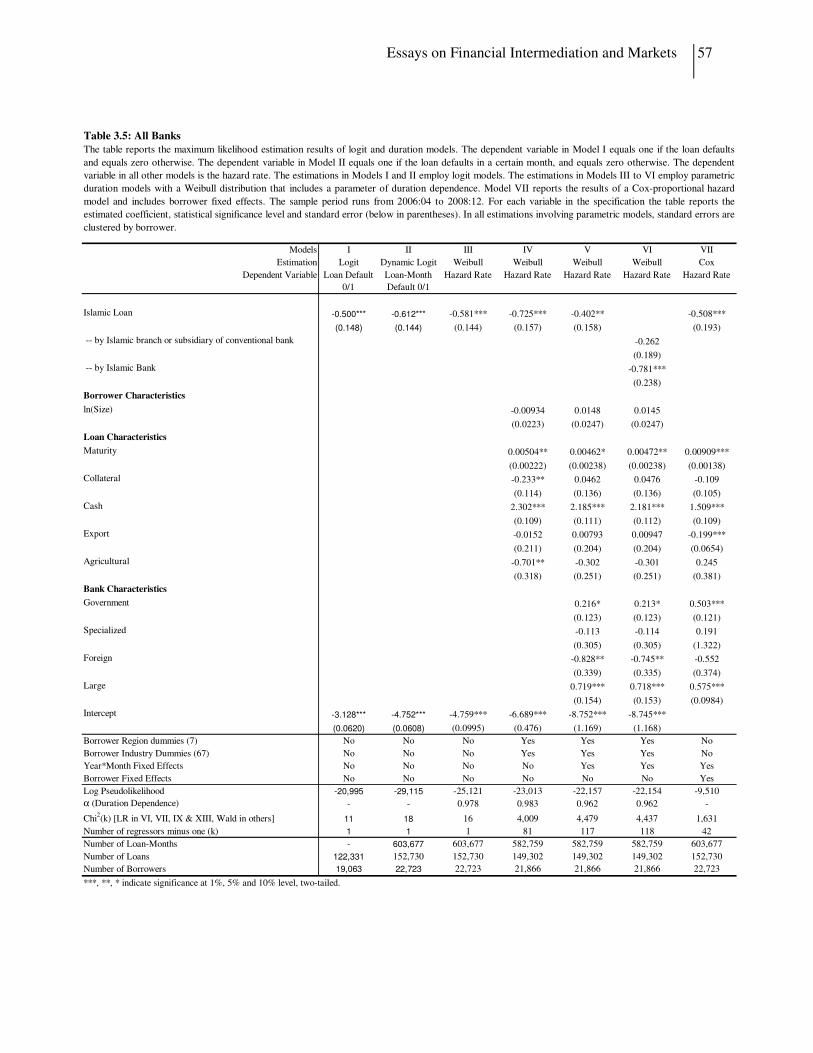
Essays on Financial Intermediation and Markets 57
Models I II III IV V VI VII
Estimation Logit Dynamic Logit Weibull Weibull Weibull Weibull Cox
Dependent Variable Loan Default
0/1
Loan-Month
Default 0/1
Hazard Rate Hazard Rate Hazard Rate Hazard Rate Hazard Rate
Islamic Loan -0.500*** -0.612*** -0.581*** -0.725*** -0.402** -0.508***
(0.148) (0.144) (0.144) (0.157) (0.158) (0.193)
-- by Islamic branch or subsidiary of conventional bank -0.262
(0.189)
-- by Islamic Bank -0.781***
(0.238)
Borrower Characteristics
ln(Size) -0.00934 0.0148 0.0145
(0.0223) (0.0247) (0.0247)
Loan Characteristics
Maturity 0.00504** 0.00462* 0.00472** 0.00909***
(0.00222) (0.00238) (0.00238) (0.00138)
Collateral -0.233** 0.0462 0.0476 -0.109
(0.114) (0.136) (0.136) (0.105)
Cash 2.302*** 2.185*** 2.181*** 1.509***
(0.109) (0.111) (0.112) (0.109)
Export -0.0152 0.00793 0.00947 -0.199***
(0.211) (0.204) (0.204) (0.0654)
Agricultural -0.701** -0.302 -0.301 0.245
(0.318) (0.251) (0.251) (0.381)
Bank Characteristics
Government 0.216* 0.213* 0.503***
(0.123) (0.123) (0.121)
Specialized -0.113 -0.114 0.191
(0.305) (0.305) (1.322)
Foreign -0.828** -0.745** -0.552
(0.339) (0.335) (0.374)
Large 0.719*** 0.718*** 0.575***
(0.154) (0.153) (0.0984)
Intercept -3.128*** -4.752*** -4.759*** -6.689*** -8.752*** -8.745***
(0.0620) (0.0608) (0.0995) (0.476) (1.169) (1.168)
Borrower Region dummies (7) No No No Yes Yes Yes No
Borrower Industry Dummies (67) No No No Yes Yes Yes No
Year*Month Fixed Effects No No No No Yes Yes Yes
Borrower Fixed Effects No No No No No No Yes
Log Pseudolikelihood -20,995 -29,115 -25,121 -23,013 -22,157 -22,154 -9,510
α (Duration Dependence) - - 0.978 0.983 0.962 0.962 -
Chi2(k) [LR in VI, VII, IX & XIII, Wald in others] 11 18 16 4,009 4,479 4,437 1,631
Number of regressors minus one (k) 1 1 1 81 117 118 42
Number of Loan-Months - 603,677 603,677 582,759 582,759 582,759 603,677
Number of Loans 122,331 152,730 152,730 149,302 149,302 149,302 152,730
Number of Borrowers 19,063 22,723 22,723 21,866 21,866 21,866 22,723
***, **, * indicate significance at 1%, 5% and 10% level, two-tailed.
The table reports the maximum likelihood estimation results of logit and duration models. The dependent variable in Model I equals one if the loan defaults
and equals zero otherwise. The dependent variable in Model II equals one if the loan defaults in a certain month, and equals zero otherwise. The dependent
variable in all other models is the hazard rate. The estimations in Models I and II employ logit models. The estimations in Models III to VI employ parametric
duration models with a Weibull distribution that includes a parameter of duration dependence. Model VII reports the results of a Cox-proportional hazard
model and includes borrower fixed effects. The sample period runs from 2006:04 to 2008:12. For each variable in the specification the table reports the
estimated coefficient, statistical significance level and standard error (below in parentheses). In all estimations involving parametric models, standard errors are
clustered by borrower.
Table 3.5: All Banks

58 Of Religion and Redemption: Evidence from Default on Islamic Loan
economic relevancy in more detail, by way of preview: The coefficient in Model V for
example implies that the hazard rate of an Islamic loan is only 2/3rd (= e-0.402) of the
hazard rate on a conventional loan.
Model VI further shows that especially Islamic loans granted by Islamic banks have a
lower hazard rate. The hazard rate of Islamic loans issued by Islamic branches or
subsidiaries of conventional banks, though lower, is not statistically different from that
of all conventional loans. However, our analysis in Table 3.7 will show that the hazard
rate of Islamic loans issued by Islamic branches or subsidiaries of these mixed banks is
statistically lower than the hazard rate of the conventional loans issued by these mixed
banks. Hence the picture that arises is that Islamic loans issued by Islamic banks have
the lowest hazard rate and that conventional loans issued by purely conventional banks
have a lower hazard rate than those issued by mixed banks.
Before further model developments, however, we briefly review the estimated
coefficients on the control variables. In our sample, we do not find a robust relationship
between borrower size and hazard rates. With respect to loan characteristics, we find
the hazard rate to be higher for loans with a longer maturity and those involving an
immediate cash disbursal (in which case borrowers likely have to start paying back
sooner), but lower for collateralized and agricultural loans (though the statistical
significance of these findings later disappears somewhat).
Hazard rates are significantly higher for loans issued by government banks and by
those belonging to the largest five banks by loan volume, but lower for loans issued by
foreign banks. Our finding of higher hazard rates for loans issued by government banks
is consistent with results in Khwaja and Mian (2005), who find that loans given to
politically connected firms by government banks in particular tend to have to up to 50

Essays on Financial Intermediation and Markets 59
percent higher default rates. Finally, we note that the parameter α is measuring the
duration dependence in the baseline hazard specification and that this estimated
parameter is not significantly different from one, indicating that there is neither positive
nor negative duration dependence.
Borrower, loan and/or bank characteristics that differ between conventional and
Islamic loans may be responsible for the estimated difference in the hazard rates. We
now systematically investigate each of these possible sources of variation.
3.4.2 Differences between Borrowers that Obtain Conventional and Islamic
Loans?
Models IV and V in Table 3.5 control for borrower size, region, and industry, for
example, yet these controls may not capture all borrower heterogeneity. In Model VII
we therefore include borrower fixed effects to capture all time-invariant unobservable
and observable borrower heterogeneity in a Cox proportional hazard model that leaves
the baseline hazard un-parameterized (including this many fixed effects in a Weibull
specification is technically impossible in our setting). We designate this specification as
our benchmark. Notice that we are able to control for borrower fixed effects because
our dataset includes borrowers that have both conventional and Islamic loans (we label
such borrowers as “mixed borrowers”), some of which default on one or more loans but
not on others (this is possible given our 90 days loan-specific definition of non-
performance).
We find that the parameter estimate for the Islamic loan dummy remains negative and
statistically significant. Moreover, its magnitude is comparable to the other
specifications, and even slightly more negative than in the previous most complete
specification without borrower fixed effects (in Model V). Hence these estimates

60 Of Religion and Redemption: Evidence from Default on Islamic Loan
indicate that within the 32-month sample period (but controlling for year*month fixed
effects) the same borrower is more likely to default on a conventional loan than on an
Islamic loan. We revisit this finding, and especially its potential relationship with
religion, in Section III.E.
For our benchmark Model VII we more closely assess the economic relevancy of our
findings for a one-year (median), collateralized, cash loan that is not for export or
agricultural purposes, or granted by a government, specialized, foreign or large bank.
Figure 3.1 displays the resulting schedule of the cumulative hazard of conventional and
Islamic loans respectively. After one year (the median loan duration), the difference in
the cumulative hazard is already more than 2 percent. This first-year cumulative hazard
rate on conventional loans equals 5.2 percent, not uncommon for loans in a developing
economy, while the first-year cumulative hazard rate for Islamic loans equals 3.1
percent, more equal to the default rates on loans commonly observed in developed
economies.
Figure 3.1
The figure displays the cumulative hazard based on the estimated coefficients of Model VII in
Table 5 for a one-year (median) conventional or Islamic loan with all other covariates set at
their mean. The cumulative hazard after 12 months for a conventional loan equals 5.2%, for
an Islamic loan it equals 3.1%.
Essays on Financial Intermediation and Markets 61
3.4.3 Differences in the Loan Contracts?
Despite the controls for the loan maturity, collateralization, cash disbursal, and the
export or agricultural purpose of the loan, it is still possible that differences in loan
contract characteristics between conventional and Islamic loans would explain the
difference in hazard rates. In Table 3.6 we report a set of specifications that addresses
this possibility.
We start by excluding the 45,254 non-cash facilities that may differ more between
conventional and Islamic loans in other loan characteristics. We are left with 107,476
loans and re-estimate all duration models in Table 3.5. Model I in Table 3.6 reports the
estimates for the representative benchmark specification. Results are almost unaffected.
Our data set does not include loan seniority, possibly because seniority of small
business loans is often by default based on their precedence in time. In Model II we
therefore include a variable Seniority of Charge that equals one if the loan is the only
one outstanding, and equals zero otherwise. The coefficient on this new variable is
insignificant, while the coefficient on Islamic Loan is unaffected.
One variable we have not included yet in the specifications, as we know it is rather
coarsely measured, is the durability or fixity of the asset that is financed with the loan.
The bank’s ownership claim in a Murabahah contract will be quite limited (in time) if
the financed asset is for example an inventory of raw materials that is being used in the
production process (recall that almost all Islamic loans are in addition also
collateralized). Model III in Table 3.6 includes the variable Durable that equals one if
the loan is granted for a durable or fixed asset, like a plant, machinery, real estate or
automobile for example, and equals zero otherwise, in the representative benchmark

62
Models I II III IV V VI VII VIII IX
Alteration Only Cash Loans Seniority Added Durable Added Interest Rate Added Loan Amount Added
By Islamic Loan
Type
Murabahah and
Similar Conv. 180-Days Default New Bank Branch
Islamic Loan -0.535*** -0.509*** -0.498*** -0.406** -0.506*** -0.554* -0.740** -0.259*
(0.203) (0.193) (0.193) (0.192) (0.193) (0.298) (0.308) (0.158)
-- Murabaha -0.445*
(0.240)
-- Diminishing Musharakah -0.886*
(0.469)
-- Ijarah -0.558*
(0.310)
-- Other -0.263
(0.456)
Islamic Loan * New Bank Branch -2.384**
(1.058)
Borrower Characteristics
ln(Size) 0.0181
(0.0247)
Loan Characteristics
Maturity 0.00653*** 0.00907*** 0.00950*** 0.00510* 0.00872*** 0.00924*** 0.00966*** 0.0111*** 0.00485**
(0.00150) (0.00138) (0.00142) (0.00305) (0.00138) (0.00140) (0.00208) (0.00190) (0.00233)
Collateral -0.0968 -0.110 -0.110 -0.244 -0.105 -0.111 -0.323** -0.167 -0.0429
(0.115) (0.105) (0.105) (0.157) (0.105) (0.105) (0.158) (0.139) (0.135)
Cash 1.509*** 1.518*** 1.161*** 1.500*** 1.505*** 1.543*** -2.203***
(0.109) (0.109) (0.338) (0.109) (0.109) (0.151) (0.112)
Export -0.207*** -0.199*** -0.204*** 0.156 -0.192*** -0.200*** -0.214*** 0.00234
(0.0662) (0.0654) (0.0654) (0.128) (0.0650) (0.0654) (0.0793) (0.203)
Agricultural 0.267 0.246 0.215 0.385 0.247 0.243 -0.631 -0.300
(0.386) (0.381) (0.382) (0.581) (0.380) (0.381) (0.671) (0.251)
Table 3.6: All Banks: Robustness
The table reports the maximum likelihood estimation results of duration models. Models I to VIII report the results of a Cox-proportional hazard model and include borrower fixed effects. The estimation in Model IX employs a
parametric duration model with a Weibull distribution that includes a parameter of duration dependence. The sample used in Model I contains only cash loans. The sample used in Model VII contains Murabaha and conventional
loans given as working capital and term finance (excluding all other credit facilities, i.e., mortgage finance, leases, export finance, agricultural finance and off-balance financing). The sample period used in Model IX starts in
2006:07. Otherwise the sample period runs from 2006:04 to 2008:12. The dependent variable is the hazard rate. For each variable in the specification the table reports the estimated coefficient, statistical significance level and
standard error (below in parentheses). In all estimations involving parametric models, standard errors are clustered by borrower.

63
Models I II III IV V VI VII VIII IX
Alteration Only Cash Loans Seniority Added Durable Added Interest Rate Added Loan Amount Added Type Similar Conv. 180-Days Default New Bank Branch
Seniority of Charge 0.0204
(0.0916)
Durable -0.112
(0.0878)
Interest Rate 0.0277**
(0.0116)
Amount 0.001***
(0.0005)
New Bank Branch -1.199***
(0.293)
Bank Characteristics
Government 0.533*** 0.503*** 0.498*** 0.383 0.442*** 0.504*** 0.561*** 0.202 0.199
(0.125) (0.121) (0.121) (0.279) (0.123) (0.121) (0.186) (0.162) (0.123)
Specialized 0.0772 0.187 0.239 0.145 0.191 -0.419 -36.03 -0.138
(1.440) (1.321) (1.343) (1.315) (1.322) (0.443) (38.000) (0.305)
Foreign -0.529 -0.551 -0.558 -0.201 -0.554 -0.507 -0.596 0.189 -0.908***
(0.401) (0.374) (0.374) (0.553) (0.372) (0.379) (0.674) (0.481) (0.339)
Large 0.570*** 0.574*** 0.568*** 0.984*** 0.566*** 0.578*** 0.528*** 0.774*** 0.694***
(0.102) (0.0983) (0.0984) (0.195) (0.0984) (0.0985) (0.138) (0.130) (0.150)
Intercept -8.206***
(1.153)
Borrower Region dummies (7) No No No No No No No No Yes
Borrower Industry Dummies (67) No No No No No No No No Yes
Year*Month Fixed Effects Yes Yes Yes Yes Yes Yes Yes Yes Yes
Borrower Fixed Effects Yes Yes Yes Yes Yes Yes Yes Yes No
Log Pseudolikelihood -9,018 -9,510 -9,510 -2,922 -9,506 -9,510 -4,302 -5,771 -22,062
α (Duration Dependence) - - - - - - - - 0.961
Chi2(k) [LR in VI, VII, IX & XIII, Wald in others] 1,215 1,631 1,632 545 1,639 1,632 814 1,238 7,419
Number of regressors minus one (k) 41 43 43 41 43 45 38 42 119
Number of Loan-Months 448,333 603,677 603,677 239,946 603,677 603,677 257,979 613,218 580,810
Number of Loans 107,476 152,730 152,730 54,952 152,730 152,730 61,184 152,730 148,669
Number of Borrowers 19,084 22,723 22,723 13,628 21,574 21,574 14,652 22,041 21,837
***, **, * indicate significance at 1%, 5% and 10% level, two-tailed.

64 Of Religion and Redemption: Evidence from Default on Islamic Loan
model. The coefficient on this new variable is also insignificant, while the coefficient
on Islamic Loan is again unaffected.
Next, and to account at once for other loan characteristics that are not recorded and for
time-varying borrower heterogeneity that is also unobservable to us but that may be
observable to the bank, we add the loan rate (Interest Rate) in Model IV or the
individual loan amount (Amount) in Model V. As described in the data section, we have
the interest rate for only 40 percent of our sample observations. As expected, we find a
positive relation between the loan rate or size, and the probability of default. However,
the estimate for the Islamic loan dummy remains almost unaltered, i.e., -0.406** and -
0.506***, respectively.
Next, we perform additional robustness checks with respect to collateralization and
Islamic loan type (to conserve space we chose not to tabulate the estimated
coefficients). Banks possibly adjust collateralization depending on borrower condition
or additional financing, and may do so differently ─ if not in principle, then in practice
─ for the two types of loans. To account for this possibility we simply remove
collateral from the base specification. The coefficient on the Islamic loan dummy
remains virtually unaffected. To account for the potentially differential nature of
collateral in conventional and Islamic lending we add an interaction between the
Collateral and Islamic Loan dummies to our benchmark specification. The interaction
effect is, however, not statistically significant, and the coefficient on the Islamic Loan
dummy remains again unaffected. Similarly we add interactions between all loan
contract characteristics and the Islamic loan dummy. With the exception of the negative
coefficient on the interaction with maturity, none of the estimated coefficients on the

Essays on Financial Intermediation and Markets 65
other interactions is statistically significant, and Islamic loans are still found to default
less likely than conventional loans.
To account for the different types of Islamic loan contracts, in Model VI we split the
Islamic Loan dummy into four loan type dummies, i.e., Murabahah, Diminishing
Musharakah, Ijarah or Ijarah wa’Iqtina, and Other Islamic loans. The estimated
coefficients on the four dummies equal -0.445*, -0.886*, -0.558*, and -0.263,
respectively, confirming our findings so far.
We further exclude Musharakah and Mudarabah contracts (both types are more
similar to equity financing than to conventional bank credit), or even more tightly in
Model VII restrict the sample to Murabahah loans and similar conventional loans, i.e.,
term finance and working capital (excluding all other credit facilities such as mortgage
finance, leases, export finance, agricultural finance and off-balance financing for
example). In both cases results are unaffected with estimated Islamic Loan coefficients
that equal -0.500** (untabulated) and -0.554* (Model VII), respectively.
In Model VIII in Table 3.6 we redefine default to occur only after 180-days. Shorter
duration or – when present – tighter covenants for example could result in earlier non-
performance. But results are again unaffected (note that though the number of loans
remains equal to 152,730, the number of loan-months increases to 613,218, because
non-performing loan spells are now right-censored 90 days later).
Finally, in Model IX we study the default on the new loans at bank branches that were
opened after 2006:06, i.e., the month with the first six-monthly listing of bank branches
within our sample period (4,061 new loans that were originated before this first listing
were removed). Loans at new branches may have different characteristics, but of course

66 Of Religion and Redemption: Evidence from Default on Islamic Loan
also the characteristics of the borrowers (and loan officers) there may differ.
Unfortunately because of multicollinearity we have to drop the borrower fixed effects.26
At new bank branches the hazard of conventional loans is one third and the hazard of
Islamic loans one tenth of the hazard of conventional loans at existing branches. Yet, at
existing branches the hazard of Islamic loans is now three-quarters of the hazard of
conventional loans at existing branches. So it seems that especially new Islamic
branches attract re-paying borrowers. Alternatively, if the new branches would attract
worse customers, the loan officers there are aware of the externality of the other banks’
screening (Broecker (1990)) and screen themselves more strictly, but then especially so
when the branch is Islamic and grants Islamic loans.
In sum, it does not seem to be the case that only differences in loan contract
characteristics between conventional and Islamic loans can explain their difference in
hazard rates.
3.4.4 Differences in the Banks that Grant the Conventional and Islamic
Loans?
While we do correct for bank type, our dataset does not include more detailed bank
characteristics, such as efficiency,27 capital ratios, overall riskiness of the loan portfolio,
and/or liability structure, for example. Controlling for (time-invariant) bank fixed
26 One additional caveat when interpreting the estimates is that the tighter right-censoring for loans granted at branches that open later during the sample period may bias the estimated hazard for new branches downward if duration dependence is convex.
27 Shahid, ur Rehman et al. (2010)find almost no differences in efficiency scores between five conventional and five Islamic banks in Pakistan during the period 2005 to 2009, except for the year 2008. For a similarly sized sample and the same time period in Pakistan, Jaffar and Manarvi (2011) find that the conventional banks had the same asset quality, a somewhat lower capital and liquidity position, but higher management quality and earning ability than the Islamic banks.

Essays on Financial Intermediation and Markets 67
effects may be important, as default rates may be due to bank-specific clientele effects,
risk-taking incentives, and/or screening and monitoring technology.
We therefore include bank fixed effects in a variety of models estimated on the set of
loans that are issued only by mixed banks that offer both conventional and Islamic
loans. This reduces our sample to 378,649 loan-month observations (15,653 borrowers
for a total of 109,157 loans). Estimation results are tabulated in Table 3.7 and the model
line-up is similar to Table 3.5.
Models I and II in Table 3.7 are comparable to Models III and IV in Table 3.5, except
that the estimation results are based on the reduced sample. While the parameter
estimates on the controls are mostly similar, we find a substantially stronger Islamic
loan effect in the reduced compared to the full sample. This strong effect remains when
we introduce first bank fixed effects (and a bank-specific parameter of duration
dependence) in Model III, then both borrower and bank fixed effects in Model IV, and
finally borrower*bank fixed effects in Model V. In the latter model the hazard rate on
Islamic loans is only one fifth of the hazard rate on conventional loans (=e-1.577). Hence
the same borrower obtaining conventional and Islamic loans from the same bank within
the sample period is five times more likely to default on the conventional loan(s) than
on the Islamic loan(s).
In Model VI we contrast these mixed borrowers with those having only conventional
loans from the mixed banks. The latter type of borrowers are three times more likely to
default on their conventional loans than the mixed type of borrowers on their loans
(=e1.184), while the mixed and Islamic-only borrowers do not differ on average.

68 Of Religion and Redemption: Evidence from Default on Islamic Loan
I II III IV V VI VII
Islamic Loan -1.601*** -1.869*** -1.654*** -2.015** -1.554* -1.374***
(0.358) (0.384) (0.381) (0.865) (0.928) (0.326)
-- Borrowers with conventional and Islamic loans 0.196
(0.580)
-- Borrowers with only conventional loans 1.184***
(0.426)
-- Borrowers that switch to Islamic loans (from conventional) -0.877*
(0.464)
-- Borrowers that switch to conventional loans (from Islamic) -0.350
(0.956)
Borrower Characteristics
ln(Size) 0.0147 0.0345 0.0431 0.0429
(0.0288) (0.0291) (0.0302) (0.0304)
Loan Characteristics
Maturity -0.00446 -0.00799* 0.00500* 0.0071*** -0.00807* -0.00804*
(0.00390) (0.00429) (0.00256) (0.00276) (0.00429) (0.00429)
Collateral -0.479*** -0.559*** -0.204* -0.238* -0.551*** -0.552***
(0.137) (0.136) (0.123) (0.127) (0.137) (0.137)
Cash 2.485*** 2.357*** 1.800*** 1.786*** 2.350*** 2.358***
(0.148) (0.160) (0.169) (0.178) (0.159) (0.159)
Export -0.0254 -0.0608 -0.239*** -0.173** -0.0558 -0.0611
(0.255) (0.238) (0.0757) (0.0790) (0.236) (0.237)
Agricultural 0.238 0.0639 0.700 0.523 0.0591 0.0642
(0.193) (0.199) (0.443) (0.444) (0.199) (0.199)
Intercept -4.734*** -6.657*** -6.907*** -8.162*** -7.004***
(0.130) (0.614) (1.224) (1.286) (1.232)
Borrower Region dummies (7) No Yes Yes No No Yes Yes
Borrower Industry Dummies (67) No Yes Yes No No Yes Yes
Year*Month Fixed Effects No No Yes Yes Yes Yes Yes
Borrower Fixed Effects No No No Yes No No No
Bank Fixed Effects No No Yes Yes No Yes Yes
Borrower*Bank Fixed Effects No No No No Yes No No
Log Pseudolikelihood -17,336 -15,824 -14,695 -6,863 -7031 -14,679 -14,674
α (Duration Dependence) 1.009 1.026 by bank - - by bank by bank
Chi2(k) [LR in VI-X, Wald in other] 20 6,334 7,390 1,280 1019 7,768 7,819
Number of regressors minus one (k) 1 81 123 46 36 124 125
Number of Loan-Months 378,649 372,415 372,415 378,649 378,649 372,415 372,415
Number of Loans 109,157 107,944 107,944 109,157 109,157 107,944 107,944
Number of Borrowers 15,653 15,355 15,355 15,653 15,653 15,355 15,355
***, **, * indicate significance at 1%, 5% and 10% level, two-tailed.
Table 3.7: Mixed Banks
The table reports the maximum likelihood estimation results of duration models. Models I to III and V to VII employ parametric duration
models with a Weibull distribution that includes a parameter of duration dependence. Model IV reports the results of a Cox-proportional
hazard model and includes borrower fixed effects. The sample includes only loans given by banks that grant both conventional and Islamic
loans and the sample period runs from 2006:04 to 2008:12. The dependent variable is the hazard rate. For each variable in the
specification the table reports the estimated coefficient, statistical significance level and standard error (below in parentheses). In Models I
to III and V to VII standard errors are clustered by borrower.

Essays on Financial Intermediation and Markets 69
In sum, these findings combined suggest that at mixed banks the hazard rates increase
as follows: (1) Islamic loans by mixed borrowers, (2) Islamic loans by Islamic-only
borrowers, (3) conventional loans by conventional-only borrowers, and (4)
conventional loans by mixed borrowers. Or put differently, at mixed banks the
difference in hazard rates between conventional and Islamic loans for mixed borrowers
is larger than the difference in hazard rates between conventional loans for
conventional-only borrowers and the Islamic loans for Islamic-only borrowers.
Why this wider difference in hazard rates? One possible explanation could reside in the
penalties banks charge in case of default.28 Recall that those penalties flow to the bank
in case of non-performance on a conventional loan and to a charity in case of an Islamic
loan. In case banks would set penalties optimally (but disregarding other loan terms)
they would set the penalties on conventional loans lower than on Islamic loans,
especially for borrowers that mix loan types and that are of an intermediate credit
quality.29
Yet, we do not think differential penalties are the explanation here. First, anecdotal
evidence from supervisors with ample field experience in Pakistan suggests that banks
may actually set the penalties on conventional and Islamic loans equal to each other. In
Appendix 3-D we report the penalties we gleaned from bank websites recently for
28 Borrowers may also maintain other conventional and Islamic bank products (deposits for example) that are priced jointly with the conventional and Islamic loans respectively by a separate conventional or Islamic bank desk. Any cross-subsidization across products taken by borrowers done at the bank level is absorbed by the borrower*bank fixed effects however.
29 In this way banks would entice non-performance on conventional loans and not only capture the penalties (when paid) on the non-performing conventional loan(s), but also assure continued payment of the higher loan rates on the Islamic loan(s). This penalties strategy may be optimal for borrowers of an intermediate quality, who with a probability between zero and one pay the penalties and repay both loans. For really bad or really good mixed borrowers differentiating penalties between conventional and Islamic loans may be marginally less important. Of course, ex ante banks likely set penalties jointly with the interest (mark-up) rate and other loan terms and/or could provide for example repayment boni.

70 Of Religion and Redemption: Evidence from Default on Islamic Loan
different household loan types; while not necessarily equal to those specified on the
business loans in our study, the penalties the banks list on their website suggest that the
penalties on Islamic loans may – if anything – even be lower than those on
conventional loans.
Second, when introducing in a variety of specifications the interactions of the Islamic
loan dummy with – as a proxy for borrower quality – the observed loan rate and the
rate squared, the estimated coefficients on the interaction terms are statistically
insignificant but are actually pointing in an opposite direction (i.e., for intermediate
loan rate borrowers the difference in the hazard rate between conventional and Islamic
loan is minimal not maximal as we would expect if penalties are set optimally).
3.4.5 Borrower, Bank or Loan Characteristics? Or Religion?
Until now, we have found consistent evidence that the same borrower is less likely to
default on Islamic than on conventional loans obtained from the same bank, and that
when borrowing from a mixed bank the difference in hazard rates between
conventional and Islamic loans for these mixed borrowers is larger than the difference
in hazard rates between conventional loans for conventional-only borrowers and the
Islamic loans for Islamic-only borrowers.
One possible explanation for these robust findings is that borrowers may choose not to
default on Islamic loans because of their individual religious beliefs. As argued before,
the motivation to take the Islamic loan may also discourage the borrower from
defaulting on it.
In Model VII in Table 3.7 two variables are introduced that capture whether borrowers
(that have both type of loans) during the sample period switch to Islamic or to
conventional borrowing, i.e., whether during the sample period conventional loans were
Essays on Financial Intermediation and Markets 71
obtained first or later than Islamic loans. Those borrowers that switch to Islamic
borrowing may be, given the recency of their decision, even more motivated not to
default on their Islamic loans.
For this exercise the start of the sample period presents a severe left-censoring
problem, i.e., we cannot observe those loans that are no longer outstanding. One
additional caveat when interpreting the estimates is that the tighter right-censoring for
loans that are recently granted may bias the estimated hazard for new loans downward
if duration dependence is convex. Hence one has to compare the difference between the
two switching coefficients. Though not statistically different, the estimates suggest that
individual motivation may play a role. Those borrowers that only recently turned to
Islamic loans are even less likely to default on their Islamic loans than those that
switched to conventional loans.
While the most fervent religious believers may prefer to obtain Islamic loans only,
intermediate fervency may result in mixed borrowing.30 Hit by a negative shock large
enough to overwhelm their religious resistance to loan default, Islamic-only borrowers
have no choice but to default on one of their Islamic loans. On the other hand mixed
borrowers do have a choice and despite their lower fervency may on the margin more
often decide not to default on their Islamic loans than on their conventional loans.31
30 We do not think that intermediate piousness and mixed borrowing per se negates religion as a possible determinant of lower Islamic loan default (“some people pray but do not fast”). Of course mixed borrowing may also arise from specific credit needs such as corporate credit cards, export finance supported by the SBP, specific discounting of bills, etc.. Many Islamic scholars would even argue that borrowing at some interest is allowed if the borrower is to meet un-avoidable necessities.
31 Appendix E further illustrates how the different degrees of individual religiosity of the borrowers may create the differentials in default probabilities we observe. If both the probability the borrowers take a conventional loan and the probability the borrowers default on a loan decrease in the degree of their religiosity, then Islamic loans are on average less likely to default than conventional loans. If a borrower takes two loans, intermediate religiosity is more likely to result in a conventional and Islamic loan being taken. If a secular borrower is indifferent between defaulting on the conventional or Islamic loan, and a

72 Of Religion and Redemption: Evidence from Default on Islamic Loan
To establish beyond any doubt that religious beliefs matter for loan default one would
need an objective measurement of religiosity for each individual borrower. As far as we
are aware no existing research has had access to such a measure,32 and neither do we. In
Table 3.8 we therefore introduce a number of specifications that are a first step in
identifying whether religion in this setting matters for loan default.
Model I in Table 3.8 introduces a variable Ramadan that equals one if the month is in
the Ramadan period and equals zero otherwise.33 If either (1) the local network effect of
religious borrower prefers to default on the conventional loan, then the ratio of the Islamic over conventional loan default probabilities may be smaller for the two-loan borrowers than for the one-loan borrowers (which is precisely what our findings so far suggest). An alternative explanation for our findings could be that the bank loan officer similarly driven by religious beliefs – maybe the loan officer works for an Islamic branch because of religious beliefs or is influenced by its orientation – is lenient and helps (or convinces) the borrower in one way or another to avoid non-performance on the Islamic loan rather than on the conventional loan. The imputed interest rate on Islamic loans is more than 200 basis points higher than on conventional loans suggesting that borrowers may be “more religiously motivated” than banks (though it is important to note that the loan rate is only collected or imputed for less than half the loans, and that in the case of Islamic loans it may also include some insurance fees). Hence we prefer to discuss our findings in terms of borrower rather than in terms of loan officer religiosity.
32 Al-Azzam, Hill et al. (2011) find that the repayment delay on 160 group loans in Jordan is negatively affected by the percentage of group members who pray five times a day. More broadly Guiso, Sapienza et al. (2011) document that homeowners that find it “morally wrong to walk away” are less likely to say that they are willing to default when the value of their home equity falls below a certain threshold even if they can afford to pay the monthly mortgage costs.
33 During the sample period Ramadan took place from September 23rd, 2006, to October 22nd, 2006, from September 13th, 2007, to October 12th 2007, and from September 1st, 2008, to October 1st, 2008. In 2006 and 2007 we consider September and October Ramadan months, in 2008 only September.

Essays on Financial Intermediation and Markets 73
Models I II III IV V
Islamic Loan -0.569*** -0.463 -0.859 -2.133** -1.667
(0.191) (0.450) (0.715) (0.925) (1.185)
Islamic Loan * Ramadan -0.696*
(0.363)
Islamic Loan * Share 0.0399** 0.0429 13.13** 9.050
(0.0169) (0.0269) (6.533) (9.136)
Islamic Loan * Big City 0.0108 0.206 0.923 -0.331
(0.511) (0.907) (1.004) (1.360)
Islamic Loan * Share * Big City -0.0474** -0.170*** -10.830 -10.300
(0.0202) (0.0567) (6.666) (9.384)
Added Variables
Ramadan -0.0481
(0.0600)
Share 0.00588 0.00687 0.324 -0.767
(0.00462) (0.00525) (0.837) (0.870)
Share * Big City 0.000510 0.00193 -0.268 1.350
(0.00676) (0.00756) (1.021) (1.100)
Loan Characteristics
Maturity 0.0125*** 0.00396* -0.00912** 0.00397* -0.00828**
(0.00133) (0.00238) (0.00418) (0.00239) (0.00417)
Collateral 0.331*** -0.022 -0.593*** -0.0253 0.577***
(0.0990) (0.134) (0.134) (0.133) (0.133)
Cash -1.617*** 2.256*** 2.482*** 2.240*** 2.454***
(0.107) (0.113) (0.163) (0.113) (0.162)
Export -0.192*** -0.0536 -0.127 -0.0558 0.113
(0.0620) (0.204) (0.239) (0.205) (0.237)
Agricultural 0.217 -0.173 0.247 -0.177 0.218
(0.368) (0.262) (0.202) (0.265) (0.202)
Borrower Characteristics
ln(Size) 0.0267 0.0462 0.0285 0.0455
(0.0465) (0.0626) (0.0469) (0.0636)
Big City 0.395*** 0.486*** 0.470** 0.367*
(0.126) (0.143) (0.183) (0.198)
Bank Characteristics
Government 0.353*** 0.239* 0.229*
(0.115) (0.124) (0.128)
Specialized -0.505 -0.0259 -0.0512
(1.161) (0.318) (0.314)
Foreign -0.515 -0.855** -0.847**
(0.360) (0.337) (0.337)
Large 0.659*** 0.823*** 0.803***
(0.0967) (0.158) (0.152)
Intercept -7.145*** -5.799*** -7.141*** -6.010***
(1.308) (1.535) (1.308) (1.561)
Region dummies (7) No No No No No
Industry Dummies (67) No Yes Yes Yes Yes
Year*Month Fixed Effects d(Quarter) Yes Yes Yes Yes
Borrower Fixed Effects Yes No No No No
Bank Fixed Effects No No Yes No Yes
Log Pseudolikelihood -10,013 -21,928 -14,477 -21932 -14,554
α (Duration Dependence) - 0.971 1.021 0.970 1.045
Chi2(k) [LR in VI, VII, IX & XIII, Wald in others] 625.8 4,179*** 6,268*** 4,166.30*** 6,529.89***
Number of regressors minus one (k) 15 116 122 116 122
Number of Loan-Months 603,677 578,809 369,816 579,144 370,063
Number of Loans 152,730 148,316 107,215 148,397 107,282
Number of Borrowers 22,723 21,574 15,144 21,586 15,153
***, **, * indicate significance at 1%, 5% and 10% level, two-tailed.
Table 3.8: Religion as a Motivator to Perform on Loans
The table reports the maximum likelihood estimation results of duration models. All estimations except in Model I employ parametric
duration models with a Weibull distribution that includes a parameter of duration dependence. Model I reports the results of a Cox-
proportional hazard model and includes quarter dummies and borrower fixed effects. Estimations in Models II to V include only those
loans that are granted in the four provinces and the federal capital (i.e., regions where Pakistani political parties can operate and key
statistics are recorded) and exclude loans in other regions administered by Pakistan. The sample period runs from 2006:04 to 2008:12.
The dependent variable is the hazard rate. For each variable in the specification the table reports the estimated coefficient, statistical
significance level and standard error (below in parentheses). In all estimations below involving parametric models, standard errors are
clustered by borrower.
Share = Religious Political
Parties
Share = Post-Natal Private
Care

74 Of Religion and Redemption: Evidence from Default on Islamic Loan
religious activity,34 and/or (2) the identification of the borrower with Islamic tenets,35
plays a role in explaining the lower hazard rate on Islamic loans, one would expect this
differential between conventional and Islamic loans to widen during the holy Muslim
month.36 The estimated coefficient on the interaction between Islamic loan and
Ramadan is indeed negative and sizeable, i.e., -0.696*, implying that during Ramadan
months default on Islamic loans drops by more than half.
In case the network effect of religious activity plays a role, the location of the borrower
(and/or the bank) may matter. In rural areas (and small towns) there may be more
inherent social pressure to repay and more informal help from family and friends in
case a borrower faces financial difficulties, and religious affiliation and practice may
provide few or no extra network benefits. The distinction between religious and other
political parties in rural areas and small towns may also be less acute than in big cities
because rural dwellers may in general be more religious.
34 Prospective borrowers and loan officers may meet at mosques for example. Meetings there between loan officers may also function as an informal credit register (see Jappelli and Pagano (1993), Padilla and Pagano (1997), Bouckaert and Degryse (2006) and Brown, Jappelli et al. (2009) for example on the effects of formal credit registers). Using 1999 – 2003 data on the composition of the boards of directors of all firms in Pakistan, Khwaja, Mian et al. (2011) estimate the value of membership in the large yet diffuse network that links firms through interlocks for the access to bank credit and financial viability. The common bond present in credit unions around the world may fulfill a similar role (McKillop and Wilson (2011)). Ostergaard, Schindele et al. (2009) for example find that savings banks located in Norwegian communities with high social capital have a higher probability of survival and lower loan losses. Though they stress the role social capital plays in facilitating collective decision-making at the banks.
35 Khan (2010) argues that “despite not providing an alternative to conventional banking and finance, Islamic banking and finance does strengthen a distinctly Islamic identity by providing the appropriate Islamic terminology for de facto conventional financial transactions.”
36 Ramadan is a fundamentally shared experience, both within the local community and with other Muslims across the world, and may hence result in both a (temporary) strengthening of local social networks and a surge in the identification with the Muslim world and its practices. Clingingsmith, Khwaja et al. (2009) show that identification with the global Muslim community may also strengthen following participation in the Hajj, but we lack individual Hajj participation data to test this conjecture in this context. Following Frieder and Subrahmanyam (2004), Bialkowski, Etebari et al. (2010) show that equity returns in 14 Muslim markets are substantially higher during Ramadan, while volatility is markedly lower. These findings can possibly be attributed to the sentiment of Islamic investors and their trades during this period.

Essays on Financial Intermediation and Markets 75
We introduce a dummy variable Big City that equals one if borrower is located in a
city with more than one million inhabitants and equals zero otherwise. To measure
local religious fervency we rely on a variable Share Religious Political Parties, which
equals the percentage of total votes obtained for National Assembly seats by the
coalition of six religious-political parties in the General Elections of 2002 in the district
where the borrower is located.37
We interact the Share variable with the Big City dummy. We expect that if the network
effects of religion matter the hazard differential between Islamic and conventional
loans will increase in the share of religious political parties in big cities (i.e., we expect
the estimated coefficient on Islamic Loan * Share * Big City to be negative).38
We report the estimates with the Share of Religious Political Parties and Big City
variables in Models II and III in Table 3.8. Notice that the sample now includes only
those loans that are granted in the four provinces and the federal capital (i.e., regions
where Pakistani political parties can operate) and exclude loans in other regions
administered by Pakistan. The results are very interesting. The estimated coefficients in
Model III (which includes bank fixed effects) for example suggest that in big cities: (1)
the loan hazard rate is on average almost 50 percent higher than in rural areas (i.e., the
coefficient on Big City equals 0.486***); (2) Islamic loans are relatively more likely to
default than in rural areas (i.e., the coefficient on Islamic Loan * Big City equals 0.206,
hence is positive and sizeable though not significant); and (3) Islamic loans are
37 We use the poll results from the 2002 General Election because 5 of the 6 religious-political parties boycotted the 2008 edition.
38 Borrower size may also be positively correlated with possible religious network effects. In various specifications we indeed find that the coefficient of our measure of borrower size interacted with the Islamic Loan dummy is negative, statistically significant, and economically sizable.

76 Of Religion and Redemption: Evidence from Default on Islamic Loan
relatively less likely to default loans if the share of religious parties grows while this is
not the case in rural areas (i.e., the coefficient on Islamic Loan * Share * Big City
equals -0.170***, while the coefficient on Islamic Loan * Share equals 0.0429).
This evidence suggests that difference in loan performance of conventional and Islamic
loans, especially among urban dwellers that in general may be less pious, may be
explained by the network effect of religious activity.
In robustness we replace the Share of Religious Political Parties with Religious School
Enrollment we glean from Andrabi, Das et al. (2006). They define this variable as the
number of children enrolled in religious schools as a percentage of total school
enrollments in each district (we use the mid-points for the ranges they report). Results
(we do not tabulate) again suggest that network effects of religion play a role in
determining the differential probability of conventional and Islamic loan repayment,
though now the effect is more muted in big cities than in rural areas. Possibly the
increased possibilities for pupils to commute in big cities may weaken the
correspondence between this measure of local religiosity and the differential in hazard
rates.39
In a recent study, Pepinsky (2010) argues that the demand for Islamic banking
products is determined more by a quest by individuals to claim or maintain a Muslim
identify, rather than by religiosity itself. The need for identification tends to be stronger
for middle-class borrowers, who are more vulnerable to social dislocation problems
induced by modernization and globalization, especially when located in a big city. We
39 We further replace the Big City by the Government Bank dummy in all specifications but none of the coefficients on the interaction terms are statistically significant. This result suggests that the share of religious parties may not influence the loan officers at these government banks (that grant also Islamic loans) to be more lenient on these loans.
Essays on Financial Intermediation and Markets 77
hypothesize that in particular these middle-class borrowers that look to strengthen their
Muslim identify not only demand more Islamic banking products but also have a lower
propensity to default on them, especially in big cities.
To test this conjecture, we introduce a variable Share of Post-Natal Private Care which
equals the percentage of women that used private (and not public) hospitals or clinics
for their post-natal care in the district of the borrower captures the local consumption of
a luxury good by the middle class. Models IV and V feature this new Share variable
and its interactions. The estimated coefficient on the triple interaction term (almost
marginally significant, its p-value equals 0.104) suggests that in big cities Islamic loans
are less likely to default than conventional loans if the share of post-natal private care
grows.
In sum, the reported estimated correlations suggest that in addition to borrower, loan
and/or bank loan characteristics, also religion may play some role in determining the
differential repayment performance of conventional and Islamic loans, through
individual piousness, network effects and maybe also group identification.
3.5 Conclusions
The hazard rate on Islamic loans is less than half the hazard rate on conventional loans,
across many duration models we estimate using a comprehensive monthly dataset from
Pakistan that follows more than 150,000 loans over the period 2006:04 to 2008:12. The
specifications include a variety of loan contract, borrower, and bank characteristics,
where possible combined with time, borrower, bank and/or borrower*bank fixed
effects. During Ramadan and in big cities where religious parties poll well Islamic
loans default less likely, suggesting that religious motivation may partly determine the
differential loan default rates.

78 Of Religion and Redemption: Evidence from Default on Islamic Loan
It is important to notice that our study does not aim to address the broader question if
conventional or Islamic finance is “better” from either the borrower’s, bank’s or even
society’s perspective. Such individual, institutional and public welfare analyses would
require for example the collection of detailed data on individual motivations for loan
repayment and the aggregation at the bank level of micro-level data, not only on
individual bank loans but also on deposits and other bank products, bank organization
and processes etc. Nor does our study imply that similar effects could not be present
among adherents to other religions or value systems. But studying the default rates on
individual conventional and Islamic loans is a first and necessary step, however, in
understanding how the specific arrangements in Islamic finance may, or may not,
determine borrower loan repayment.

79
Appendix 3-A: Types of Islamic Products This Appendix aims to provide a brief summary of the main issues in Islamic finance and the dominant types of Islamic products that are employed to finance small businesses. For more detail see Kettell (2010) for example. Under Islamic economic philosophy, granting a loan is essentially a charitable activity and hence should occur without any compensation. The borrower may (and is encouraged to) voluntarily pay back more than the principal amount to show her/his gratitude towards lender, however, it is prohibited to make an agreement regarding any such additional payment. If someone wants to earn profits from transferring money, then one must make an investment and share both in the risk and the return of the venture. The ideal modes of Islamic finance are thus Musharakah (partnership, where all partners invest both money and some or contribute their expertise) and Mudarabah (partnership with some partners investing only money and others only their skills/labor). Islamic banks, however, have devised a variety of other products that mimic the conventional banking products. Many of these products are based on sale contracts rather than loan contracts while others are based on rental contracts. Salient features of most widely used Islamic financial products are given below. The first column lists the name of the Islamic banking product. The second column mentions the conventional (banking) product(s) that are similar to that particular Islamic product. The third column describes the way the product operates, the fourth column defines the default event and the last column describes the penalties in case of default.
Islamic
Product
Conventional
Equivalent
Operation Default Penalty in the Event of Default
Murabahah
Term loan (w/ balloon payment) installment loan (w/ bullet payments)
1. Murabahah is a kind of sale in which seller discloses cost to the buyer.
2. Bank and customer enter into a Murabahah agreement
3. The bank appoints the customer as its agent to purchase the asset and gives her/him money for that or the bank itself purchases the asset
Default occurs when the customer misses a payment. The facility is classified as non-performing when a payment is overdue by 90 days or more.
1. The bank cannot change the sales price once it is fixed.
2. To contain moral hazard on part of the customer regarding delayed payment or non-payment of any amount when it is due, the customer undertakes that s/he will give x% per annum of the overdue amount for the period of

80
Islamic
Product
Conventional
Equivalent
Operation Default Penalty in the Event of Default
4. Under a separate contract, the bank sells that asset to the customer at a marked-up price
5. The customer pays the price in installments over a period of time or in lump sum at an agreed on date.
Notes: Bank can appoint the customer as an agent to purchase the underlying asset on its behalf, but bank must retain the risk and return as the owner of the asset. Bank must own the asset before it could sell it. Murabahah cannot be used to finance commodities/assets already owned by the customer. Unlike a normal sale, the customer knows the cost and profit of the bank.
default to a charity fund managed by the bank.
3. Bank can approach a court to seek redressal, court may award solatium to the bank to cover the ‘real losses’ suffered like the cost of litigation. Real losses do not include time value of money.
Diminishing
Musharakah
Hire-purchase, mortgage financing
1. Customer approaches the bank with a request to finance a fixed asset (say building).
2. Bank agrees to a joint ownership with the customer and agrees to finance say 80% of the value of the building, worth $10M.
Default occurs when the customer misses a payment. The facility is classified as non-performing when a
1. Bank cannot change the rent or sale price of its share in asset once it is fixed.
2. To contain moral hazard on part of customer regarding delayed payment or non-

81
Islamic
Product
Conventional
Equivalent
Operation Default Penalty in the Event of Default
3. Bank pays $8M to seller, customer pays $2M to seller.
4. The bank divides its ownership in say 20 parts and the customer undertakes to purchase those parts at agreed dates.
5. The customer uses the building and pays rent to the bank for its 80% ownership in the building.
6. At agreed dates, the customer purchases the bank’s shares in the building, the ownership in the building gradually transfers to the customers.
7. The bank’s share in rent of the building decreases proportionally.
Notes: The contract of joint ownership and the promise to purchase the shares in asset from bank cannot be made conditional on each other.
payment is overdue by 90 days or more. Breach of promise also occurs if the customer does not keep her/ his promise to purchase bank’s share in asset.
payment of any amount when it is due, the customer undertakes that s/he will give x% per annum of the overdue amount for the period of default to a charity fund managed by the bank.
3. Bank can approach a court to seek redressal, court may award solatium to the bank to cover ‘real losses’ suffered by it like the cost of litigation. Real losses do not include time value of money.

82
Islamic
Product
Conventional
Equivalent
Operation Default Penalty in the Event of Default
The promise to purchase bank’s share is essentially a unilateral promise by the customer.
Ijarah
Operating
lease
1. It involves the transfer of usufruct but not ownership of the asset at an agreed rent.
2. Customer (lessee) approaches the bank (lessor) for lease of a specific asset and makes a promise to lease that asset.
3. The bank purchases the asset, or it may appoint customer to purchase the asset as its agent.
4. After acquisition, the bank rents the asset to the customer for a specific rent; rent may vary for different periods.
5. The customer pays the rent on agreed dates.
Notes: Anything, which cannot be used without consuming, cannot be leased out, for example money, wheat etc.
Bank retains the risks and rewards of the owner.
Default occurs when the lessee misses a payment. The facility is classified as non-performing when a payment is overdue by 90 days or more.
1. Bank cannot change the rent once it is fixed.
2. To contain moral hazard on part of customer regarding delayed payment or non-payment of any amount when it is due, the customer undertakes that s/he will give x% per annum of the overdue amount for the period of default to a charity fund managed by the bank.
3. Bank can approach a court to seek redressal, court may award solatium to the bank to cover ‘real losses’ suffered by it like the cost of litigation. Real losses do not include time value of money.

83
Islamic
Product
Conventional
Equivalent
Operation Default Penalty in the Event of Default
Customer is responsible for the costs and benefits as the user of the asset The lease agreement can be terminated with the mutual consent of lessee and lessor or it can be terminated by lessor if the lessee contravenes any terms of lease.
Ijarah wa’
Iqtina
Financial lease 1. It involves transferring of usufruct of the asset, and at the end of lease period ownership of the asset also transfers to customer.
2. Customer (lessee) approaches the bank (lessor) for the lease of a specific asset and makes a promise to lease that asset.
3. The bank purchases the asset, or it may appoint customer to purchase the asset as its agent.
4. The bank makes a separate promise to give the asset to the lessee at the end of lease period as a gift or to sell the asset for a specific price. The promise must be unilateral i.e. not binding on lessee and it cannot be conditional on the lease contract.
Default occurs when the lessee misses a payment. The facility is classified as non-performing when a payment is overdue by 90 days or more.
1. Bank cannot change the rent or sale price of the asset once it is fixed.
2. To contain moral hazard on part of customer regarding delayed payment or non-payment of any amount when it is due, the customer undertakes that s/he will give x% per annum of the overdue amount for the period of default to a charity fund managed by the bank.
3. Bank can approach a court to seek redressal, court may award solatium to the bank to cover ‘real losses’ suffered by

84
Islamic
Product
Conventional
Equivalent
Operation Default Penalty in the Event of Default
5. After acquisition, bank rents the asset to
the customer for a specific rent; rent may vary for different periods.
6. The customer pays the rent on agreed dates.
7. At the end of the Ijarah period, the bank sells the asset to the customer or gives it away to customer as gift.
Note: The contract of Ijarah cannot be conditional on signing the promise of sale or gift. The promise must be made separately.
it like the cost of litigation. Real losses do not include time value of money.
Istisna
In some aspects comparable to working capital finance
1. Istisna’ is a sales transaction where a commodity is traded before it comes into existence. It is an order to a manufacturer to manufacture a specific commodity for the buyer.
2. The price can be paid in advance, in
installments or at the time of delivery.
3. The bank and customer enter into an Istisna contract, bank orders the customer to manufacture specific goods.
Default occurs if customer fails to deliver specified goods in time. Default also occurs if the agent fails to perform her duties.
1. It is permissible for the bank and customer to agree that in the event of delay in delivery of goods the price will be reduced by a specific amount per day.
2. It is also permissible to change the price later because of force majeure.

85
Islamic
Product
Conventional
Equivalent
Operation Default Penalty in the Event of Default
4. Bank can pay some or entire sum of the order in advance or in installments.
5. Customer manufactures the products and delivers them to the bank. The delivery can be constructive.
6. Bank appoints the customer (or anyone else) as its agent to sell the manufactured goods for cash or credit and receives the proceeds.
7. The agent is entitled to agency fees for services.
Note: The customer can utilize the amount paid by bank for any purpose.
Salam
1. In Salam, the seller undertakes to supply specific goods to the buyer at a future date in exchange of a price fully paid in advance.
2. Bank enters in a Salam contract with customer and pays the price for goods to be delivered at a later date.
Default occurs, if the customer fails to perform her obligations under the contract. Any misrepresentation by the customer is also construed as an event

86
Islamic
Product
Conventional
Equivalent
Operation Default Penalty in the Event of Default
3. With the same delivery date bank enters into a parallel Salam with another customer to sell the goods that it expects to receive under the first Salam contract.
4. Alternatively bank can obtain a promise from another potential buyer of the goods that the bank expects to receive under Salam. The bank can then sell the products for cash when it receives them.
5. The price under two Salam contracts or the first Salam and purchase promise can be different and that difference is profit of the bank.
Notes: Engineering a buyback agreement using parallel Salam is not permissible, i.e., the seller under first Salam cannot be buyer under the second Salam contract The two Salam contract are distinct from each other and cannot be made conditional on one another. Bank can ask for security or guarantee to ensure performance on part of its customer
of default.

87
Islamic
Product
Conventional
Equivalent
Operation Default Penalty in the Event of Default
Musharakah
Joint venture 1. Musharakah is a relationship between two parties or more, who contribute capital to a business, and divide the net profit and loss. All providers of capital are entitled to participate in management, but not necessarily required to do so. The profit is distributed among the partners in pre-agreed ratios, while the loss is borne by each partner strictly in proportion to respective capital contributions.
2. Bank and customer enter into a Musharaka agreement by investing a certain sum of capital in the business for a specified period of time.
3. Bank and customer also define the share of each party in expected profits. The customer also gives an (annual) projection of profit.
4. The customer periodically (monthly/ quarterly) pays the profit to the bank based on the profit projections and bank’s share in profit.
5. These profit payments are provisional and
Default occurs if the customer fails to make profit or capital payments when they are due. The facility is classified as non-performing when a payment is overdue by 90 days or more.
1. If the business suffers losses, then bank assumes the losses in proportion to its investment.
2. To contain moral hazard on part of customer regarding delayed payment or non-payment of any amount when it is due, the customer undertakes that s/he will give x% per annum of the overdue amount for the period of default to a charity fund managed by the bank.
3. Bank can approach a court to seek redressal, court may award solatium to the bank to cover ‘real losses’ suffered by it like the cost of litigation. Real losses do not include time value of money.

88
Islamic
Product
Conventional
Equivalent
Operation Default Penalty in the Event of Default
are subject to upward or downward adjustments based on the realized profits/losses.
6. At the end of Musharaka contract, customer pays back the capital of the bank net of profits/losses.
Notes: Return can be fixed as a percentage of profit but not as a percentage of investment. Share of an active partner in profit can be more than her/his contribution to capital. A sleeping partner cannot share in profit more than her/his share is capital. Loss is always shared proportional to the invested capital.
Mudaraba
Similar to hedge / mutual funds
1. Mudaraba is a kind of partnership between two parties, where one party (or parties-financiers) provides finances and the other (entrepreneur) provides expertise, labor and management. Profits made are shared between the financier and the entrepreneur according to a predetermined ratio. In the event of loss, the financier absorbs all losses, while the entrepreneur loses her/his provision of
Default occurs if the customer fails to make payments to the bank when they become due under the agreement or when customer fails to render her/his duties as agent of the bank to manage the affairs of
1. If the customer (agent) acts negligently to run the affairs of the business and business suffers loss because of negligence then bank can deny payment of compensation(for management and labor) to the customer.

89
Islamic
Product
Conventional
Equivalent
Operation Default Penalty in the Event of Default
labor
2. Bank and customer enter into a Mudaraba agreement, whereby the bank invests all the required capital and the customer commits his skills/management.
3. Bank and customer also define their shares in expected profits.
4. The customer periodically (monthly/ quarterly) pays the profit to the bank as agreed between the two.
7. At the end of Mudaraba contract, the Mudaraba can be dissolved or extended. In case of dissolution, the customer pays back the principal net of any accrued profits or losses.
Notes: Return can be fixed as a percentage of profit but not as a percentage of investment. Losses are always absorbed by the financier(s)/bank.
the business. The facility is classified as non-performing when a payment is overdue by 90 days or more.
2. The bank can also take over the business and terminate the right of the customer to look after it if the customer contravenes any terms of Mudaraba agreement.
3. The customer is liable for the loss if it is proven that s/he has breached her/his obligations.

90
Islamic
Product
Conventional
Equivalent
Operation Default Penalty in the Event of Default
Qard-e-
Hasna
Benevolent Loan
1. The borrower approaches the bank for financing.
2. The bank agrees to give loan to customer for a certain period, to be paid back in installments or in one go.
3. Bank can charge service fee, and documentation charges.
4. Bank cannot claim any other interest or profits for time value of money.
Default occurs when the customer fails to pay an amount when it is due. The facility is classified as non-performing when a payment is overdue by 90 days or more.
1. Bank cannot any additional amount in the event of default by the borrower.
2. To contain moral hazard on part of customer regarding delayed payment or non-payment of any amount when it is due, the customer undertakes that s/he will give x% per annum of the overdue amount for the period of default to a charity fund managed by the bank.
3. Bank can approach a court to seek redressal, court may award solatium to the bank to cover ‘real losses’ suffered by it like the cost of litigation. Real losses do not include time value of money.

Essays on Financial Intermediation and Markets 91
Appendix 3-B: Banks
The appendix reports the banks by type (and which therefore may appear
in more than one category).
BanksIslamic BanksAlbaraka Islamic Bank B.S.C. (E.C.)Meezan Bank Ltd.Dubai Islamic Bank Pakistan Ltd.BankIslami Pakistan LimitedEmirates Global Islamic BankDawood Islamic Bank Ltd.Government BanksThe Bank of KhyberThe Bank of PunjabFirst Women Bank LimitedNational Bank of PakistanSpecialized BanksIDPB (industrial development)Punjab Provincial Cooperative Bank Ltd.SME BankZTBL (agricultural development)Foreign BanksAlbaraka Islamic Bank B.S.C. (E.C.)Barclays Bank PlcCiti Bank N.A.Deutsche Bank A.G.Hong Kong & Shanghai Banking CorporationOman International Bank S.A.O.G.The Bank of Tokyo-Mitsubishi Ltd.Large BanksBank Alfalah LimitedHabib Bank LimitedMCB Bannk LimitedNational Bank of PakistanUnited Bank LimitedBanks with Both Islamic and Conventional LoansAskari Commercial Bank LimitedBank Alfalah LimitedBank Al-Habib LimitedBank of KhyberHabib Bank LimitedHabib-Metropolital Bank LimitedMCB Bannk LimitedNational Bank of PakistanRoyal Bank of Scotland (Formerly ABN Amro Bank NV)Soneri Bank LimitedStandard Chartered Bank LimitedUnited Bank LimitedAll Other Banks (Smaller Private Domestic Banks Offering only Conventional Loans)Allied Bank LimitedArif Habib Rupali Bank LimitedAtlas Bank LimitedCrescent Commercial Bank LimitedFaysal Bank LimitedJS Bank LimitedKASB Bank LimitedMybank LimitedNIB Bank LtdSaudi Pak Commercial Bank LimitedSoneri Bank Limited

92 Of Religion and Redemption: Evidence from Default on Islamic Loan
Appendix 3-C: Regions and Industries
RegionsProvince of PunjabProvince of SindhNorth-Western Frontier Province (renamed as Khyber Pakhtoonkhwa in 2010)Province of BaluchistanFederal Capital Area(Pakistan Administered) Azad KashmirFederally Administered Tribal AreaFederally Administered Northern Area (Gilgit Baltistan as of 29 August 2009)Industries (Sectors)Agriculture, hunting and forestry - OthersCommerce and Trade- Retail tradeCommerce and Trade- Sale, maintenance and repair of motor vehicles and motor cyclesCommerce and Trade- Wholesales and commission tradeConstruction- BuildingsConstruction- InfrastructureEducationElectricity, gas and water supplyFishing, farming, aquaculture and related service activitiesForeign constituentsHealth and social workHotels, restaurants and clubsInsurance Manufacturing- Basic metalsManufacturing- Chemicals and chemical productsManufacturing- Electrical machinery and apparatusManufacturing- Fabricated metal productsManufacturing- Furniture and fixtureManufacturing- HandicraftsManufacturing- Jewellery and related articlesManufacturing- Machinery and equipmentsManufacturing- Medical, precision and optical instruments, watches and clocksManufacturing- Motor vehicles, trailers and semi - trailersManufacturing- Office, accounting and computing machineryManufacturing- Other sectorsManufacturing- Other non - metallic mineral productsManufacturing- Other transport equipmentManufacturing- Petroleum productsManufacturing- Radio, television and communication equipments and apparatusManufacturing- Rubber and plastic productsManufacturing- Sport goodsManufacturing- Food productsManufacturing- Papers, paper boards and productsManufacturing- Printing, publishing and allied industriesManufacturing- Tanning and dressing of leatherManufacturing- Textiles- WeavingManufacturing- Textiles- SpinningManufacturing- Textiles- FinishingManufacturing- Textiles- Made-upManufacturing- Textiles- KnitwearManufacturing- Textiles- Carpets and rugsManufacturing- Textiles- Wearing apparel, ready made garments and dressingManufacturing- Textiles- OtherManufacturing- TobaccoManufacturing- Wood productsMining and quarryingOther community, social and personal service activitiesOther service sectorsReal estate, renting and business activitiesShip breakingTransport, storage and communicationsTrust funds and non-profit organizationsTradingPetroleumBeveragesCementTelecommunicationSurgical and medical instrumentsFootwareSugarOil and gas expolarationPower generationRefinariesFertilizersAgriculture- RiceAgriculture- Raw cottonAgriculture- WheatMiscellaneous Industries
The appendix reports the names of the regions and industries.
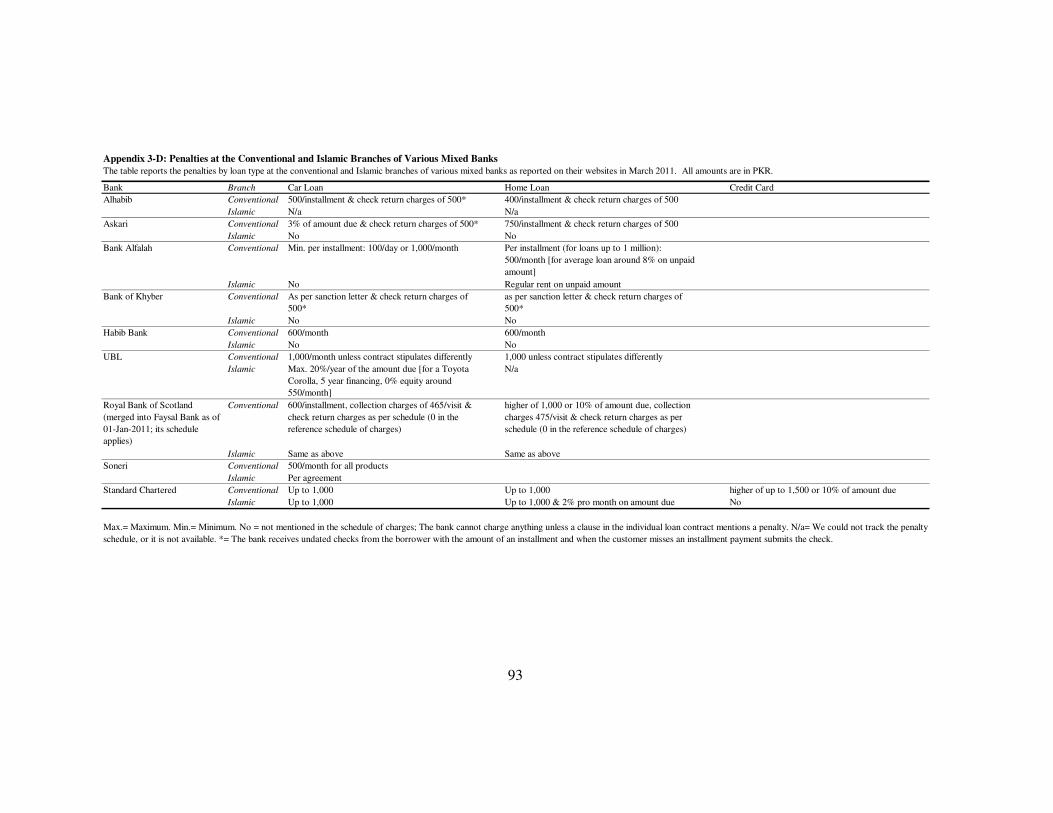
93
Bank Branch Car Loan Home Loan Credit Card
Alhabib Conventional 500/installment & check return charges of 500* 400/installment & check return charges of 500
Islamic N/a N/a
Askari Conventional 3% of amount due & check return charges of 500* 750/installment & check return charges of 500
Islamic No No
Bank Alfalah Conventional Min. per installment: 100/day or 1,000/month Per installment (for loans up to 1 million):
500/month [for average loan around 8% on unpaid
amount]
Islamic No Regular rent on unpaid amount
Bank of Khyber Conventional As per sanction letter & check return charges of
500*
as per sanction letter & check return charges of
500*
Islamic No No
Habib Bank Conventional 600/month 600/month
Islamic No No
UBL Conventional 1,000/month unless contract stipulates differently 1,000 unless contract stipulates differently
Islamic Max. 20%/year of the amount due [for a Toyota
Corolla, 5 year financing, 0% equity around
550/month]
N/a
Royal Bank of Scotland
(merged into Faysal Bank as of
01-Jan-2011; its schedule
applies)
Conventional 600/installment, collection charges of 465/visit &
check return charges as per schedule (0 in the
reference schedule of charges)
higher of 1,000 or 10% of amount due, collection
charges 475/visit & check return charges as per
schedule (0 in the reference schedule of charges)
Islamic Same as above Same as above
Soneri Conventional 500/month for all products
Islamic Per agreement
Standard Chartered Conventional Up to 1,000 Up to 1,000 higher of up to 1,500 or 10% of amount due
Islamic Up to 1,000 Up to 1,000 & 2% pro month on amount due No
Appendix 3-D: Penalties at the Conventional and Islamic Branches of Various Mixed Banks
The table reports the penalties by loan type at the conventional and Islamic branches of various mixed banks as reported on their websites in March 2011. All amounts are in PKR.
Max.= Maximum. Min.= Minimum. No = not mentioned in the schedule of charges; The bank cannot charge anything unless a clause in the individual loan contract mentions a penalty. N/a= We could not track the penalty
schedule, or it is not available. *= The bank receives undated checks from the borrower with the amount of an installment and when the customer misses an installment payment submits the check.

94 Of Religion and Redemption: Evidence from Default on Islamic Loan
Appendix 3-E: Religiosity and Loan Default: An Illustration Let � be the degree of religiosity of a business owner that borrows from a bank. When
� = 0 the borrower is secular, when � = 1 the borrower is a devout Muslim.
Both the probability the borrower takes a conventional loan and the probability the
borrower defaults on a loan likely decrease in the degree of religiosity. The motivation
for these two assumptions is straightforward. Islamic finance finds its existence and
inspiration in the principles of Islamic law so a more devout Muslim is more likely to
take an Islamic loan than a conventional loan. In addition, Islamic principles forbid
“eating” other people’s money in an unlawful way, hence a more devout Muslim is less
likely to default on a loan.
Given these two assumptions, Islamic loans will less likely default than conventional
loans. As an illustration assume for example that � is the probability that a borrower
obtains an Islamic loan and 1 − � the probability that a borrower takes a conventional
loan, and that the probability of default on a loan equals �(1 + � − �), which is a
decreasing function of the religiosity of the person, with � some value for which
0 < � < 1 and 0 < �(1 + �) < 1.
Borrowers of equal religiosity � that are granted either an Islamic or a conventional
loan are equally likely to default on these loans. Yet, if borrowers are uniformly
distributed (in � on (0,1)) and each take one loan, then the probability of default across
all granted Islamic loans equals � ��(1 + � − �)�� �� =
�� (�
� + �), while the probability
of default on all granted conventional loans equals � (1 − �)�(1 + � − �)���� =
�� ��
� + ��. Hence the ratio of the default probability across all Islamic versus
conventional loans equals that we would observe equals: �������� < 1. For � = �
� this ratio
equals 57 for example.
Borrowers may also take two loans. With probability �2 both loans are Islamic and
with probability (1 − �)2 both loans are conventional. With probability 2�(1 − �) one
loan is Islamic and the other loan is conventional, a probability which is at its
maximum for � = ��, that is for borrowers of an intermediate religiosity.

Essays on Financial Intermediation and Markets 95
If a borrower takes one Islamic and one conventional loan the probability the borrower
defaults on the Islamic loan likely decreases in his religiosity while a secular borrower
is likely to be indifferent. This assumption is motivated by our prior that a borrower
who has both types of loans and is a more devout Muslim will feel a more acute
conflict with his religious beliefs when defaulting on an Islamic loan than when
defaulting on a conventional loan. For example the probability a person defaults on the
Islamic loan rather than on the conventional loan when the borrower has two different
loans may equal 1−�
2 . The borrower then defaults on the conventional loan with
probability 1+�
2 .
For borrowers with one Islamic and one conventional loan, the default ratio of the
Islamic over the conventional loan, i.e., 1−�1+�, decreases in their religiosity �. In addition,
if borrowers are again uniformly distributed (in � on (0,1)) and each take two loans,
then the probability of default across all granted Islamic loans for those borrowers that
mix equals � 2�(1 − �) ���� (1 − �) (�(1 + � − �)���
� , while probability of default on
all conventional loans for those borrowers that mix equals � 2�(1 − �) ���� (1 +�
�
�) (�(1 + � − �)��. The ratio of these two probabilities equals 13, which is smaller than
the equivalent ratio across one-loan borrowers in our example.
In sum, if increasing religiosity decreases the probability the borrower: (a) takes a
conventional loan rather than an Islamic loan, (b) defaults on a loan, and (c) defaults on
the Islamic rather than on the conventional loan (if both an Islamic and conventional
loan are taken), then:
(1) Islamic loans are on average less likely to default than conventional loans.
(2) Intermediate religiosity is more likely to result in a conventional and Islamic loan
being taken.
(3) The ratio of the Islamic over conventional loan default probabilities for two-loan
borrowers is smaller than for one-loan borrowers.
Notice that implication (1) pertains to all observed loans (that are studied in models
without borrower fixed effects), while implication (3) is for those loans that are granted
to borrowers that take multiple loans (comprising those that are retained in the
borrower and bank*borrower fixed effects models).

96
4
Financial Reforms and Monetary
Policy Transmission in Sub-Saharan
Africa40
4.1 Introduction
One of the key elements in the transmission mechanism of monetary policy is the degree and
speed at which changes in the short-term policy rates or money market rates are translated
into retail interest rates. An important factor that may influence how policy stimuli are
reflected in market reaction is the financial structure of an economy.
Impact of financial structure on dissemination and effectiveness of monetary policy is largely
understudied. Especially little empirical evidence is available for the impact of financial
structure on transmission mechanism of monetary policy in Sub-Saharan Africa (SSA).
Moreover, the literature that addresses the linkage between transmission of monetary policy
and financial structure treats financial structure in a given economy as static, whereas,
financial structure does evolve over time with the ongoing financial reforms.
40 This paper was written during my stay at International Monetary Fund (IMF) the views expressed in this paper are strictly mine and do not necessarily represent those of the IMF or IMF policy
Essays on Financial Intermediation and Markets 97
Purpose of this chapter is to study the evolution of interest rate pass-through in selected Sub-
Saharan African countries over a period of time to find out if ongoing financial reforms affect
interest rate pass-through in the region.
This is a highly relevant policy issue for SSA countries as these countries have been going
through costly financial reforms for quite some time so it is crucial to know if these ongoing
reforms have any effect on the transmission of monetary policy in these countries.
For this chapter, I limit the study of transmission mechanism to interest rate pass-through
and do not study other channels of monetary policy transmission. I follow a simple approach
in the spirit of Cottarelli and Kourelis (1994). In first step, I calculate impact and long run
multipliers for 16 SSA countries using rolling regressions. In the second step, I explain the
cross country differences in impact multipliers by regressing them on several indicators of
financial reforms using the database constructed by Abiad, Detragiache et al. (2008) .
The empirical results suggest that (a) in all SSA countries, save South Africa and Swaziland,
interest rate pass-through is weak both in terms of initial and long run responses and pass-
through is not static over time, (b) major differences in pass-through in different countries
exist in the sample, and (c) financial reforms positively affect interest rate pass-through albeit
with a lag.
Rest of the chapter is organized as follows. Section I documents the relevant literature.
Section II discusses the data and econometric model, Section III analyses the results and
Section IV offers some conclusions.
4.2 Literature Review
4.2.1 Monetary Policy and its Transmission:
The role of monetary policy has been extensively debated in literature(Milton (1968)). There
is a general consensus that goals of monetary policy are stable prices, high employment and

98 Financial Reforms and Monetary Policy Transmission in Sub-Saharan Africa
rapid growth. Economists also generally agree that monetary policy affects inflation. They
also acknowledge its impact on the short term economic activity but reject any role in the
long term growth (Freixas and Rochet (1997)).
To achieve the goals of monetary policy, central banks use intermediate operating targets that
can be measured with relative ease and swiftness. Several studies suggest that small changes
in short term interest rates may lead to large changes in output (Bernanke and Gertler (1995),
Bernanke, Gertler et al. (1996) and Hubbard (1995)), therefore, this intermediate target is
often money market interest rate. The money market interest rates are targeted assuming that
they would eventually lead to achieve the monetary policy objectives through channels of
monetary policy transmission (Espinosa-Vega and Rebucci (2003)).
There is some variation in the classification of these channels, however, these are generally
identified as interest rate channel, bank lending channel, balance sheet channel, asset price
channel, exchange rate channel, and expectation channel (see Mishkin (1996) for details).
For effective transmission of monetary policy, interest rate channel is crucial. (Bifang-
Frisancho, Mariscal et al. (2002) and Isakova (2008)). Borio and Fritz (1995) contend that
besides bank lending rates, bank deposit rates are also important as they influence the
consumption and saving decisions. Most of the literature on the transmission mechanism of
monetary policy assumes that changes in the money market interest rates are immediately and
completely passed through to the retail banking rates.( Espinosa-Vega and Rebucci (2003)). I
discuss more about this assumption in the next subsection.
4.2.2 Interest Rate Stickiness:
In contrast with the theoretical assumption of frictionless interest rate pass-through, several
empirical studies document that pass-through of money market rates to the retail rates is

Essays on Financial Intermediation and Markets 99
neither complete nor instant. Hannan and Berger (1991), Berger and Udell (1992), Neumark
and Sharpe (1992) and Lowe and Rohling (1992) were among the first to document stickiness
of retail interest rates. Berger and Udell (1992) show that lending rates are sticky with respect
to changes in t-bill rates, Hannan and Berger (1991) demonstrate that this stickiness increases
with market concentration, and Neumark and Sharpe (1992) provide evidence that deposit
rates show varying degree of stickiness for increase or decrease in t-bill rates.
This stickiness of retail bank rates has been given several justifications in the literature.
Lowe and Rohling (1992) postulate that explanations of stickiness of prices in goods markets
also hold true for financial markets. Mester and Saunders (1995) argue that a rise in interest
rates deteriorate the average creditworthiness of borrowers, therefore, banks prefer not to pass
on all changes in market interest rates to their borrowers. Fried and Howitt (1980) on the
other hand argue that borrowers may be more risk averse than shareholders of a bank. Being
risk averse, they prefer stable interest rate payments. To satisfy risk adverse customers, the
bank charges a less variable interest rate and is compensated by a higher interest rate. A weak
interest rate pass-through may also emanate from high administrative costs of adjustments
(Hannan and Berger (1991), and Hofmann and Mizen (2004)).
In a cross country setting, Cottarelli and Kourelis (1994) argue that the banking industry face
adjustment costs when interest rates change. A profit-maximizing bank will only change the
lending rate if the adjustment costs are lower than maintaining status quo. They further argue
that several structural parameters determine the adjustment mechanism, for example degree
of competition, entry barriers, restrictions on international capital flows and access to
alternative sources of finances are some of the factors that determine the degree of stickiness.
Several other studies also attempt to relate financial structure to the transmission of monetary
policy. Cottarelli, Ferri et al. (1995) postulate that the within Italy, the differences in the

100 Financial Reforms and Monetary Policy Transmission in Sub-Saharan Africa
degree of lending rate stickiness among Italian banks can be explained by differences in
concentration of banks’ local markets, their ownership structure and size. For old European
Union(EU) countries, Cecchetti (1999) concludes that legal and financial structure influence
the transmission of monetary policy. On the other hand Elbourne and de Haan (2006) do not
find link between financial structure indicators and monetary policy in new EU countries.
On another dimension, besides Cottarelli and Kourelis (1994), other papers that study
interest rate pass-through in cross-country setting, for example Borio and Fritz (1995), and
Mojon (2000) report heterogeneity in the pass-through in different countries. Mojon (2000)
also reports that for both lending and deposit, competition from direct finance increases the
pass-through. Thus, the literature suggests that differences in financial structure can be an
important source of varying degree of interest rate pass-through.
4.3 Data and Methodology
4.3.1 Impact and Long Run Multipliers
For this chapter, I follow the approach used by Cottarelli and Kourelis (1994) and Mojon
(2000). Employing a two-step regression approach, in the first step, I measure the degree of
stickiness of the retail lending or deposit rates as compared to the changes in the money
market rates (or t-bill rates) for each of the selected countries. Specifically, I estimate the
following regression:
, ,0 ,1 , 1 ,2 , , 2 , ,...i t i i i t i i t i n i t n i ti i m m uβ β β β− + −= + + + + + ; (1)
where, , , and i t i ti m are respectively the retail rates (lending or deposit rates) and wholesale
rates (money market or t-bill rates) for country i at time t.
As mentioned in introduction, one purpose of this chapter is to study the evolution of interest
rate pass-through over time. To this end, I employ rolling regressions following Toolsema
(2002). The notion behind rolling regressions is using a fixed ‘n’ number of observations

Essays on Financial Intermediation and Markets 101
from the total available N observations (n∈ N) to estimate the model and then re-estimating
the model every time dropping the first observation while adding an additional observation at
the end.
For estimations, I use a rolling window of 48 months, and use Akaike Information Criteria
(AIC) to determine lag length from the full sample and then apply the same lag for each
rolling window regression41. Since the interest rate time series are non-stationary, therefore, I
estimate equation (1) in first differences.
For each country and for each estimation window, I use coefficients from equation (1) to
calculate impact multiplier - a measure of stickiness, and long run multiplier as follows:
Impact Multiplier = , , 2i t xIM β= ; (2)
Long Run Multiplier = , , 20
1
1
1
n
i t x jjLM β
β+=
=−
∑ ; (3)
where ,i lx is the multiplier for country i for rolling period t and interest rate type x (lending or
deposit).
4.3.2 Interest Rate Pass-through, Financial Structure and Financial Reforms
In the second step, using general indicators of economic and financial development and also
several indicators of financial reforms from the data base constructed by Abiad, Detragiache
41 As an alternate, Schwarz Information Criterion (SIC) was also used to determine lag length. The multipliers calculated using either AIC or SIC were highly correlated with each other (correlation coefficient is between .70 and .94), therefore, these results are not further reported or used. Moreover, in another set of regressions to calculate impact and long run multipliers, I independently determine lag length for each of the rolling window regressions, that is, if there are 204 months corresponding to 156 rolling windows of 48-months each, then for each of the 156 regressions, lag length was independently determined using AIC. An Eviews program written to do that automatically is given in Appendix-1 and the plot of Impact and Long-run multipliers so calculated are given in Appendix-2.

102 Financial Reforms and Monetary Policy Transmission in Sub-Saharan Africa
et al. (2008), I explain time varying cross country impact multiplier by using the following
regression:
, , , ,i t x i t i tIM Z DepositDummy vγ δ= + + ; (4)
where, Zi,t is a matrix of indicators of general economic and financial development and a set
financial reforms at time t for country i. DepositDummy signifies if the impact multiplier is
for deposit rate or lending rate, it takes the value of 1 for impact multipliers for deposit rates
and 0 otherwise. For estimations, I use both a financial reform index and several parameters
of financial reforms as defined in the data sub-section.
The dependent variable in equation (4) is not observed, rather it is estimated, therefore, least
square estimation might be inefficient. To account for this, following Saxonhouse (1976), I
use weighted least square estimates where inverse of the standard error of impact multipliers
is used as weights.
Further, I calculate the impact multiplier at monthly frequency, whereas, indicators of
economic and financial development and data of financial reforms is available at an annual
frequency, therefore, some form of aggregation of dependent variable is necessary.
Following the practices in literature, I use two approaches, firstly estimating equation (4)
using the impact multiplier for the month of June-only for respective year of explanatory
variables (economic and financial indicators and financial reform data); and secondly
aggregating impact multiplier using its annual average. It may be noted that the matching of
impact multipliers and explanatory variables is still approximate at the best, because the
monthly impact multiplier is calculated by using data of 48 preceding months.
4.3.3 Data
To estimate the equation (1) defined in methodology, I use monthly data for interest rates

Essays on Financial Intermediation and Markets 103
(money market rates, t-bill rates, lending rates, and discount rates) obtained from IFS. High
frequency data is important because time aggregation may bias the results. Primarily, I use
money market rates as a measure of market rates but if money market rates are not available
then I use t-bill rates as their proxy. I use 16 SSA countries for which relevant data was
available. The sample period spans from 1990:01 to 2009:12. The countries that are analyzed
and the specific retail and market rates used for each country are listed Table 4.1. Summary
statistics of the interest rate data are given in Table 4.2. From the table it is apparent that
interest rates have been very high in SSA over the sample period.
In the second step, to estimate equation (4), I use some general economic and financial
indicators and financial reform database constructed by Abiad, Detragiache et al. (2008). This
data is available for only 8 of the 16 countries used in estimations in first step and it does not
cover period after 2005. Summary statistics of this data are presented in Table 4.2, which
show a low average rating of Financial Reform Index. A brief account of the variables that
are used in regressions is given below:
4.3.3.1 GDP Per Capita:
The GDP Per Capita is a broad measure of economic development of a country. Higher level
of per capita GDP corresponds to higher degree of economic development. It can also be
interpreted as a crude measure of financial development because of its high correlation with
financial assets to GDP ratio (Cottarelli and Lourelis(1994)) This measure is taken from
World Development Indicators maintained by World Bank and is defined as GDP divided by
midyear population.GDP is the sum of gross value added by all resident producers in the
economy plus any product taxes and minus any subsidies not included in the value of the
products. It is calculated without making deductions for depreciation of fabricated assets

104 Financial Reforms and Monetary Policy Transmission in Sub-Saharan Africa
Country Retail Rate Market/ Policy Rate Period
Burundi Lending T-Bill Rate 1990M01 - 2006M12
Ghana Deposit Money Market Rate 2003M04 - 2009M12
Kenya Deposit & Lending T-Bill Rate 1990M01 - 2009M12
Mauritius Deposit & Lending Money Market Rate 1990M01 - 2009M12
Mozambique Deposit & Lending Money Market Rate 1998M05 - 2009M12
Namibia Deposit & Lending Money Market Rate 1991M09 - 2009M12
Nigeria Deposit & Lending T-Bill Rate 1990M01 - 2009M12
Rwanda Deposit & Lending Money Market Rate 1996M09 - 2009M01
Seychelles Deposit & Lending T-Bill Rate 1990M01 - 2009M12
SierraLeone Deposit & Lending T-Bill Rate 1990M01 - 2008M12
SouthAfrica Deposit & Lending Money Market Rate 1990M01 - 2009M12
Swaziland Deposit & Lending Money Market Rate 1990M01 - 2009M12
Tanzania Deposit & Lending T-Bill Rate 1994M09 - 2009M12
Uganda Deposit & Lending T-Bill Rate 1990M01 - 2002M11
Zambia Deposit & Lending T-Bill Rate 1990M01 - 2002M11
Zimbabwe Deposit & Lending T-Bill Rate 1990M01 - 2002M11
This table lists the SSA countries used in the analysis, the retail rate used for these
countries, whether t-bill rate or money market rate is used as a market rate and
the sample period for the countries
Table 4.1: List of Countries and Rates

Essays on Financial Intermediation and Markets 105
Country Retail Rate Mean Std. Dev Median Min Max
Burundi Lending Rate 15.805 2.191 15.610 10.990 20.510
T-Bill / Money Market Rate 11.000 3.774 10.030 4.000 19.610
Ghana Lending Rate 20.996 8.925 20.560 7.250 36.210
T-Bill / Money Market Rate 16.101 4.975 15.480 8.120 28.250
Kenya Lending Rate 9.138 5.245 6.250 2.020 21.450
Deposit Rate 21.399 7.546 19.300 11.970 38.550
T-Bill / Money Market Rate 15.508 12.867 12.886 0.830 84.670
Mauritius Lending Rate 10.036 1.713 9.750 6.250 13.750
Deposit Rate 20.006 1.775 21.000 15.000 23.550
T-Bill / Money Market Rate 7.781 3.243 8.105 1.000 13.400
Mozambique Lending Rate 15.447 9.964 11.196 6.966 42.400
Deposit Rate 21.177 3.676 19.838 14.824 33.500
T-Bill / Money Market Rate 13.561 5.665 12.835 4.520 31.440
Namibia Lending Rate 9.189 2.506 8.845 5.110 14.650
Deposit Rate 16.051 3.826 15.525 9.750 24.840
T-Bill / Money Market Rate 10.913 3.284 10.145 6.450 20.510
Nigeria Lending Rate 13.656 3.882 13.130 5.080 27.000
Deposit Rate 20.679 3.885 20.100 10.040 37.800
T-Bill / Money Market Rate 13.416 5.216 12.650 2.000 27.500
Rwanda Lending Rate 8.492 1.541 8.750 5.000 11.400
Deposit Rate 16.223 1.519 16.205 12.000 19.000
T-Bill / Money Market Rate 9.039 1.755 9.000 2.280 15.800
Seychelles Lending Rate 13.049 2.542 12.760 9.671 16.550
Deposit Rate 8.347 4.331 5.244 2.380 18.980
SierraLeone Lending Rate 16.530 14.682 10.000 5.130 70.600
Deposit Rate 31.459 13.290 25.000 20.000 73.500
T-Bill / Money Market Rate 26.334 17.591 20.365 3.800 95.200
SouthAfrica Lending Rate 11.663 3.709 11.230 5.870 21.600
Deposit Rate 16.062 3.589 15.500 10.500 25.500
T-Bill / Money Market Rate 11.815 3.800 11.095 6.430 21.250
Swaziland Lending Rate 8.102 2.515 8.000 3.890 13.430
Deposit Rate 14.838 2.769 14.500 10.000 21.000
T-Bill / Money Market Rate 7.667 2.527 7.940 3.360 12.130
Tanzania Lending Rate 9.165 6.097 7.640 2.452 27.000
Deposit Rate 22.766 8.987 20.550 13.282 48.000
T-Bill / Money Market Rate 12.318 10.387 9.700 2.500 62.300
Uganda Lending Rate 15.312 10.203 11.180 3.540 39.000
Deposit Rate 25.050 7.263 21.440 17.144 40.000
T-Bill / Money Market Rate 17.304 12.485 11.390 2.969 43.500
Zambia Lending Rate 34.220 20.074 26.000 11.400 111.000
Deposit Rate 51.549 22.700 45.700 27.700 139.300
T-Bill / Money Market Rate 46.734 31.179 36.952 17.333 177.680
Zimbabwe Lending Rate 24.949 11.275 24.380 8.250 54.000
Deposit Rate 35.305 15.029 34.760 11.500 71.250
T-Bill / Money Market Rate 29.251 15.055 27.300 7.740 69.410
This table presents the summary statistics for the interest rate series of the SSA countries used
in the analysis. All numbers are in percentages
Table 4.2: Summary Statistics for Interest Rates

106 Financial Reforms and Monetary Policy Transmission in Sub-Saharan Africa
Country Indicator Mean Std. Dev Median Min Max
Ghana Normalized Financial Reform Index 0.42 0.08 0.43 0.33 0.57
Directed Credit 1.13 0.35 1.00 1.00 2.00
Credit Controls 1.13 0.35 1.00 1.00 2.00
Interest Rate Controls 3.00 0.00 3.00 3.00 3.00
Bank Entry Barriers 1.07 0.26 1.00 1.00 2.00
Banking Supervision 0.47 0.74 0.00 0.00 2.00
Privatization 0.67 0.49 1.00 0.00 1.00
International Capital Flows 1.00 0.00 1.00 1.00 1.00
Security Markets 1.53 0.52 2.00 1.00 2.00
(Market Capitalization + Total Credit)/ GDP 0.45 0.18 0.43 0.24 0.85
Real GDP (PPP) 3.64 0.67 3.77 2.55 4.89
Inflation 0.26 0.15 0.25 0.12 0.59
Kenya Normalized Financial Reform Index 0.59 0.14 0.64 0.36 0.74
Directed Credit 1.00 0.00 1.00 1.00 1.00
Credit Ceilings 0.93 0.26 1.00 0.00 1.00
Credit Controls 1.45 0.19 1.50 0.75 1.50
Interest Rate Controls 3.00 0.00 3.00 3.00 3.00
Bank Entry Barriers 2.40 0.91 3.00 1.00 3.00
Banking Supervision 0.60 0.51 1.00 0.00 1.00
Privatization 1.67 0.49 2.00 1.00 2.00
International Capital Flows 2.07 1.10 2.00 0.00 3.00
Security Markets 1.20 0.41 1.00 1.00 2.00
(Market Capitalization + Total Credit)/ GDP 0.29 0.17 0.23 0.13 0.72
Real GDP (PPP) 4.16 0.67 4.23 2.68 5.23
Inflation 0.09 0.07 0.09 0.02 0.29
Mozambique Normalized Financial Reform Index 0.53 0.24 0.68 0.05 0.71
Directed Credit 2.20 1.08 3.00 0.00 3.00
Credit Ceilings 0.47 0.52 0.00 0.00 1.00
Credit Controls 2.00 1.12 2.25 0.00 3.00
Interest Rate Controls 2.40 1.24 3.00 0.00 3.00
Bank Entry Barriers 2.73 0.70 3.00 1.00 3.00
Banking Supervision 0.73 0.46 1.00 0.00 1.00
Privatization 1.93 1.44 3.00 0.00 3.00
International Capital Flows 0.87 0.35 1.00 0.00 1.00
Security Markets 0.53 0.52 1.00 0.00 1.00
Lending Rate 9.19 2.51 8.85 5.11 14.65
Deposit Rate 16.05 3.83 15.53 9.75 24.84
T-Bill / Money Market Rate 10.91 3.28 10.15 6.45 20.51
(Market Capitalization + Total Credit)/ GDP 0.21 0.22 0.13 0.01 0.63
Real GDP (PPP) 2.24 0.50 2.27 1.40 3.16
Inflation 0.12 0.04 0.13 0.07 0.17
Nigeria Normalized Financial Reform Index 0.67 0.15 0.67 0.46 0.86
Directed Credit 2.13 0.92 2.00 1.00 3.00
Credit Ceilings 0.67 0.49 1.00 0.00 1.00
Credit Controls 2.10 1.03 2.25 0.75 3.00
Interest Rate Controls 2.07 1.03 2.00 0.00 3.00
Bank Entry Barriers 3.00 0.00 3.00 3.00 3.00
Banking Supervision 1.47 0.52 1.00 1.00 2.00
Privatization 2.53 0.52 3.00 2.00 3.00
International Capital Flows 0.40 0.51 0.00 0.00 1.00
Security Markets 2.40 0.51 2.00 2.00 3.00
Lending Rate 8.49 1.54 8.75 5.00 11.40
Deposit Rate 16.22 1.52 16.21 12.00 19.00
T-Bill / Money Market Rate 9.04 1.76 9.00 2.28 15.80
(Market Capitalization + Total Credit)/ GDP 0.34 0.21 0.29 0.15 0.80
Real GDP (PPP) 3.99 1.73 3.40 2.20 7.97
Inflation 0.19 0.19 0.14 0.07 0.73
contd.
This table presents the summary statistics for the financial reform index, its different paremeters, and measures of
eonomic and financial development indicators. The financial reform index is normalized between 0 and 1, whereas
other parameters are coded to take a value between 0 and 3 with 0 being most repressed and 3 being fully
liberalized
Table 4.3: Summary Statistics of Financial Reform Parameters
Real GDP in USD 100

Essays on Financial Intermediation and Markets 107
Country Retail Rate Mean Std. Dev Median Min Max
South Africa Normalized Financial Reform Index 0.78 0.13 0.82 0.54 0.87
Directed Credit 3.00 0.00 3.00 3.00 3.00
Credit Ceilings 0.00 0.00 0.00 0.00 0.00
Credit Controls 2.25 0.00 2.25 2.25 2.25
Interest Rate Controls 3.00 0.00 3.00 3.00 3.00
Bank Entry Barriers 2.60 0.83 3.00 1.00 3.00
Banking Supervision 1.40 0.51 1.00 1.00 2.00
Privatization 3.00 0.00 3.00 3.00 3.00
International Capital Flows 2.33 1.18 3.00 0.00 3.00
Security Markets 1.73 0.46 2.00 1.00 2.00
Lending Rate 8.10 2.52 8.00 3.89 13.43
Deposit Rate 14.84 2.77 14.50 10.00 21.00
T-Bill / Money Market Rate 7.67 2.53 7.94 3.36 12.13
(Market Capitalization + Total Credit)/ GDP 1.76 0.31 1.75 1.24 2.32
Real GDP (PPP) 35.52 7.94 35.70 24.40 52.35
Inflation 0.06 0.02 0.06 0.01 0.09
Tanzania Normalized Financial Reform Index 0.59 0.21 0.62 0.19 0.81
Directed Credit 2.47 1.13 3.00 0.00 3.00
Credit Ceilings 0.67 0.49 1.00 0.00 1.00
Credit Controls 2.35 1.13 3.00 0.00 3.00
Interest Rate Controls 2.73 0.70 3.00 1.00 3.00
Bank Entry Barriers 3.00 0.00 3.00 3.00 3.00
Banking Supervision 1.27 0.88 2.00 0.00 2.00
Privatization 0.80 1.01 0.00 0.00 2.00
International Capital Flows 1.13 0.64 1.00 0.00 2.00
Security Markets 1.13 0.64 1.00 0.00 2.00
Lending Rate 15.31 10.20 11.18 3.54 39.00
Deposit Rate 25.05 7.26 21.44 17.14 40.00
T-Bill / Money Market Rate 17.30 12.48 11.39 2.97 43.50
(Market Capitalization + Total Credit)/ GDP 15.23 8.26 11.41 8.21 34.08
Real GDP (PPP) 2.81 0.66 3.03 1.60 3.73
Inflation 0.13 0.10 0.07 0.05 0.34
Uganda Normalized Financial Reform Index 0.01 0.00 0.01 0.00 0.01
Directed Credit 1.00 0.00 1.00 1.00 1.00
Credit Ceilings 1.00 0.00 1.00 1.00 1.00
Credit Controls 1.50 0.00 1.50 1.50 1.50
Interest Rate Controls 2.53 0.99 3.00 0.00 3.00
Bank Entry Barriers 3.00 0.00 3.00 3.00 3.00
Banking Supervision 1.13 0.83 1.00 0.00 3.00
Privatization 1.53 1.19 2.00 0.00 3.00
International Capital Flows 1.67 1.18 1.00 0.00 3.00
Security Markets 0.87 0.35 1.00 0.00 1.00
Lending Rate 34.22 20.07 26.00 11.40 111.00
Deposit Rate 51.55 22.70 45.70 27.70 139.30
T-Bill / Money Market Rate 46.73 31.18 36.95 17.33 177.68
(Market Capitalization + Total Credit)/ GDP 0.06 0.03 0.06 0.00 0.10
Real GDP (PPP) 2.62 0.00 0.03 1.97 3.14
Inflation 0.05 0.00 0.00 0.00 0.10
Zimbabwe Normalized Financial Reform Index 0.56 0.09 0.56 0.37 0.65
Directed Credit 0.47 0.52 0.00 0.00 1.00
Credit Ceilings 0.73 0.46 1.00 0.00 1.00
Credit Controls 0.90 0.31 0.75 0.75 1.50
Interest Rate Controls 2.80 0.41 3.00 2.00 3.00
Bank Entry Barriers 1.53 1.06 1.00 0.00 3.00
Banking Supervision 0.20 0.41 0.00 0.00 1.00
Privatization 2.60 0.51 3.00 2.00 3.00
International Capital Flows 1.87 1.36 3.00 0.00 3.00
Security Markets 1.87 0.35 2.00 1.00 2.00
(Market Capitalization + Total Credit)/ GDP 1.84 1.66 0.94 0.42 5.20
Real GDP (PPP) 5.52 0.91 5.36 4.48 7.18
Inflation 0.50 0.40 0.32 0.19 1.40
Table 4.3: Summary Statistics of Financial Reform Parameters

108 Financial Reforms and Monetary Policy Transmission in Sub-Saharan Africa
or for depletion and degradation of natural resources. Data are in current 100s of U.S.
dollars.
4.3.3.2 Market Capitalization plus Credit to GDP:
Stock market capitalization to GDP ratio is an indicator of the role of stock market in
financing the enterprises in an economy, whereas the credit to GDP ratio is an indicator of
the size of banking sector. I use a combination of these two ratios, that is, market
capitalization plus credit to GDP ratio as an indicator of the size and importance of
financial system in an economy relative to its GDP. This indicator is thought to be
important as the relative size of the financial system is expected to influence the speed of
interest rate pass-through in an economy. The data used to construct this measure is
gleaned from World Development Indicators.
4.3.3.3 Inflation:
GDP deflator data taken from World Development Indicators is used as a measure of
inflation. This variable is important to explain interest rate pass-through as it is expected
that in countries with high inflation the adjustment lags of nominal variables is likely to
be shorter (Cecchetti(1986)).
4.3.3.4 Directed Credit:
Directed credit captures credit controls and excessively high reserve requirements.
Countries are rated on a scale of 0 to 3, 0 being highest degree of repression and 3 being
full liberalization.
4.3.3.5 Credit Ceilings:
Credit ceilings refer to the ceilings set by government on overall credit extended by
banks, or on credit to specific sectors. Countries are rated on a scale of 0 to 3, 0 being the

Essays on Financial Intermediation and Markets 109
highest degree of repression and 3 being full liberalization.
4.3.3.6 Interest Rate Controls:
This is one of the most common forms of financial repression whereby government
specifies both lending and deposit rates by setting ceilings or floors tight enough to be
binding in most circumstances. Interest rate controls increase the stickiness of retail rates.
Countries are rated on a scale of 0 to 3, 0 being the highest degree of controls and 3 being
full liberalization.
4.3.3.7 Entry Barriers:
To maintain control over credit allocation, government may restrict the entry into the
financial system of new domestic banks or of other potential competitors, for example
foreign banks or non-bank financial intermediaries. Entry barriers may take the form of
outright restrictions on the participation of foreign banks; restrictions on the scope of
banks’ activities; restrictions on the geographic area where banks can operate; or
excessively restrictive licensing requirements. On this parameter, countries are rated on a
scale of 0 to 3, with 0 being most restrictive policies and 3 being most liberalized.
4.3.3.8 Banking Supervision:
Banking supervision captures prudential regulations and supervision of the banking
sector. For this variable a high degree of governmental intervention is coded as a reform,
that is, countries with best supervision of banks are rated 3 and with worst supervision 0.
4.3.3.9 Privatization:
Privatization refers to the share of private sector in the ownership of banking sector.
Ownership of banks is the most direct form of control a government can have over credit
allocation and it adversely affects the interest rate pass-through. Countries with excessive

110 Financial Reforms and Monetary Policy Transmission in Sub-Saharan Africa
government ownership are rated 0 and with least government ownership are rated 3.
4.3.3.10 International Capital Flows:
International capital flows describe the restrictions imposed on international financial
transactions. Such restrictions give governments greater control over credit and exchange
rates. Again, countries are rated on a scale of 0 to 3, with 3 being most liberal capital flow
policies and 0 being the highest degree of restriction on capital flows.
4.3.3.11 Securities Markets:
A well functioning securities market is instrumental to the efficient pass-through of
interest rates. Countries with policies that best encourage the development of securities
markets are rated at 3 while the countries with policies aimed to restrict securities markets
are rated 0 on a scale of 0 to 3.
4.3.3.12 Financial Reforms Index:
Financial Reforms Index is sum of the scores achieved by countries on the above
parameters listed from 4. to 12; it is then normalized to be between 0 and 1.
4.4 Empirical Results
4.4.1 Impact and Long-Run Multipliers
The graphs for impact and long-run multipliers for the SSA countries under study are
presented in Figures 4.1– 4.29.
The results show that on average both the impact and long run multipliers are low and
pass-thorough is weak in both short run and long run, although the long run pass-through
appears to be higher on average. The cross country impact multiplier averages around
0.259 and the long run multiplier averages around 0.458 which is far less than complete
pass-through. It means that to effect a 100 basis point change in retail rates, the monetary
Essays on Financial Intermediation and Markets 111
authorities on average need to change the policy rates or influence money market rates by
386 basis points. Given that the SSA countries are amongst the poorest countries in the
world with rudimentary financial structure and systems, these results were not
unexpected.
The results also show that, there is a great degree of variability within SSA countries,
some countries notably South Africa and Swaziland have high impact and long-run
multipliers with almost complete pass-through of market rates to the retail rates for both
lending and deposit rates. At the start of the sample period both of these countries have
had modest impact and long-run multipliers that evolved together over time. This shows
convergence in the transmission mechanism of monetary policy for these two countries.
This convergence and co-evolution is, however, not a surprise as Swaziland pegs its
currency with South African Rand and does not follow an independent monetary policy.
On the other hand countries like, Nigeria, Sierra Leone, Uganda, Tanzania, Rwanda,
Mozambique, Ghana, Burundi have very low level of instant pass-through, it appears that
for these countries the retail markets and money markets are disconnected and the retail
interest rates are set independent of the market or policy rates. This is also not a
surprising finding for countries with thin financial markets and financial repression as
evident from low ratings on several parameters of financial reforms given in Table 4.3.
From the above mentioned figures, it is visible that both impact and long run multiplier

112 Financial Reforms and Monetary Policy Transmission in Sub-Saharan Africa
Figures 4.1 – 4.29
Evolution of Impact and Long Run Multipliers
0
0.2
0.4
0.6
0.8
1
Jan
-94
Jul-
95
Jan
-97
Jul-
98
Jan
-00
Jul-
01
Jan
-03
Jul-
04
Jan
-06
Jul-
07
Jan
-09
Burundi - Deposit RateBurundi - Deposit RateBurundi - Deposit RateBurundi - Deposit Rate
-0.2
0
0.2
0.4
0.6
0.8
Se
p-0
0
Se
p-0
1
Se
p-0
2
Se
p-0
3
Se
p-0
4
Se
p-0
5
Se
p-0
6
Se
p-0
7
Se
p-0
8
Se
p-0
9
Ghana- Deposit Rate
0
0.2
0.4
0.6
0.8
1
De
c-9
8
Jan
-00
Fe
b-0
1
Ma
r-0
2
Ap
r-0
3
Ma
y-0
4
Jun
-05
Jul-
06
Au
g-0
7
Se
p-0
8
Oct
-09
Kenya- Deposit Rate
-0.2
-0.1
0
0.1
0.2
0.3
0.4
0.5
0.6
0.7Ja
n-9
4
Se
p-9
5
Ma
y-9
7
Jan
-99
Se
p-0
0
Ma
y-0
2
Jan
-04
Se
p-0
5
Ma
y-0
7
Jan
-09
Kenya- Lending Rate
0
0.2
0.4
0.6
0.8
1
Jan
-94
Jul-
95
Jan
-97
Jul-
98
Jan
-00
Jul-
01
Jan
-03
Jul-
04
Jan
-06
Jul-
07
Jan
-09
Mauritius- Deposit Rate
-0.4
-0.2
0
0.2
0.4
0.6
0.8
1
Jan
-94
Se
p-9
5
Ma
y-9
7
Jan
-99
Se
p-0
0
Ma
y-0
2
Jan
-04
Se
p-0
5
Ma
y-0
7
Jan
-09
Mauritius- Lending Rate

Essays on Financial Intermediation and Markets 113
0
0.2
0.4
0.6
0.8
1
Ma
y-0
2
Fe
b-0
3
No
v-0
3
Au
g-0
4
Ma
y-0
5
Fe
b-0
6
No
v-0
6
Au
g-0
7
Ma
y-0
8
Fe
b-0
9
No
v-0
9
Mozambique- Deposit Rate
0
0.1
0.2
0.3
0.4
0.5
0.6
Au
g-0
1
Jun
-02
Ap
r-0
3
Fe
b-0
4
De
c-0
4
Oct
-05
Au
g-0
6
Jun
-07
Ap
r-0
8
Fe
b-0
9
De
c-0
9
Mozambique- Lending Rate
0
0.2
0.4
0.6
0.8
1
Jan
-94
Jul-
95
Jan
-97
Jul-
98
Jan
-00
Jul-
01
Jan
-03
Jul-
04
Jan
-06
Jul-
07
Jan
-09
Namibia- Deposit Rate
0
0.2
0.4
0.6
0.8
1
Jan
-94
Jul-
95
Jan
-97
Jul-
98
Jan
-00
Jul-
01
Jan
-03
Jul-
04
Jan
-06
Jul-
07
Jan
-09
Namibia- Lending Rate
0
0.2
0.4
0.6
0.8
1
Jan
-94
Jul-
95
Jan
-97
Jul-
98
Jan
-00
Jul-
01
Jan
-03
Jul-
04
Jan
-06
Jul-
07
Jan
-09
Nigeria- Deposit Rate
-0.4
-0.2
0
0.2
0.4
0.6
0.8
1
Jan
-94
Se
p-9
5
Ma
y-9
7
Jan
-99
Se
p-0
0
Ma
y-0
2
Jan
-04
Se
p-0
5
Ma
y-0
7
Jan
-09
Nigeria- Lending Rate
0
0.2
0.4
0.6
0.8
1
Se
p-0
0
Au
g-0
1
Jul-
02
Jun
-03
Ma
y-0
4
Ap
r-0
5
Ma
r-0
6
Fe
b-0
7
Jan
-08
De
c-0
8
No
v-0
9
Rwanda- Deposit Rate
00.10.20.30.40.50.60.70.8
Jan
-00
De
c-0
0
No
v-0
1
Oct
-02
Se
p-0
3
Au
g-0
4
Jul-
05
Jun
-06
Ma
y-0
7
Ap
r-0
8
Ma
r-0
9
Rwanda- Lending Rate

114 Financial Reforms and Monetary Policy Transmission in Sub-Saharan Africa
-0.2
0
0.2
0.4
0.6
0.8
1
Jan
-94
Se
p-9
5
Ma
y-9
7
Jan
-99
Se
p-0
0
Ma
y-0
2
Jan
-04
Se
p-0
5
Ma
y-0
7
Jan
-09
Seychelles- Lending Rate
-0.1
0
0.1
0.2
0.3
0.4
0.5
0.6
0.7
Jan
-94
Se
p-9
5
Ma
y-9
7
Jan
-99
Se
p-0
0
Ma
y-0
2
Jan
-04
Se
p-0
5
Ma
y-0
7
Jan
-09
Sierra Loene- Deposit Rate
-0.2
0
0.2
0.4
0.6
0.8
1
Jan
-94
Se
p-9
5
Ma
y-9
7
Jan
-99
Se
p-0
0
Ma
y-0
2
Jan
-04
Se
p-0
5
Ma
y-0
7
Jan
-09
Sierra Leone- Lending Rate
0
0.2
0.4
0.6
0.8
1
1.2
Jan
-94
Jul-
95
Jan
-97
Jul-
98
Jan
-00
Jul-
01
Jan
-03
Jul-
04
Jan
-06
Jul-
07
Jan
-09
South Africa- Deposit Rate
0
0.2
0.4
0.6
0.8
1
1.2
1.4
1.6
Jan
-94
Jul-
95
Jan
-97
Jul-
98
Jan
-00
Jul-
01
Jan
-03
Jul-
04
Jan
-06
Jul-
07
Jan
-09
South Africa- Lending Rate
0
0.2
0.4
0.6
0.8
1
1.2
1.4
Jan
-94
Jul-
95
Jan
-97
Jul-
98
Jan
-00
Jul-
01
Jan
-03
Jul-
04
Jan
-06
Jul-
07
Jan
-09
Swaziland- Deposit Rate
0
0.5
1
1.5
2
Jan
-94
Jul-
95
Jan
-97
Jul-
98
Jan
-00
Jul-
01
Jan
-03
Jul-
04
Jan
-06
Jul-
07
Jan
-09
Swaziland- Lending Rate

Essays on Financial Intermediation and Markets 115
-0.1
0
0.1
0.2
0.3
0.4
0.5
0.6
0.7
Se
p-9
8
No
v-9
9
Jan
-01
Ma
r-0
2
Ma
y-0
3
Jul-
04
Se
p-0
5
No
v-0
6
Jan
-08
Ma
r-0
9
Tanzania- Deposit Rate
-0.2
-0.1
0
0.1
0.2
0.3
0.4
0.5
0.6
0.7
Se
p-9
8
No
v-9
9
Jan
-01
Ma
r-0
2
Ma
y-0
3
Jul-
04
Se
p-0
5
No
v-0
6
Jan
-08
Ma
r-0
9
Tanzania- Lending Rate
0
0.2
0.4
0.6
0.8
1
1.2
Jan
-94
No
v-9
4
Se
p-9
5
Jul-
96
Ma
y-9
7
Ma
r-9
8
Jan
-99
No
v-9
9
Se
p-0
0
Jul-
01
Ma
y-0
2
Uganda- Deposit Rate
-0.2
-0.1
0
0.1
0.2
0.3
0.4
0.5
0.6
Jan
-94
De
c-9
4
No
v-9
5
Oct
-96
Se
p-9
7
Au
g-9
8
Jul-
99
Jun
-00
Ma
y-0
1
Ap
r-0
2
Uganda- Lending Rate
00.20.40.60.8
11.21.41.6
Jan
-94
No
v-9
4
Se
p-9
5
Jul-
96
Ma
y-9
7
Ma
r-9
8
Jan
-99
No
v-9
9
Se
p-0
0
Jul-
01
Ma
y-0
2
Zambia- Deposit Rate
0
0.2
0.4
0.6
0.8
1
1.2
Jan
-94
No
v-9
4
Se
p-9
5
Jul-
96
Ma
y-9
7
Ma
r-9
8
Jan
-99
No
v-9
9
Se
p-0
0
Jul-
01
Ma
y-0
2
Zambia- Lending Rate
00.10.20.30.40.50.60.70.8
Jan
-94
No
v-9
4
Se
p-9
5
Jul-
96
Ma
y-9
7
Ma
r-9
8
Jan
-99
No
v-9
9
Se
p-0
0
Jul-
01
Ma
y-0
2
Zimbabwe- Deposit Rate
0
0.2
0.4
0.6
0.8
1
1.2
Jan
-94
No
v-9
4
Se
p-9
5
Jul-
96
Ma
y-9
7
Ma
r-9
8
Jan
-99
No
v-9
9
Se
p-0
0
Jul-
01
Ma
y-0
2
Zimbabwe- Lending Rate

116 Financial Reforms and Monetary Policy Transmission in Sub-Saharan Africa
are not static for these countries as well and considerably change over time though these
changes are not unidirectional. Given the small number of countries in the sample, there
is not enough degree of freedom to formally relate the cross country variation in interest
rate pass-through (impact or long run multipliers) to the indicators of economic and
financial development. However, careful examination suggests that higher impact and
long run multipliers correspond to relatively more developed economy.
4.4.2 Financial Reforms and Transmission of Monetary Policy
Table 4.4, reports the results of equation (4) that relates time varying cross country
differences in impact multiplier to different parameters of financial reforms. The results
are discussed below:
4.4.2.1 Impact Multipliers and Financial Reform Index:
I start with a basic model by regressing impact multiplier on financial reforms index, its
lagged value and a dummy variable DepositDummy that identifies if the impact multiplier
is for deposit rate or lending rate. The results show that financial reforms leading to
higher degree of financial liberalization positively affect short run interest rate pass-
through. However this affect is not instant and it appears to affect only after a time lag.
This result holds after controlling for country fixed effects. The result also holds for
alternative aggregation methods for dependent variable, that is when annual average of
impact multiplier is used or when mid-year (June) impact multiplier is used. One standard
deviation improvement in financial reform index leads on average to a faster adjustment
by almost 2 basis points (7% faster adjustment).

Essays on Financial Intermediation and Markets 117
VARIABLES I II III IV V VI VII VIII
Financial Reforms -0.101 -0.117
(0.123) (0.135)
Financial Reforms(-1) 0.231**
0.099
Directed Credit 0.045 0.035 0.044 0.034 0.019 0.011
(0.042) (0.046) (0.050) (0.023) (0.025) (0.010)
Credit Ceilings 0.037 0.039 0.051 0.061 0.061 0.051
(0.046) (0.051) (0.047) (0.056) (0.042) (0.048)
Interest Rate Controls 0.046* 0.058* 0.012 0.013 0.010 0.023
(0.025) (0.034) 0.014 0.017 0.014 0.030
Entry Barriers -0.095 -0.082 -0.073 -0.066 -0.077 -0.065
(0.088) (0.056) (0.068) (0.078) (0.101) (0.083)
Banking Supervision 0.055 0.047 0.063 0.053 0.071 0.062
(0.051) (0.043) (0.082) (0.063) (0.066) (0.081)
Privatization 0.091** 0.071** 0.045* 0.039* 0.035* 0.036*
(0.041) (0.031) (0.026) (0.023) (0.020) (0.020)
International Capital Flows -0.130 -0.123 -0.100 -0.025 -0.029 -0.029
(0.162) (0.084) (0.130) (0.023) (0.038) (0.022)
Security Markets 0.036 0.026 0.037 0.024 0.033 0.029
(0.033) (0.034) (0.044) (0.016) (0.022) (0.022)
Market Capitalization + Credit/ GDP 0.073 0.147 0.091 0.083 0.082 0.093
(0.095) (0.174) (0.071) (0.123) (0.099) (0.064)
Per Capita GDP (0.013) (0.023) 0.034 0.057* 0.048 0.056*
(0.016) (0.016) (0.023) 0.035 (0.071) 0.032
Inflation 0.061** 0.052** 0.051* 0.045* 0.056* 0.051*
(0.026) (0.025) (0.028) (0.025) (0.034) (0.028)
Directed Credit(-1) -0.053* -0.048 -0.056* -0.056*
(0.030) (0.037) (0.030) (0.031)
Credit Ceilings(-1) -0.219 -0.126 -0.091 -0.098
(0.117) (0.086) (0.061) (0.067)
Interest Rate Controls(-1) 0.070* 0.062* 0.052* 0.061*
(0.038) (0.034) (0.029) (0.036)
Entry Barriers(-1) -0.047 -0.072 -0.047 -0.065
(0.032) (0.049) (0.031) (0.124)
Banking Supervision(-1) 0.057* 0.047 0.056 0.051
(0.032) (0.090) (0.039) (0.035)
Privatization(-1) 0.052 0.045 0.046 0.047
(0.037) (0.042) (0.032) (0.032)
International Capital Flows(-1) -0.068* -0.038 -0.041 -0.054*
(0.041) (0.035) (0.079) (0.032)
Security Markets(-1) 0.065* 0.063* 0.061 0.071*
(0.039) (0.037) (0.058) (0.042)
DepositDummy 0.033** 0.031* 0.022* 0.045**
(0.014) (0.019) (0.013) (0.023)
Intercept 0.295*** 0.153*** 0.110** 0.113*** 0.133*** 0.112*** 0.107*** 0.104**
0.099 0.052 0.056 0.040 0.048 0.039 0.038 0.050
Country Fixed Effects No Yes No Yes No Yes No Yes
Observations 107 106 101 101 100 100 100 100
Adj. R-squared 0.152 0.335 0.387 0.574 0.498 0.787 0.437 0.703
*** p<0.01, ** p<0.05, * p<0.1
In model with fixed effects, intercept is the average of fixed effects
Table 4.4: Estimation Results
This table reports least square estimates of regression of Impact Multiplier over index of Financial Reforms, its several components and general indicators of economic
and financial development. In Columns I-VI, the Impact Multipliers for the month of June are used as dependent variable, whereas in Columns VII to VIII, dependent
variable is the annual average of monthly Impact Multipliers. The heteroskedistic consistent standard errors are reported in parenthesis

118 Financial Reforms and Monetary Policy Transmission in Sub-Saharan Africa
4.4.2.2 Type of Retail Rates:
In all these specifications the coefficient on the dummy variable DepositDummy is
positive and significant, which signifies that in the sample the deposit rates adjust faster
than the lending rates. On average the impact multiplier for deposit rates is 2 to 4 basis
points higher than same for lending rates. One explanation for this phenomenon could be
that the demand deposits can be swiftly withdrawn and deposited elsewhere during the
periods of interest rate increases, whereas, the banks may be more sluggish in changing
the interest rates for existing loans or new loans of existing borrowers.
4.4.2.3 Directed Credit:
Directed credits are often required to be given at subsidized rates, therefore, presence of
directed credit is expected to have a negative bearing on the interest rate pass-through.
The coefficients of the current values of the directed credit are statically not significant.
However, the coefficients of the lagged value of this variable are significant and
surprisingly negative suggesting that removal of directed credit leads to worsening of
interest rate pass-through in the next period. Specifically, a one notch improvement in this
indicator results in slower adjustment of retail interest rates by 5 basis points. This
suggests that elimination of directed credit does not necessarily improve the interest rate
pass-through, and other accompanying reforms may be needed to deliver a positive result.
4.4.2.4 Interest Rate Controls
When using interest rate controls as a tool, the monetary authorities either specify a very
narrow band of floors and ceilings that are so tight that it effectively fixes the interest
rates or the authorities may allow the rates to fluctuate within broader bands. Since,
interest rate controls are direct ways of controlling the retail rates therefore any change in

Essays on Financial Intermediation and Markets 119
this control regime is expected to affect the interest rate pass-through instantly. The
results tabulated in Table 4.4 attests this conjecture. A one notch improvement in this
measure, for example, a change from fully repressed regime where retail interest rates are
set by the government to a regime where retail rates are allowed to hover within a band,
results in an improvement of interest rate pass-through by around 5 basis points or about
18% faster adjustment on average. The effect of change in interest rate control regime is
even steeper after a time lag, when financial institutions have time to respond to the
change in regime, one period lagged effect of this change by one notch is as much as 7%
that translates into 26% better pass-through to retail rates or improvement in impact
multiplier
4.4.2.5 Privatization
State ownership is a direct way of controlling the bank credit and is a common
phenomenon in SSA and other less developed countries. The state controlled bank may
not necessarily adjust their retail interest rates in response to changes in the market
interest rates. In the regression results the coefficients on the current value of the variable
privatization are positive and significant, whereas, the coefficients of the lagged values of
this variable are statistically not significant. A plausible explanation might be that the
process of privatization takes time thus already giving enough time to relevant institutions
to adjust their operations, therefore, lagged values of this variable are less important. A
one notch change in the value of this variable, for example, from fully repressed (50%-
100% state ownership) to partially liberalized (25%-50% state ownership) results in 4 to 9
basis point or 15%-34% improvement in the impact multiplier on average.

120 Financial Reforms and Monetary Policy Transmission in Sub-Saharan Africa
4.4.2.6 International Capital Flows:
The coefficient on this variable is negative though statistically insignificant in most of
the specifications. This result is not surprising, given that the ability of central bank to
conduct monetary policy depends on the commercial bank’s need for the liquidity
provided by the central bank. If the international capital flows are liberalized then banks
may fulfill their liquidity needs from abroad and thus may respond less to interest rate
changes in domestic markets. The results indicate that a one notch liberalization of
international capital flows (for example, from restrictions on capital outflows to minimal
approval requirements for such outflows) results in about 5 basis point decrease in the
impact multiplier.
4.4.2.7 Securities Markets:
The results given in Table 4.4 suggest that development in securities markets positively
affect the interest rate pass-through, but this affects shows up only after a lag. A one
notch improvement in securities market (for example, tax exemptions or introduction of
long term government bonds) in the previous period results in an increase of about 6 to 7
basis points (22% - 26%) in the impact multiplier.
4.4.2.8 Inflation:
The results showt that the speed of adjustment of retail rates to the money market rates is
better in inflationary environments. This results is similar to the one reported by
Cecchetti(1986) and Cottarelli and Kourelis (1994), but the economic effect is much
smaller in my results. A 20% (about one standard deviation) change in inflation translates
into a change in impact multiplier by a little more than 1 basis point on average.

Essays on Financial Intermediation and Markets 121
I do not further discuss the results for other variables that were not significant in the
entire set of regressions. In a nut shell the results reported in Table 4.4, show that
although some parameters affect the interest rate pass-through rather instantly, but most
of the affect appears after a time lag. It cannot be ruled out that the instant effect of some
reforms might actually be coming from the ‘announcement effect’ of the resolve of the
relevant authorities to implement those reforms. Among all the parameters, changes in
interest rate control regimes, abolishment of directed credit, privatization of state owned
banks, development of security markets and inflationary environment appear to have a
more consistent positive impact on interest rate pass-through. The results remain largely
robust to alternative aggregation methods as explained before. These results should be
interpreted with caution because the temporal match between dependent variable and
explanatory variables is not perfect. As mentioned in the methodology section, I relate
impact multipliers, calculated over a 48-month window, to financial reforms data for a
specific year.
4.5 Conclusions
This chapter studies the evolution of interest rate pass-through in select Sub-Saharan
African countries over a period of time to identify if the ongoing financial reforms affect
the interest rate pass-through in the region.
This issue is highly relevant for SSA as in most of the SSA countries, financial structures
are underdeveloped with thin securities markets, lack of domestic credit and inefficiencies
in banking systems. These countries have been going through financial reforms for quite
some time so it is crucial to evaluate if these ongoing reforms have any effect on the
transmission of monetary policy in these countries.

122 Financial Reforms and Monetary Policy Transmission in Sub-Saharan Africa
The empirical results suggest that in all SSA countries, save South Africa and Swaziland,
the interest rate pass-through is weak both in terms of initial and long run responses and
pass-through is not static over time, major differences in pass-through in different
countries exist in the sample, and financial reforms positively affect interest rate pass-
through albeit with a lag.
These results suggest that financial reforms may help in the efficient conduct of
monetary policy especially so if a country wishes to use indirect instruments of monetary
policy. The results of such reforms may take some time to show up and the impact of
different facets of reforms may differ, both in magnitude and in timing of results as well.

Essays on Financial Intermediation and Markets 123
Appendix – 4-A
Eviews Program for Lag-Length Selection using Information Criteria (AIC)
This program automatically selects lag length based on AIC for each of the rolling windows, runs appropriate ARDL type regression, and saves the desired output. 'if there are many countries, define the variable names in data as follows, 'Monthly Lending rate of Nigeria = lend_nigeria; 'Monthly Deposit rate of Nigeria = deposit_nigeria 'Monthly Money Market Rates of Nigeria = mm_nigeria %country = "country_name_here" 'country name %rate= "lend" 'lend for lending rate, deposit for deposit rate scalar nobs = 240 ' total number of observations scalar nw = 48 'estimation window size %eqname = "EQ01" 'name of equation object that will be used. %maxDL = "12" 'maxim um number of AR terms %dep = "D_"+%rate+"_"+%country 'dependent variable %regs = "C " 'independent variables %DL = "D_mm_"+%country 'independent variables %criterion = "@AIC" '"@AIC" for Akaike, "@schwarz" for Schwarz matrix(nr,15) LT_{%country}_{%rate} 'save the results in here !maxDL = @val(%maxDL) close {%eqname} genr D_{%rate}_{%country}= {%rate}_{%country} - {%rate}_{%country}(-1) genr D_mm_{%country}= mm_{%country} -mm_{%country}(-1) for !i = nw+1 to nobs smpl !i-nw+1 !i ' this leaves a sample size of nw !mincrit = 1e12 'set the minimum to an artificially large value to begin 'estimate the models %DLstring = "" for !j=1 to !maxDL 'build up string for DL terms. 'if !j>0 then %DLstring = %DLstring + %DL+"("+ @str(-!j) + ")" 'endif 'estimate equation equation {%eqname}.ls(n) {%dep} c AR(1) {%DL} {%DLstring} 'capture criterion if @upper(%criterion) = "@AIC" then !crit = {%eqname}.@aic endif

124 Financial Reforms and Monetary Policy Transmission in Sub-Saharan Africa
if @upper(%criterion) = "@SCHWARZ" then !crit = {%eqname}.@schwarz endif if @upper(%criterion) = "@HQ" then !crit = {%eqname}.@hq endif 'compare criterion if !crit < !mincrit then !mincrit = !crit !bestDL = !j '!bestMA = !j %bestDLstr = %DLstring 'store the best DL string endif equation eq2.ls(n) {%dep} c AR(1) {%DL} {%bestDLstr} for !k=1 to @ncoef-1 LT_{%country}_{%rate} (!i-nw,!k+1) = eq2.@coefs(!k) ' 2nd parameter is beta LT_{%country}_{%rate} (!i-nw,1) = eq2.@coefs(@ncoef) ' 2nd parameter is beta 'define other desired parameters here like above next next next 'results.line 'save c:/...../ path to save/xyz.wf1 'output off show {%eqname}

Essays on Financial Intermediation and Markets 125
Appendix 4-B
Evolution of Impact and Long Run Multipliers (using a different lag length for each rolling window regression)
0
0.2
0.4
0.6
0.8
1
1.2Ja
n-9
4
Jul-
95
Jan
-97
Jul-
98
Jan
-00
Jul-
01
Jan
-03
Jul-
04
Jan
-06
Jul-
07
Jan
-09
Burundi - Deposit RateBurundi - Deposit Rate
-0.4
-0.2
0
0.2
0.4
0.6
0.8
1
1.2
Se
p-0
0
Se
p-0
1
Se
p-0
2
Se
p-0
3
Se
p-0
4
Se
p-0
5
Se
p-0
6
Se
p-0
7
Se
p-0
8
Se
p-0
9
Ghana- Deposit Rate
-0.2
0
0.2
0.4
0.6
0.8
1
1.2
Jan
-94
Se
p-9
5
Ma
y-9
7
Jan
-99
Se
p-0
0
Ma
y-0
2
Jan
-04
Se
p-0
5
Ma
y-0
7
Jan
-09
Kenya- Lending Rate
0
0.2
0.4
0.6
0.8
1
1.2
De
c-9
8
Jan
-00
Fe
b-0
1
Ma
r-0
2
Ap
r-0
3
Ma
y-0
4
Jun
-05
Jul-
06
Au
g-0
7
Se
p-0
8
Oct
-09
Kenya- Deposit Rate
-1
-0.5
0
0.5
1
1.5
Jan
-94
Se
p-9
5
Ma
y-9
7
Jan
-99
Se
p-0
0
Ma
y-0
2
Jan
-04
Se
p-0
5
Ma
y-0
7
Jan
-09
Mauritius- Lending Rate
-0.2
0
0.2
0.4
0.6
0.8
1
1.2
1.4
Jan
-94
Se
p-9
5
Ma
y-9
7
Jan
-99
Se
p-0
0
Ma
y-0
2
Jan
-04
Se
p-0
5
Ma
y-0
7
Jan
-09
Mauritius- Deposit Rate

126 Financial Reforms and Monetary Policy Transmission in Sub-Saharan Africa
0
0.2
0.4
0.6
0.8
1
Au
g-0
1
Jun
-02
Ap
r-0
3
Fe
b-0
4
De
c-0
4
Oct
-05
Au
g-0
6
Jun
-07
Ap
r-0
8
Fe
b-0
9
De
c-0
9
Mozambique- Lending Rate
0
0.2
0.4
0.6
0.8
1
1.2
Ma
y-0
2
Fe
b-0
3
No
v-0
3
Au
g-0
4
Ma
y-0
5
Fe
b-0
6
No
v-0
6
Au
g-0
7
Ma
y-0
8
Fe
b-0
9
No
v-0
9
Mozambique- Deposit Rate
-0.2
0
0.2
0.4
0.6
0.8
1
Jan
-94
Se
p-9
5
Ma
y-9
7
Jan
-99
Se
p-0
0
Ma
y-0
2
Jan
-04
Se
p-0
5
Ma
y-0
7
Jan
-09
Namibia- Lending Rate
0
0.2
0.4
0.6
0.8
1
1.2
Jan
-94
Jul-
95
Jan
-97
Jul-
98
Jan
-00
Jul-
01
Jan
-03
Jul-
04
Jan
-06
Jul-
07
Jan
-09
Namibia- Deposit Rate
-2.5
-2
-1.5
-1
-0.5
0
0.5
1
1.5
Jan
-94
Se
p-9
5
Ma
y-9
7
Jan
-99
Se
p-0
0
Ma
y-0
2
Jan
-04
Se
p-0
5
Ma
y-0
7
Jan
-09
Nigeria- Lending Rate
-0.2
0
0.2
0.4
0.6
0.8
1
1.2
1.4
Jan
-94
Se
p-9
5
Ma
y-9
7
Jan
-99
Se
p-0
0
Ma
y-0
2
Jan
-04
Se
p-0
5
Ma
y-0
7
Jan
-09
Nigeria- Deposit Rate
0
0.5
1
1.5
2
Jan
-00
De
c-0
0
No
v-0
1
Oct
-02
Se
p-0
3
Au
g-0
4
Jul-
05
Jun
-06
Ma
y-0
7
Ap
r-0
8
Ma
r-0
9
Rwanda- Lending Rate
0
0.2
0.4
0.6
0.8
1
1.2
1.4
Se
p-0
0
Au
g-0
1
Jul-
02
Jun
-03
Ma
y-0
4
Ap
r-0
5
Ma
r-0
6
Fe
b-0
7
Jan
-08
De
c-0
8
No
v-0
9
Rwanda- Deposit Rate

Essays on Financial Intermediation and Markets 127
-0.2
0
0.2
0.4
0.6
0.8
1
1.2
1.4
Jan
-94
Se
p-9
5
Ma
y-9
7
Jan
-99
Se
p-0
0
Ma
y-0
2
Jan
-04
Se
p-0
5
Ma
y-0
7
Jan
-09
Seychelles- Lending Rate
-0.4
-0.2
0
0.2
0.4
0.6
0.8
1
1.2
Jan
-94
Se
p-9
5
Ma
y-9
7
Jan
-99
Se
p-0
0
Ma
y-0
2
Jan
-04
Se
p-0
5
Ma
y-0
7
Jan
-09
Sierra Leone- Lending Rate
-0.2
0
0.2
0.4
0.6
0.8
1
Jan
-94
Se
p-9
5
Ma
y-9
7
Jan
-99
Se
p-0
0
Ma
y-0
2
Jan
-04
Se
p-0
5
Ma
y-0
7
Jan
-09
Sierra Leone- Deposit Rate
0
0.5
1
1.5
2
Jan
-94
Jul-
95
Jan
-97
Jul-
98
Jan
-00
Jul-
01
Jan
-03
Jul-
04
Jan
-06
Jul-
07
Jan
-09
South Africa- Lending Rate
0
0.2
0.4
0.6
0.8
1
1.2
1.4
1.6
Jan
-94
Jul-
95
Jan
-97
Jul-
98
Jan
-00
Jul-
01
Jan
-03
Jul-
04
Jan
-06
Jul-
07
Jan
-09
South Africa- Deposit Rate
0
0.5
1
1.5
2
Jan
-94
Jul-
95
Jan
-97
Jul-
98
Jan
-00
Jul-
01
Jan
-03
Jul-
04
Jan
-06
Jul-
07
Jan
-09
Swaziland- Lending Rate
0
0.5
1
1.5
2
Jan
-94
Jul-
95
Jan
-97
Jul-
98
Jan
-00
Jul-
01
Jan
-03
Jul-
04
Jan
-06
Jul-
07
Jan
-09
Swaziland- Deposit Rate

128 Financial Reforms and Monetary Policy Transmission in Sub-Saharan Africa
-0.4
-0.2
0
0.2
0.4
0.6
0.8
1
1.2
Se
p-9
8
No
v-9
9
Jan
-01
Ma
r-0
2
Ma
y-0
3
Jul-
04
Se
p-0
5
No
v-0
6
Jan
-08
Ma
r-0
9
Tanzania- Lending Rate
-0.2
0
0.2
0.4
0.6
0.8
1
1.2
Se
p-9
8
No
v-9
9
Jan
-01
Ma
r-0
2
Ma
y-0
3
Jul-
04
Se
p-0
5
No
v-0
6
Jan
-08
Ma
r-0
9
Tanzania- Deposit Rate
-0.4
-0.2
0
0.2
0.4
0.6
0.8
1
Jan
-94
De
c-9
4
No
v-9
5
Oct
-96
Se
p-9
7
Au
g-9
8
Jul-
99
Jun
-00
Ma
y-0
1
Ap
r-0
2
Uganda- Lending Rate
0
0.2
0.4
0.6
0.8
1
1.2
Jan
-94
No
v-9
4
Se
p-9
5
Jul-
96
Ma
y-9
7
Ma
r-9
8
Jan
-99
No
v-9
9
Se
p-0
0
Jul-
01
Ma
y-0
2
Uganda- Deposit Rate
00.20.40.60.8
11.21.41.6
Jan
-94
No
v-9
4
Se
p-9
5
Jul-
96
Ma
y-9
7
Ma
r-9
8
Jan
-99
No
v-9
9
Se
p-0
0
Jul-
01
Ma
y-0
2
Zambia- Lending Rate
0
0.5
1
1.5
2
Jan
-94
No
v-9
4
Se
p-9
5
Jul-
96
Ma
y-9
7
Ma
r-9
8
Jan
-99
No
v-9
9
Se
p-0
0
Jul-
01
Ma
y-0
2
Zambia- Deposit Rate
0
0.5
1
1.5
2
Jan
-94
No
v-9
4
Se
p-9
5
Jul-
96
Ma
y-9
7
Ma
r-9
8
Jan
-99
No
v-9
9
Se
p-0
0
Jul-
01
Ma
y-0
2
Zimbabwe- Lending Rate
0
0.2
0.4
0.6
0.8
1
Jan
-94
No
v-9
4
Se
p-9
5
Jul-
96
Ma
y-9
7
Ma
r-9
8
Jan
-99
No
v-9
9
Se
p-0
0
Jul-
01
Ma
y-0
2
Zimbabwe- Deposit Rate

129
5
Financial Constraint and Stock
Returns - Evidence from G-7
Countries
"Risk is return, return is risk.
That is all ye know on earth,
and all ye need to know."
(John Keats)
5.1 Introduction
The notion of the risk-return relationship is not novel and the knowledge of its
existence is not restricted to the economists. As suggested by Keats, this phenomenon
was appreciated by non-financial circles as well long before it was formalized and
further developed by economists.
Building on the work of Markowitz (1952) and Tobin (1958); Sharpe (1964), Lintner
(1965) and Mossin (1966) developed the Capital Asset Pricing Model (CAPM). This
model starts with an assumption that investors form their portfolios following the
Markowitz (1952) logic. It hypothesizes that the only priced risk in market is the risk

130 Financial Constraint and Stock Returns - Evidence from G-7 Countries
associated with market portfolio that cannot be diversified away. CAPM states that
expected return on a risky asset is a linear function of its covariance with the market
portfolio.
CAPM was, however, not the last word in explaining the expected returns. Fama and
French (1992) observe that positive loading on excess market returns disappear during
the 1963-1990 period in the US market. Moreover, they also find a negative relation
between size of a firm, measured by its Market Equity (ME) and average stock returns,
and a positive relationship between book to market equity ratio (BE/ME) of stock and
the average stock returns.
This observation led Fama and French (1993, 1996) to propose a better three-factor
model to explain variation in cross section of expected stock returns. The three factor
proposed by Fama and French (1993) are excess returns on market portfolio, size factor
(Small Minus Big or SMB), calculated as returns on portfolio of small stocks less the
returns on portfolio of big stocks and value factor (High Minus Low or HML)
calculated as returns on portfolio of stocks with high BE/ME less returns on portfolio of
stocks with low BE/ME ratio. Fama-French three factor model states that expected
returns on stocks are linearly related to factor loadings on the returns of three portfolios
constructed to replicate underlying market, size and value (BE/ME) risk factors.
Formally, their three factor model can be written as:
E(Ri) - Rrf = βi (E(Rm) - Rrf) + βis E (SMB) + βih E (HML)
Where, E(Ri) and E(Rm) are expected returns on an asset i and the market portfolio,
respectively, Rrf is the risk free rate, and E(SMB) and E(HML) are expected returns of

Essays on Financial Intermediation and Markets 131
SMB and HML portfolios as defined above. βi , βis, and βih are the slopes of regression
of a stock’s excess return on the market portfolio’s excess return and SMB and HML
factors. The three slope coefficients represent the risk that is compensated by the
market.
Later on several other factors were identified that may explain cross-sectional variation
in expected stock returns. Notable amongst them are Momentum, TERM (Return on
Long-term Government Bonds – T-bill rate), Leverage and Liquidity factors. However,
the three factors introduced by Fama and French (1993) dominate the literature on
factor pricing.
In the literature on financial development and economic growth, it is a long held
observation that the firms differ in their ability to generate adequate external or internal
financial resources to finance their projects. The sensitivity of corporate investment to
financial constraints is also a well known fact. It is also established that this sensitivity
varies amongst different firms as documented by, for example, Fazzari, Hubbard et al.
(1988) and Whited (1992). This phenomenon is exploited by Lamont, Polk et al.
(2001), Campello and Chen (2005) and Whited and Wu (2006) to analyze the impact of
financial constraint on stock returns.
Lamont, Polk et al. (2001) find negative returns associated with financially constrained
firms. In contrast, Li (2011) reports positive returns for the financially constrained
firms especially in high R&D industries. Whited and Wu (2006) document that the
financial constraint factor explains the returns in small firms. Campello and Chen
(2005) also note that financial constraint is a priced risk.

132 Financial Constraint and Stock Returns - Evidence from G-7 Countries
My work in this chapter resembles mostly to Lamont, Polk et al. (2001), and Whited
and Wu (2006) although its scope is broader as I study the impact of financial
constraint factor in explaining cross-sectional variation of returns in G-7 countries. To
analyze this, I use an augmented model by including a Financial Constraint factor in the
existing Fama-French three-factor model. I choose to study all G-7 markets because
these countries represent important industrialized economies and it is crucial to
understand if Financial Constraint factor is significant across all markets or if there are
important cross-country differences.
The results show that Financial Constraint factor is significantly positive for portfolios
with smaller firms or value firms, which means that for these categories of stocks,
financial constraint is a priced risk. The Financial Constraint factor is especially
significant for the portfolios at the intersection of Small-Value firms. This factor does
not replace any of the three standard Fama-French Factors as they remain significant
when the Financial Constraint Factor is introduced. The results also confirm the
presence of a size and value factor in G-7 markets.
Cross-country differences in GDP growth rates, banking sector development and
equity market development do not appear to have any noticeable effect on the size or
significance of the coefficient of FC factor. However, in sub-periods within a country,
there is some evidence of a relationship between GDP growth rate and coefficient of
FC factor as generally a higher average GDP growth rate coincides with a bigger and
more significant coefficient of FC factor.
Rest of the chapter is structured as follows: Section I presents an overview of the
relevant literature, Section II describes the data and presents summary statistics,
Section III gives an overview of empirical model and methodology employed in the

Essays on Financial Intermediation and Markets 133
chapter, Section IV documents and discusses the empirical findings and section V
concludes.
5.2 Literature Review
5.2.1 The Factor Model
The most well-known model in the capital market theory is Capital Asset Pricing
Model that attempts to determine a theoretically appropriate required rate of return on
an asset. Empirical research, however, shows that average returns on stocks have little
relation to the market betas of Sharpe (1964) and Lintner (1965).
In a seminal paper, Fama and French (1992) document that the market beta alone has
little power in explaining the variation in stock returns. They report that firm size and
book-to-market equity ratio can explain cross-sectional variation in stock returns. Fama
and French (1993, 1996) posit that a three-factor model largely captures the average
returns in the US stock portfolios constructed on firm size and book-to-market equity.
Fama and French (1998) provide international evidence on the value premium by
observing that the value stocks (high book-to-market equity) outperform growth stocks
(low book-to-market equity) in most of the major international markets. Moreover, the
Fama-French three-factor model appears robust in other markets as well42.
Daniel and Titman (1997), however, argue that the characteristics of firms rather than
their covariance structure better explains the variation in the cross section of the
average stock returns. Davis, Fama et al. (2000) refute this claim and demonstrate that
the three-factor model is robust in the US.
1 For example, Chui and Wei (1998) test the Fama-French model for pacific basin emerging markets, Drew and Veeraraghavan (2001; Drew and Veeraraghavan (2002)test the model for several Asian markets, Drew, Naughton et al. (2003) test the model on Chinese Market, and Malin and Veeraraghavan (2004) apply the model to French, German and the UK stock markets.

134 Financial Constraint and Stock Returns - Evidence from G-7 Countries
By studying the US, the UK, Japanese and Canadian markets, Griffin (2002) reports
that domestic Fama-French factor models explain the variation in international returns
better than a global version of the model.
5.2.2 Financial Constraint and Stock Returns:
A firm is defined as financially constrained if it cannot finance its investment activities
either by internal means or external sources. There are several criteria that are used in
the literature to classify firms as financially constrained or unconstrained. Most
commonly used criteria include firm age, asset size as used by Gertler and Gilchrist
(1994), dividend payout ratio introduced by Fazzari, Hubbard et al. (1988), Bond
Rating first used by Whited and Wu (2006), Commercial Paper Rating as used by
Calomiris, Himmelberg et al. (1995), and the Kaplan and Zingales (1997) Index.
Earlier literature on financial constraint attempts to establish a relationship between
financial constraint and investment of firms. In a seminal paper, Fazzari, Hubbard et al.
(1988) observe that more financially constrained firms have higher investment-cash
flow sensitivities. Contrary to this, the Kaplan and Zingales (1997) report the least
investment cash flow sensitivity in the most financially constrained firms.
Later on, the focus shifted to the impact of financial constraint on asset prices. Lamont,
Polk et al. (2001) report that the stock returns of financially constrained firms move
together over time. In their sample period of 1968-1997, they also find that constrained
firms have lower average returns than relatively unconstrained firms. Contrary to this
Jaehoon and Hangyong (2009) report a positive return for the financial constraint factor
and posit that this factor is priced. Li (2011) supports this view and reports positive
returns to the financially constraint firms especially in high R&D industries.

Essays on Financial Intermediation and Markets 135
Gomes, Yaron et al. (2003) report that financing frictions provide an important
common factor for the cross section of stock returns. Using the data on stock
fundamentals, bonds and stock prices, Campello and Chen (2005) also report that
financial constraint factor has significant explanatory power over equity returns and
that the financial constraint risk is priced. Similarly, Whited and Wu (2006) document
that financial constraint factor explains returns in small firms.
5.3 Data
5.3.1 Data Description:
Following Fama and French (1993), I use data of non-financial firms in the analysis.
Furthermore, I also exclude all firms with negative book equity. The data collection and
screening procedure is similar to the one used by Fama and French (1993) and is
explained below.
Monthly price data for the US are taken from CRSP, while for other G-7 countries the
price data are taken from Datastream. The corresponding accounting data for the US
and Canada is supplemented from Compustat North America. For all other G-7
countries, accounting data is obtained from Compustat Global. If for any firm, the
required accounting data is available but price data is missing from Datastream then for
such firms, the price data are also obtained from Compustat and, whenever needed, the
relevant bilateral exchange rates are applied to convert it into the currency of the other
price data for that country.
Portfolios are redefined once a year at the end of every June. A stock must meet the
following criteria for inclusion in the analysis for July of year t. Firstly, its stock price
and book equity must be available for December of year t-1 and the stock price should

136 Financial Constraint and Stock Returns - Evidence from G-7 Countries
be available for June of year t. This is required because, market equity at the end of
December of year t-1 will be used to compute book-to-market (BE/ME) value, and
market equity for June of year t to measure firm size. Secondly, to calculate the Kaplan
and Zingales (1997) Index (KZ Index) as a measure of financial constraint of firms;
some additional accounting data must be available for the year t-1.
The accounting data needed to calculate the KZ Index (described later) include cash
and short-term investments, liabilities and stockholder's equity-total, long term debt,
depreciation and amortization, income before extraordinary items, preferred dividends,
common dividends, debt in current liabilities, net income and property, plant, and
equipment. To calculate KZ-Index, an additional condition is that, the sum of liabilities
and stockholder's equity; and the sum of long term debt, debt in current liabilities, and
stockholders' equity must be non-zero.
To proxy for the risk-free rates, I use the following interest rates. One-month t-bill
rates for the US, France, and Canada, one-month FT mid rate for Germany and Italy, 3-
month t-bill mid rate for the UK, and one-month Libor for Japan. All interest rate data
are taken from Datastream.
To ensure a reasonable number of stocks in the portfolios, I analyze only those years
where at the least 100 eligible stocks are available. Consequently, the period covered in
this study runs from Jul-82 to Dec-06 for the US, Jul-90 to Dec-06 for the UK, France,
Germany and Canada; Jul-97 to Dec-06 for Italy; and Jul-96 to Dec-06 for Japan.
5.3.2 Descriptive Statistics:
Summary statistics for the full and two equally sized sub-samples are reported in Table
5.1. The table shows that in the sample period the average interest rates are in the range

Essays on Financial Intermediation and Markets 137
of 0.29% to 0.51% per month for all countries except Japan. In Japan the average
interest rates are 0.019% per month.
In all markets, with the exception of Japan, the mean monthly excess market returns
are positive in full sample as well as in sub-samples. In Japan, the mean excess market
returns are negative during Jul-97 to Sep-01 period. The figures 5-A.1 to 5-A.7 (see
Appendix 5-A) show the graphs of monthly excess market returns for the full sample
for all seven countries. These graphs and the corresponding statistics show that the
excess market returns display the typical features of financial time series characterized
with erratic returns, frequent large outlying observations, more large negative returns
than large positive ones and volatility clustering.
The mimicking portfolios for size (Small market capitalization Minus Big market
capitalization or SMB), for value or book-to-market effect (High BE/ME Minus Low
BE/ME or HML) and for financial constraint (more constrained minus less constrained
or FC) all generate positive average returns over the sample period with only one
exception. In the US, the average monthly returns on SMB portfolio are negative
during Jul-1982 to Sep-1994 period
These descriptive statistics on excess market return, SMB and HML are comparable to
those reported by Fama and French (1996), and Davis, Fama and French (2000) for the
US market; and Griffin (2002) for the UK, Japan and Canada.
The statistics on FC factor are similar to those reported by Li (2011) for the US but are
different from Lamont, Polk et al. (2001) who report negative returns to the FC factor.
As financial constraint poses an additional risk, therefore, one would expect a portfolio
of more constraint firms to earn higher returns than a portfolio of less constraint firms.
Therefore, positive returns on the FC portfolio are more in line with theoretical .

138
Table 5.1
Summary Statistics
This table reports the summary statistics of the explanatory variables used in regression. The columns 1 through 5 present the statistics for the full sample period. Columns 6 through 15 report the summary statistics for the two equal-sized sub-samples.
(% per month)
Continued to next page…
Rf Rm-Rf SMB HML FC Rf Rm-Rf SMB HML FC Rf Rm-Rf SMB HML FC
(1) (2) (3) (4) (5) (6) (7) (8) (9) (10) (11) (12) (13) (14) (15)
Mean 0.423 0.744 0.091 0.425 0.383 0.525 0.802 -0.012 0.399 0.400 0.321 0.667 0.210 0.436 0.366
Median 0.420 1.080 -0.170 0.375 0.445 0.530 0.980 -0.040 0.290 0.464 0.390 1.420 -0.175 0.440 0.425
Maximum 1.050 12.430 22.180 13.800 5.322 1.050 12.430 8.430 8.325 5.322 0.560 8.180 22.180 13.800 5.322
Minimum 0.060 -23.130 -16.700 -12.800 -3.126 0.210 -23.130 -8.420 -6.532 -3.126 0.060 -16.200 -16.700 -12.800 -3.126
Std Dev 0.193 4.343 3.338 3.122 2.350 0.182 4.390 2.378 2.475 2.156 0.143 4.301 4.076 3.657 2.543
No of FiRm-Rfs(avg)
No of Months 294 147 147
Sample Period Jul-82 - Dec-06 Jul-82 - Sep-04 Oct-04- Sec-06
Rf Rm-Rf SMB HML FC Rf Rm-Rf SMB HML FC Rf Rm-Rf SMB HML FC
Mean 0.505 0.087 0.107 0.423 0.161 0.618 0.167 0.034 0.462 0.083 0.391 0.008 0.180 0.383 0.238
Median 0.453 0.578 0.106 1.344 1.269 0.544 0.284 0.061 1.469 0.644 0.392 0.683 0.150 1.219 1.894
Maximum 1.196 9.974 5.324 7.325 5.826 1.196 9.974 5.324 7.325 5.826 0.555 8.686 4.321 3.354 4.235
Minimum 0.277 -12.278 -6.324 -6.201 -4.717 0.397 -11.349 -6.324 -6.201 -4.717 0.277 -12.278 -3.215 -4.325 -3.257
Std Dev 0.190 3.991 3.230 2.412 2.092 0.206 4.085 3.460 2.637 1.629 0.063 3.914 3.000 2.188 2.556
No of FiRm-Rfs(avg)
No of Months 198 99 99
Sample Period Jul-90 - Dec-06 Jul-90 - Sep-98 Oct-98 - Dec-06
Rf Rm-Rf SMB HML FC Rf Rm-Rf SMB HML FC Rf Rm-Rf SMB HML FC
Mean 0.407 0.260 0.094 0.560 0.439 0.570 0.064 0.017 0.521 0.323 0.249 0.456 0.171 0.599 0.556
Median 0.290 0.883 0.031 0.807 0.895 0.532 0.330 0.025 0.751 0.525 0.236 1.126 0.038 0.864 1.264
Maximum 1.031 13.146 9.247 6.152 5.092 1.031 12.958 5.723 5.353 5.092 0.411 13.146 9.247 6.152 4.138
Minimum 0.167 -17.767 -6.939 -6.435 -3.768 0.268 -15.355 -6.320 -5.598 -3.768 0.167 -17.767 -6.939 -6.435 -2.892
Std Dev 0.238 5.655 2.906 2.254 1.960 0.240 5.889 2.789 2.097 1.624 0.076 5.433 3.023 2.410 2.296
No of FiRm-Rfs(avg)
No of Months 198 99 99
Sample Period Jul-90 - Dec-06 Jul-90 - Sep-98 Oct-98 - Dec-06
C : France
Full Sample Sub-sample 1 Sub-sample 2
B : UK
Full Sample Sub-sample 1 Sub-sample 2
A : USA
Full Sample Sub-sample 1 Sub-sample 2
139
Table 5.1.: Summary Statistics (continued from previous page)
Rf Rm-Rf SMB HML FC Rf Rm-Rf SMB HML FC Rf Rm-Rf SMB HML FC
Mean 0.285 0.679 0.189 0.374 0.317 0.360 0.972 0.195 0.473 0.242 0.209 0.387 0.182 0.274 0.391
Median 0.267 0.998 0.041 0.747 0.954 0.368 0.006 0.043 0.946 0.561 0.180 1.590 0.040 0.549 1.348
Maximum 0.569 23.130 10.553 6.736 5.432 0.569 23.130 10.553 6.736 5.432 0.300 9.989 9.863 3.907 4.413
Minimum 0.168 -15.644 -7.920 -6.026 -4.019 0.211 -15.644 -7.920 -6.026 -4.019 0.168 -14.813 -7.402 -3.495 -3.085
Std Dev 0.108 6.172 3.337 1.887 2.091 0.100 7.493 3.450 2.388 1.733 0.043 4.548 3.224 1.385 2.450
No of FiRm-Rfs(avg)
No of Months 114 57 57
Sample Period Jul-97 - Dec-06 Jul-97-Mar-02 Apr-02 - Dec-06
Rf Rm-Rf SMB HML FC Rf Rm-Rf SMB HML FC Rf Rm-Rf SMB HML FC
Mean 0.374 0.619 0.175 0.358 0.209 0.494 0.870 0.168 0.294 0.234 0.253 0.381 0.181 0.421 0.183
Median 0.286 0.553 0.049 0.708 0.503 0.414 0.897 0.047 0.583 0.565 0.240 0.447 0.051 0.833 0.441
Maximum 0.818 21.164 9.247 5.404 5.437 0.818 16.695 8.600 3.783 5.437 0.413 21.164 9.247 5.404 4.241
Minimum 0.168 -25.696 -6.937 -5.557 -4.064 0.253 -17.990 -6.451 -3.890 -4.064 0.168 -25.696 -6.937 -5.557 -3.170
Std Dev 0.198 6.177 3.070 1.837 1.523 0.210 5.327 2.959 1.513 1.711 0.074 6.907 3.182 2.161 1.335
No of FiRm-Rfs(avg)
No of Months 198 99 99
Sample Period Jul-90 - Dec-06 Jul-90 - Sep-98 Oct-98 - Dec-06
Rf Rm-Rf SMB HML FC Rf Rm-Rf SMB HML FC Rf Rm-Rf SMB HML FC
Mean 0.389 0.355 0.626 0.440 0.221 0.489 0.060 0.681 0.349 0.368 0.289 0.651 0.571 0.531 0.073
Median 0.370 0.884 0.021 0.411 0.420 0.438 0.563 0.020 0.399 0.295 0.258 1.540 0.023 0.423 0.545
Maximum 1.108 11.451 5.067 2.918 2.853 1.108 7.236 4.188 2.774 2.853 0.458 11.451 5.067 2.918 2.286
Minimum 0.156 -20.592 -3.802 -2.964 -2.118 0.212 -20.592 -3.628 -2.767 -2.118 0.156 -13.756 -3.802 -2.964 -1.635
Std Dev 0.191 4.209 2.750 2.590 2.321 0.210 4.046 1.616 1.062 0.906 0.096 4.366 1.685 1.134 1.085
No of FiRm-Rfs(avg) 198.000
No of Months 198 99 99
Sample Period Jul-90 - Dec-06 Jul-90 - Sep-98 Oct-98 - Dec-06
Rf Rm-Rf SMB HML FC Rf Rm-Rf SMB HML FC Rf Rm-Rf SMB HML FC
Mean 0.019 0.159 0.282 0.396 0.259 0.031 -0.487 0.346 0.438 0.390 0.007 0.806 0.218 0.354 0.127
Median 0.007 0.084 -0.069 0.379 0.437 0.036 -0.999 -0.022 0.323 0.413 0.004 1.362 -0.116 0.435 0.461
Maximum 0.076 13.883 4.534 6.660 4.411 0.076 13.883 3.655 6.660 2.427 0.039 8.704 4.534 3.754 4.411
Minimum 0.003 -10.601 -3.877 -5.402 -2.824 0.005 -10.601 -3.877 -5.402 -2.824 0.003 -8.572 -3.654 -4.466 -2.679
Std Dev 0.019 5.412 4.320 3.040 1.978 0.020 6.066 2.149 2.051 1.781 0.009 4.626 3.359 2.900 2.106
No of FiRm-Rfs(avg)
No of Months 126 63 63
Sample Period Jul-96 - Dec-06 Jul-96- Sep-01 Oct-01 - Dec-06
G : Japan
Full Sample Sub-sample 1 Sub-sample 2
F : Canada
Full Sample Sub-sample 1 Sub-sample 2
E : Germany
Full Sample Sub-sample 1 Sub-sample 2
D : Italy
Full Sample Sub-sample 1 Sub-sample 2

140 Financial Constraint and Stock Returns - Evidence from G-7 Countries
expectations. The difference between my results and those reported by Lamont, Polk et
al. (2001) may be attributed to different sample periods, different application of the KZ
Index43, and different cut-off levels to construct FC factor.
Correlation matrices of the four factors over the full sample period are given in Tables
5-B.1 to 5-B.7 (see Appendix 5-B). These tables show that excess market returns are
positively correlated with both SMB and FC in most of the markets, suggesting higher
returns for smaller and financially constrained firms that are presumed to be riskier. In
the UK and Japan excess market returns are negatively correlated with the SMB factor.
HML is negatively correlated with both SMB and excess market returns in all markets
other than two exceptions. In the UK, HML is positively correlated with both SMB and
excess markets returns, and in Italy, SMB and HML have a positive correlation. The
directions of the correlations are similar to those reported by Griffin (2002) for the US,
Japan, Canada and, the UK. In all markets, FC factor is positively correlated with
excess market returns and SMB factor, and negatively correlated with the HML factor
5.4 Methodology and Empirical Model:
5.4.1 Portfolio Construction:
Following the mimicking portfolio approach of Fama and French (1993), I form six
size-BE/ME portfolios. I choose to form six portfolios instead of 25 or 100 portfolios to
have a reasonable number of stocks in each portfolio even when the number of eligible
stocks is low.
43 I apply KZ Index to all firms irrespective of the direction of sales growth, whereas, Lamont et al (2001) apply only to the firms with positive sales growth

Essays on Financial Intermediation and Markets 141
For each country, portfolios are constructed at the end of each June by the intersection
of two size portfolios and three portfolios formed on the basis of book equity to market
equity (BE/ME). For portfolio formation stocks are first sorted on the basis of their
Market Equity. For year t, the stocks above the median at the end of June of year t are
categorized as Big and the ones below median as Small. A second sort is done on the
basis of Book Equity/ Market Equity ratio (BE/ME). BE/ME for June of year t is the
book equity for the year ending in t-1 divided by ME for December of t-1. Stocks
falling in the top 30th percentile, on the BE/ME sort, are categorized as High BE/ME,
stocks falling in the bottom 30th percentile BE/ME are categorized as Low BE/ME
stocks, and the stocks in between them are categorized as Medium BE/ME Stocks. The
following figure illustrates the six portfolios:
Figure 5.1: This figure depicts the formation of six portfolios formed by double sorting the stocks on the basis of their Market Value (ME) and BE/ME ratio. The figure is adapted from the website of Kenneth R. Fama; http://mba.tuck.dartmouth.edu/pages/faculty/ken.french/)
The six portfolios so obtained from the intersection of the above 2x3 sort are
following. The Small-Low portfolio comprises firms that are both small in terms of
market capitalization and low in book-to-market equity ratio, the Small-Medium
portfolio comprises firms that are small in terms of size and are medium in terms of
book-to-market Equity ratio, and the Small-High portfolio comprises firms that are
small in terms of market capitalization and have high book-to-market equity ratio. The

142 Financial Constraint and Stock Returns - Evidence from G-7 Countries
Big-Low, Big-Medium and Big-High portfolio are defined similarly on the basis of
market equity (size) and BE/ME ratio.
5.4.2 Fama-French Factor Construction:
The standard Fama-French factors are constructed using six size-value portfolios
defined above, verbatim as explained by Fama and French (1993). SMB (Small Minus
Big) is the average return on the three small portfolios less the average return on the
three big portfolios:
SMB = 1/3 (Small Value + Small Neutral + Small Growth) - 1/3 (Big Value + Big Neutral + Big Growth)
HML (High Minus Low) is the average return on the two value portfolios (high B/E
ratio) minus the average return on the two growth portfolios (low B/E ratio):
HML = 1/2 (Small Value + Big Value) - 1/2 (Small Growth + Big Growth)
Rm-Rf, is the excess return on market and is constructed by subtracting respective
risk-free rates from market returns.
5.4.3 Financial Constraint (FC) Factor Construction:
To construct FC factor, I sort the stocks on the basis of Kaplan and Zingales (1997)
Index (KZ Index). I use KZ Index as an indicator of financial constraint because it is
widely used in the literature and it is also relatively more sophisticated than age, firm
size or dividend payout.
The sorted stocks are then divided at median into two portfolios of high and low KZ
scores. The FC factor is then calculated as the average return on the portfolio of firms

Essays on Financial Intermediation and Markets 143
with high KZ score (more constrained firms) minus average returns on the portfolio of
firms with low KZ score (less constrained).
5.4.3.1 KZ- Index Construction:
The KZ Index is constructed based on the results of Kaplan and Zingales (1997), by
using following linearization as proposed by Lamont et al. (2001):
KZ Index = -1.002×Cashflows/K+ 0.283×Q + 3.139×Leverage
- 39.368× Dividends/K - 1.315 × Cash/K Where;44
Cashflows = item 18, income before extraordinary items + item 14, depreciation and
amortization
Q = (item 6, total liabilities and stockholders’ equity + December market equity – item
60, total common equity – item 74, deferred taxes)/(item 6, total liabilities and
stockholders’ equity)
Leverage = (item 9, long-term debt + item 34, debt in current liabilities)/(item 9, long-
term debt + item 34, debt in current liabilities + item 216, stockholders’ equity)
Dividends = item 21, common dividends + item 19, preferred dividends
Cash = item 1, cash and short-term investments
K= item 8, net property, plant, and equipment
It may be noted that KZ-Index is based only on the US manufacturing firms from 1970
to 1984 that have a positive sales growth. However, I apply the same index to other
countries and other periods for all firms irrespective of the direction of their sales
44 These are the data definitions for USA and Canada from Compustat North America. For the corresponding data definitions for other countries from Compustat Global please see Appendix A-3

144 Financial Constraint and Stock Returns - Evidence from G-7 Countries
growth. In this chapter, the financial constraint index is used only to rank firms into two
broad portfolios of high or low financial constraint; therefore, it is reasonable to use
this index outside the US as well. Moreover, certain other measures, for example, the
Z-score developed by Altman (1968) using the US data bankruptcy from 1946 and
1965 and the O-Score developed by Ohlson (1980) using the US data from 1970-76 are
widely applied to other periods and other countries outside of the US.
5.4.4 Empirical Model:
The model used in this chapter is based on the established literature on factor pricing,
which begins with the work of Fama and French (1993). My empirical model adds a
Financial Constraint (FC) Factor to the standard Fama-French three-factor model. The
extended model is given as under:
Rpt - Rrft = β0 + βm (Rmt - Rrft ) + βs SMBt +Bh HMLt + Bf FCt + εt, (1)
Where;
Rpt = Return on the portfolio ‘p’ in month t
Rrft = Risk-free interest rate in month t
Rmt = Market Returns in month t
SMBt = Small minus Big Factor in month t as explained above
HMLt = High minus Low Factor in month t as explained above
FCt = More Constrained minus Less Constrained Factor in month t as explained
above
For every month for which the data is available, returns of each of the six portfolios, as
defined previously, are regressed against the four factors to see if these factors explain

Essays on Financial Intermediation and Markets 145
excess returns. For each country, regression (1) is applied once on the full sample, and
for robustness check once on each of the two equally sized sub-samples.
5.5 Empirical Results and Discussion
Results of the regression (1) applied on full set of data and sub-samples are presented
in Table 5.2 through 5.8. The first five columns of the tables report the results obtained
from six separate regressions – one on each of the six size-BE/ME portfolios. The next
ten columns report the regression results of the two equal-sized sub-samples.
Before analyzing the coefficient of the Financial Constraint factor which is the
parameter of prime interest in this study, I would first succinctly discuss other
regression coefficients.
5.5.1 Intercept and Excess Market Returns:
In these regressions, the intercept varies from negative to positive. It remains small and
insignificant in almost all regressions, both in full-period and in sub-periods, in all six
portfolios across the seven countries. This indicates that pricing errors are small. In
only 5 out of 126 regressions, intercept is significant at 5% or 10% levels.
The coefficient of excess market returns is predominantly positive and significant in
most of regressions across the six portfolios in all G-7 countries. This indicates that
generally the portfolio returns are sensitive to the variation in market returns.
Occasionally, this coefficient is indistinguishable from zero at 10% level in a few
portfolios in sub-periods; this is observed in only 6 out of 126 regressions.
5.5.2 Size Factor:
In most of the regressions across all countries, the factor loadings on size factor are
largely positive and significant in portfolios with small-sized stocks. One notable

146
Table 5.2
Regression Results - US
This table reports the regression results for the US data. The estimates and corresponding t-statistics are obtained from separate OLS regression of the returns of six size-value portfolio against a Constant, excess market returns, SMB factor, HML factor and KZ-Index based Financial Constraint (FC) factor. Column 1 through Column 5 presents the regression results obtained from the full sample. The regression results obtained from the two equal-sized sub-samples are reported in Column 6 through Column 15.
Rpt - Rrft = β0 + βm (Rmt - Rrft ) + βs SMBt +Bh HMLt + Bf FCt + εt,
*** significant at 1%, ** significant at 5%, * significant at 10%
Continued to next page…
Const Rm-Rf SMB HML FC Const Rm-Rf SMB HML FC Const Rm-Rf SMB HML FC
(1) (2) (3) (4) (5) (6) (7) (8) (9) (1) (11) (12) (13) (14) (15)
Coeff 0.005 0.641 0.789 -0.216 0.185 0.008 0.728 0.798 -0.162 0.840 0.007 0.773 0.831 -0.238 0.137
T-stat 0.560 6.370*** 1.884* -2.16*** 1.235 0.780 7.233*** 3.157*** -1.958** 0.516 1.170 7.964*** 1.130 -2.281** 1.396
Adj-R-sqr 0.609 0.634 0.659
Const Rm-Rf SMB HML FC Const Rm-Rf SMB HML FC Const Rm-Rf SMB HML FC
Coeff 0.007 0.536 0.973 0.053 0.174 0.001 0.628 0.868 0.033 0.249 0.000 0.750 1.220 0.092 0.145
T-stat 0.629 5.846*** 2.319** 1.020 1.130 0.930 8.540*** 2.212** 0.536 1.864* -0.510 7.173*** 3.110*** 1.709* 1.483
Adj-R-sqr 0.511 0.677 0.532
Const Rm-Rf SMB HML FC Const Rm-Rf SMB HML FC Const Rm-Rf SMB HML FC
Coeff 0.010 0.752 1.399 0.192 0.216 0.006 0.659 0.928 0.229 0.185 0.009 0.849 1.425 0.169 0.247
T-stat 0.871 7.820*** 4.310*** 2.019** 1.877* 0.456 7.214*** 3.852*** 2.187** 1.719* 0.925 9.464*** 4.220*** 1.870* 2.341**
Adj-R-sqr 0.560 0.583 0.788
USA
Portfolio: Small Size - Low BE/ME
Full Sample Sub-sample 1 Sub-sample 2
Portfolio: Small Size - Medium BE/ME
Full Sample Sub-sample 1 Sub-sample 2
Portfolio: Small Size - High BE/ME
Full Sample Sub-sample 1 Sub-sample 2
147
Table 5.2 : Regression Results - US (continued from previous page)
*** significant at 1%, ** significant at 5%, * significant at 10%
Const Rm-Rf SMB HML FC Const Rm-Rf SMB HML FC Const Rm-Rf SMB HML FC
(1) (2) (3) (4) (5) (6) (7) (8) (9) (1) (11) (12) (13) (14) (15)
Coeff 0.002 0.813 -0.246 -0.367 -0.110 0.001 0.692 0.139 -0.373 0.330 0.009 0.868 0.540 -0.383 -0.700
T-stat 0.424 9.490*** -0.222 -2.360** -0.860 0.180 6.847*** 0.884 -2.217** 0.179 1.670 7.960*** 0.375 -2.682*** -0.550
Adj-R-sqr 0.629 0.834 0.655
Const Rm-Rf SMB HML FC Const Rm-Rf SMB HML FC Const Rm-Rf SMB HML FC
Coeff -0.001 0.778 -0.110 0.037 0.253 0.000 0.719 0.465 -0.038 0.270 0.002 0.733 -0.134 0.081 0.235
T-stat -0.740 7.869*** -0.800 0.490 1.020 0.240 6.689*** 1.794* -0.430 1.030 0.298 6.679*** -1.217 1.743* 0.874
Adj-R-sqr 0.307 0.320 0.799
Const Rm-Rf SMB HML FC Const Rm-Rf SMB HML FC Const Rm-Rf SMB HML FC
Coeff -0.001 0.611 0.410 0.160 0.221 0.002 0.643 0.275 0.320 0.160 0.009 0.757 0.536 0.183 0.301
T-stat -0.169 5.440*** 1.131 3.846*** 1.783* 0.144 6.915*** 0.640 5.960*** 0.766 0.790 8.515*** 1.677* 2.483** 2.160**
Adj-R-sqr 0.589 0.614 0.719
No of Months 294 147 147
Sample Period Jul-82 - Dec-6 Jul-82 - Sep-94 Oct-94 - Dec-6
Portfolio: Big Size - Low BE/ME
Full Sample Sub-sample 1 Sub-sample 2
Portfolio: Big Size - Medium BE/ME
Full Sample Sub-sample 1 Sub-sample 2
Portfolio: Big Size - High BE/ME
Full Sample Sub-sample 1 Sub-sample 2
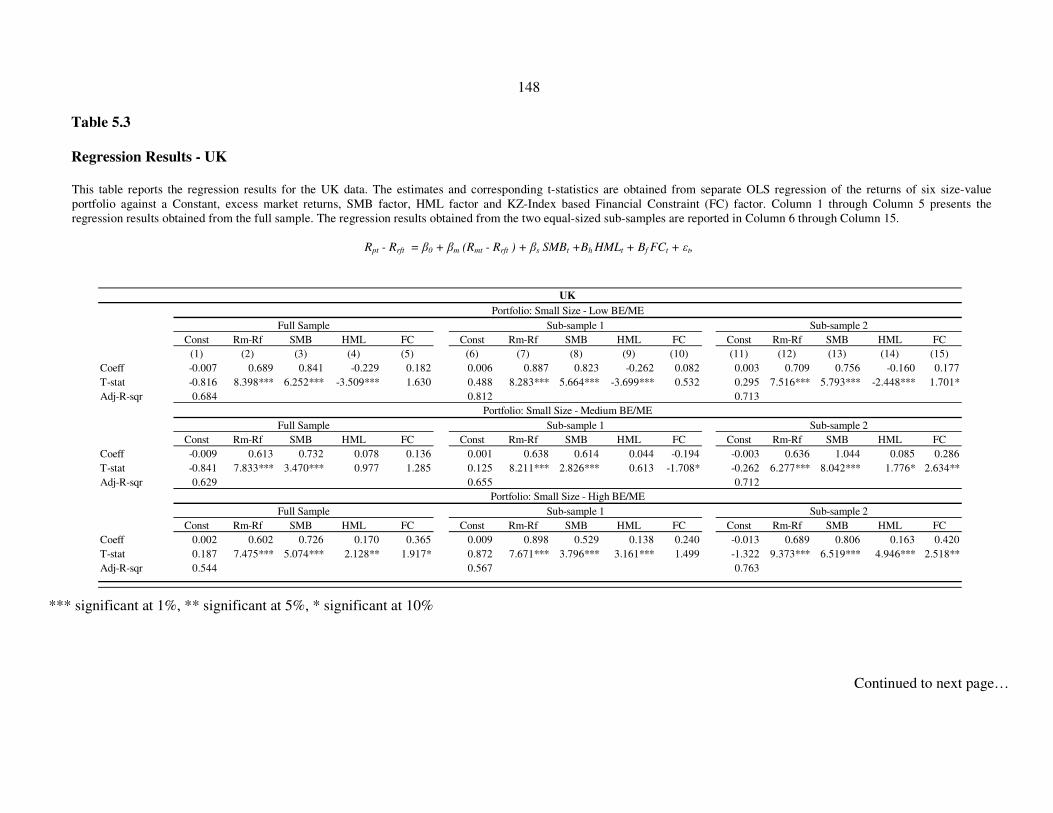
148
Table 5.3
Regression Results - UK
This table reports the regression results for the UK data. The estimates and corresponding t-statistics are obtained from separate OLS regression of the returns of six size-value portfolio against a Constant, excess market returns, SMB factor, HML factor and KZ-Index based Financial Constraint (FC) factor. Column 1 through Column 5 presents the regression results obtained from the full sample. The regression results obtained from the two equal-sized sub-samples are reported in Column 6 through Column 15.
Rpt - Rrft = β0 + βm (Rmt - Rrft ) + βs SMBt +Bh HMLt + Bf FCt + εt,
*** significant at 1%, ** significant at 5%, * significant at 10%
Continued to next page…
Const Rm-Rf SMB HML FC Const Rm-Rf SMB HML FC Const Rm-Rf SMB HML FC
(1) (2) (3) (4) (5) (6) (7) (8) (9) (10) (11) (12) (13) (14) (15)
Coeff -0.007 0.689 0.841 -0.229 0.182 0.006 0.887 0.823 -0.262 0.082 0.003 0.709 0.756 -0.160 0.177
T-stat -0.816 8.398*** 6.252*** -3.509*** 1.630 0.488 8.283*** 5.664*** -3.699*** 0.532 0.295 7.516*** 5.793*** -2.448*** 1.701*
Adj-R-sqr 0.684 0.812 0.713
Const Rm-Rf SMB HML FC Const Rm-Rf SMB HML FC Const Rm-Rf SMB HML FC
Coeff -0.009 0.613 0.732 0.078 0.136 0.001 0.638 0.614 0.044 -0.194 -0.003 0.636 1.044 0.085 0.286
T-stat -0.841 7.833*** 3.470*** 0.977 1.285 0.125 8.211*** 2.826*** 0.613 -1.708* -0.262 6.277*** 8.042*** 1.776* 2.634**
Adj-R-sqr 0.629 0.655 0.712
Const Rm-Rf SMB HML FC Const Rm-Rf SMB HML FC Const Rm-Rf SMB HML FC
Coeff 0.002 0.602 0.726 0.170 0.365 0.009 0.898 0.529 0.138 0.240 -0.013 0.689 0.806 0.163 0.420
T-stat 0.187 7.475*** 5.074*** 2.128** 1.917* 0.872 7.671*** 3.796*** 3.161*** 1.499 -1.322 9.373*** 6.519*** 4.946*** 2.518**
Adj-R-sqr 0.544 0.567 0.763
Portfolio: Small Size - High BE/ME
Full Sample Sub-sample 1 Sub-sample 2
Portfolio: Small Size - Medium BE/ME
Full Sample Sub-sample 1 Sub-sample 2
UK
Portfolio: Small Size - Low BE/ME
Full Sample Sub-sample 1 Sub-sample 2

149
Table 5.3 : Regression Results - the UK (continued from previous page)
*** significant at 1%, ** significant at 5%, * significant at 10%
Const Rm-Rf SMB HML FC Const Rm-Rf SMB HML FC Const Rm-Rf SMB HML FC
(1) (2) (3) (4) (5) (6) (7) (8) (9) (10) (11) (12) (13) (14) (15)
Coeff -0.008 0.845 -0.048 -0.368 -0.016 -0.004 0.591 -0.209 -0.232 0.034 -0.004 0.803 0.159 -0.191 -0.007
T-stat -1.715* 10.143*** -0.342 -4.886*** -0.147 -0.503 7.601*** -1.714* -2.953*** 0.250 -0.443 8.233*** 1.136 -2.287*** -0.048
Adj-R-sqr 0.552 0.668 0.575
Const Rm-Rf SMB HML FC Const Rm-Rf SMB HML FC Const Rm-Rf SMB HML FC
Coeff 0.000 0.670 -0.083 0.235 0.148 0.001 0.522 -0.071 0.108 0.231 0.001 0.653 0.185 -0.070 0.148
T-stat -0.005 7.512*** -0.987 1.920* 1.421 0.115 6.056*** -1.091 2.110** 1.867* 0.202 6.405*** -1.732* -1.125 0.532
Adj-R-sqr 0.661 0.787 0.689
Const Rm-Rf SMB HML FC Const Rm-Rf SMB HML FC Const Rm-Rf SMB HML FC
Coeff 0.002 0.541 0.056 0.154 0.015 0.010 0.565 0.140 0.118 0.074 0.004 0.673 -0.063 0.125 0.208
T-stat 0.542 4.224*** 0.311 1.941** 0.120 1.139 6.268*** 0.833 1.797* 0.458 0.397 7.731*** -0.614 1.886* 1.722*
Adj-R-sqr 0.420 0.653 0.438
No of Months 198 99 99
Sample Period Jul-90 - Dec-06 Jul-90 - Sep-98 Oct-98 - Dec-06
Portfolio: Big Size - Low BE/ME
Full Sample Sub-sample 1 Sub-sample 2
Portfolio: Big Size - Medium BE/ME
Full Sample Sub-sample 1 Sub-sample 2
Portfolio: Big Size - High BE/ME
Full Sample Sub-sample 1 Sub-sample 2
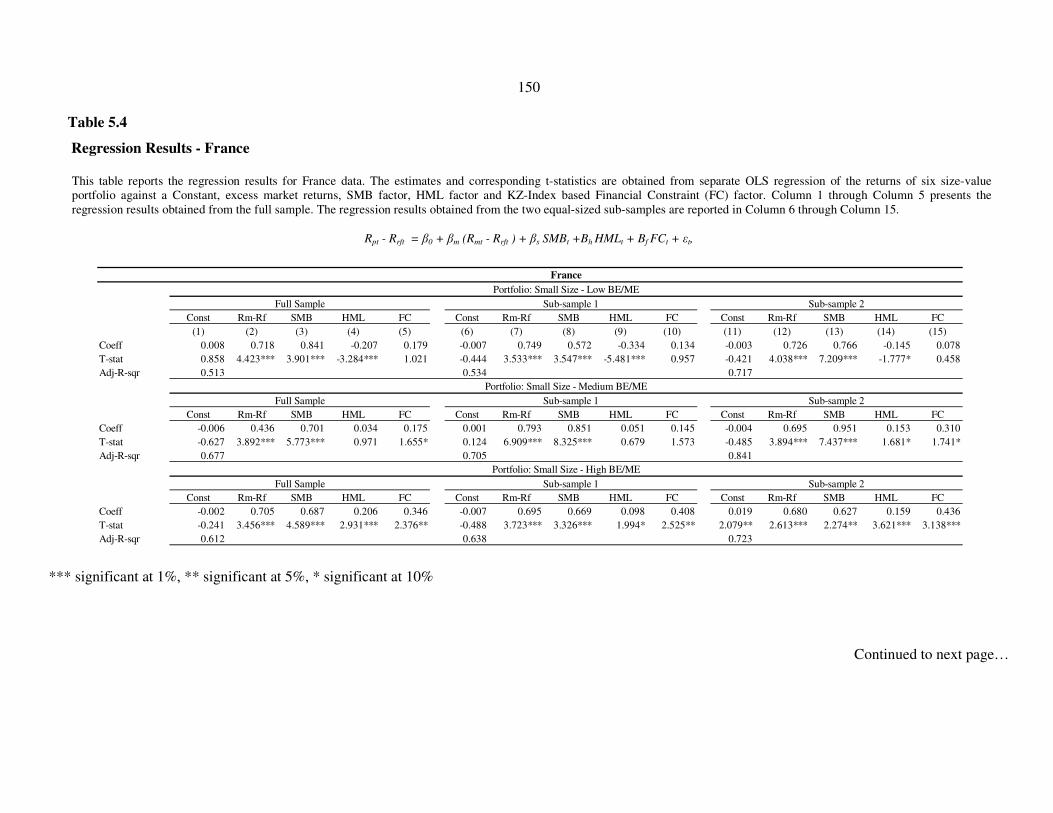
150
Table 5.4
Regression Results - France
This table reports the regression results for France data. The estimates and corresponding t-statistics are obtained from separate OLS regression of the returns of six size-value portfolio against a Constant, excess market returns, SMB factor, HML factor and KZ-Index based Financial Constraint (FC) factor. Column 1 through Column 5 presents the regression results obtained from the full sample. The regression results obtained from the two equal-sized sub-samples are reported in Column 6 through Column 15.
Rpt - Rrft = β0 + βm (Rmt - Rrft ) + βs SMBt +Bh HMLt + Bf FCt + εt,
*** significant at 1%, ** significant at 5%, * significant at 10%
Continued to next page…
Const Rm-Rf SMB HML FC Const Rm-Rf SMB HML FC Const Rm-Rf SMB HML FC
(1) (2) (3) (4) (5) (6) (7) (8) (9) (10) (11) (12) (13) (14) (15)
Coeff 0.008 0.718 0.841 -0.207 0.179 -0.007 0.749 0.572 -0.334 0.134 -0.003 0.726 0.766 -0.145 0.078
T-stat 0.858 4.423*** 3.901*** -3.284*** 1.021 -0.444 3.533*** 3.547*** -5.481*** 0.957 -0.421 4.038*** 7.209*** -1.777* 0.458
Adj-R-sqr 0.513 0.534 0.717
Const Rm-Rf SMB HML FC Const Rm-Rf SMB HML FC Const Rm-Rf SMB HML FC
Coeff -0.006 0.436 0.701 0.034 0.175 0.001 0.793 0.851 0.051 0.145 -0.004 0.695 0.951 0.153 0.310
T-stat -0.627 3.892*** 5.773*** 0.971 1.655* 0.124 6.909*** 8.325*** 0.679 1.573 -0.485 3.894*** 7.437*** 1.681* 1.741*
Adj-R-sqr 0.677 0.705 0.841
Const Rm-Rf SMB HML FC Const Rm-Rf SMB HML FC Const Rm-Rf SMB HML FC
Coeff -0.002 0.705 0.687 0.206 0.346 -0.007 0.695 0.669 0.098 0.408 0.019 0.680 0.627 0.159 0.436
T-stat -0.241 3.456*** 4.589*** 2.931*** 2.376** -0.488 3.723*** 3.326*** 1.994* 2.525** 2.079** 2.613*** 2.274** 3.621*** 3.138***
Adj-R-sqr 0.612 0.638 0.723
Full Sample Sub-sample 1 Sub-sample 2
Full Sample Sub-sample 1 Sub-sample 2
Portfolio: Small Size - High BE/ME
Full Sample Sub-sample 1 Sub-sample 2
Portfolio: Small Size - Medium BE/ME
France
Portfolio: Small Size - Low BE/ME

151
Table 5.4 : Regression Results - France (continued from previous page)
*** significant at 1%, ** significant at 5%, * significant at 10%
Const Rm-Rf SMB HML FC Const Rm-Rf SMB HML FC Const Rm-Rf SMB HML FC
Coeff -0.008 0.905 -0.051 -0.303 0.014 -0.003 0.486 0.104 -0.241 0.044 -0.004 0.926 0.070 -0.152 -0.201
T-stat -1.794* 3.523*** -0.308 -4.909*** 0.132 -0.302 2.009** 0.520 -8.147*** 0.577 -0.450 4.738*** 0.663 -3.571*** -1.697*
Adj-R-sqr 0.502 0.630 0.523
Const Rm-Rf SMB HML FC Const Rm-Rf SMB HML FC Const Rm-Rf SMB HML FC
Coeff 0.000 0.613 -0.098 -0.235 0.069 0.002 0.854 -0.205 -0.184 0.080 0.001 0.542 0.102 -0.348 0.063
T-stat -0.007 4.115*** -1.138 -2.218** 0.358 0.161 4.625*** -1.649* -1.764* 0.921 0.201 5.782*** 0.687 -3.942*** 0.773
Adj-R-sqr 0.546 0.569 0.773
Const Rm-Rf SMB HML FC Const Rm-Rf SMB HML FC Const Rm-Rf SMB HML FC
Coeff 0.003 0.755 0.066 0.157 0.195 0.014 0.790 0.090 0.143 0.311 0.005 0.684 -0.127 0.166 0.224
T-stat 0.928 4.391*** 0.513 2.956*** 1.693* 1.131 4.799*** 1.039 2.202** 2.323** 0.356 3.246*** -1.134 2.166** 1.762*
Adj-R-sqr 0.513 0.701 0.534
No of Months 198 99 99
Sample Period Jul-90 - Dec-06 Jul-90 - Sep-98 Oct-98 - Dec-06
Portfolio: Big Size - Low BE/ME
Full Sample Sub-sample 1 Sub-sample 2
Portfolio: Big Size - Medium BE/ME
Full Sample Sub-sample 1 Sub-sample 2
Full Sample Sub-sample 1 Sub-sample 2
Portfolio: Big Size - High BE/ME
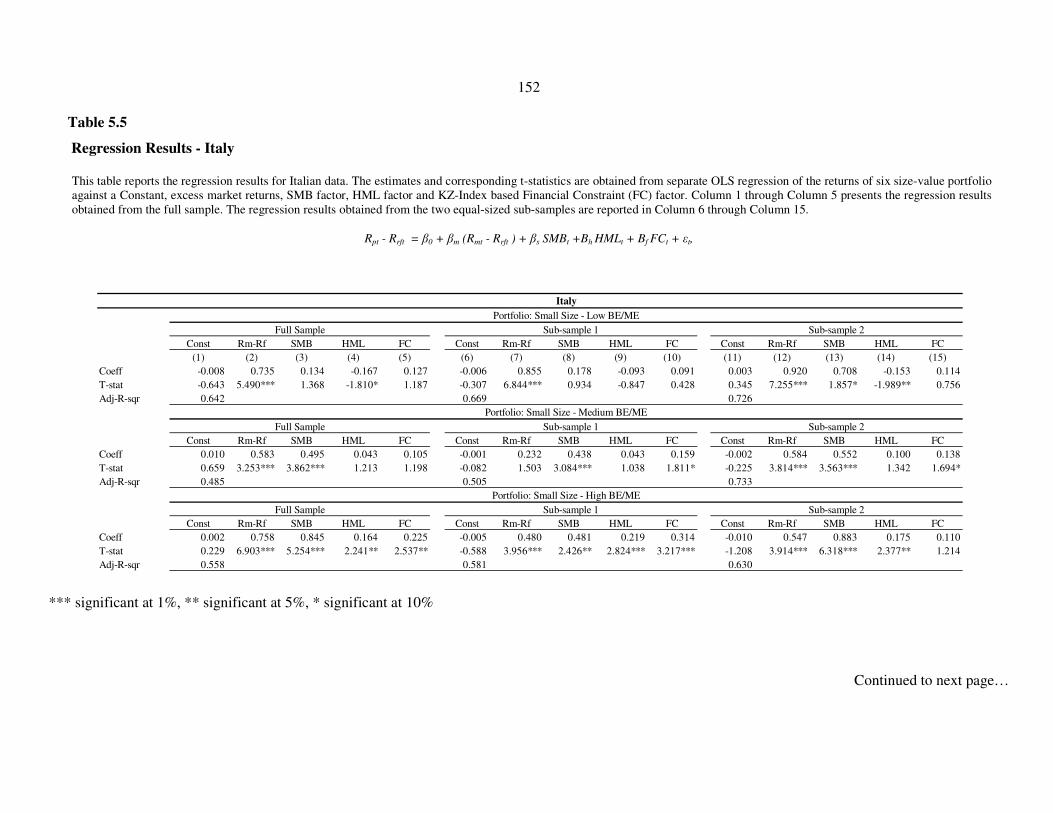
152
Table 5.5
Regression Results - Italy
This table reports the regression results for Italian data. The estimates and corresponding t-statistics are obtained from separate OLS regression of the returns of six size-value portfolio against a Constant, excess market returns, SMB factor, HML factor and KZ-Index based Financial Constraint (FC) factor. Column 1 through Column 5 presents the regression results obtained from the full sample. The regression results obtained from the two equal-sized sub-samples are reported in Column 6 through Column 15.
Rpt - Rrft = β0 + βm (Rmt - Rrft ) + βs SMBt +Bh HMLt + Bf FCt + εt,
*** significant at 1%, ** significant at 5%, * significant at 10%
Continued to next page…
Const Rm-Rf SMB HML FC Const Rm-Rf SMB HML FC Const Rm-Rf SMB HML FC
(1) (2) (3) (4) (5) (6) (7) (8) (9) (10) (11) (12) (13) (14) (15)
Coeff -0.008 0.735 0.134 -0.167 0.127 -0.006 0.855 0.178 -0.093 0.091 0.003 0.920 0.708 -0.153 0.114
T-stat -0.643 5.490*** 1.368 -1.810* 1.187 -0.307 6.844*** 0.934 -0.847 0.428 0.345 7.255*** 1.857* -1.989** 0.756
Adj-R-sqr 0.642 0.669 0.726
Const Rm-Rf SMB HML FC Const Rm-Rf SMB HML FC Const Rm-Rf SMB HML FC
Coeff 0.010 0.583 0.495 0.043 0.105 -0.001 0.232 0.438 0.043 0.159 -0.002 0.584 0.552 0.100 0.138
T-stat 0.659 3.253*** 3.862*** 1.213 1.198 -0.082 1.503 3.084*** 1.038 1.811* -0.225 3.814*** 3.563*** 1.342 1.694*
Adj-R-sqr 0.485 0.505 0.733
Const Rm-Rf SMB HML FC Const Rm-Rf SMB HML FC Const Rm-Rf SMB HML FC
Coeff 0.002 0.758 0.845 0.164 0.225 -0.005 0.480 0.481 0.219 0.314 -0.010 0.547 0.883 0.175 0.110
T-stat 0.229 6.903*** 5.254*** 2.241** 2.537** -0.588 3.956*** 2.426** 2.824*** 3.217*** -1.208 3.914*** 6.318*** 2.377** 1.214
Adj-R-sqr 0.558 0.581 0.630
Italy
Portfolio: Small Size - Low BE/ME
Full Sample Sub-sample 1 Sub-sample 2
Portfolio: Small Size - Medium BE/ME
Full Sample Sub-sample 1 Sub-sample 2
Portfolio: Small Size - High BE/ME
Full Sample Sub-sample 1 Sub-sample 2

153
Table 5.5 : Regression Results - Italy (continued from previous page)
*** significant at 1%, ** significant at 5%, * significant at 10%
Const Rm-Rf SMB HML FC Const Rm-Rf SMB HML FC Const Rm-Rf SMB HML FC
Coeff -0.007 0.730 -0.047 -0.198 -0.014 0.003 0.512 0.085 -0.251 -0.030 -0.003 0.682 0.217 -0.231 -0.007
T-stat -1.187 6.915*** -0.356 -2.936*** -0.128 0.319 7.733*** 0.346 -4.197*** -0.186 -0.638 4.547*** 1.902* -3.41*** -0.036
Adj-R-sqr 0.611 0.775 0.636
Const Rm-Rf SMB HML FC Const Rm-Rf SMB HML FC Const Rm-Rf SMB HML FC
Coeff 0.000 0.958 -0.181 0.045 0.146 0.001 0.550 0.061 0.100 0.107 0.001 0.442 -0.261 -0.169 0.249
T-stat 0.005 7.371*** -1.682* 0.520 1.399 0.139 3.636*** 0.854 1.296 1.131 0.123 3.997*** -2.085** -1.789* 2.064**
Adj-R-sqr 0.502 0.523 0.539
Const Rm-Rf SMB HML FC Const Rm-Rf SMB HML FC Const Rm-Rf SMB HML FC
Coeff 0.003 0.701 0.143 0.245 0.135 -0.008 0.473 -0.187 0.184 0.205 0.006 0.559 0.036 0.298 0.143
T-stat 0.956 4.950*** 0.957 2.527** 1.536 -1.230 2.833*** -1.933* 1.426 1.952** 0.364 3.058*** 0.184 3.021*** 1.114
Adj-R-sqr 0.535 0.836 0.557
No of Months 114 57 57
Sample Period Jul-97 - Dec-06 Jul-97-Mar-02 Apr-02 - Dec-06
Portfolio: Big Size - Low BE/ME
Full Sample Sub-sample 1 Sub-sample 2
Portfolio: Big Size - Medium BE/ME
Full Sample Sub-sample 1 Sub-sample 2
Full Sample Sub-sample 1 Sub-sample 2
Portfolio: Big Size - High BE/ME

154
Table 5.6
Regression Results - Germany
This table reports the regression results for German data. The estimates and corresponding t-statistics are obtained from separate OLS regression of the returns of six size-value portfolio against a Constant, excess market returns, SMB factor, HML factor and KZ-Index based Financial Constraint (FC) factor. Column 1 through Column 5 presents the regression results obtained from the full sample. The regression results obtained from the two equal-sized sub-samples are reported in Column 6 through Column 15.
Rpt - Rrft = β0 + βm (Rmt - Rrft ) + βs SMBt +Bh HMLt + Bf FCt + εt,
*** significant at 1%, ** significant at 5%, * significant at 10%
Continued to next page…
Const Rm-Rf SMB HML FC Const Rm-Rf SMB HML FC Const Rm-Rf SMB HML FC
(1) (2) (3) (4) (5) (6) (7) (8) (9) (10) (11) (12) (13) (14) (15)
Coeff 0.006 0.555 0.768 -0.147 -0.114 0.003 0.421 0.863 0.028 0.079 -0.004 0.426 0.617 -0.181 -0.173
T-stat 0.598 2.598** 3.324*** -1.737* -0.778 0.202 2.569** 2.802*** 0.684 0.505 -0.303 2.558** 2.296** -2.907*** -1.464
Adj-R-sqr 0.533 0.555 0.685
Const Rm-Rf SMB HML FC Const Rm-Rf SMB HML FC Const Rm-Rf SMB HML FC
Coeff -0.009 0.611 0.806 0.016 0.187 -0.002 0.763 0.722 0.038 0.122 0.001 0.348 -0.210 0.063 0.213
T-stat -0.814 4.534*** 3.077*** 0.409 1.120 -0.107 4.075*** 3.568*** 0.720 1.106 0.221 2.015** -1.421 1.552 1.876*
Adj-R-sqr 0.542 0.565 0.772
Const Rm-Rf SMB HML FC Const Rm-Rf SMB HML FC Const Rm-Rf SMB HML FC
Coeff 0.002 0.327 1.011 0.143 0.196 -0.005 0.525 -0.337 0.219 0.267 0.009 -0.184 0.791 0.258 0.214
T-stat 0.169 1.805* 1.633 1.788** 1.671* -0.530 2.114** -1.896* 2.053** 1.911 1.263 -1.309 3.304*** 2.188** 1.746*
Adj-R-sqr 0.605 0.681 0.630
Full Sample Sub-sample 1 Sub-sample 2
Full Sample Sub-sample 1 Sub-sample 2
Portfolio: Small Size - High BE/ME
Full Sample Sub-sample 1 Sub-sample 2
Portfolio: Small Size - Medium BE/ME
Germany
Portfolio: Small Size - Low BE/ME

155
Table 5.6 : Regression Results - Germany (continued from previous page)
*** significant at 1%, ** significant at 5%, * significant at 10%
Const Rm-Rf SMB HML FC Const Rm-Rf SMB HML FC Const Rm-Rf SMB HML FC
Coeff 0.007 0.775 -0.069 -0.186 -0.113 0.006 0.147 0.162 -0.264 0.006 -0.002 0.436 0.069 -0.131 -0.161
T-stat 1.438 4.323*** -0.282 -3.862*** -1.102 0.629 1.618 0.664 -4.367 0.027 -0.171 2.239** 0.913 -2.751*** -1.668*
Adj-R-sqr 0.409 0.609 0.426
Const Rm-Rf SMB HML FC Const Rm-Rf SMB HML FC Const Rm-Rf SMB HML FC
Coeff 0.000 0.502 -0.314 0.054 0.081 0.001 0.289 0.605 0.089 -0.071 -0.002 0.520 0.061 0.161 0.148
T-stat -0.008 2.441** -1.803* 0.721 0.634 0.112 1.602 -2.434** 1.220 -0.923 -0.577 5.948*** 0.741 1.453 1.312
Adj-R-sqr 0.637 0.871 0.664
Const Rm-Rf SMB HML FC Const Rm-Rf SMB HML FC Const Rm-Rf SMB HML FC
Coeff -0.004 0.831 0.066 0.099 0.167 0.016 0.894 0.110 0.152 0.210 0.007 0.998 0.112 0.147 0.018
T-stat -1.075 2.969*** 0.822 1.718* 1.991** 1.756* 3.918*** 0.740 1.827 2.633** 0.549 4.474*** 0.536 2.216** 0.120
Adj-R-sqr 0.514 0.598 0.535
No of Months 198 99 99
Sample Period Jul-90 - Dec-06 Jul-90 - Sep-98 Oct-98 - Dec-06
Full Sample Sub-sample 1 Sub-sample 2
Full Sample Sub-sample 1 Sub-sample 2
Portfolio: Big Size - High BE/ME
Full Sample Sub-sample 1 Sub-sample 2
Portfolio: Big Size - Medium BE/ME
Portfolio: Big Size - Low BE/ME

156
Table 5.7
Regression Results - Canada
This table reports the regression results for Canadian data. The estimates and corresponding t-statistics are obtained from separate OLS regression of the returns of six size-value portfolio against a Constant, excess market returns, SMB factor, HML factor and KZ-Index based Financial Constraint (FC) factor. Column 1 through Column 5 presents the regression results obtained from the full sample. The regression results obtained from the two equal-sized sub-samples are reported in Column 6 through Column 15.
Rpt - Rrft = β0 + βm (Rmt - Rrft ) + βs SMBt +Bh HMLt + Bf FCt + εt,
*** significant at 1%, ** significant at 5%, * significant at 10%
Continued to next page…
Const Rm-Rf SMB HML FC Const Rm-Rf SMB HML FC Const Rm-Rf SMB HML FC
(1) (2) (3) (4) (5) (6) (7) (8) (9) (10) (11) (12) (13) (14) (15)
Coeff 0.007 0.641 0.657 -0.269 0.073 -0.007 0.681 0.771 -0.378 -0.058 0.004 0.595 0.516 -0.304 0.067
T-stat 0.412 3.594*** 2.423** -1.832* 0.434 -0.934 3.542*** 6.620*** -2.278** -0.300 0.612 2.597** 5.727*** -2.031** 0.784
Adj-R-sqr 0.660 0.688 0.771
Const Rm-Rf SMB HML FC Const Rm-Rf SMB HML FC Const Rm-Rf SMB HML FC
Coeff 0.006 0.421 0.906 0.043 0.287 0.001 0.689 0.764 0.109 0.207 0.004 0.779 0.997 -0.080 0.178
T-stat 0.509 3.313*** 6.225*** 1.002 1.900* 0.085 4.787*** 5.884*** 1.447 1.871* 0.377 4.629*** 6.768*** -0.920 1.795*
Adj-R-sqr 0.561 0.584 0.732
Const Rm-Rf SMB HML FC Const Rm-Rf SMB HML FC Const Rm-Rf SMB HML FC
Coeff 0.002 0.433 0.577 0.299 0.173 0.004 0.377 0.770 0.301 0.294 -0.040 -0.230 0.329 0.266 0.124
T-stat 0.141 3.002*** 2.779*** 2.064** 1.577 0.244 4.064*** 2.627*** 1.901* 2.224** -1.716* 1.811* 2.092** 1.772* 1.325
Adj-R-sqr 0.605 0.717 0.630
Full Sample Sub-sample 1 Sub-sample 2
Full Sample Sub-sample 1 Sub-sample 2
Portfolio: Small Size - High BE/ME
Full Sample Sub-sample 1 Sub-sample 2
Portfolio: Small Size - Medium BE/ME
Canada
Portfolio: Small Size - Low BE/ME
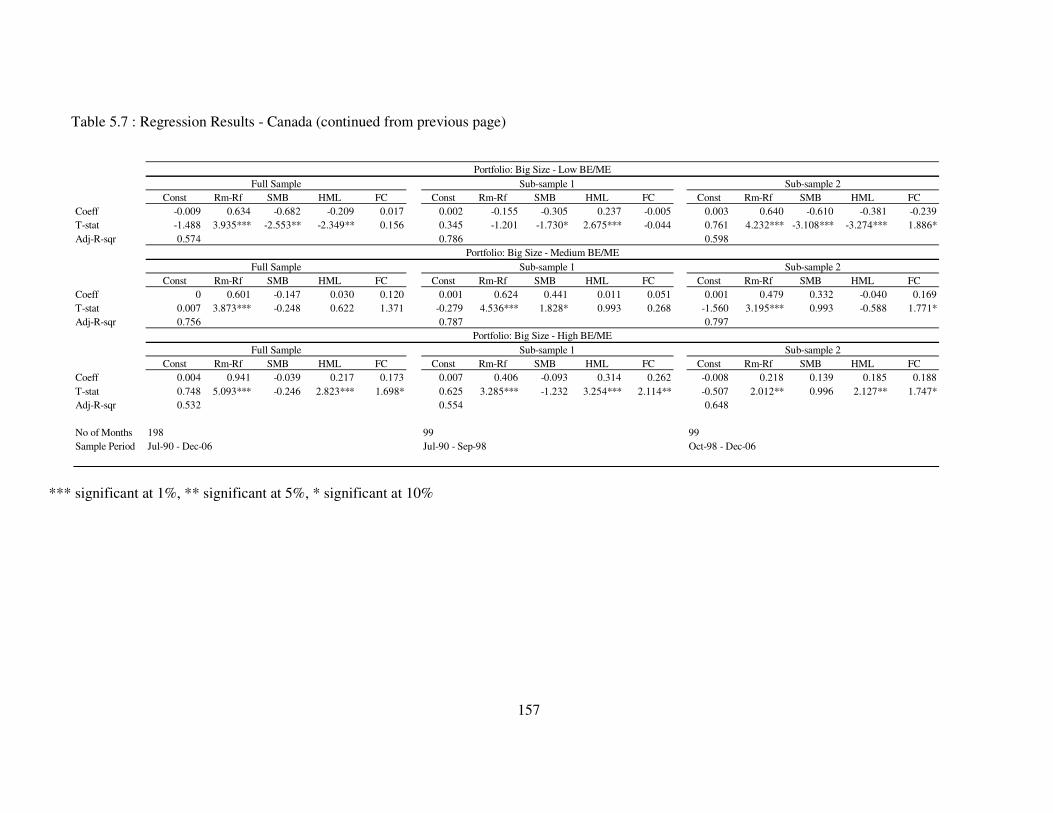
157
Table 5.7 : Regression Results - Canada (continued from previous page)
*** significant at 1%, ** significant at 5%, * significant at 10%
Const Rm-Rf SMB HML FC Const Rm-Rf SMB HML FC Const Rm-Rf SMB HML FC
Coeff -0.009 0.634 -0.682 -0.209 0.017 0.002 -0.155 -0.305 0.237 -0.005 0.003 0.640 -0.610 -0.381 -0.239
T-stat -1.488 3.935*** -2.553** -2.349** 0.156 0.345 -1.201 -1.730* 2.675*** -0.044 0.761 4.232*** -3.108*** -3.274*** 1.886*
Adj-R-sqr 0.574 0.786 0.598
Const Rm-Rf SMB HML FC Const Rm-Rf SMB HML FC Const Rm-Rf SMB HML FC
Coeff 0 0.601 -0.147 0.030 0.120 0.001 0.624 0.441 0.011 0.051 0.001 0.479 0.332 -0.040 0.169
T-stat 0.007 3.873*** -0.248 0.622 1.371 -0.279 4.536*** 1.828* 0.993 0.268 -1.560 3.195*** 0.993 -0.588 1.771*
Adj-R-sqr 0.756 0.787 0.797
Const Rm-Rf SMB HML FC Const Rm-Rf SMB HML FC Const Rm-Rf SMB HML FC
Coeff 0.004 0.941 -0.039 0.217 0.173 0.007 0.406 -0.093 0.314 0.262 -0.008 0.218 0.139 0.185 0.188
T-stat 0.748 5.093*** -0.246 2.823*** 1.698* 0.625 3.285*** -1.232 3.254*** 2.114** -0.507 2.012** 0.996 2.127** 1.747*
Adj-R-sqr 0.532 0.554 0.648
No of Months 198 99 99
Sample Period Jul-90 - Dec-06 Jul-90 - Sep-98 Oct-98 - Dec-06
Portfolio: Big Size - Low BE/ME
Full Sample Sub-sample 1 Sub-sample 2
Portfolio: Big Size - Medium BE/ME
Full Sample Sub-sample 1 Sub-sample 2
Full Sample Sub-sample 1 Sub-sample 2
Portfolio: Big Size - High BE/ME

158
Table 5.8
Regression Results - Japan
This table reports the regression results for Japanese data. The estimates and corresponding t-statistics are obtained from separate OLS regression of the returns of six size-value portfolio against a Constant, excess market returns, SMB factor, HML factor and KZ-Index based Financial Constraint (FC) factor. Column 1 through Column 5 presents the regression results obtained from the full sample. The regression results obtained from the two equal-sized sub-samples are reported in Column 6 through Column 15.
Rpt - Rrft = β0 + βm (Rmt - Rrft ) + βs SMBt +Bh HMLt + Bf FCt + εt,
*** significant at 1%, ** significant at 5%, * significant at 10%
Continued to next page…
Const Rm-Rf SMB HML FC Const Rm-Rf SMB HML FC Const Rm-Rf SMB HML FC
(1) (2) (3) (4) (5) (6) (7) (8) (9) (10) (11) (12) (13) (14) (15)
Coeff -0.005 0.622 0.375 -0.322 0.080 0.001 0.508 0.550 -0.211 -0.182 -0.004 0.546 0.421 -0.099 0.105
T-stat -0.392 3.072*** 2.836*** -2.258*** 0.686 0.057 3.240*** 3.331*** -1.819* -1.922* -0.813 2.922*** 2.881*** -1.504 1.332
Adj-R-sqr 0.500 0.635 0.521
Const Rm-Rf SMB HML FC Const Rm-Rf SMB HML FC Const Rm-Rf SMB HML FC
Coeff -0.003 0.810 0.547 0.071 0.107 -0.003 0.604 0.533 0.041 0.131 0.003 0.430 0.412 0.066 0.167
T-stat -0.249 4.103*** 3.228*** 0.963 1.104 -0.439 3.216*** 2.819*** 1.032 1.763* 0.376 3.768*** 2.220** 1.370 1.901*
Adj-R-sqr 0.603 0.628 0.763
Const Rm-Rf SMB HML FC Const Rm-Rf SMB HML FC Const Rm-Rf SMB HML FC
Coeff -0.006 0.758 0.426 0.319 0.192 -0.003 0.382 0.362 0.091 0.201 -0.003 0.584 0.275 0.103 0.138
T-stat -0.824 3.398*** 3.903*** 2.837*** 1.761* -0.412 2.910*** 4.398*** 1.189 2.483** -0.461 3.307*** 2.367** 2.243** 1.412
Adj-R-sqr 0.516 0.754 0.537
Portfolio: Small Size - High BE/ME
Full Sample Sub-sample 1 Sub-sample 2
Full Sample Sub-sample 1 Sub-sample 2
Portfolio: Small Size - Medium BE/ME
Full Sample Sub-sample 1 Sub-sample 2
Japan
Portfolio: Small Size - Low BE/ME

159
Table 5.8 : Regression Results - Japan (continued from previous page)
*** significant at 1%, ** significant at 5%, * significant at 10%
Const Rm-Rf SMB HML FC Const Rm-Rf SMB HML FC Const Rm-Rf SMB HML FC
Coeff -0.002 0.445 0.040 -0.166 -0.090 -0.003 0.416 0.154 -0.214 -0.131 0.000 0.446 0.120 -0.141 -0.005
T-stat -0.386 3.557*** 0.317 -2.254** -0.972 -0.539 3.007*** 1.488 -2.843** -1.161 -0.074 3.628*** 1.083 -2.124** -0.039
Adj-R-sqr 0.780 ..637 0.812
Const Rm-Rf SMB HML FC Const Rm-Rf SMB HML FC Const Rm-Rf SMB HML FC
Coeff -0.004 0.433 0.065 -0.153 0.169 0.004 0.560 -0.038 -0.137 0.148 -0.004 0.432 0.043 -0.128 0.115
T-stat -0.389 2.304** 0.717 -1.834* 1.830* 0.613 2.672*** -0.485 -1.822* 1.689* -1.072 2.449** 0.367 -1.713* 1.187
Adj-R-sqr 0.571 0.595 0.702
Const Rm-Rf SMB HML FC Const Rm-Rf SMB HML FC Const Rm-Rf SMB HML FC
Coeff -0.004 0.159 0.182 0.214 0.206 0.003 0.048 0.205 0.215 0.240 -0.003 0.523 0.164 0.098 0.165
T-stat -0.923 1.752* -1.711* 2.253** 1.986* 0.416 0.831 -2.194** 2.494** 2.375** -0.388 2.282** -1.816* 1.337 1.785*
Adj-R-sqr 0.636 0.699 0.662
No of Months 126 63 63
Sample Period Jul-96 - Dec-06 Jul-96- Sep-01 Oct-01 - Dec-06
Portfolio: Big Size - Medium BE/ME
Full Sample Sub-sample 1 Sub-sample 2
Sub-sample 2
Portfolio: Big Size - High BE/ME
Full Sample Sub-sample 1
Full Sample Sub-sample 1 Sub-sample 2
Portfolio: Big Size - Low BE/ME

160 Financial Constraint and Stock Returns - Evidence from G-7 Countries
exception is Germany where in Small-High portfolio the coefficient on SMB factor is
negative and marginally significant at 10% in sub-sample period of Jul-90 to Sep-98. In
4 out of total 63 regressions, this coefficient is insignificant thought positive in the
portfolios comprising small stocks. Therefore, I document a significant small size
effect.
The coefficient on size factor in portfolios with big stocks ranges from positive to
negative. Mostly, it is either insignificantly different from zero at 10% or negative and
significant.
5.5.1 Book-to-Market Equity Factor:
The slopes of HML factor are mainly negative and significant in growth portfolios
(Low BE/ME). This negative loading is almost universal in growth portfolios with only
three exceptions in sub-samples, where the coefficients were indistinguishable from
zero at 10% significance level. On the other hand, in the value firms (high BE/ME), the
coefficients of HML factor are predominantly positive and significant. In three sub-s
samples, the coefficients of HML are not significant at 10% level though they are still
positive
The regression coefficient on HML factor for the medium BE/ME portfolios ranges
from positive to negative. In most of the regressions, these coefficients are not
significantly different from zero at 10% level. There are, however, some instances
where these coefficients are significant. Particularly, in France, the loadings on HML
factor are negative and significant in the full period and both sub-periods in Small-
Medium portfolio.
Almost universally, the coefficient on HML increases monotonically from Low to
High Book-to-Market equity portfolios.

Essays on Financial Intermediation and Markets 161
5.5.2 Financial Constraint Factor:
The coefficient of prime interest, that is, the coefficient of the Financial Constraint
factor shows mixed results. Generally, it is positive and significant for portfolios at the
intersection of Small-High. This significance exists across all countries except Canada,
where the coefficient is positive but indistinguishably different from zero in the full-
period. Moreover, the positive and significant slope persists in most of the sub-periods
as well.
In five countries other than the UK and Italy, the slope of FC factor is positive and
significant for portfolios at the intersection of Big-High as well. However, in these
portfolios, slope of FC factor is not significant at 10% in five of the seven countries in
either of the two sub-periods.
Moreover, for Small-Medium portfolios the coefficient of FC factor is positive and
significant in at the least one of the two sub-periods in all countries included in this
study. This significance, however, is never at 1% level.
For the Big-Medium portfolios FC is positive and significant at 5 % or 10% levels in
one of the two sub-periods in the UK, Italy, Canada and Japan, and indistinguishable
from zero in the other countries.
In Small-Low portfolios, the coefficient of FC factor varies from positive to negative
but it almost universally insignificant from zero at 10% level. In one sub-period, this
slope is negative and marginally significant at 10% in Japan and positive and
significant at 10% in the UK.
In Big-Low portfolios as well, the coefficient of FC factor is predominantly
indistinguishable from zero at 10% level. In one sub-period, this slope is negative and

162 Financial Constraint and Stock Returns - Evidence from G-7 Countries
marginally significant at 10% in France and Germany, and positive and significant at
10% for Canada.
In general, the coefficient of FC factor is significant in the portfolios comprising either
the Small Firms or Value firms. It is most significant in the portfolios at the intersection
of Small-Value firms. A plausible reason for this could be that, generally smaller firms
are considered to be riskier than bigger firms and they have more difficulty in accessing
external finance; similarly on average Value firms have higher perceived risk than the
Growth firms. The portfolio at the intersection of Small-Value portfolio thus, represents
most risky firms. This suggests that financial constraint factor is more important among
the firms that have higher perceived risks in other aspects as well.
Although the Value firms are considered to be more risky than growth firms, yet the
reason for Value firms to have positive and significant loading on the financial
constraint factor is not vividly clear. Apparently, Value Firms (High BE/ME) firms
have more collateral to offer to the financial institutions to secure loans, therefore, a
priori these firms are expected to have lower coefficients on financial constraint factor.
A possible explanation could be that although, such firms may have better collateral to
offer to the financial institutions but these firms have some comparative disadvantage
in raising resources from the equity market, as the market is willing to pay lesser price
per unit of book value. I leave this issue for further investigation and conclude that
Financial Constraint factor is priced for firms or portfolios of firms with certain
characteristics.
Regression results for the FC factor for the US are consistent with the findings of Li
(2011), and Whited and Wu (2006) but do not conform to the findings of Lamont et al
(2001) who find a negative excess returns for the financial constraint factor.

Essays on Financial Intermediation and Markets 163
5.5.3 Financial Constraint Factor and Economic Growth:
The full-period and sub-period averages of GDP growth rates in G-7 countries for the
period under review are given in Table 5-B.8. All G-7 countries are categorized as
‘High Income’ countries by the World Bank. However, these countries experienced
different levels of GDP growth rate during the study period. The cross-country
differences in the GDP growth rates do not appear to have any noticeable bearing on
the coefficient of FC factor.
In sub-periods within a country, there is some evidence of a relationship between GDP
growth rate and coefficient of FC factor. In most of the sub-periods a higher average
GDP growth rate coincides with bigger and more significant coefficient of FC factor,
and lower GDP growth rate coincides with smaller and less significant coefficient of
FC factor. However, this relationship between GDP growth rate and FC factor is not
universal. Notably, in Canada and Japan the direction of this relationship is reverse.
This implies that financial constraint factor or conversely access to finance is more
important during periods of higher growth. This interpretation makes economic sense
because, it is the expansionary phase of economic cycles when firms are more in need
of resources to finance their investment plans. In such times the firms with poorer
ability to get hold of internal or external financial resources are more at a comparative
disadvantage than in subdued periods. Therefore, the investors require a premium to
invest in such firms, during the periods of relatively higher economic growth. These
findings must be interpreted with caution, because these are mostly qualitative and are
based on the set of data that is very small for this nature of study.

164 Financial Constraint and Stock Returns - Evidence from G-7 Countries
5.5.4 Financial Constraint Factor and Banking Sector Development:
The banking sector of G-7 countries is fairly developed. In the latest composite
banking sector development rankings published by the World Bank, all G-7 countries
other than Italy are ranked among the top eleven. A widely used indicator of banking
sector development is Banking Sector Deposits/GDP. The graph of this measure is
plotted in figure 5-A.8 (Appendix 5-A). This graph shows that this ratio is the highest
for Japan and the lowest for Italy. Moreover, there is a general upward trend in this
indicator across all countries.
From the study of this data, I do not find any conclusive evidence of a relationship
between the degree of the development of banking sector and the size or significance of
FC factor.
5.5.5 Financial Constraint Factor and Equity Market Development:
Mostly, stock markets of G-7 countries are also well developed. In the latest composite
equity market development rankings published by the World Bank, five of the G-7
countries, other than Italy and Germany, are among the top ten. A widely used indicator
of equity market development is Stock Market Capitalization/GDP. The graph of this
measure is plotted in figure 5-A.9 (Appendix 5-A). This graph shows that this ratio is
the highest for the UK and the lowest for Italy. The graph also reveals a fairly high
degree of co-movement in this ratio for the G-7 countries. However, I do not observe
any conclusive evidence of a relationship between the degree of development of equity
markets and size or significance of FC factor.

Essays on Financial Intermediation and Markets 165
5.6 Conclusions
The main goal of this chapter is to establish if, in the stock markets of G-7 countries,
Financial Constraint factor explains cross-section of expected stock returns in addition
to the standard Fama-French factors. The results show that Financial Constraint factor
is priced for firms with certain characteristics. This factor is significantly positive for
portfolios with smaller firms or value firms. The Financial Constraint factor is
especially significant for the portfolios at the intersection of Small-Value firms. The
significance of Financial Constraint factor persists across all G-7 countries and in the
sub-periods as well. This factor does not replace any of the three standard Fama-French
factors as they remain significant when Financial Constraint factor is introduced.
Cross-country differences in GDP growth rates, banking sector development and
equity market development do not appear to have any noticeable effect on the size or
significance of the coefficient of FC factor. However, in sub-periods within a country,
there is some evidence of a relationship between GDP growth rate and coefficient of
FC factor. In most of the sub-periods higher average GDP growth rate coincides with
bigger and more significant coefficient of FC factor.
The findings of this study of observing positive excess returns on Financial Constraint
factor and significant coefficients in some portfolios is in line with Whited and
Wu(2006) and Li (2011). These results contradict Lamont et al (2001) who observe
negative returns for the FC factor. The different results may be attributed to different
sample periods, application of the KZ Index or different cut-off levels to construct FC
factor
Moreover, the results further confirm the presence of a size and value effect in the G-7
countries. Further, I document that in all G-7 markets (a) the intercept of regression is

166 Financial Constraint and Stock Returns - Evidence from G-7 Countries
not significantly different from zero in most of the regressions, (b) coefficient of excess
market returns is mostly significant and positive (c) the SMB factor has a positive
loading in portfolios comprising Small Firms, (d) portfolios with Big firms have
generally negative or insignificant loadings on SMB factor (e) Growth firms have
negative loading on HML factor and (f) Value firms have positive loading on HML
factor.
In a nutshell, the results lend support to a broader asset pricing model including
Financial Constraint factor along with the standard Fama-French factors. The findings
of this study largely prevail in the full sample and both sub-samples. These findings
have important implications for asset pricing. Those investors who are willing to take
additional risks to earn higher returns may take positions in the more financially
constrained firms. These findings have implications for the evaluation of the risk-
adjusted performance of portfolios as well. I argue that the performance of portfolios
should be evaluated using a multifactor model that includes a Financial Constraint
factor along with the standard Fama-French factors.
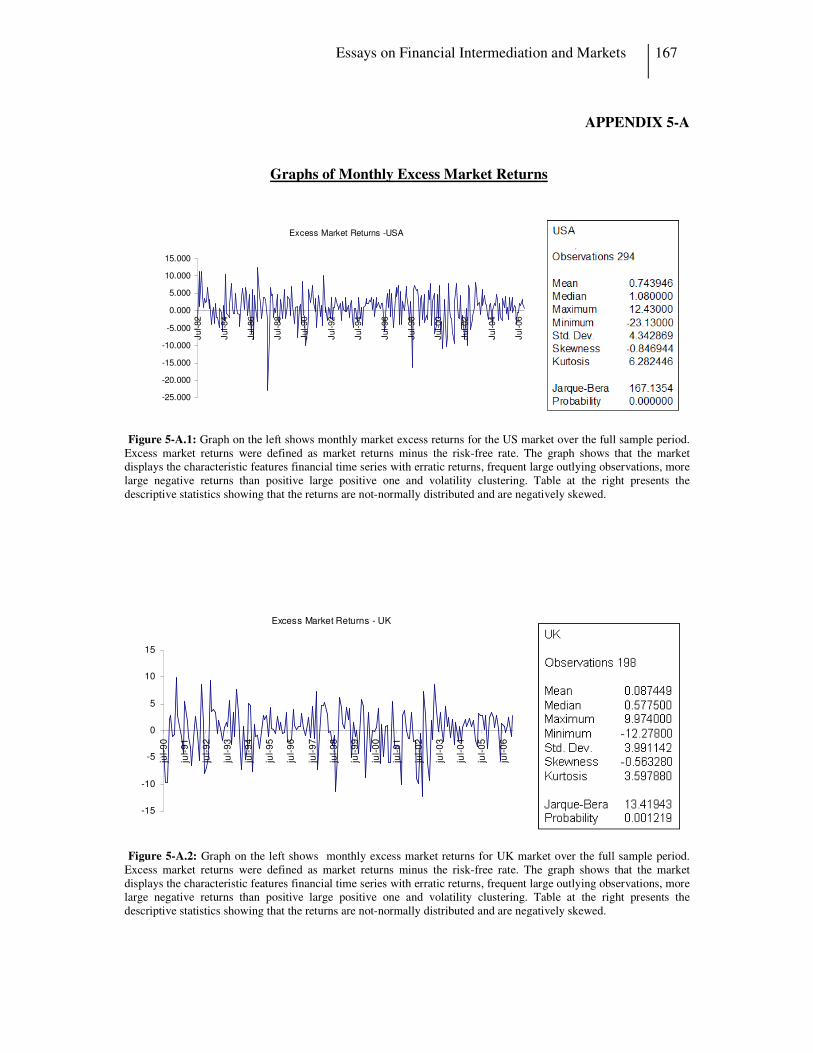
Essays on Financial Intermediation and Markets 167
APPENDIX 5-A
Graphs of Monthly Excess Market Returns
Figure 5-A.1: Graph on the left shows monthly market excess returns for the US market over the full sample period. Excess market returns were defined as market returns minus the risk-free rate. The graph shows that the market displays the characteristic features financial time series with erratic returns, frequent large outlying observations, more large negative returns than positive large positive one and volatility clustering. Table at the right presents the descriptive statistics showing that the returns are not-normally distributed and are negatively skewed.
Figure 5-A.2: Graph on the left shows monthly excess market returns for UK market over the full sample period. Excess market returns were defined as market returns minus the risk-free rate. The graph shows that the market displays the characteristic features financial time series with erratic returns, frequent large outlying observations, more large negative returns than positive large positive one and volatility clustering. Table at the right presents the descriptive statistics showing that the returns are not-normally distributed and are negatively skewed.
Excess Market Returns -USA
-25.000
-20.000
-15.000
-10.000
-5.000
0.000
5.000
10.000
15.000
Jul-82
Jul-84
Jul-86
Jul-88
Jul-90
Jul-92
Jul-94
Jul-96
Jul-98
Jul-00
Jul-02
Jul-04
Jul-06
Excess Market Returns - UK
-15
-10
-5
0
5
10
15
jul-
90
jul-
91
jul-
92
jul-
93
jul-
94
jul-
95
jul-
96
jul-
97
jul-
98
jul-
99
jul-
00
jul-
01
jul-
02
jul-
03
jul-
04
jul-
05
jul-
06
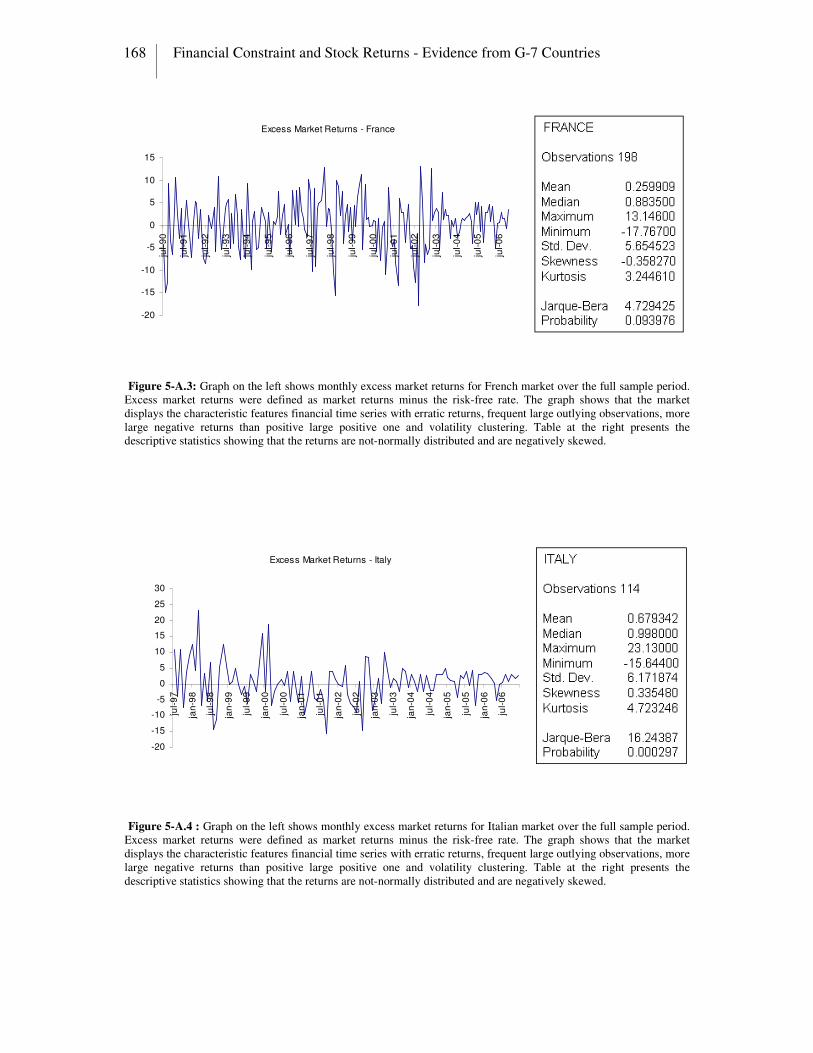
168 Financial Constraint and Stock Returns - Evidence from G-7 Countries
Figure 5-A.3: Graph on the left shows monthly excess market returns for French market over the full sample period. Excess market returns were defined as market returns minus the risk-free rate. The graph shows that the market displays the characteristic features financial time series with erratic returns, frequent large outlying observations, more large negative returns than positive large positive one and volatility clustering. Table at the right presents the descriptive statistics showing that the returns are not-normally distributed and are negatively skewed.
Figure 5-A.4 : Graph on the left shows monthly excess market returns for Italian market over the full sample period. Excess market returns were defined as market returns minus the risk-free rate. The graph shows that the market displays the characteristic features financial time series with erratic returns, frequent large outlying observations, more large negative returns than positive large positive one and volatility clustering. Table at the right presents the descriptive statistics showing that the returns are not-normally distributed and are negatively skewed.
Excess Market Returns - France
-20
-15
-10
-5
0
5
10
15ju
l-9
0
jul-
91
jul-
92
jul-
93
jul-
94
jul-
95
jul-
96
jul-
97
jul-
98
jul-
99
jul-
00
jul-
01
jul-
02
jul-
03
jul-
04
jul-
05
jul-
06
Excess Market Returns - Italy
-20
-15
-10
-5
0
5
10
15
20
25
30
jul-
97
jan
-98
jul-
98
jan
-99
jul-
99
jan
-00
jul-
00
jan
-01
jul-
01
jan
-02
jul-
02
jan
-03
jul-
03
jan
-04
jul-
04
jan
-05
jul-
05
jan
-06
jul-
06

Essays on Financial Intermediation and Markets 169
Figure 5-A.5: Graph on the left shows monthly excess market returns for German market over the full sample period. Excess market returns were defined as market returns minus the risk-free rate. The graph shows that the market displays the characteristic features financial time series with erratic returns, frequent large outlying observations, more large negative returns than positive large positive one and volatility clustering. Table at the right presents the descriptive statistics showing that the returns are not-normally distributed and are negatively skewed.
Figure 5-A.6: Graph on the left shows monthly excess market returns for Canadian market over the full sample period. Excess market returns were defined as market returns minus the risk-free rate. The graph shows that the market displays the characteristic features financial time series with erratic returns, frequent large outlying observations, more large negative returns than positive large positive one and volatility clustering. Table at the right presents the descriptive statistics showing that the returns are not-normally distributed and are negatively skewed.
Excess Market Returns - Germany
-30
-20
-10
0
10
20
30ju
l-90
jul-91
jul-92
jul-93
jul-94
jul-95
jul-96
jul-97
jul-98
jul-99
jul-00
jul-01
jul-02
jul-03
jul-04
jul-05
jul-06
Excess Market Returns -Canada
-25
-20
-15
-10
-5
0
5
10
15
jul-
90
jul-
91
jul-
92
jul-
93
jul-
94
jul-
95
jul-
96
jul-
97
jul-
98
jul-
99
jul-
00
jul-
01
jul-
02
jul-
03
jul-
04
jul-
05
jul-
06
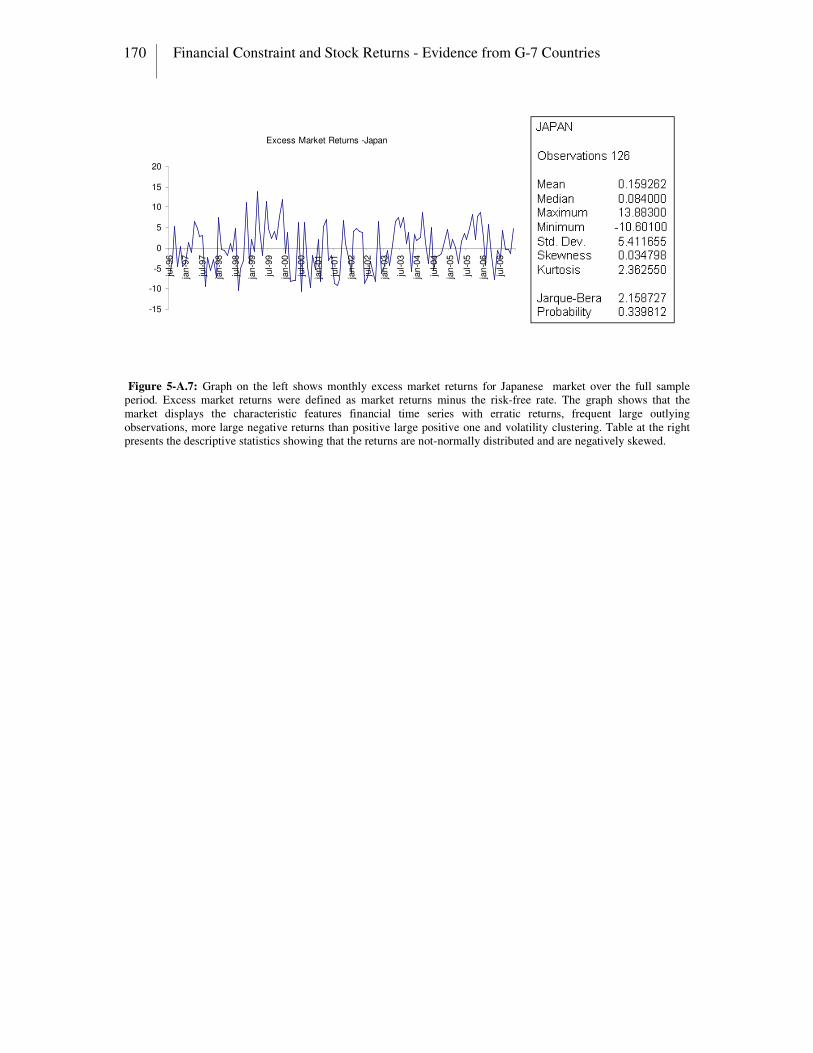
170 Financial Constraint and Stock Returns - Evidence from G-7 Countries
Figure 5-A.7: Graph on the left shows monthly excess market returns for Japanese market over the full sample period. Excess market returns were defined as market returns minus the risk-free rate. The graph shows that the market displays the characteristic features financial time series with erratic returns, frequent large outlying observations, more large negative returns than positive large positive one and volatility clustering. Table at the right presents the descriptive statistics showing that the returns are not-normally distributed and are negatively skewed.
Excess Market Returns -Japan
-15
-10
-5
0
5
10
15
20ju
l-96
jan-9
7
jul-97
jan-9
8
jul-98
jan-9
9
jul-99
jan-0
0
jul-00
jan-0
1
jul-01
jan-0
2
jul-02
jan-0
3
jul-03
jan-0
4
jul-04
jan-0
5
jul-05
jan-0
6
jul-06
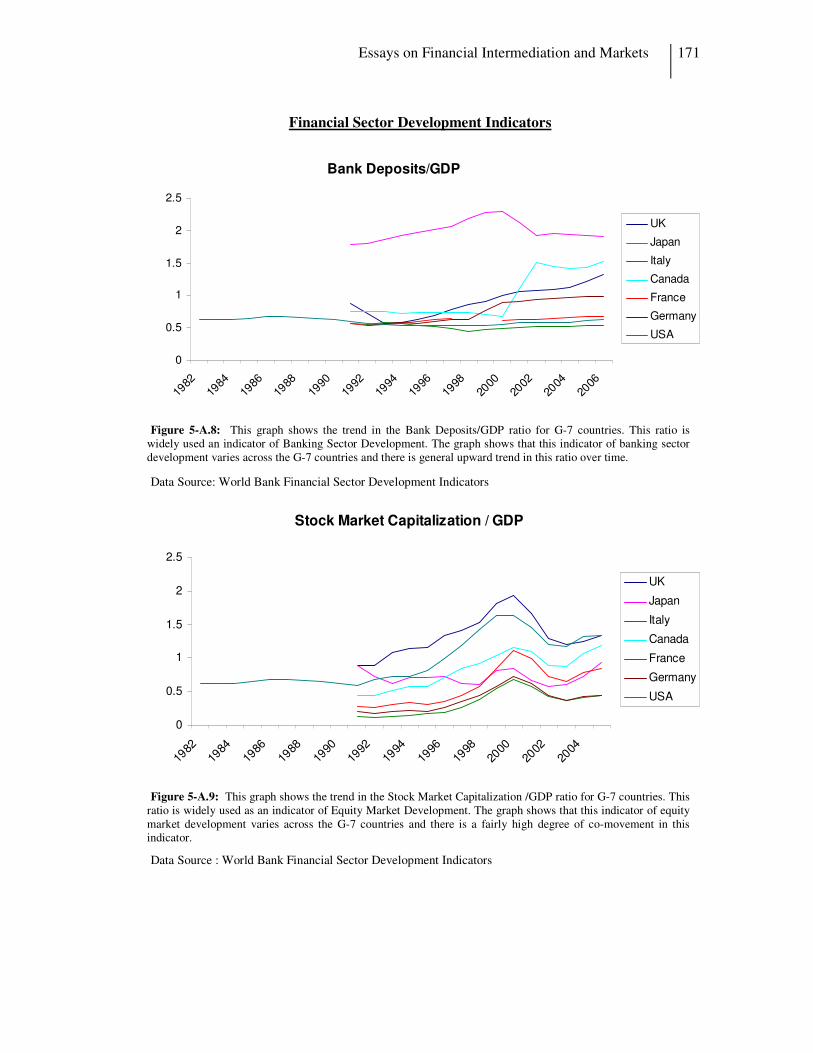
Essays on Financial Intermediation and Markets 171
Financial Sector Development Indicators
Figure 5-A.8: This graph shows the trend in the Bank Deposits/GDP ratio for G-7 countries. This ratio is widely used an indicator of Banking Sector Development. The graph shows that this indicator of banking sector development varies across the G-7 countries and there is general upward trend in this ratio over time.
Data Source: World Bank Financial Sector Development Indicators
Figure 5-A.9: This graph shows the trend in the Stock Market Capitalization /GDP ratio for G-7 countries. This ratio is widely used as an indicator of Equity Market Development. The graph shows that this indicator of equity market development varies across the G-7 countries and there is a fairly high degree of co-movement in this indicator.
Data Source : World Bank Financial Sector Development Indicators
Bank Deposits/GDP
0
0.5
1
1.5
2
2.5
1982
1984
1986
1988
1990
1992
1994
1996
1998
2000
2002
2004
2006
UK
Japan
Italy
Canada
France
Germany
USA
Stock Market Capitalization / GDP
0
0.5
1
1.5
2
2.5
1982
1984
1986
1988
1990
1992
1994
1996
1998
2000
2002
2004
UK
Japan
Italy
Canada
France
Germany
USA

172 Financial Constraint and Stock Returns - Evidence from G-7 Countries
APPENDIX B
Correlation Matrices
Table 5-B.1
Correlation Matrix - US
This table shows the cross correlations between the four factors which were used as the explanatory variables. Left panel of the table shows the coefficient of correlations for the full sample period. The respective t-statistics are mentioned in the right panel of the table
Table 5-B.2
Correlation Matrix - UK
This table shows the cross correlations between the four factors which were used as the explanatory variables. Left panel of the table shows the coefficient of correlations for the full sample period. The respective t-statistics are mentioned in the right panel of the table
Table 5-B.3
Correlation Matrix - France
This table shows the cross correlations between the four factors which were used as the explanatory variables. Left panel of the table shows the coefficient of correlations for the full sample period. The respective t-statistics are mentioned in the right panel of the table
Rm-Rf SMB HML FC Rm-Rf SMB HML FC
Rm-Rf 1 -
SMB 0.198 1 3.452*** -
HML -0.497 -0.434 1 -9.790*** -8.230*** -
FC 0.184 0.115 -0.066 1 3.204*** 1.978** -1.125 -
*** significant at 1%, **significant at 5%, *significant at 10%
Coefficients t-stat
Rm-Rf SMB HML FC Rm-Rf SMB HML FC
Rm-Rf 1 -
SMB -0.293 1 -4.290*** -
HML 0.115 0.063 1 1.621 0.884 -
FC 0.233 0.087 -0.134 1 3.354*** 1.223 -1.893* -
*** significant at 1%, **significant at 5%, *significant at 10%
Coefficients t-stat
Rm-Rf SMB HML FC Rm-Rf SMB HML FC
Rm-Rf 1 -
SMB 0.121 1 1.707* -
HML -0.341 -0.235 1 -5.078*** -3.385*** -
FC 0.088 0.231 -0.036 1 1.237 3.324*** -0.504 -
*** significant at 1%, **significant at 5%, *significant at 10%
Coefficients t-stat

Essays on Financial Intermediation and Markets 173
Table 5-B.4
Correlation Matrix - Italy
This table shows the cross correlations between the four factors which were used as the explanatory variables. Left panel of the table shows the coefficient of correlations for the full sample period. The respective t-statistics are mentioned in the right panel of the table
Table 5-B.5
Correlation Matrix – Germany
This table shows the cross correlations between the four factors which were used as the explanatory variables. Left panel of the table shows the coefficient of correlations for the full sample period. The respective t-statistics are mentioned in the right panel of the table
Table 5-B.6
Correlation Matrix – Canada
This table shows the cross correlations between the four factors which were used as the explanatory variables. Left panel of the table shows the coefficient of correlations for the full sample period. The respective t-statistics are mentioned in the right panel of the table
Rm-Rf SMB HML FC Rm-Rf SMB HML FC
Rm-Rf 1 -
SMB 0.127 1 1.355 -
HML -0.083 0.097 1 -0.881 1.034 -
FC 0.158 0.231 -0.116 1 1.693* 2.513** -1.236 -
*** significant at 1%, **significant at 5%, *significant at 10%
Coefficients t-stat
Rm-Rf SMB HML FC Rm-Rf SMB HML FC
Rm-Rf 1 -
SMB 0.127 1 1.793* -
HML -0.239 -0.091 1 -3.446*** -1.279 -
FC 0.083 0.113 -0.061 1 1.166 1.592 -0.856 -
*** significant at 1%, **significant at 5%, *significant at 10%
Coefficients t-stat
Rm-Rf SMB HML FC Rm-Rf SMB HML FC
Rm-Rf 1 -
SMB 0.157 1 2.226** -
HML -0.317 -0.138 1 -4.679*** -1.951* -
FC 0.097 0.088 -0.231 1 1.364 1.237 -3.324*** -
*** significant at 1%, **significant at 5%, *significant at 10%
Coefficients t-stat

174 Financial Constraint and Stock Returns - Evidence from G-7 Countries
Table 5-B.7
Correlation Matrix – Japan
This table shows the cross correlations between the four factors which were used as the
explanatory variables. Left panel of the table shows the coefficient of correlations for the full sample
period. The respective t-statistics are mentioned in the right panel of the table
Table 5-B.8
Average GDP Growth Rates
This table shows the average real GDP growth rates of G-7 countries during the full sample period and two equal-sized sub-samples. The sample period varies from 1982-2006 for the US to 1997-2006 for Italy.
% per year
Data Source: World Bank World Development Indicators
Rm-Rf SMB HML FC Rm-Rf SMB HML FC
Rm-Rf 1 -
SMB -0.143 1 -1.609 -
HML -0.109 -0.153 1 -1.221 -1.724* -
FC 0.211 0.103 -0.131 1 2.404** 1.153 -1.471 -
*** significant at 1%, **significant at 5%, *significant at 10%
Coefficients t-stat
Canada US France Germany Italy UK Japan
Full Period 2.890 3.142 1.914 1.618 1.344 2.258 1.506
1st Half 2.254 2.986 1.609 1.664 2.055 2.005 1.208
2nd Half 3.606 3.310 2.256 1.566 0.632 2.543 1.865

Essays on Financial Intermediation and Markets 175
APPENDIX 5-C
Data Definitions for Compustat Global to Construct KZ Index
KZ Index = -1.002×Cashflows/K+ 0.283×Q + 3.139×Leverage
- 39.368× Dividends/K - 1.315 × Cash/K
Where;
Cashflows = item 32, net income + item 33, extraordinary item + item 11, depreciation
and amortization
Q = (item 89, total liabilities and stockholders’ equity + December market equity – item
146, total common equity – item 105, deferred taxes)/(item 89, total liabilities and
stockholders’ equity)
Leverage = (item 106, long-term debt + item 94, debt in current liabilities)/(item 106,
long-term debt + item 94, debt in current liabilities + item 135, stockholders’ equity)
Dividends = item 35, common dividends + item 36, preferred dividends
Cash = item 60, cash and short-term investments
K= item 76, fixed assets(net)

176
6
References
Abdul-Majid, M., D. S. Saal, et al. (2010). "Efficiency in Islamic and Conventional Banking: An International Comparison." Journal of Productivity Analysis 34: 25-43. Abedifar, P., P. Molyneux, et al. (2011). Risk and Stability in Islamic Banking. Bangor, Bangor Business School, University of Wales. Abedifar, P., A. Tarazi, et al. (2010). Risk and Stability of Islamic Banks: A Cross Country Empirical Investigation. Bangor, Bangor Business School, University of Wales. Abiad, A., E. Detragiache, et al. (2008). A New Database of Financial Reform. Washington DC, International Monetary Fund. Agaoglu, E. (1994). "A Camel-Wise Comparative financial and Market Share Analysis of the Islamic Banks Currently Operating in Turkey." Middle East Technical University Studies in Development Al-Azzam, M. d., R. C. Hill, et al. (2011). Repayment Performance in Group Lending: Evidence from Jordan. Dubai, American University. Al-Deehani, T., R. Abdel Karim, et al. (1999). "The Capital Structure of Islamic Banks under the Contractual Obligation of Profit Sharing." International Journal of Theoretical and Applied Finance. Al-Sadr, M. B. (1982). Iqtisdduna: Our Economics. Tehran, World Organization for Islamic Services. Altman, E. I. (1968). "Financial Ratios, Discriminant Analysis and the Prediction of Corporate Bankruptcy." Journal of Finance 23(4): 589-610. Andrabi, T., J. Das, et al. (2006). "Religious School Enrollment in Pakistan: A Look at the Data." Comparative Education Review 50(3).
Essays on Financial Intermediation and Markets 177
Audretsch, D. B., W. Bönte, et al. (2007). Religion and Entrepreneurship, CEPR. Bader, M. K. I., S. Mohamad, et al. (2008). "Cost, Revenue, and Profit Efficiency of Islamic Versus Coventional Banks: International Evidence Usingg Data Envelopment Analysis." Islamic Economic Studies 15(2): 23-76. Baele, L., M. Farooq, et al. (2010). Of Religion and Redemption: Evidence from Default on Islamic Loans. Tilburg, CentER - Tilburg University. Barro, R. J. and R. M. McCleary (2003). "Religion and Economic Growth across Countries " American Sociological Review 68(5): 760-781. Barro, R. J. and R. M. McCleary (2006). "Religion and Economy." Journal of Economic Perspectives 20: 49-72. Barros, P. P., E. Berglof, et al. (2005). Integration of European Banks: The Way Forward. London, Centre for Economic Policy Research. Bashir, A. (1999). "Risk and Profitability Measures in Islamic Banks: The Case of Two Sudanese Banks." Islamic Economic Studies. Bashir, A., A. F. Darrat, et al. (1993). "Equity Capital, Profit Sharing Contracts, and Investment: Theory and Evidence." Journal of Business Finance and Accounting 20(5): 639-651. Beck, T., A. Demirgüç-Kunt, et al. (2010). Islamic Vs. Conventional Banking Business Model, Efficiency and Stability. Washingtonn DC, The World Bank. Becker, S. O. and L. Wößmann (2009). "Was Weber Wrong? A Human Capital Theory of Protestant Economic History." Quarterly Journal of Economics 124: 531–596. Berger, A. N. and G. F. Udell (1992). "Some Evidence on the Empirical Significance of Credit Rationing." Journal of Political Economy 100(5): 1047-1077. Bernanke, B. S. and M. Gertler (1995). "Inside the Black Box: The Credit Channel of Monetary Policy Transmission." Journal of Economic Perspectives 9(4): 27-48. Bernanke, B. S., M. Gertler, et al. (1996). "The Financial Accelerator and the Flight to Quality." Review of Economics and Statistics 78(1): 1-15. Bialkowski, J., A. Etebari, et al. (2010). Piety and Profits: Stock Market Anomaly During the Muslim Holy Month. Christchurch, University of Canterbury. Bifang-Frisancho, I. Mariscal, et al. (2002). "Central Banks and Market Interest Rates " Journal of Post-Keynesian Economics. Borio, C. E. V. and W. Fritz (1995). The Response of Short-Term Bank Lending Rates to Policy Rates: A Cross Country Perspective, BIS.

178 References
Bouckaert, J. and H. Degryse (2006). "Entry and Strategic Information Display in Credit Markets." Economic Journal 116: 702-720. Broecker, T. (1990). "Credit-Worthiness Tests and Interbank Competition." Econometrica 58(2): 429-452. Brown, K. (2003). "Islamic Banking Comparative Analysis." The Arab Bank Review. Brown, M., T. Jappelli, et al. (2009). "Information Sharing and Credit: Firm-Level Evidence from Transition Countries." Journal of Financial Intermediation 18(2): 151-172. Brown, M., K. Kirschenmann, et al. (2010). Foreign Currency Loans - Demand or Supply Driven? Zurich, Swiss National Bank. Calomiris, W., P. Himmelberg, et al. (1995). Commercial Paper, Corporate Finance, and the Business Cycle: A Microeconomic Perspective Carnegie-Rochester Conference Series on Public Policy, Elsevier. 42(1): 203-250. Campello, M. and L. Chen (2005). Are Financial Constraints Priced? Evidence from Firm Fundamentals, Stocks, and Bonds. AFA 2006 Boston Meetings, Boston. Cecchetti, S. (1999). "Legal Structure, Financial Structure, and the Monetary Policy Transmission Mechanism." Economic Policy Review of the Federal Reserve Bank of New York 5(2): 9-28. Cerqueiro, G. (2009). Bank Concentration, Credit Quality and Loan Rates. Tilburg, Tilburg University. Chakravarty, S. and T. Yilmazer (2009). "A Multistage Model of Loans and the Role of Relationships." Financial Management: Forthcoming. Chong, B. S. and M.-H. Liu (2009). "Islamic Banking: Interest-Free or Interest-Based?" Pacific-Basin Finance Journal 17: 125–144. Chui, A. C. W. and K. C. J. Wei (1998). "Book-to-Market, Firm Size, and the Turn-of-the-Year Eeffect: Evidence from Pacific Basin Emerging Markets." Pacific Basin Finance Journal 6: 275-293. Čihák, M. and H. Hesse (2010). "Islamic Banks and Financial Stability: An Empirical Analysis." Journal of Financial Services Research 38(2): 95-113. Clingingsmith, D., A. I. Khwaja, et al. (2009). "Estimating the Impact of the Hajj: Religion and Tolerance in Islam's Global Gathering." Quarterly Journal of Economics 124(3): 1133-1170. Cottarelli, C., G. Ferri, et al. (1995). Bank Lending Rates and Financial Structure in Italy : A Case Study. IMF Working Paper. Washington, D.C., International Monetary Fund, Monetary and Exchange Affairs Department: iii, 26 i.e. 32 p.

Essays on Financial Intermediation and Markets 179
Cottarelli, C. and A. Kourelis (1994). Financial Structure, Bank Lending Rates, and the Transmission Mechanism of Monetary Policy. Washington, D.C., International Monetary Fund. Cox, D. R. (1972). "Regression Models and Life Tables." Journal of the Royal Statistical Society 24: 187-201. Daniel, K. and S. Titman (1997). "Evidence on the Characteristics of Cross Sectional Variation in Stock Returns." Journal of Finance 521: 1-33. Dar, H. A. and J. R. Presley (2000). "Lack of Profit Loss Sharing in Islamic Banking: Management and Control Imbalances." International Journal of Islamic Financial Services 2(2): 3-18. Davis, J. L., E. F. Fama, et al. (2000). "Characteristics, Covariances and Average Returns: 1929-1997." Journal of Finance 55: 389-406. Degryse, H., M. Kim, et al. (2009). Microeconometrics of Banking: Methods, Applications and Results, Oxford University Press. Drew, M. E., T. Naughton, et al. (2003). "Firm Size, Book-to-Market Equity and Security Returns : Evidence from the Shanghai Stock Exchange." Australian Journal of ManagemenT 28(2): 119-139. Drew, M. E. and M. Veeraraghavan (2001). "Explaining the Cross-Section of Stock Returns in the Asian Region." International Quarterly Journal of Finance 1: 205-221. Drew, M. E. and M. Veeraraghavan (2002). Idiosyncratic Volatility: Evidence from Asia, School of Economics and Finance, Queensland University of Technology. Dudley, L. and U. Blum (2001). "Religion and Economic Growth: Was Weber Right?" Journal of Evolutionary Economics 11(2): 207-230. Duffie, D., L. Saita, et al. (2007). "Multi-Period Corporate Default Prediction with Stochastic Covariates." Journal of Financial Economics: Forthcoming. EI-Din, T. and S. Ibrahim (1991). "Risk Aversion, Moral Hazard and Financial Islamization Policy." Review of Islamic Economics. El-Gamal, M. A. (2000). An Economic Explication of the Prohibition of Riba in Classical Islamic Jurisprudence. Third Harvard University Forum on Islamic Finance, Cambridge, Center for Middle Eastern Studies, Harvard University,. El-Gamal, M. A. (2001). An Economic Explication of the Prohibition of Riba in Classical Islamic Jurisprudence. Houston TX, Rice University. El-Gamal, M. A. (2003). "Interest and the Paradox of Contemporary Islamic Law and Finance." Fordham International Law Journal.

180 References
El-Gamal , M. A. (2007). "Mutuality as an Antidote to Rent-Seeking Shari‘a Arbitrage in Islamic Finance." Thunderbird International Business Review. El-Gamal , M. A. and H. Inanoglu (2005). "Inefficiency and Heterogeneity in Turkish Banking: 1990–2000." Journal Of Applied Econometrics. Elbourne, A. and J. de Haan (2006). "Financial Structure and Monetary Policy Transmission in Transition Countries." Journal of Comparative Economics 34(1): 1-23. Espinosa-Vega, M. A. and A. Rebucci (2003). Retail Bank Interest Rate Pass-Through: Is Chile Atypical? . IMF Working Paper. Washington, D.C., International Monetary Fund. Fama, E. F. and K. French (1992). "The Cross-Section of Expected Stock Returns." Journal of Finance 47: 427-466. Fama, E. F. and K. French (1993). "Common Risk Factors in the Returns on Stocks and Bonds." Journal of Financial Economics 33: 3-56. Fama, E. F. and K. French (1998). "Value Versus Growth: The International Evidence." Journal of Finance 53: 1975-1999. Fama, E. F. and M. C. Jensen (1983). "Separation of Ownership and Control." Journal of Law and Economics. Fazzari, S., R. G. Hubbard, et al. (1988). "Financing Constraints and Corporate Investment." Fazzari, S., Hubbard, R. G., and B.C. Petersen, 1988, “Financing constraints and corporate investment”, Brookings Papers on Economic Activity 1: 141-195. Freixas, X. and J. C. Rochet (1997). Microeconomics of Banking. Cambridge MA, MIT Press. Freixas, X. and J. C. Rochet (2008). Microeconomics of Banking. Cambridge MA, MIT Press. Fried, J. and P. Howitt (1980). "Credit Rationing and Implicit Contract Theory." Journal of Money, Credit and Banking 12: 471-487. Frieder, L. and A. Subrahmanyam (2004). "Nonsecular Regularities in Returns and Volume." Financial Analysts Journal 60(4): 29-34. Gerrard, P. and J. B. Cunningham (1997). "Islamic Banking: A Study in Singapore." International Journal of Bank Marketing. Gertler, M. and S. Gilchrist (1994). "Monetary Policy, Business Cycles, and the Behavior of Small Manufacturing Firms." Quarterly Journal of Economics 109: 309-340. Gomes, J. F., A. Yaron, et al. (2003). Asset Pricing Implications of Firms’ Financing Constraints, Working paper, University of Pennsylvania.

Essays on Financial Intermediation and Markets 181
Grier, R. (1997). "The Effect of Religion on Economic Development: A Cross National Study of 63 Former Colonies." Kyklos 50(1): 47-62. Griffin, J. M. (2002). "Are the Fama and French Factors Global or Country Specific?" Review of Financial Studies 15(3): 783-803. Guiso, L., P. Sapienza, et al. (2003). "People's Opium? Religion and Economic Attitudes." Journal of Monetary Economics 50(1): 225-282. Guiso, L., P. Sapienza, et al. (2006). "Does Culture Affect Economic Outcomes?" Journal of Economic Perspectives 20(2): 23-48. Guiso, L., P. Sapienza, et al. (2011). The Determinants of Attitudes Towards Strategic Default on Mortgages. Chicago IL, University of Chicago. Hannan, T. H. and A. N. Berger (1991). "The Rigidity of Prices: Evidence from the Banking Industry." American Economic Review 81(4): 938-945. Hasan, M. and J. Dridi (2010). The Effects of the Global Crisis on Islamic and Conventional Banks: A Comparative Study Washington DC, International Monetary Fund. Heckman, J. J. (1979). "Sample Selection Bias as Specification Error." Econometrica 47(1): 153-161. Heckman, J. J. and B. Singer (1984). "Econometric Duration Analysis." Journal of Econometrics 24: 63-132. Hilary, G. and K. W. Hui (2010). "Does Religion Matter in Corporate Decision Making in America?" Journal of Financial Economics. Hofmann, B. and P. Mizen (2004). "Interest Rate Pass-through and Monetary Transmission: Evidence from Individual Financial Institutions’ Retail Rates." Economica. Homoud, S. H. (1974). Islamic Banking. Cairo, Al Azhar University. PhD. Hubbard, R. G. (1995). "Is There a Credit Channel for Monetary Policy?" Federal Reserve Bank of St. Louis Review 77(3): 63-77. Hussain, F. (2011). The Judicial System of Pakistan. Islamabad, Registrar, Supreme Court of Pakistan. Iannaccone, L. R. (1998). "Introduction to the Economics of Religion." Journal of Economic Literature 36(3): 1465-1495. Imam, P. and K. Kpodar (2010). Islamic Banking: How Has It Diffused? Wsahington DC, International Monetary Fund.

182 References
Iqbal, M. (2001). "Islamic and Conventional Banking in the Nineties: A Comparative Study." Islamic Economic Studies. Iqbal, Z. (1987). Islamic Banking. Washington DC, International Monetary Fund. Isakova, A. (2008). "Monetary Policy Efficiency in the Economies of Central Asia." Czech Journal of Economics and Finance. Ismail, A. H. (1989). Al Qur'an on Deferred Contracts of Exchange, Prime Minister's Secretariat, Kuala Lampur, Malaysia, Mimeographed. Jaehoon, H. and L. Hangyong (2009). "Financial Constraints, Debt Capacity, and the Cross-Section of Stock Returns." Journal of Finance 64(2): 891-921. Jaffar, M. and I. Manarvi (2011). "Performance Comparison of Islamic and Conventional Banks in Pakistan." Global Journal of Management And Business Research 11(1): 61-66. Jappelli, T. and M. Pagano (1993). "Information Sharing in Credit Markets." Journal of Finance 63(5): 1693-1718. Jiménez, G., S. Ongena, et al. (2011). "Credit Supply and Monetary Policy: Identifying the Bank Balance-Sheet Channel with Loan Applications." American Economic Review: Forthcoming. Jobst, A. A. (2007). The Economics of Islamic Finance and Securitization. Washington DC, International Monetary Fund. Kalbfleisch, J. D. and R. L. Prentice (2002). The Statistical Analysis of Failure Time Data. New York NY, Wiley-Interscience. Kaplan, S. N. and L. Zingales (1997). "Do Investment-Cash Flow Sensitivities Provide Useful Measures of Financing Constraints?" The Quarterly Journal of Economics 112(1): 169-215. Kettell, B. (2010). Islamic Finance in a Nutshell: A Guide for Non-Specialists. West Sussex, Wiley. Khan, A. K. (2010). God, Government and Outsiders: The Influence of Religious Beliefs on Depositor Behavior in an Emerging Market. Cambridge MA, Harvard. Khan, A. K. and T. Khanna (2010). Is Faith a Luxury for the Rich? Examining the Influence of Religious Beliefs on Individual Financial Choices. Cambridge MA, Harvard Business School. Khan, F. (2010). "How `Islamic' Is Islamic Banking?" Journal of Economic Behavior & Organization 76(3): 805-820. Khan, M. S. (1986). "Islamic Interest-Free Banking : A Theoretical Analysis." IMF Staff Papers 33(1).

Essays on Financial Intermediation and Markets 183
Khan, T. (1996). An Analysis of Risk Sharing in Islamic Finance with Reference to Pakistan, Loughborough University. PhD. Khan, W. M. (1989). "Towards an Interest-Free Islamic Economic System." JKAU: Islamic Economics. Khwaja, A. and A. Mian (2008). "Tracing the Impact of Bank Liquidity Shocks: Evidence from an Emerging Market." American Economic Review 98(4): 1413-1442. Khwaja, A. I. and A. Mian (2005). "Do Lenders Favor Politically Connected Firms? Rent Provision in an Emerrging Financial Market." Quarterly Journal of Economics 120(4): 1371-1411. Khwaja, A. I., A. Mian, et al. (2011). Bank Credit and Business Networks. Cambridge MA, Kennedy School of Government, Harvard University. Kiefer, N. M. (1988). "Economic Duration Data and Hazard Functions." Journal of Economic Literature 26: 646-679. Kuran, T. (1996). "The Discontents of Islamic Economic Morality." The American Economic Review. Kuran, T. (2004). Islam and Mammon: The Economic Predicaments of Islamism. Princeton NJ, Princeton University Press. Lamont, O., C. Polk, et al. (2001). "Financial Constraints and Stock Returns." Review of Financial Studies 14(2): 529-554. Landes, D. S. (1999). The Wealth and Poverty of Nations: Why Some Are So Rich and Some So Poor. New York NY, Norton. Li, D. (2011). "Financial Constraints, R&D Investment, and Stock Returns." Review of Financial Studies. Lintner, J. (1965). "The Valuation of Risk Assets and the Selection of Risky Investments in Stock Portfolios and Capital Budgets." The Review of Economics and Statistics 47(1): 13-37. Lintner, J. (1965). "The Valuation of Risk Assets and the Selection of Risky Investments in Stock Portfolios and Capital Budgets." Review of Economics and Statistics 47: 13-37. Lowe, P. and T. Rohling (1992). Loan Rate Stickiness: Theory and Evidence, Reserve Bank of Australia. Malin, M. and M. Veeraraghavan (2004). "On the Robustness of the Fama and French Multifactor Model: Evidence from France, Germany, and the United Kingdom." International Journal of Business and Economics 3(2): 155-176.

184 References
Mansoor Ali, M. (2009). Global Financial Crisis: Impact on Pakistan and Policy Response. Dhaka, Bangladesh, UN ESCAP. Markowitz, H. (1952). "Portfolio Selection." The Journal of Finance 7(1): 77-91. Maududi, A. a.-A. (1961). Sud (Interest). Lahore, Islamic Publications (Urdu). Maududi, A. a.-A. (st. 1941). Economic System of Islam. Lahore, Islamic Publications. Maududi, A. a.-A. (st. 1950). Tafheemul Quran (Commentary on the Holy Qur'an in Urdu) McDonald, C. G. and L. M. Van de Gucht (1999). "High-Yield Bond Default and Call Risks." Review of Economics and Statistics 81(3): 409-419. McKillop, D. and J. O. S. Wilson (2011). "Credit Unions: A Theoretical and Empirical Overview." Financial Markets, Institutions and Instruments: Forthcoming. Mester, L. J. and A. Saunders (1995). "When Does the Prime Rate Change?" Journal of Banking and Finance. Mian, A. (2006). "Distance Constraints: The Limits of Foreign Lending in Poor Economies." Journal of Finance 61(2): 1005-1056. Milton, F. (1968). "The Role of Monetary Policy." The American Economic Review 58(1): 1-17. Mishkin, F. S. (1996). The Channels of Monetary Transmission: Lessons for Monetary Policy NBER Working Paper. Mohamad, S., T. Hassan, et al. (2008). "Efficiency of Conventional Versus Islamic Banks: International Evidence Using the Stochastic Frontier Approach (Sfa)." Journal of Islamic Economics, Banking and Finance 4(2): 107-130. Mojon, B. (2000). Financial Structure and the Interest Rate Channel of Ecb Monetary Policy, European Central Bank. Moktar, H. S., N. Abdullah, et al. (2006). "Efficiency of Islamic Banks in Malaysia: A Stochastic Frontier Approach." Journal of Economic Cooperation among Islamic Countries. Mossin, J. (1966). "Equilibrium in a Capital Asset Market." Econometrica 344: 768–783. Mudawi, B. (1985). Placing Medium and Long Term Finance by Islamic Financial Institutions. Conference on Islamic Banking and Finance. London, UK, Business Research International.

Essays on Financial Intermediation and Markets 185
Neumark, D. and S. A. Sharpe (1992). "Market Structure and the Nature of Price Rigidity: Evidence from the Market for Consumer Deposits." Quarterly Journal of Economics 107(2): 657-680. Nigel, D. (1998). "Islamic Banks Aim for the Mainstream." Euromoney. Ohlson, J. A. (1980). "Financial Ratios and the Probabilistic Prediction of Bankruptcy." Journal of Accounting Research 18: 109–131. Ongena, S. and A. Popov (2011). "Interbank Market Integration, Bank Competition, and Loan Rates." Journal of Banking and Finance 35(3): 544-559. Ongena, S. and İ. Şendeniz-Yüncü (2011). "Which Firms Engage Small, Foreign, or State Banks? And Who Goes Islamic? Evidence from Turkey " Journal of Banking and Finance: Forthcoming. Ongena, S. and D. C. Smith (2001). "The Duration of Bank Relationships." Journal of Financial Economics 61(3): 449-475. Ostergaard, C., I. Schindele, et al. (2009). Social Capital and the Viability of Stakeholder-Oriented Firms: Evidence from Norwegian Savings Banks. Oslo, Norwegian School of Management. Padilla, A. J. and M. Pagano (1997). "Endogenous Communication among Lenders and Entrepreneurial Incentives." Review of Financial Studies 10(1): 205-236. Pepinsky, T. B. (2010). The Demand for Islamic Banking: Piety, Class, and Global Identity. Ithaca NY, Department of Government, Cornell University. Puri, M., J. Rocholl, et al. (2011). "Global Retail Lending in the Aftermath of the Us Financial Crisis: Distinguishing between Supply and Demand Effects." Journal of Financial Economics 100: 556-578. Richardson, G. and M. McBride (2009). "Religion, Longevity, and Cooperation: The Case of the Craft Guild." Journal of Economic Behavior and Organization 71: 172-186. Rosenfeld, M. (1998). Just Interpretations: Law between Ethics and Politics. Berkeley, University of California Press. Sadr, K. and Z. Iqbal (2001). Choice between Debt and Equity Contracts and Asymmetrical Information: Some Empirical Evidence. Leicester, UK, The Islamic Foundation. Samad, A. (1999). "Comparative Efficiency of the Islamic Bank Vis-`a-Vis Conventional Banks in Malaysia." IIUM Journal of Economics and Management Strategy. Saxonhouse, G. R. (1976). "Estimated Parameters as Dependent Variables " American Economic Review 66.
186 References
Shahid, H., R. ur Rehman, et al. (2010). "Efficiencies Comparison of Islamic and Conventional Banks of Pakistan." International Research Journal of Finance and Economics 49: 25-44. Sharpe, W. F. (1964). "Capital Asset Prices: A Theory of Market Equilibrium under Uncertainty." Journal of Finance 19: 425-442. Shumway, T. (2001). "Forecasting Bankruptcy More Accurately: A Simple Hazard Model." Journal of Business 74: 101–124. Siddiqi, M. N. (1967). Banking without Interest (in Urdu). Lahore, The Islamic Publications Ltd. Siddiqi, M. N. (1983). Issues in Islamic Banking. Leicester, London, U.K, The Islamic Foundation. Siddiqi, M. N. (1988). Islamic Banking: Theory and Practice. Singapore, Institute Of Southeast Asian Studies. Siddiqi, M. N. (2006). "Islamic Banking and Finance in Theory and Practice: A Survey of State of the Art." Islamic Economic Studies. Siddiqui, S. H. (2002). "Islamic Banking: True Modes of Financing." Journal of Islamic Banking & Finance 19(1): 13. Spenkuch, J. L. (2011). The Protestant Ethic and Work: Micro Evidence from Contemporary Germany. Chicago, University of Chicago. Stulz, R. M. and R. Williamson (2003). "Culture, Openness, and Finance." Journal of Financial Economics 70: 313–349. Sufian, F. (2006). "Size and Returns to Scale of the Islamic Banking Industry in Malaysia : Foreign Versus Domestic Banks." IIUM Journal of Economics and Management. Tobin, J. (1958). "Liquidity Preference as Behavior Towards Risk." Review of Economic Studies. Toolsema, L. (2002). "Competition in the Dutch Consumer Credit Market." Journal of Banking and Finance 26(11): 2215-2229. Turen, S. (1996). "Performance and Risk Analysis of the Islamic Banks: The Case of Bahrain Islamic Bank." Journal of King Abdul Aziz University, Islamic Economics. Usmani, I. (2002). Guide to Islamic Banking. Karachi, Darul - Ishaat. Usmani, M. M. T. (1998). An Introduction to Islamic Finance Karachi, Idaratul Ma'arif. Uzair, M. (1955). An Outline of an Interest-Less Banking, Raihan Publications, Karachi.

Essays on Financial Intermediation and Markets 187
Weill, L. (2010). Do Islamic Banks Have Greater Market Power? Helsinki, BOFIT. Whited, M. (1992). "Debt, Liquidity Constraints, and Corporate Investment: Evidence from Panel Data." Journal of Finance 47, 1425-1460 47: 1425-1460. Whited, M. and G. Wu (2006). "Financial Constraints Risk." The Review of Financial Studies 19(2): 531-559. Yefet, K. C. (2009). "What's the Constitution Got to Do with It? Regulating Marriage in Pakistan." Duke Journal of Gender Law and Policy 16:347. Yusof, R. M., M. S. Abd. Majid, et al. (2009). "Impact of Monetary Policy Shocks on the Conventional and Islamic Banks in a Dual Banking System: Evidence from Malaysia." Journal of Economic Cooperation and Development. Zaher, T. S. and M. K. Hassan (2001). A Comparative Literature Survey of Islamic Finance and Banking. MA, USA, Blackwell Publishers. Zia, B. H. (2008). "Export Incentives, Financial Constraints, and the (Mis)Allocation of Credit: Micro-Level Evidence from Subsidized Export Loans." Journal of Financial Economics(87): 498–527.