t~il! - usgs · fish hatchery ... hills composed of sand and gravel ... based on streamflow...
TRANSCRIPT

mT~::m:::T~~T-: ~~ :::::::::::::::-:---------------------.. ··················· ................... ................... ··················· ................... ................... ................... ................... ................... ··················· ................... ··················· ................... ................... ··················· ··················· ................... ................... ................... ··················· ................... ................... ·················· ················· ................ ............... .............. ············· ............ ........... ..........
GROUND-WATER RESOURCES
t~il! l.- .... . ,.
'"''"' •• 0111
STATE OF NEW YORK CONSERVATION DEPARTMENT
WATER RESOURCES COMMISSION
IN THE VICINITY OF THE CROWN POINT FISH HATCHERY ESSEX COUNTY, NEW YORK
By
I. H. KANTROWITZ . U.S. GEOLOGICAL SURVEY
....... .. .... . .. .... . .. .... . .. .... . .. .... . .. .... . .. .... . .. .... . .. .... . .. .... . .. .... . .. .... . .. .... . .. ..... .. .. ..... .. .. ..... .. .. .... . .. .... . .. ..... . .. ..... . REPORT OF INVESTIGATION
.. ..... ....... ~~ Rl-2
1 02.S 1968
N'l K2..~
JAMES I \. MILNE LIBRARY SUC. AT ONEONTA, N. Y..
......................... ......................... ......................... ························· ......................... .......................... ......................... . . . . . .. . . . . . . . . . . . . .. . ... ......................... ························· ......................... ......................... ......................... ......................... ························· ························· ......................... .........................
.. ..... ........ ' ....... .. .... . .. ..... " ....... .. ..... ~ ....... .. ..... ....... .. .... . .. ..... . :: ::::: ~ • •••••• e: :: ::::: l :: ::::: ~ . . . . . . . ~ . . .. . . . . ~ :: ::::: ll ....... .. .... . . ...... l ....... :: ::::: l' . ..... . . ..... . . ..... .
.._._._._.~'-'-'-Y~Io&.U.!.=~!_!_!_!; •_:_:_:_:_:_:._::_:_:_:._:_:_:_:_.:_:_:._:_:_:_:_:_:~._._._._.=u.u..:~~.:..u....:=u:..:.::~=~==~=== --~
GROUND-WATER RESOURCES IN THE VICINITY OF THE CROWN POINT FISH HATCHERY
ESSEX COUNTY, NEW YORK I 6 2 6 95
By
I. H. Kantrowitz U.S. Geological Survey
REPORT OF INVESTIGATION Rl-2
Prepared by UNITED STATES DEPARTMENT OF THE INTERIOR
GEOLOGICAL SURVEY
in cooperation with NEW YORK STATE CONSERVATION DEPARTMENT
STATE OF NEW YORK CONSERVATION DEPARTMENT
WATER RESOURCES COMMISSION
1968
M\LNE UB~AR'< lAME ·oNEON1 A., N. '{ . sue. A


CONTENTS
Page
Introduction.... . ... . ............................................. 1 Existing water supplies........................................... 3 Sources of addi tiona! water supply................................ 4
Rennie Brook Springs........ . .................................. 4 Putnam Creek valley............................................ 4
Test drilling............................................... 6 Aq u i f e r y i e 1 d • • • • • • • • • • • • • • • • • • • • • • • • • • • • • • • • • • • • • • • • • • • • • • • 9
Response of the aquifer to pumping....................... 9 Available recharge....................................... 12
Surrrnary and conclusions........................................... 13
ILLUSTRATIONS
Figure 1. Topographic map of the vicinity of the Crown Point Fish Hatchery........................................ 2
2. Map showing distribution of unconsolidated deposits in the vicinity of the Crown Point Fish Hatchery..... 5
3. Map showing the locations of test wells drilled near the Crown Point Fish Hatchery........................ 6
4. Graphs of water levels in wells 3 and 6 during and after the aquifer test of May 24, 1967............... 10
5. Geologic section through wells 1, 7, 6, and 5.......... 11
TABLES
Tabl e 1. Logs of test wells drilled near the Crown Point Fish Hatchery......................................... 7
2. Summary of probable aquifer yields under variou ~
hydrolog i c conditions................................. 13
- iii -


GROUND-WATER RESOURCES IN THE VICINITY OF THE CROWN POINT FISH HATCHERY
ESSEX COUNTY, NEW YORK
By
I. H. Kantrowitz l/
INTRODUCTION
The Crown Point Fish Hatchery, one of several hatcheries operated by the New York State Conservation Department, is located in Crown Point Center, Essex County, on the eastern edge of the Adirondack Highlands and about 2 miles west of Lake Champlain. Figure 1 is a location map of the vicinity of the Hatchery. This report summarizes an investigation by the U.S. ·Geological Survey, in cooperation with the New York State Conservation Department, Division of Water Resources, to locate and evaluate sources of additional ground-water supply for the Hatchery. In order to expand the faci litles at the Hatchery, an additional water supply of about 100 gpm (gallons per minute) to as much as 350 gpm is needed. In addition, the type of fish culture practiced requires a water temperature of about 7 to 13 degrees Celsius (centigrade) for optimum results.
The cooperation and assistance of the New York State Department of Transportation, Bureau of Soil Mechanics, the New York State Education Department, Museum and Science Se~vice, and G. A. Connally of the State University of New York at New Paltz, during this study are gratefully acknowledged. Much of the preliminary field work was done by G. L. Giese and W. A. Hobba, Jr., U.S. Geological Survey, as part of a water-resources study of the Lake Champlain basin. The field work was supervised by R. C. Heath, former district chief of the Water Resources Division, U.S. Geological Survey. G. G. Parker, district chief, supervised the preparation of this report.
ll Hydrologist, U.S. Geological Survey, Albany, N. Y.
- 1 -

4 55'
Ticonderoga -
Index map of New York State showing the location of figure 1
7
Albanv O
1000 0 1000
28
Figure 1.--Vicinity of the Crown Point Fish Hatchery.
- 2 -
2000 FEET
I 27'
57'
EXISTING WATER SUPPLIES ~ .
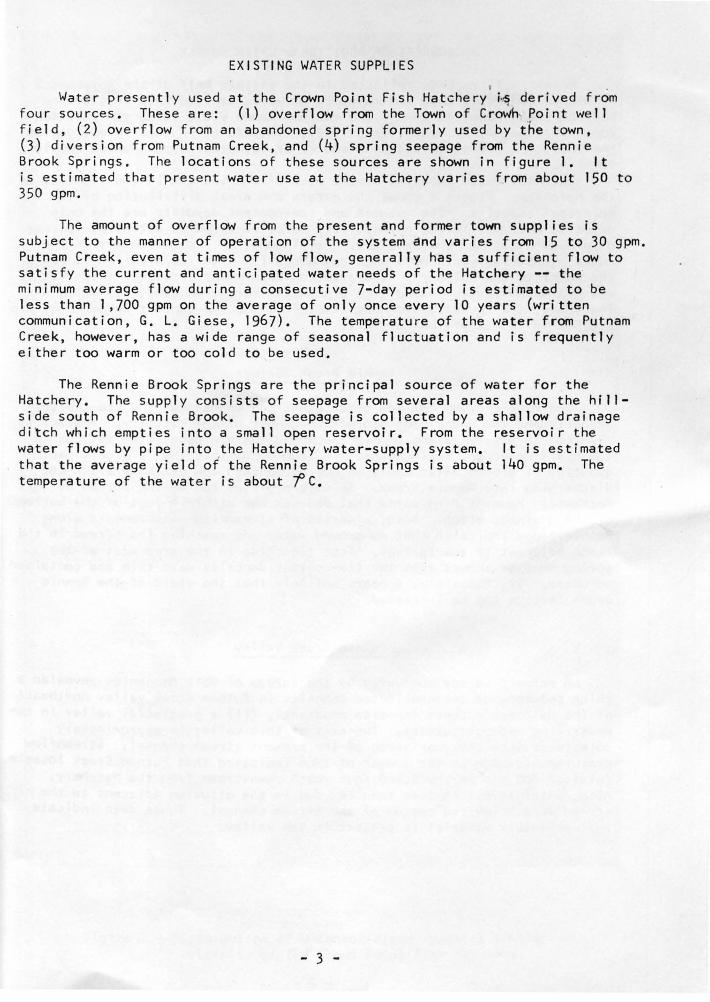
Water presently used at the Crown Point Fish Hatchery i4 derived f rom f our sources. These are: (1) overflow from the Town of CroWh· Point well f ield, (2) overflow from an abandoned spring formerly used by the town, (3) diversion from Putnam Creek, and (4) spring seepage from the Rennie Brook Springs. The locations of these sources are shown in figure 1. It is estimated that present water use at the Hatchery varies from about 150 to 350 gpm.
The amount of overflow from the present a~d former town supplies is subject to the manner of operation of the system ~nd varies from 15 to 30 gpm. Putnam Creek, even at times of low flow, generally has a sufficient flow to satisfy the current and anticipated water needs of the Hatchery-- the minimum average flow during a consecutive 7-day period is estimated to be less than 1,700 gpm on the average of only once every 10 years (written communication, G. L. Giese, 1967). The temperature of the water from Putnam Creek, however, has a wide range of seasonal fluctuation and is frequently either too warm or too cold to be used.
The Rennie Brook Springs are the principal source of water for the Hatchery. The supply consists of seepage from several areas along the hillside south of Rennie Brook. The seepage is collected by a shallow drainage ditch which empties into a small open reservoir. From the reservoir the water flows by pipe into the Hatchery vtater-supply system. It is estimated that the average yield o f the Rennie Brook Springs is about 140 gpm. The temperature of the water is about "f C.
- 3 -
SOURCES OF ADDITIONAL WATER SUPPLY
Recent well records collected in the eastern half of the Adirondack Highlands indicated that the majority of wells drille.d into crystalline bedrock yield about 10 gpm --the maximum known yield is 35 gpm (written communication, W. A. Hobba, Jr., 1967). Therefore, in this investigation the bedrock was disregarded as a source of potential ground-water supply.
Unconsolidated deposits mantle much of the bedrock in the vicinity of the Hatchery. Figure 2 shows the nature and areal distribution of the principal deposits. The outwash and ice-contact deposits are the only deposits with sufficient permeability to be regarded as potential sources of ground water for the Hatchery. Development of a water supply in the outwash deposits would have required about 1.5 miles of pipeline to bring the water · to the Hatchery. Conservation Department personnel felt that it was not economically feasible to pipe water more than about 0.5 mile. Therefore, the investigation was limited to the ice~contact deposits within a 0.5-mile radius of the Hatchery.
Rennie Brook Springs
The Rennie Brook Springs occur along the contact of the ice-contact deposits and the underlying bedrock southwest of the Hatchery. Bedrock is exposed, in places, along Rennie Brook and the drainage ditch but not in the hillside at the springheads. It seemed possible that a significant quantity of ground water could be moving beneath the drainage ditch and discharging into Rennie Brook. Seismic profiles run by the Bureau of Soi I Mechanics, however, indicated that bedrock was within 4 feet of the bottom of the drainage ditch. Also, a series of streamflow measurements along Rennie Brook indicated that no ground water was reaching the stream in the reach adjacent to the springs. Test trenching in the area west of the spring seepage showed that the ice-contact deposits were thin and contained no water. It, therefore, appears unlikely that the yield of the Rennie Brook Springs can be increased.
Putnam Creek Valley
A seismic survey conducted by the Bureau of Soil Mechanics revealed a thick sequence of unconsolidated deposits in Putnam Creek valley northeast of the Hatchery . These deposits apparently fill a preglacial valley in the underlying bedrock surface. The axis of this valley is approximately coincident with the road north of the present stream channel. Streamflow measurements made in the summer of 1966 indicated that Putnam Creek loses a total of 800 gpm in the 2,500-foot reach downstream from the Hatchery. Also, water levels in test trenches dug in the alluvium adjacent to the stream were below the bottom of the stream channel. These data indicate that permeable material is present in the valley.
- 4 -

a
EXPLANATION
Outw 1sh -- wt•II·Sort •d St1'1d cl d grdVP.I
ldke dcoo~1ts . wpll·~ortt•d c I Jy, tit,
281
430 ,Jnd \'~t• 1-s<'rtl'd f1ro0 S<~nd
55 1 -
1000 0 1000 2000 3000 4000 5000 6000 7000
Scale on feet
Figure 2.--Distribution of unconsolidated depos i t s in the vicinity of the Crown Point Fish Hatchery.
- 5 -
27'
Test Drilling
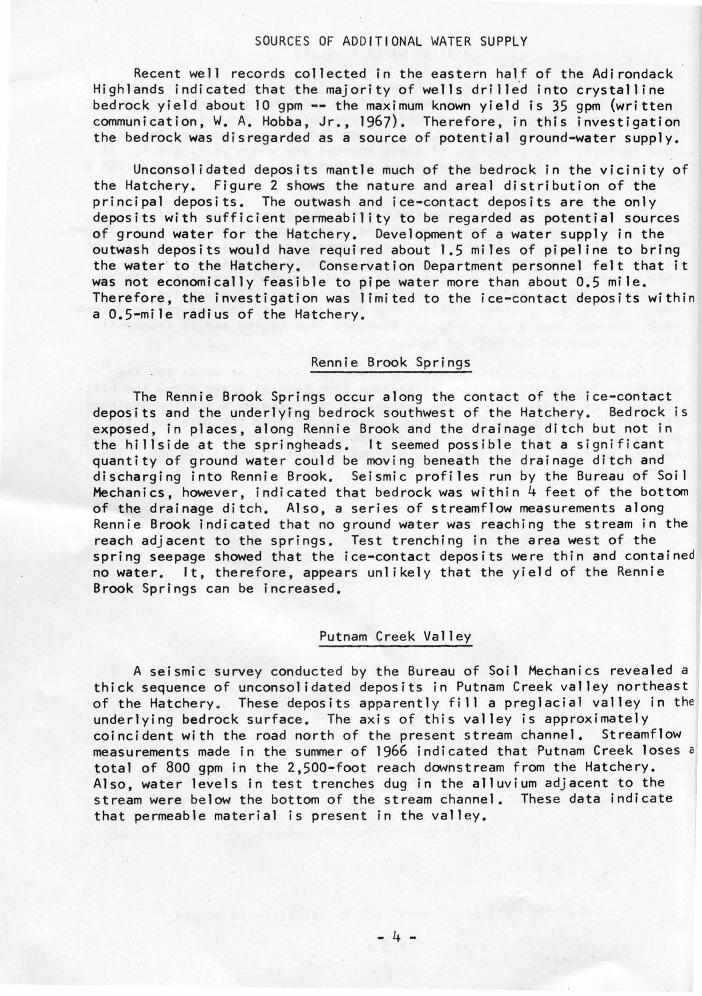
Drilling options were obtained on several parcels of land in Putnam · Creek valley and sev·en test wells were drilled. The ' locations of the test wells a re shown in f i gure 3 and the logs of the material penetrated in eacf of the we 11 s i s shown i n tab fe 1.
Crown Po int Center
N
1
Hi lls composed of sand and gravel (predominantly f i ne gra ined) . Bedrock is relatively close to land surface and the saturated thickness of the deposits is sma I I.
Sca le
0 500
EXPLANATION
[\\\\) Poss ibl e extent of permeab le
deposi ts in Putnam Creek valley
~ Erosion a I sea rp
02 Test well and number
1000 f e e t
Figure 3.--Locations of test wells drilled near the Crown Point Fish Hatchery.
- 6 -

162695
Table 1.--Logs of test wells drilled near the Crown Point Fish Hatchery
0-14 14-28
28-65 65
o-8 8-41 41-45 45-51 51
0-13 13-37 37-44 44-59
59-81 81-97
(All measurements, in feet below land surface)
TEST WELL 1
Sand, very fine to fine, some silt and clay Sand, fine to very coarse, gravel and boulders, some
silt and clay Sand, very fine to very coarse, some silt and clay Bedrock
Static water level: 42.91, May 24, 1967 Cased to 64
TEST WELL 2
Sand, very fine, silty Sand, very fine to fine, silt and clay Sand, fine to coarse, silty, some gravel Sand, fine, silty Bedrock
Static water level: 31.0, March 22, 1967 Casing pulled
TEST WELL 3
Sand, very fine, silty, some fine to medium sand Sand, fine to very coarse, silty Sand, medium to very coarse, some silt and gravel Sand, coarse to very coarse, some fine sand dnd silt,
considerable gravel Sand, fine, silty Weathered bedrock
Static water level: 29.25, May 24, 1967 Cased to 49, screened from 49 to 59
TEST WELL 4
0-2 Sand, very fine, silty 2-4 Sand, very fine, silty, with cobbles 4-39 Sand, fine to very coarse, silty and gravelly,
some clay 39 Bedrock
Static water level: 21.64, May 24, 1967
- 7 -JAMES M. Mll E LIBRARY SUC. AT ONEONTA, N. Y.

Table I.--Logs of test wells drilled near the Crown Point Fish Hatchery (Continued)
TEST WELL 5
0-47 Sand, fine to very coarse, gravelly, considerable silt, clay and boulders
47 Bedrock
0-12 12-47 47-59 59-61
0-12 12-42
42-47 47-55
Static water level: 8.85, May 24, 1967
TEST WELL 6
Sand, very fine, some clay and silt Sand, medium to coarse, some silt and gravel Sand, medium to very coarse, gravelly Sand, fine to medium
Static water level: 30.11, May 24, 1967 Cased to 48, screened from 48 to 58
TEST WELL 7
Sand, very fine, clayey and silty Sand, fine to very coarse, silty and clayey,
some boulders Sand and gravel, some silt Sand, fine to coarse, clayey and silty
Static water level: 33.96, May 24, 1967 Cased to 45
Based on streamflow measurements and ground-water levels it appears likely that any aquifer present in the valley would receive part of its recharge by seepage from Putnam Creek. Such stream infiltration might result in ground-water temperatures that at times would be unsatisfactory for use at the Hatchery. The effect of stream infiltration on ground-water temperature decreases with increasing distance from the stream. Therefore, test wells 1 and 2 were drilled as far from the stream as possible. These wells penetrated saturated deposits that were too fine grained and too thin to be considered for potential water supplies. Test well 3 was then drille· at a site 250 feet closer to the stream where the seismic data indicated that the unconsolidated deposits were thickest. This well penetrated a layer of water-bearing sand and gravel in which a well screen was installed from 49 to 59 feet below land surface. The well was test pumped for 3 hour but could not sustain a yield of 50 gpm. The low yield of the well was believed to be caused by incomplete development of the screened zone-possibly caused by caving of the bore hole -- rather than a reflection of the water-bearing characteristics of the aquifer.
- 8 -

Test wells 4 and 5 were drilled to determine the extent of the aqu ife r. Both wells failed to penetrate fa vo rabl e wate r -bearing mater ial, indicating that the aquifer is not extensive throughout the valley. Because of di fi iculty of access and lack of permissi on to drill, it was not possible to further explore the extent of the aquifer.
In order to determine the perenn i al yield of the aquifer it was necessary to run a controlled aquifer test-- that is , to pump one well .at a constant rate and observe the water-leve l decline (drawdown) in nearby wells. By means of such a test we a re abl e to measure the ability of the aquifer to store and transmit water. Aq ui fer-test data also can be used to determine the location and nature of aqu ifer boundaries. Test well 6 was drilled 13 feet away from well 3 t o se rve as t he pumping well. This well was finished with an 80-slot screen-- des igned t o pa s s sand grains smaller than 0.08 inch in diameter-- between 48 and 59 feet below land surface. Preliminary test pumping indica t e d t ha t t he well could sustain a yield of at least 50 gpm. Water temperature dur ing the test and during all subsequent tests was 9°C. Test well 7 was dr illed 85 f ee t away from well 6 to serve as an additional observation well during the aquifer test.
The aquifer test was conducted for an 8-hour period on May 24, 1967; budget and contract limitations precluded a longer test. Well 6 was pumped at a constant rate of 105 gpm du ring t he 8-hour period and water levels were periodically measured in all t he wells . Figure 4 shows the trend of the water levels in well 3 (the princi pal observat i on well) and well 6 (the
, pumping well) during and after the aqu i fe r test.
Based o·n the data from the aquifer test and a preliminary 3-hour test on May 17, the coefficient of transmi ssib i lity of the aquifer is approximately 57,000 gallons per day per foot of aquifer width; the coeffic ient of storage is abou t 0.26. These data indica te a permeable water-table aquifer. The test data also indicate that an i mpe rmeable boundary exists approximately 50 feet from well 6. The test was not run long enough to determine the pres ence of additional impermea ble boundaries or a recharge boundary (hydraulic connection with Putnam Creek).
Aquifer Yield
The perennial yield of the aquife r may be defi :·0d as the maximum rate of pumpage that can be sustained for a prolonged peri..:: ·~ of no recharge (ass umed here to be 200 days) without exceeding the avai ~ ,· ble drawdown in
r the aqu ifer; provided also that this discharge rate does n· ... exceed the , ave rage ra te of water replenis hment (recharge) to the aquift· Thus, there
are two factors affecting aquifer yield: (1) the physical res ~ ~nse of the n aqui fer t o pumping, and (2) the maxi mum recharge available to th ~ '~uifer.
e
Res ponse of the aquifer to pumping d 1r Using the coefficients of transmiss i bility and storage it is possible
to compute the maximum pumping rate t hat can be sustained for a period of 200 days without lowering the wate r l eve l in the aqu i fer below the top of t he we ll screen. Such computations mus t take into account the lowering of
- 9 -

Q) u "' 't ::::J
29
30
31
32
(/) 2 9 -o c
"' ~ 3 0 Q) .0
Q)
2 c
3 I
2
3
3 4
3
3 6
Pump on
·~ -~
I Test
1 wel l 3
"--J/ ( 13 feet from Jpumping well) Pump off I I I
Pump on
I / I I I Test well 6 (pumping well)
\ Top of screen is 48 feet below land surface
I~ Pulp off
5 om lOom 3pm Bpm lam Sam
May 24 May 25
Figure 4.--Water levels in wells 3 and 6 during and after the aquifer test of May 24, 1967.
11om
the water table around the pumping well as ground water is removed from storage, the head loss due to the friction of water moving through the well screen, the head loss due to the partial dewatering of the aquifer, a seasonal decline of the water table estimated to be 2 feet during a 200-day period of no recharge, and the effect of impermeable boundaries, recharge boundaries, or both.
On 1 y one boundary -- an i mpe rmeab 1 e boundary at 50 feet -- was detecte' during the B~hour aquifer test. Based on the geology of the deposits it is likely that a second impermeable boundary at about 100 feet would have been noted if the aquifer test were of a longer duration. The most likely configuration of the aquifer is shown in figure 5. The boundary at 50 feet is assumed to represent a thinning of the permeable beds in the direction of test well 7. The boundary at 100 feet is assumed to represent an
- 10 -

A
EXPLANATION
1:-.::::;".-:';·>J Ice-contact deposits, predominantly fine grained , of moderate permeability
~ ~
Permeabl e sand and gravel zone within ice-contact deposits
~ Poorly sorted alluvium of low permeability
100 Seale
0 100 200 300 f ee t
DATUM IS MEAN SEA LEVEL VERTICAL EXAGGERATION X 5
Figure 5.--Geologic section through wells 1, 7, 6, and 5.
erosional contact with the relat i vely impermeable alluvium penetrated in test well 5. It i s possible that the aquifer is reasonably extensive in a northeast-southwest direction , as indicated in figure 3. Well 6, tapping such an aquifer, could be pumped at a rate of 50 gpm for 200 days be fore t he pumping level drops to the top of the screen.
Under the less likely condition that only one impermeable boundary exists, the aquifer could yield a total of about 200 gpm for a 200-day period from 2 wells spaced 100 feet apart be fore the pumping levels would drop to the tops of the screens. This points out the ef fect of aquifer geometry on well yields and the need for a longer test to better define the limits of the aquifer.
- 11 -
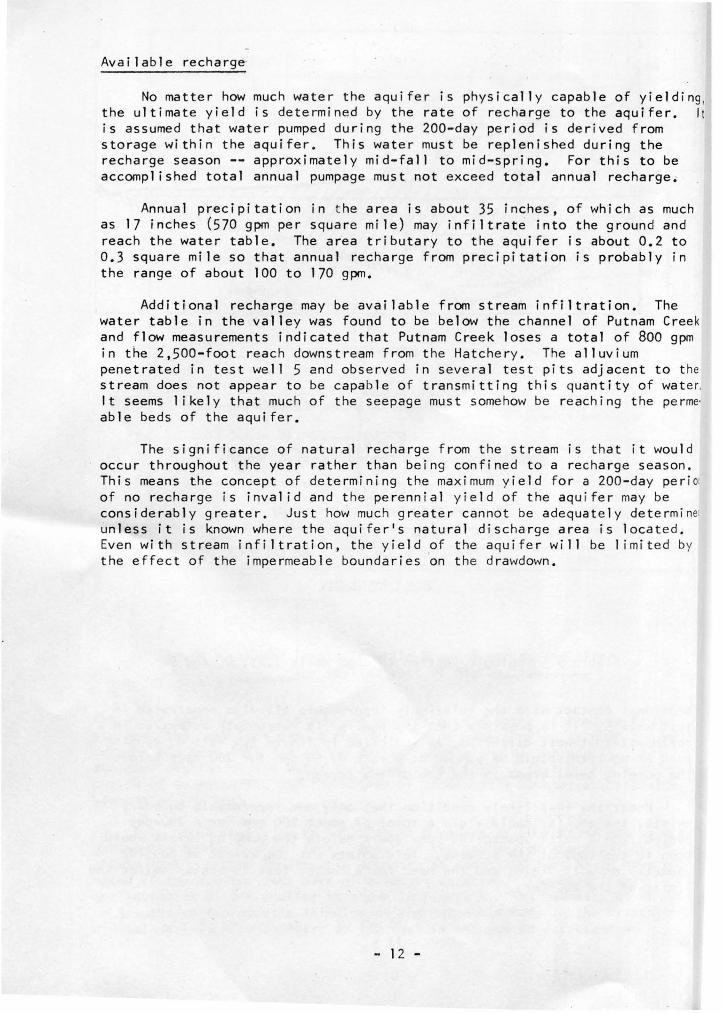
Available recharge
No matter how much water the aquifer is physically capable of yielding , the ultimate yield is determined by the rate of recharge to the aquifer. It is assumed that water pumped during the 200-day period is derived from storage within the aquifer. This water must be replenished during the recharge season --approximately mid-fall to mid-spring. For this to be accomplished total annual pumpage must not exceed total annual recharge;
Annual precipitation in the area is about 35 inches, of which as much as 17 inches (570 gpm per square mile) may infiltrate into the ground and reach the water table. The area tributary to the aquifer is about 0.2 to 0.3 square mile so that annual recharge from precipitation is probably in the range of about 100 to 170 gpm.
Additional recharge may be available from stream infiltration. The water table in the valley was found to be below the channel of Putnam Creek and flow measurements indicated that Putnam Creek loses a total of BOO gpm in the 2,500-foot reach downstream from the Hatchery. The alluvium penetrated in test well 5 and observed in several test pits adjacent to t he stream does not appear to be capable of transmitting this quantity of wate r, It seems likely that much of the seepage must somehow be reaching the perme· able beds of the aquifer.
The significance of natural recharge from the stream is that it would occur throughout the year rather than being confined to a recharge season. This means the concept of determining the maximum yield for a 200-day peri a of no recharge is invalid and the perennial yield of the aqu ifer may be considerably greater. Just how much greater cannot be adequately determina unless it is known where the aquifer's natural discharge area is located. Even with stream infiltration, the yield of the aquifer will be 1 imited by the effect of the impermeable boundaries on the d rawdown.
- 12 -
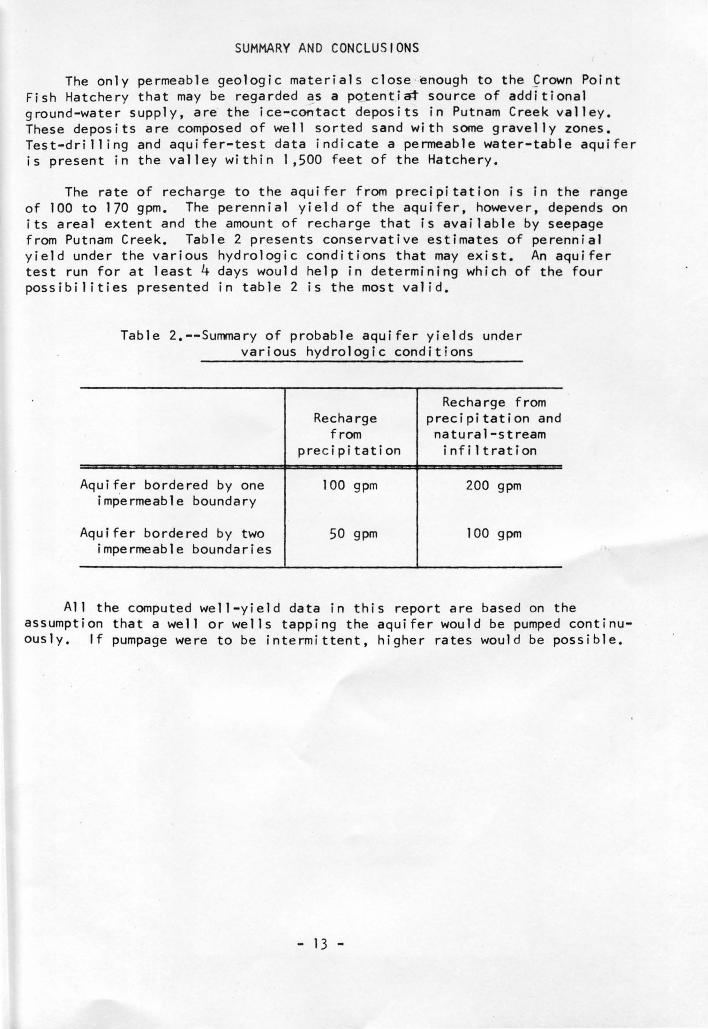
SUMMARY AND CONCLUSIONS
The only permeable geologic materials close ·-enough to the ~rown Point Fish Hatchery that may be regarded ~s a po~entiat source of additional ground-water supply, are the ice-contact deposits in Putnam Creek valley. These deposits are composed of well sorted sand with some gravelly zones. Test-drilling and aquifer-test data indicate a penneable water-table aquifer is present in the valley within 1,500 feet of the Hatchery.
The rate of recharge to the aquifer from precipitation is in the range of 100 to 170 gpm. The perennial yield of the aquifer, however, depends on its areal extent and the amount of recharge that is available by seepage from Putnam Creek. Table 2 presents conservative estimates of perennial yield under the various hydrologic conditions that may exist. An aquifer test run for at least 4 days would help in determining which of the four possibilities presented in table 2 is the most valid.
Table 2.--Summary of probable aquifer yields under various hydrologic conditions
Aquifer bordered by one impermeable boundary
Aquifer bordered by two impermeable boundaries
Recharge from
precipitation
100 gpm
50 gpm
Recharge from precipitation and natura 1-st ream
i n f i 1 t rat i on
200 gpm
100 gpm
All the computed well-yield data in this report are based on the assumption that a well or wells tapping the aquifer would be pumped continuously. If pumpage were to be intermittent, higher rates would be possible.
- 13 -
