tiger human conflicts: investigating ecological and ... human conflicts: investigating ecological...
TRANSCRIPT

Tiger Human Conflicts: Investigating Ecological and
Sociological Issues of Tiger Conservation in the Buffer
Zone of Chitwan National Park, Nepal
Final Report
5 0 5 Kilometers
%U%U%U
%U
%U
%U
%U
%U
%%U
%U%U%U%U%U
%U
%U
%U
%U
%U
%U%U
%U
%U%U
%U
%U
%U
%U%U
%U
%U
%U
%U %U
%U%U%U
%U
%U
%U
%U
%U
%U
%U
%U
%U
%U
%U
%U
%U
%U
%U
%U
%U
%U %U
%U
%U%U%U
%U%U
%U
%U
%U
%U%U%U%U%U
%U %U
%U
%U%U%U%U%U
%U
%U%U
%U
%U
%U
%
%%
%
%
%
%
%
%
%%
%
%
%
%
%
%
%
%
%
Madi ValleyValmiki Tiger
ReserveINDIA
Parsa Wildlife Reserve
Chitwan National Park
Submitted to
WWF-Nepal Program, Kathmandu, Nepal
By
Bhim Gurung*, J.L. David Smith*, Charles McDougal†, Jhamak B. Karki‡
*University of Minnesota
†International Trust for Nature Conservation
‡Department of National Parks and Wildlife Conservation
November 2006

DEDICATION
This report is dedicated to Dr. Tirtha Man Maskey, Mr. Mingma
Norbu Sherpa, Dr. Chandra Prasad Gurung and Mr. Narayan Poudyal
who died on the helicopter crash on September 23, 2006. Their vision,
encouragements, enthusiasm and support made this project a reality. We
thank Mr. Sherpa and Dr. Gurung for their commitment to fund the project
and Dr. Maskey and Mr. Poudyal for endorsement.
We thank them for their dedication and commitment to conserving
the extraordinary natural resources / biodiversity of Nepal. Their
outstanding effort in conservation contributed significantly enhanced
excellence role model for others to emulate. They were respected
conservationists and will be deeply missed by all of us.
i

TABLE OF CONTENTS
DEDICATION i
ACKNOWLEDGEMENTS v
EXECUTIVE SUMMARY viii
INTRODUCTION 1
STUDY AREA 7
Chitwan National Park and its Buffer Zone 7
METHODS AND STUDY DESIGN 10
General Methods and Design 10
Investigation on Humans Killed by Tigers 10
Investigation of Man-eating Tigers Removed by Human 12
Survey of Tiger, Livestock and Human Use of Forests 14
Team Training 14
Data Collection 14
Prey surveys 15
Household Attitude Survey 16
RESULTS 17
Distribution of Humans Killed 17
Problem Tigers Removed by Human 23
Monitoring of tiger prey in Madi Valley 27
Monitoring of tiger and human use in Madi Valley 31
36 Human Attitudes towards Tigers
DISCUSSIONS 39
Intensity of tiger human conflicts 39
Man-eating tiger’s behavior 40
44 Tiger and Prey Abundance in Madi Valley
Human Attitudes toward Tigers 46
47 RECOMMENDATIONS
LITERATURE CITED 51
Appendix: Survey Questionnaires for the Assessment of Human Attitudes 61
ii

LIST OF FIGURES
Figure 1. Study Area: Madi Valley, Chitwan National Park and Buffer Zone .................. 9
Figure 2. The family member of a person killed by a tiger show us the site where the kill
was made. ................................................................................................................ 11
Figure 3. A kill site visit is being shown by a local forest guard accompanied by national
park game scout in Brandabhar Community Forest the site where a man was killed
in March 24, 2001.................................................................................................... 11
Figure 4. Army personnel, game scout, and local “Bagh Heralu” visit a site where a
woman was killed in November 28, 2005 near Baghai Post in the eastern part of
Madi Valley. ............................................................................................................ 12
Figure 5. Bachcha Bhale a young man-eating tiger captured on May 31, 1991 near
Munna Tal inside the Chitwan National Park. The tiger was turned into Kathmandu
zoo and is one of the two surviving man-eating tiger in the zoo. ............................ 13
Figure 6. Sukram Kumal, a senior wildlife technician and naturalist from ITNC revisits
the Harrabas area where Female 118 was darted after she killed a man in 1980. ... 13
Figure 8. Humans killed by tigers in four management units of Chitwan National Park. 17
Figure 7. Locations of humans killed inside the park, buffer zone and beyond............... 18
Figure 9. Number of victims killed per year in and around Chitwan National Park........ 20
Figure 10. Male and female victim activity when killed by tiger..................................... 21
Figure 11. Age distribution of 72 victims of known age by gender ................................. 21
Figure 12. Victims killed during different time of the day............................................... 22
Figure 13. Victims killed at different seasons. ................................................................. 22
Figure 14. Locations where 17 man-eating tigers and other problem tiger’s were removed
................................................................................................................................. 25
Figure 15. Number of tigers removed per year from the park and surrounding areas ..... 24
Figure 16. Tiger prey abundance in Madi Valley............................................................. 28
Figure 17. Ungulate species composition in Madi Valley, Park and Buffer zone............ 30
Figure 18. Locations of tigers and leopards sign in Madi Valley..................................... 33
Figure 19. Number of livestock grazing in Madi Valley.................................................. 34
Figure 20. Human resource use in Madi Valley............................................................... 35
..................... 38 Figure 21. Locations of 400 hh sampled from four VDCs in Madi Valley.
iii
LIST OF TABLES
Table 3. Number of man-eating tigers, age, sex, no. of people killed and disposition 27 Table 4. Removed problem tigers by sex, age, number of victims, disposition from
park (P), buffer zone (BZ) and national forest (NF) ................................................ 23
Table 5a. Physiological and psychological conditions of 17 “man-eating” tigers. .......... 26
Table 5b. Relevant factors in the cases of 17 “man-eating” tigers from table 5a lists. .... 27
Table 6. Prey abundance in the park and buffer zone of Madi Valley ............................. 27
Table 7. Counts and encounter rates in parentheses (no. / km) of livestock and people
seen and tiger and leopard track sets encountered in the Madi Valley. ................... 31
Table 1: Total and sample population of 4 VDC of Madi Valley, Chitwan..................... 56
Table 2: Total and sample population of 4 VDCs by ward numbers in Madi Valley. ..... 56
Table 8: Ethnicity of respondents and total population of Madi ...................................... 57
Table 9: Respondents gender categories .......................................................................... 57
Table 10: Respondents education level ............................................................................ 57
Table 11: Age categories of respondents.......................................................................... 58
Table 12: Respondents tiger sighting ............................................................................... 58
Table 13a: Respondents attitudes towards tiger ............................................................... 58
Table 13b: Respondents reasons for liking tiger in the neighboring forests .................... 58
Table 13c: Respondents reason for not liking tiger in the neighboring forests ................ 59
Table 14a: Respondents attitudes towards tiger ............................................................... 59
Table 14b: Respondents reasons for liking tiger in the community forests ..................... 59
Table 14c: Respondents reason for not liking tiger in the community forests ................. 59
Table 15: Respondents opinion about tiger protection..................................................... 60
iv

ACKNOWLEDGEMENTS
We would like to convey our sincere gratitude to the organizations and
several individuals for supporting this project, without their assistance this report
would not have been completed.
The Project was funded by WWF-Nepal Program (STF/NFWF grant),
International Trust for Nature Conservation, The Fund for The Tiger, and Steve /
Mary Swig. Particularly we would like to acknowledge, late Mr. Mingma Norbu
Sherpa, Managing Director of the Eastern Himalayas Ecoregion Complex at
WWF-US, and late Dr. Chandra Prasad Gurung, Country Representative, WWF-
Nepal for initially approving the proposal for funding. Similarly, Dr. Sarala
Khaling, former Director of Research and Monitoring, WWF-Nepal and Mr. Anil
Manandhar, Director of Conservation Program, WWF-Nepal for their continual
assistance throughout the project period. We would also like to thank Mr. Brian
Wierum, Chairman of The Fund for the Tiger, for constant support in tiger
conservation work in Nepal. Additionally, we would like to recognize Mr. / Mrs.
Swig, a long time friend for providing financial support in completing this report.
We wish to thank late Dr. Tirtha Man Maskey and late Mr. Narayan
Poudyal, former Director Generals, Mr. Shyam Bajimaya, Acting Director
General and his colleagues in the Department of National Parks and Wildlife
Conservation, for support, encouragement and permission to conduct this work.
We also acknowledge the support of Mr. Shiv Raj Bhatta, and Mr. Tikaram
Adhikari, Chief Wardens of Chitwan National Park and their administrative staffs.
We especially thank Mr. Bishnu Thapathalia, Mr. Raju Ghimire, Mr. Tikaram
v

Poudyal, and Mr. Chij Kumar Shrestha, for their help and coordination.
Furthermore, we would like to acknowledge the facilitation of Commanding
Officer, Colonel Ajit Thapa, and his army officers and staffs for supporting our
project in Chitwan National Park.
We are also grateful to the chairman of the Buffer Zone User Committee
in Madi Valley, namely, Mr. Mathura B. Bhandari (Ayodhyapuri), Mr. Shyam B.
Bista (Kalyanpur), Mr. Madhav Chapagai (Baghauda) and Mr. Narayan Datta
Sapkota (Gardi). We would also like to extend our appreciation to household
questionnaire survey assistants, namely Mrs. Krishna Maya Baral, Mr. Ghan
Shyam Poudyal, Mr. Surya Khanal, Mr. Surya Battarai, Mr. Baliram Choudhary,
Mr. Raj Kishor Choudhary, Mr. Krishna Prasad Choudhary, and Mr. Chudamani
Poudyal. Similarly, we are grateful to buffer zone community forest guards,
Karna Upretti, Dal Bahadur Khatri, and Durga P Sapkota for their help in
collecting data.
We are thankful to the International Trust for Nature Conservation’s
technicians Hari Prasad Choudhary, Indra Bahadur Kumal, Baburam Mahato and
Raju Kumal for their dedicated assistance in collection of field data. Likewise, we
are grateful to Dhan Bahadur Tamang and Sukram Kumal for sharing their
experiences dealing with man-eating tigers.
We appreciate the help of Mr. Lal Kaji Gurung, Project Director of the
Nepal Trust for Nature Conservation’s Biodiversity Conservation Center. We are
thankful to Senior Wildlife Technician of the trust, Bishnu Lama and Harka Man
Lama, and also, Mrs. Sarita Gnawali, curator of Kathmandu Zoo, for providing
vi

data on captured man-eating tigers.
Finally, we wish to acknowledge the University of Minnesota’s,
Conservation Biology Graduate Program and Department of Fisheries, Wildlife
and Conservation Biology for partial funding. Dr. Kristen Nelson provided
valuable help in developing the attitude survey questionnaire and data analysis.
Likewise, Dr. Terilyn Allendorf, Consultant, Biodiversity and Human Dimensions
of Natural Resources, helped in the development of the survey questionnaire. Dr.
Anup Joshi and Mr. Adam Barlow comments improved the manuscript.
Also, we would like to thank all the friends and well wishers of tigers who
support such conservation works, particularly, Dieter and Liz Gutmann.
vii

EXECUTIVE SUMMARY
Historically, there was contiguous forest all across the terai region of
Nepal and tigers were distributed in high densities. The situation changed during
early 1960s because the tiger habitat in the terai was drastically reduced as a result
of human resettlement program. The destruction of habitat and fragmentation lead
to the sharp decline in tiger population. Sport hunting and poaching also
contributed to its decline. Like other tiger range countries Government of Nepal
worked to overcome this crisis since early 70s. Protected areas were established,
strict protection was adopted, and stiffer wildlife laws against wildlife criminals
were endorsed. To further increase the land base for tigers buffer zone community
forests around the parks and reserves were promulgated and moreover, Nepal
initiated an ambitious Tarai Arc Landscape project not only to increase land base
for tigers but also to restore connectivity between reserves.
Tiger conservation effort in Nepal has been successful. After
establishment of protected areas in the early 1970s tiger numbers increased and
since late 1970s numbers have been stable in protected areas. Density, based on
mean female home range size, is the highest anywhere. The improvement of
habitat quality in the buffer zone of Chitwan National Park and elsewhere across
the terai has increased the overall land base where tigers reside. Breeding has
been recorded at five sites outside of protected areas.
Such increase in habitat use by tigers in the multiple use buffer zone
community forests resulted in conflict between tiger and human. Over the last
quarter of a century 88 people have been killed by tigers in and around the park.
viii
The trend of human loss has been increased significantly from an average of 1.5
persons per year (1979 – 1998) to 8.25 per year since 1999. The increasing trend
of people killed was significant in the buffer zone but not inside the park. A total
of 37 tigers were involved in killing 88 people. Of these, 17 were removed
because of their man-eating behavior. The number of problem tigers removed per
year increased dramatically in 2004-05. Four relevant factors were associated
with man-eating tigers: (1) injured or aged tigers find it difficult to kill natural
prey, (2) imbalance between tiger and prey base, (3) aggressive tiger behavior
and, (4) defensive or accidental killing. Management actions were not taken
against if it appeared that tigers killed humans accidentally; however, if possible
the tigers that turned into deliberate “man-eaters” were removed.
A high percentage (38%) of humans killed by tigers occurred in the south
sector of the park, i.e. Madi Valley. This study focused on the status of tigers and
its prey in Chitwan National Park and in the Madi Valley buffer zone. Tiger and
prey were relatively more abundant in the park than buffer zone. However, the
disturbance factors, measured as encounter rate of livestock and human were
significantly higher in the park than the buffer zone. Reduced human activity in
the buffer zone as compared to the park is because there is a stronger incentive to
local people to control local use of buffer zone forest.
Support of local people is critical in tiger conservation in the human
dominated landscape. To understand the perceptions of Madi population towards
tigers and its conservation, a household questionnaire survey was conducted.
Majority of the people in Madi valley did not like tigers in the neighboring forests
ix

because of threat to people and livestock. However, just less than half of the
people liked tigers because of ecological, utilitarian, and moral values.
To mitigate the conflict the study recommends establishing a system to
regularly monitor tigers in cooperation with the local “Bagh Heralus” attached to
each community forestry user committee. Each committee in cooperation with
Park staff would supervise the “Bagh Heralu” and the overall goal of the tiger and
prey monitoring program would be to understand the activity pattern of tigers
living in the buffer zone, implement a tiger conservation awareness program
designed to educate local people on tiger biology and research, and to create a
problem tiger response team to act immediately and efficiently to assist in conflict
situations.
Local participation between local user groups in Madi valley and park
staffs is also needed to reduce grazing along the southern border of the park.
x

INTRODUCTION
Until the turn of the 20th century, the tiger (Panthera tigris) ranged widely
throughout Asia, including the Caspian region in the west into the Indian
subcontinent, the far east of Russia, southeast Asia and the Sunda Islands. Its
population sharply declined during the late 20th century primarily due to habitat
destruction and fragmentation, sport hunting, and eradication of problem tigers by
various means (McDougal 1987). Tiger habitat has now shrunk to < 5% of its
historical distribution and three tiger sub-species have gone extinct.
Approximately, 5000 to 7000 tigers estimated in the mid 1990s survive in the
wild (Jackson 1997) and the numbers have declined in India, Cambodia, Vietnam
and elsewhere in the past 10 years. Furthermore, tigers are distributed in small
isolated populations and the consequence of small population size in long term
viability is poorly understood.
A tiger requires large areas of undisturbed habitat and abundance of wild
prey species. It cannot be saved in a small and isolated fragmented habitat (Smith
et al.1987, 1998). This requirement of tigers led tiger biologists and
conservationists to design a framework that identified key areas for tiger
conservation (Dinerstein et al. 1997). Nepal’s terai was identified as one of the
pristine habitat for long term tiger conservation in the Indian sub-continents.
The government of Nepal has been actively working towards the
protection and conservation of the Royal Bengal tiger (Panthera tigris tigris) one
of the six (Luo et al. 2004) surviving sub-species for the last four decades. It is
estimated approximately 120 breeding adults inhabit the four protected areas in
1

the lowland of Nepal (Smith et al 1999). Additionally, unknown numbers of
breeding and dispersing tigers are distributed widely in the unprotected forest
region of the terai (Gurung 2002).
Historically, there was contiguous forest all across the terai region of
Nepal and tiger density was relatively very high (Smythies 1942). For example,
during one hunt in 1938-39 organized in Chitwan 120 tigers were killed
(Smythies 1942). Despite these large hunts, tiger numbers recovered and stayed
stable in part because habitat remained intact. Hunts were organized only every
few years, providing time for the population to recover. However, the situation
changed during early 1960s because the tiger habitat in the terai was drastically
reduced due to habitat loss and fragmentation as a result of a government
sponsored human re-settlement program (Gurung 1983, Pradhan and Parks 1995).
Hunters and settlers not only cleared the forest for agriculture, but also ruthlessly
persecuted tigers to a critically low in the early 1970s.
To overcome this crisis the government of Nepal enacted the National
Park and Wildlife Conservation Act 2029 in 1972. As a result of the act Chitwan
National Park (CNP) the first protected area in Nepal, was created in 1973.
Throughout 1970s and 1980s four other parks and reserves were created in the
terai. Strict protection was adopted inside the parks and reserves to stop the
alarming loss of forests and to recover populations of tiger, their prey, rhinoceros
and other endangered wildlife species. Additionally, many villages occurring
within parks were resettled to the periphery (Gurung 1983, Dhakal 2006). To
further increase the land base for tigers and to decrease the human pressure on the
2
park, buffer zone community forestry around the parks and reserves were
promulgated in 1996 (DNPWC / MFSC 1999, Dinerstein et al. 1999). Based on
the small population sizes of tigers in Chitwan, Bardia and other terai tiger
populations, Smith et al. (1998) advocated a metapopulation approach to tiger
management. The goal was to re-establish the potential for dispersal and thus
genetic exchange and demographic rescue. This recommendation lead to the
creation of the Terai Arc Landscape (TAL) project (WWF 2001), in which the
government of Nepal initiated an ambitious landscape scale project to increase the
land base for tigers (Smith et al 1999) and restore connectivity between reserves
(Wikramanayake et al. 2004).
A specific goal of TAL is to re-establish historical forest connectivity by
restoring degraded national forest lands. Currently, the geographic structure of
tigers in the Himalayan lowlands is a series of isolated or semi-isolated
populations extending from Parsa Wildlife Reserve in the east to Corbett Tiger
Reserve ~ 750 km to the west (Smith et al 1998, WWF 2001). TAL is working
towards landscape forest restoration through community forestry and forest
restoration. The goal is not only to increase the land base for tigers but also to
benefit local people by restoring ecological services and economic benefits that
these forests once provided.
To provide a scientific basis for tiger management the Smithsonian
Institution and the Nepalese Government established the Smithsonian Tiger
Ecology Project. The initial research team was composed of John Seidensticker
and Kirti Man Tamang. Mel Sunquist, James L. David Smith and Hemanta
3

Mishra followed in that order and in 1983 Smith and Mishra drew up a plan to
create Parsa Wildlife Reserve (Smith 1984). The Smithsonian Tiger Project
stimulated a long term tiger and tiger prey research effort initiated by
Seidensticker (1976) and McDougal (1977) and continued by Sunquist (1981),
Tamang (1982), Smith et al (1983, 1984, 1987, 1989, 1991, 1998, 1999), Mishra
(1982), Dhungel (1985), Ahearn et al (1990, 2001), Ahearn and Smith (2005). In
early 80’s a long term tiger monitoring (LTTM) project was initiated under the
auspices of the Smithsonian Institution and was financially supported by
International Trust for Nature Conservation (ITNC). The LTTM project used
pugmark methodology and camera trapping (Barlow 2004).
These scientific studies cataloged behavior, life histories (Seidensticker
1976, McDougal 1977, Seidensticker and McDougal 1993), social structure
(Sunquist 1979, 1981, Smith et al 1987, Sunquist and Sunquist 1988), impact on
prey (Tamang 1982), communication (Smith et al. 1989), life time reproduction
(Smith and McDougal 1991), dispersal (Smith 1993) and poaching (Kenny et al.
1995).
In spite of encouraging trends in creating and expanding tiger habitats and
gaining ecological knowledge on tiger biology, poaching became a serious threat
in the early 1990s as a result of new opportunities to sell bones and skin. Poaching
of tigers was first noticed in CNP when few resident tigers suddenly disappeared
from the study area of LTTM project. When tigers are killed and bones/skin
removed there is little evidence of poaching. Nearly every part of the tiger is used
in traditional Chinese medicine or in Asian folk remedies (Hemley and Mills
4

1999). Tiger bones have high demand and are mainly used for the treatment of
rheumatism (Mills and Jackson 1994). Similarly, skins are highly prized for
fashionable cloths and decorations. The government of Nepal took serious action
to combat poaching by establishing anti-poaching units, information networks and
a reward scheme. Additionally, the existing wildlife laws were amended by
increasing fines and jail sentences from 5 years to 15 years for the wildlife
criminals. The chief warden of the park was given the complete judiciary
authority to punish the poachers and traders.
In addition to poaching, there is a serious problem of tiger human conflicts
in the vicinity of CNP. The number of humans killed by tigers has dramatically
increased from 1 - 2 per year prior to 1997 to 6.5 per year since that time
(McDougal et al 2005). Man eating is the ultimate expression of human-tiger
conflict and is a phenomenon that has proved difficult to explain from an
ecological perspective. To date, most data on man-eating in Nepal is based on
anecdotal observation (McDougal 1987). With forest restoration in the buffer
zone of the parks and across TAL tiger numbers residing outside of park are
increasing. Given the small size of tiger population in the protected areas the
increased number of tiger living, and breeding outside of protected areas is a step
toward increasing long term viability of Nepal’s tiger populations. However,
increased human killing by tigers, especially around CNP has the potential of
creating a back lash against tigers. The TAL-Nepal strategy plan (2004-2014)
(HMGN/MFSC, 2004) and the draft of 2nd Nepal Tiger Action Plan (2006) have
identified human wildlife conflict as one of the direct causes of biodiversity loss
5

in the TAL region. The success of TAL’s goal (to re-establish connectivity and
use of corridor habitat by tigers) will depend to a large extent on mitigating tiger
human conflict. In Nepal conservationists in and outside of the government are in
agreement that this conflict must be addressed in a participatory process in which
local people and the government work as a management team.
This research was undertaken to investigate systematically the ecological
factors and sociological aspects of man-eating. Understanding both ecological and
sociological aspects of man-eating will help park staff and local villagers to
formulate management plans to reduce this conflict. Our study had the following
objectives. 1) Map the distribution of human kills and tiger depredation, 2)
establish a scientifically rigorous monitoring system for measuring prey
abundance, 3) conduct baseline recce surveys to measure encounter rate of tiger
sign, livestock grazing and other human forest use, 4) evaluate human attitudes
towards tigers living in their area, and 5) formulate a plan to reduce man-eating.
6

STUDY AREA Chitwan National Park and its Buffer Zone
The CNP was declared the first national park in 1973 and also designated
a world heritage site by UNESCO in 1984. The park is situated in the south
central part of Nepal. It is an inner terai or dun valley that occurs between the
Siwalik outer range and the Mahabharat Range or “Middle Hills”. This valley and
its upper slope are inhabited by many large endangered wildlife species including
tigers, Asian one horned-rhino (Rhinoceros unicornis), Asiatic elephant (Elephas
maximus), Gaur (Bos gaurus), Gangetic dolphin (Platanista gangetica) and
Gharial crocodile (Gavialis gangeticus).
Initially the park area was 544 km², which was later extended to the
present size of 1040 km² in 1977. In 1996 a buffer zone was officially declared. It
consisted of 750 km² of which 55% was agricultural land and 45% community
forests (DNPWC and PPP 2000). Two protected areas Parsa Wildlife Reserve to
the east and Valmiki Tiger Reserve to the south in India are adjacent to CNP and
together they support one of the largest tiger populations in South Asia
(Wikramanayake et al. 1998).
Madi Valley, on the southern border of CNP is a “dun” valley formed by
the bifurcation of the Siwalik Hills. The south of Someshwor ridge forms the
boundary of the buffer zone community forestry and also is the international
boundary with India (Figure 1). The Someshwor range is a complex of deep
ravines and steep slopes, with highest peak reaching an altitude of 870 m. The
Churia range lies north of Madi inside the park and extends westward and
7

gradually loses height from 750 m on the eastern boundary to its western
extremity near Bankatta Post. It meets with Someshwor ridge extending from
south forming the narrow gorge of Reu River where the Reu exits Madi Valley.
The buffer zone forests in the Madi Valley watershed encompass 45% of the
entire buffer zone forest surrounding CNP (DNPWC and PPP 2000). These Madi
community forests, lying to the south of cultivation lands, are comprised of 112
km² forests dissected by deeply eroded streams. The Reu River originates the
tributaries that arise in the Someshwor and Churia ranges. This complex of
streams provides critical water sources for ungulates as well as human
populations in Madi Valley.
The Valley has been home to the ethnic group of Tharu people for
hundreds of years until government of Nepal opened the area for other immigrants
in early 50’s. Since then thousands of hill immigrants have settled in the Madi
Valley and they now outnumber the Tharu inhabitants. The 2001 census shows
there were 39,314 people using 7211 ha of cultivated lands. The Valley is divided
into four VDCs administrative units: Ayodhyapuri, Kalyanpur, Baghauda and
Gardi (Figure 1).
8

<< <
<
<
<
<
<
5 0 5 Kilometers
N
VDC BoundaryPark Boundary
< International Boundary Pillar
Valmiki Tiger Reserve India
India
Chitwan National ParkBuffer Zone
Chitwan National ParkGardi
Baghauda
Kalyanpur
Ayodhyapuri
Buffer Zone Community Forests
Reu River
Reu River
Reu River
Dabuwa Khola
Mugai Khola Ghang
ar K
hola
Madi Valley
Figure 1. Study Area: Madi Valley, Chitwan National Park and Buffer Zone
9

METHODS AND STUDY DESIGN General Methods and Design
Data on incidences of man-eating was collected from the park and all its
surrounding buffer areas from December 2005 to June 2006. Data on tiger and prey
abundance, livestock and human use of forests, and human attitude survey was collected
from only the Madi Valley watershed including the buffer zone community forest in the
south side of Madi Valley and the south slopes of the Churia (in the park) on the north
side of Madi Valley.
Tiger abundance, livestock and human use of forests surveys were conducted
during December 2005 to March 2006. The prey transect was conducted in April, and
finally, a human attitude survey was conducted during the month of May and June 2006.
Investigation on Humans Killed by Tigers
Data on humans killed by tigers were obtained from various sources. Anecdotal
data were gathered from the literatures, reports, newspapers, park records (RCNP 2004),
and individuals (C. McDougal, B. Lama, H. Lama, D.B. Tamang, S. Kumal) who have
been working on tiger monitoring in the park for 30 years or more. Information on
victim’s age, gender, victim’s activity, and the time of incidence was verified by visiting
each victim’s family or a close relatives or person present at the time of the incidence. In
the company of either the victim’s family members or with the person who was present at
the time (Figures 2, 3 and 4) each kill site was visited; Global Positioning System (GPS)
locations, altitude, and vegetation type at the scene were recorded.
10

Figure 2. The family member of a person killed by a tiger show us the site where the kill was made.
Figure 3. A kill site visit is being shown by a local forest guard accompanied by national park game scout in Brandabhar Community Forest the site where a man was killed in March 24, 2001.
11

Figure 4. Army personnel, game scout, and local “Bagh Heralu” visit a site where a woman was
killed in November 28, 2005 near Baghai Post in the eastern part of Madi Valley.
Investigation of Man-eating Tigers Removed by Human
To investigate the factors that lead to tiger killing human information on the tigers
that were captured or killed was obtained. Reproductive status, gender, age class and
physical condition were recorded. A complete record of problem tigers removed from the
park was obtained from C. McDougal who has worked in the park for more than 30
years. This information was verified from records at the park headquarter, zoo, as well as
from staff of the park and Nepal Trust for Nature Conservation (NTNC). The sites where
a tiger was removed were also geo-referenced and habitat type recorded (Figure 5 and 6).
12

Figure 5. Bachcha Bhale a young man-eating tiger captured on May 31, 1991 near Munna Tal inside the Chitwan National Park. The tiger was turned into Kathmandu zoo and is one of the two surviving man-eating tiger in the zoo.
Figure 6. Sukram Kumal, a senior wildlife technician and naturalist from ITNC revisits the Harrabas area where Female 118 was darted after she killed a man in 1980.
13

Survey of Tiger, Livestock and Human Use of Forests
Team Training
To obtain data on livestock and human use of park and community forest we
trained staff from the ITNC, the park and local villagers hired as “Bagh Heralu” (Gurung
et al 2006). All the team members received instruction on using the GPS units. They were
also trained to locate and identify tiger pugmarks (McDougal 1999), scent posts and
scats, and to count livestock, and human encounters along the survey routes. Each survey
team consisted of three or more members.
Data Collection From December 2005 to March 2006 recce surveys of tiger sign, livestock
numbers and types of human use were recorded on 58 routes included streams (n=27) and
trails (n=8) and combination of both (n=23). Streams and river beds were chosen because
there were greater chances of seeing tiger signs.
The Madi Valley watershed was divided into two blocks; park and buffer zone.
The park was further divided into four sub-blocks and buffer zone into two sub-blocks.
Each route survey was started between 9-10 am before human foot traffic obliterated
tiger tracks. The survey normally ended between 4-5 pm. Distance traveled on each
survey route was calculated using Arc View (version 3.3, ESRI, Redlands, CA). GPS
locations were taken for each observation of tiger tracks, tiger scats, livestock observed,
and humans encountered. The data were analyzed as the number of each type of
observation per kilometer walked. Comparison was made between buffer zone and the
park. Tiger scats and tracks along the tiger traveled route were geo-referenced. Encounter
rate of tracks were calculated using the following criteria: 1. a track set that continued
14

along the trail or that vented off and re-entered the trail after short distance was counted
as a single observation, 2. tracks of different ages at the same locality were counted
separately, 3. tracks of different individual tigers based on the size criteria and shape
were counted as separate observations.
Prey surveys
To obtain baseline data on relative prey abundance and compare prey densities
between sites we adopted the approach used by Smith (1984) and Shrestha (2004). The
technique is based on pellet group survey. The pellet group data were collected during the
dry season in the month of April 2006. Transects were selected by systematic sampling in
which survey blocks were well represented. Shrestha (2004) ignored the high ridge tops
and barren areas in his sample but we conducted the survey in the barren areas and ridge
tops to get a better representation of the entire study area. Starting points for each
transects were selected prior to going to the field. At the site, a random compass direction
was selected to avoid potential bias. Each transect or sampling unit (SU) was a 625 m
long, with 25 circular plots spaced 25 m apart. Each plot was 10 m² in size (Smith 1984,
Shrestha 2004). A 10 m² plot was chosen because large plots are difficult to survey in
dense vegetation and difficult to count the pellets accurately.
Within the plot, litter was lightly and carefully raked to observe all the pellet
groups. The detection probability was assumed to be 100%. Pellet groups were
converted into sambar units based on the mean weight of a prey species as follows: gaur
= 4, sambar = 1, wild boar = 0.31, chittal = 0.28, barking deer = 0.11 and monkey = 0.05.
The density of pellet groups is presented as sambar unit/ per plot.
15

Household Attitude Survey
In order to investigate the human attitudes and perception towards tiger a
quantitative household (hh) survey method were used. A total of 8,108 households are
listed as resident in the four VDCs in Madi Valley (2001 Population census). However,
389 hh living outside of the Madi Valley watershed in the Bandarjhula were excluded
from the study because we were interested in the attitude of the people living in the Madi
Valley watershed only. In order to ensure a good representation of the population of
interest (7,719 hh), we first determined to sample 400 hh from the Madi population.
These 400 samples were first stratified according to the proportion of hh in each four
VDCs (Table 1).
All Madi Valley hh were numbered in excel sheet. Random numbers were
generated according to the number of samples to be drawn from each of the four VDCs
(Table 2). The member of hh thus selected was interviewed. The questionnaires were
developed after focus group discussions on tiger and its importance. The questionnaires
were finalized after pilot tested in November 2005. Interviews were conducted to
investigate the household representative’s perceptions towards tigers. Eight local
individuals with university undergraduate degrees were hired and trained to conduct the
survey. All had some survey experiences and were involved in community services in
different ways. Four survey assistants work at the buffer zone user committee office in
Madi VDCs. Other survey assistants included a teacher and social workers active in
community activities. Three of the interviewers were Tharu from two VDCs where 40
percent of the population belongs to their group. They were helpful in translating the
Nepali questionnaire into their language.
16

RESULTS
Distribution of Humans Killed
88 persons were killed by the tigers in and around the CNP between 1979 to June
2006 (Table 3, Figure 7). Out of these, 43 (49%) lost their lives inside the park, 40 (45%)
in the buffer zone and 5 (6%) beyond the buffer zone of the park. More than 38% of all
reported kills occurred in the southern sector / Madi valley of the park (Figure 8).
Approximately 66% of the victims were eaten.
South / Madi38%
East /Sauraha13%
Central / Kasara27%
West / Amaltari22%
Figure 8. Humans killed by tigers in four management units of Chitwan National Park
17

%U%U%U
%U
%U
%U
%U
%U
%U%U%U
%U%U%U%U
%U
%U
%U
%U
%U%U
%U
%U%U
%U
%U
%U
%U%U
%U
%U
%U
%U %U
%U%U%U
%U
%U
%U
%U
%U
%U
%U
%U
%U
%U
%U
%U
%U
%U
%U
%U
%U
%U %U
%U
%U%U%U
%U%U
%U
%U
%U
%U%U%U%U%U
%U %U
%U
%U%U%U
%U%U
%U
%U%U
%U
%U
%U
N
Chitwan National Park and Buffer ZoneBuffer ZonePark
%U Human killed by tigers
5 0 5 Kilometers
Figure 7. Locations of humans killed inside the park, buffer zone and beyond
18

19
Table 3. Number of man-eating tigers, age, sex, no. of people killed and disposition (P.S. Individual tiger is given Nepali name: Bhale for male and Pothi for Female)
Sno Year Tiger ID Sex Age No. of Victim Disposition
1 1979 M119 M Immature 1 Captivity Zoo 2 1980 F118 F Immature 1 Killed 3 1981 M127 M Mature 4 Radio Collared tiger 4 1983 UK F UK 1 No Action 5 1985 Bange Bhale M Mature 3 Captivity Zoo 6 1986 Kanchha Bhale M Old Age 3 Killed 7 1988 Bankatta Pothi F Mature 4 No Action 8 1992 Chepte Pothi F Mature 3 Killed 9 1993 Bachcha Bhale M Immature 1 Captivity Zoo 10 1996 UK UK UK 1 No Action 11 1998 Baghmara Pothi F Old Age 1 Captivity Zoo 12 1998 Nuna Bhale M Old Age 6 Killed 13 1999 Syaulibas Pothi F Immature 1 Captivity Zoo 14 1999 Kantipur Pothi F Mature 2 Poisoned 15 1999 Nagarban Bhale M Immature 1 Relocated 16 2001 Ujeli Pothi F Mature 1 No Action 17 2001 Daunne Bhale M Mature 7 Killed 18 2001 Amp Pothi F Mature 4 No Action 19 2001 Sitalpur Bhale M Immature 5 Killed 20 2001 UK UK UK 1 No Action 21 2002 Tamor Pothi F Old Age 2 Relocated / killed 22 2002 Kujauli Bhale M Mature 1 No Action 23 2003 UK UK UK 1 No Action 24 2003 Bhimle Pothi F Mature 1 No Action 25 2003 UK M Mature 1 No Action 26 2004 Kasara Bhale M Old Age 2 Killed 27 2004 Ayodhyapuri Bhale M Immature 6 Killed 28 2004 UK UK UK 1 No Action 29 2004 UK F Mature 1 No Action 30 2004 Bhagedi Pothi F Mature 5 Killed 31 2004 UK UK UK 2 No Action 32 2004 Ayodhyapuri Pothi F Mature 5 Poisoned? 33 2005 Majurtika Pothi F Mature 2 No Action 34 2005 UK M Immature 3 Unsuccessful capture 35 2005 Madi Bhale M Mature 2 No Action 36 2005 UK UK UK 1 No Action 37 2006 UK F Mature 1 No Action Male 15 46 Female 16 35 Unknown 6 7 Total Tigers 37 Victims 88

In Chitwan the number of man-eating cases has increased significantly over the
years (Figure 9). On average 1.5 persons per year was killed between 1979 to 1998.
However, since 1999 number of victims killed has significantly increased to 8.25 per
year. Number of victims inside the park and in the buffer zone was regressed separately
with years. The increasing trend of people killed were significant for the buffer zone
(p=0.002). However, the upward trend of human killing inside the park is not significant
(p = 0.143).
1.42.0
0.81.6
6.2
13.5
0
2
4
6
8
10
12
14
16
1979-83 1984-88 1989-93 1994-98 1999-03 2004-05
Year
No.
of v
ictim
s pe
r ye
ar
Figure 9. Number of victims killed per year in and around Chitwan National Park
About half the kills occurred, when people were collecting grass / fodder for their
livestock (Figure 10). Tigers killed 5 people (6%) at home while sleeping at night. About
60% of the victims were men.
20

0
5
10
15
20
25
30
Grass/Fodd
er
Fuelw
ood
Herding
Fishing
By Hou
se N
TFP
Walking
Toilet
Activites
No. o
f vic
tims
MaleFemale
Figure 10. Male and female victim activity when killed by tiger
Youngest victim was 4 yrs old girl killed at home and oldest was 70 yrs old man
killed collecting fodder for the goats. However, 50% of the victims were aged between
31-50 yrs old presumably people of that age group go to the forest in greater numbers
than other aged group (Figure 11).
0
2
4
6
8
10
12
14
0-10 11-20 21-30 31-40 41-50 51-60 61-70
Age
No. o
f vic
tims
MaleFemale
Figure 11. Age distribution of 72 victims of known age by gender
21
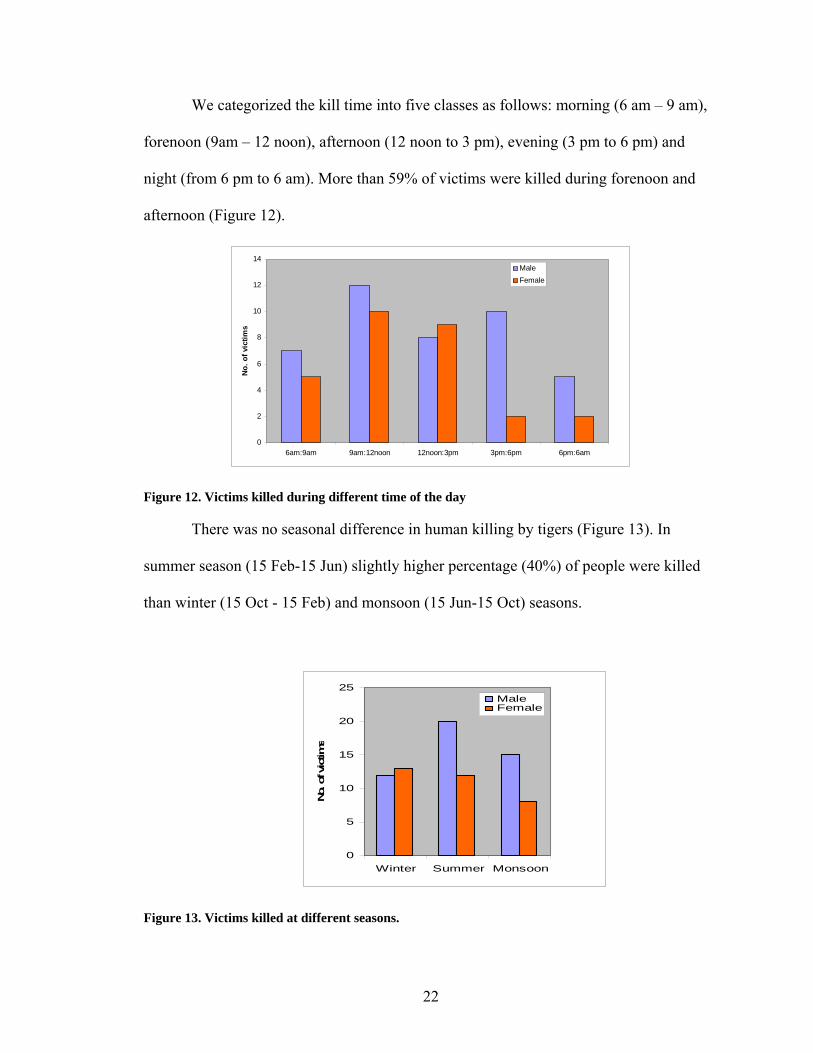
We categorized the kill time into five classes as follows: morning (6 am – 9 am),
forenoon (9am – 12 noon), afternoon (12 noon to 3 pm), evening (3 pm to 6 pm) and
night (from 6 pm to 6 am). More than 59% of victims were killed during forenoon and
afternoon (Figure 12).
0
2
4
6
8
10
12
14
6am:9am 9am:12noon 12noon:3pm 3pm:6pm 6pm:6am
No.
of v
ictim
s
MaleFemale
Figure 12. Victims killed during different time of the day
There was no seasonal difference in human killing by tigers (Figure 13). In
summer season (15 Feb-15 Jun) slightly higher percentage (40%) of people were killed
than winter (15 Oct - 15 Feb) and monsoon (15 Jun-15 Oct) seasons.
0
5
10
15
20
25
Winter Summer Monsoon
No.
of v
ictim
s
MaleFemale
Figure 13. Victims killed at different seasons.
22
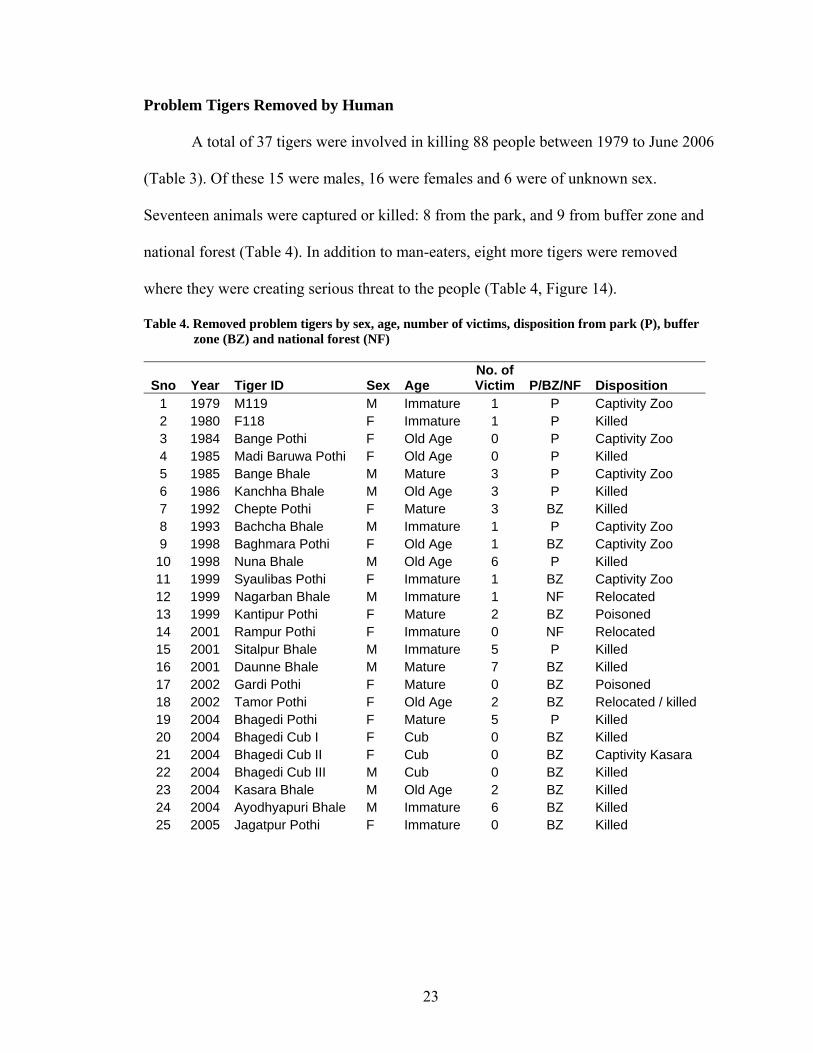
Problem Tigers Removed by Human
A total of 37 tigers were involved in killing 88 people between 1979 to June 2006
(Table 3). Of these 15 were males, 16 were females and 6 were of unknown sex.
Seventeen animals were captured or killed: 8 from the park, and 9 from buffer zone and
national forest (Table 4). In addition to man-eaters, eight more tigers were removed
where they were creating serious threat to the people (Table 4, Figure 14).
Table 4. Removed problem tigers by sex, age, number of victims, disposition from park (P), buffer zone (BZ) and national forest (NF)
No. of VictimSno Year Tiger ID Sex Age P/BZ/NF Disposition
1 1979 M119 M Immature 1 P Captivity Zoo 2 1980 F118 F Immature 1 P Killed 3 1984 Bange Pothi F Old Age 0 P Captivity Zoo 4 1985 Madi Baruwa Pothi F Old Age 0 P Killed 5 1985 Bange Bhale M Mature 3 P Captivity Zoo 6 1986 Kanchha Bhale M Old Age 3 P Killed 7 1992 Chepte Pothi F Mature 3 BZ Killed 8 1993 Bachcha Bhale M Immature 1 P Captivity Zoo 9 1998 Baghmara Pothi F Old Age 1 BZ Captivity Zoo
10 1998 Nuna Bhale M Old Age 6 P Killed 11 1999 Syaulibas Pothi F Immature 1 BZ Captivity Zoo 12 1999 Nagarban Bhale M Immature 1 NF Relocated 13 1999 Kantipur Pothi F Mature 2 BZ Poisoned 14 2001 Rampur Pothi F Immature 0 NF Relocated 15 2001 Sitalpur Bhale M Immature 5 P Killed 16 2001 Daunne Bhale M Mature 7 BZ Killed 17 2002 Gardi Pothi F Mature 0 BZ Poisoned 18 2002 Tamor Pothi F Old Age 2 BZ Relocated / killed 19 2004 Bhagedi Pothi F Mature 5 P Killed 20 2004 Bhagedi Cub I F Cub 0 BZ Killed 21 2004 Bhagedi Cub II F Cub 0 BZ Captivity Kasara 22 2004 Bhagedi Cub III M Cub 0 BZ Killed 23 2004 Kasara Bhale M Old Age 2 BZ Killed 24 2004 Ayodhyapuri Bhale M Immature 6 BZ Killed 25 2005 Jagatpur Pothi F Immature 0 BZ Killed
23

There has been a striking increase in problem tiger removal from the buffer zone
and park since 1999 (Table 4). Number of tigers removed per year increased dramatically
in 2004-05 (Figure 15). Out of 25 problem tigers fifteen were removed from the buffer
zone / national forests and 10 from the park. Of all the problem tigers 60% (n=15) were
killed, 24% (n=6) were captured and kept in captivities and 16% (n=4) were captured and
released at different locations inside the park.
0.4
1.0
0.4 0.4
1.6
3.5
0
0.5
1
1.5
2
2.5
3
3.5
4
1979-83 1984-88 1989-93 1994-98 1999-03 2004-05
Years
No.
of t
iger
s re
mov
ed /
year
Figure 15. Number of tigers removed per year from the park and surrounding areas
The relevant factor of man-eating was assessed from the 17 man-eating tigers
(Table 5a). Nine of those tigers were impaired due to old age, fight with other tigers or
gunshot wound (Table 5b). Aged, mature, and immature tigers fell into this category.
Three of the victims killed in the house were by two aged tigers. Ten of the removed
man-eating tigers were living in the low prey density, sub-optimal and marginal habitats.
All three age class tigers belonged to this category. Aged tigers are displaced into the
marginal and sub-optimal habitats by the stronger opponent tigers due to territorial fight.
24

%U
%U
%U%U
%U
%U
%U
%U
%U
%U
%U
%U
%U
%U
%U
%U
%U
%U
%U
%U
%UDaunne Bhale
119 Bhale
118 PothiNuna BhaleBange Bhale
Tamor Pothi
Chepte Pothi
Rampur Pothi
Kasara Bhale
Kanchha Bhale
Bachcha Bhale
Bhagedi PothiBaghmara Pothi
Kantipur Pothi
Nagarban Bhale
Sitalpur Bhale
Jagatpur Pothi
Syaulibas Pothi
Madi Baruwa Pothi
Ayodhyapuri Bhale
N
5 0 5 Kilometers
Chitwan National Park and Buffer ZoneBuffer ZonePark
%U Problem Tigers Removed
Figure 14. Locations where 17 man-eating tigers and other problem tiger’s were removed
25

Mature females with cubs could have food limited as grown up cubs requires
almost the equal amount of food as adults (Table 5a). Immature tigers are dispersal and
often reside in the sub-optimal habitat when prime habitats are occupied by the resident
individuals. Two immature male (Sitalpur Bhale and Ayodhyapuri Bhale) in this category
killed 11 people in Madi and Chepte Pothi females with cubs killed 3 people. It is
straightforward to understand why impaired or starving tigers killed people because of
hunger, they are unable to hunt natural prey. However, it is difficult to explain why tigers
without disabilities, and living in a high prey base area kill people. We categorized such
man-eating tigers as aggressive. Such aggressive behavior was observed during the man-
eating incident or darting operations (Table 5b).
Table 5a. Physiological and psychological conditions of 17 “man-eating” tigers. (* Female with 2 large cubs and ** female with 3 cubs)
Age category
Physiological/ Sno. Tiger ID Sex Psychological State Habitat
1 Male 119 M Immature Impaired Prime 2 Female 118 F Mature Aggressive Prime 3 Bange Bhale M Mature Impaired Prime 4 Kanchha Bhale M Aged Impaired Prime 5 Chepte Pothi* F Mature Not Impaired Sub-optimal 6 Bachcha Bhale M Immature Aggressive Prime 7 Baghmara Pothi F Aged Impaired Sub-optimal 8 Nuna Bhale M Aged Impaired Prime 9 Kantipur Pothi F Mature Not Impaired Sub-optimal 10 Syaulibas Pothi F Immature Impaired Sub-optimal 11 Nagarban Bhale M Immature Not Impaired Sub-optimal 12 Sitalpur Bhale M Immature Not Impaired Sub-optimal 13 Daunne Bhale M Mature Impaired Sub-optimal 14 Tamor Pothi F Aged Impaired Prime 15 Kasara Bhale M Aged Impaired Sub-optimal 16 Bhagedi Pothi** F Mature Not Impaired Sub-optimal 17 Ayodhyapuri Bhale M Immature Aggressive Sub-optimal
26

Table 5b. Relevant factors in the cases of 17 “man-eating” tigers from table 5a lists.
Impaired by age / injury
Sub-optimal habitat
Usually aggressive Tiger
Aged tiger 5 2 0 Mature 2 4 1 Immature 2 4 2 Total 9 10 3
Monitoring of tiger prey in Madi Valley
We established 54 permanent (geo-referenced) preys transects (Table 6, Figure
16) in the Madi Valley watershed. Nineteen transects are in the buffer zone and 35 inside
the park which are further divided into sub-blocks (5 sub-blocks inside the park and 3
sub-blocks in the buffer zone), covering an area of 281 km² (Table 6, Figure 16).
Tiger prey was relatively more abundant in the park than buffer zone forests
(Table 6). However, one of the park block (Pandunagar) lying to the south of Madi had
an equal prey abundance (0.27) as Paurai and Reu blocks in buffer zone. Relatively low
prey abundance was observed in Mugai khola block (0.03) in the buffer zone compared
to other blocks.
Table 6. Prey abundance in the park and buffer zone of Madi Valley
Mean Sambar
unit Area
Sno Block Name (sq km) No. Transect STDEV 1 Mugai Khola 39 6 0.03 0.03 2 Paurai Khola 41 7 0.27 0.18 3 Reu 39 6 0.27 0.19
Buffer Zone 119 19 0.19 0.09 4 Baghai 53 7 0.69 0.40 5 Ghanger 37 8 0.42 0.16 6 Bankatta/Dhoba 18 8 0.43 0.12 7 Bote Simara 31 8 0.53 0.29 8 Pandunagar 23 4 0.27 0.29
Park 162 35 0.47 0.11
27

%U
%U
%U
%U
%U
%U
%U
%U%U%U
%U
%U
%U
%U
%U
%U
%U
%U
%U
%U
%U
%U
%U
%U
%U
%U
%U
%U %U
%U
%U
%U
%U
%U
%U
%U
%U%U
%U
%U
%U
%U
%U
%U
%U
%U
%U%U
%U
%U
%U
%U
%U
%U
Baghai Block
Reu Block
Ghanger Block
Paurai KholaBlock
Mugai KholaBlock
Bote SimaraBlock
Pandu Nager Block
Bankatta Dhoba Block
Survey BlocksPark Boundary
Prey Abundance%U 0 - 0.1%U 0.1 - 0.28%U 0.28 - 0.48%U 0.48 - 0.82%U 0.82 - 1.41
N
5 0 5 Kilometers
Madi Valley
Figure 16. Tiger prey abundance in Madi Valley
28

Sambar (34%) and chital (48%) pellet group dominated the prey species composition
inside the park (Figure 17). However, in the buffer zone sambar (49%) remained
dominated but chital (8%) composition was relatively low than the park. Domesticated
livestock (cow and water buffalo) contributed 1% in the park and 3% in the buffer zone.
29

Madi Valley
Chittal40%Samber deer
37%
Gaur1%
Monkey9%
Wild boar3%
Livestock1% Barking deer
9%
Park
Chittal48%
Samber deer34%
Gaur1%
Monkey6%
Wild boar3%
Livestock1%
Barking deer7%
Buffer Zone
Barking deer16%
Chittal8%
Samber deer49%
Gaur0%
Monkey22%
Wild boar2%
Livestock3%
Figure 17. Ungulate species composition in Madi Valley, Park and Buffer zone
30

Monitoring of tiger and human use in Madi Valley
Table 7 summarizes the results of routes surveyed related to number of kilometers
walked, number of tigers and leopard track sets observed, livestock and human
encountered. Encounter rate for tiger and leopard track sets are calculated by adding the
total number of independent track sets divided by the total km walked. Similarly,
encounter rate for livestock and people as a disturbance factors are calculated by totaling
number of livestock and people seen divided by total distance walked.
Table 7. Counts and encounter rates in parentheses (no. /km) of livestock and people seen and tiger and leopard track sets encountered in the Madi Valley.
No. of
route
Tiger track Area
km² Km
walkedLeopard track set Block Livestock People set
Ayodhyapuri 77 13 72 83 (1.15) 91 (1.26) 7 (0.10) 15 (0.21) Mugai Khola 49 12 65 16 (0.25) 295 (4.54) 9 (0.14) 8 (0.12) Pandunagar 25 4 25 35 (1.40) 76 (3.04) 3 (0.12) 9 (0.36) Dhoba 44 9 66 1557 (23.59) 331 (5.02) 6 (0.09) 3 (0.05) Ghanger 36 9 66 687 (10.59) 276 (4.18) 9 (0.14) 8 (0.12) Baghai 70 11 71 408 (5.75) 178 (2.51) 20 (0.28) 12 (0.17) Buffer Zone 126 25 137 99 (0.72) 386 (2.82) 17 (0.12) 23 (0.17) Park 175 33 228 2687 (11.79) 861 (3.78) 38 (0.17) 32 (0.14) Total 301 58 365 2786 (7.63) 1247 (3.42) 54 (0.15) 55 (0.15)
A total of 365 km in 58 routes were surveyed in approximately 300 km² of Madi
Valley watershed. Tigers and leopards both occurred in all 6 study blocks (Figure 18).
The encounter rate of tiger tracks in the park was greater then the buffer zone (χ² =3.14,
df=1, p= 0.076), however, leopard encounter rate in the park and buffer zone were
exactly as expected (χ² =0, df=1, p= 1.0). Similarly, the encounter rate of tiger tracks and
leopard tracks did not differ significantly between park (χ² =2.26, df=1, p=0.132) and
buffer zone (χ² =0.9, df=1, p=0.342) (Table 7). The lowest encounter rate of tiger was in
Dhoba block, which had the highest human activity, and highest encounter rate of tiger
31

are observed at Baghai block, which had the lowest human activity.
Our data on disturbance factors, measured as encounter rate of livestock and
human use are shown in (Table 7, Figure 19 and 20). Livestock encounter rate was
relatively high (11.17) in the park than buffer zone (0.72). Similarly, human forest use is
relatively greater inside the park compared to buffer zone. However, these disturbances
are more severe along the Reu River approximately 2 km inside the park south of the fire
line (Figure 19 and 20). It is interesting to note that the livestock grazing inside the buffer
zone community forests has been minimal and as User Group Committees enforce
grazing restrictions in their forests, grazing has shifted the park. Relatively high livestock
(23.59) and human (5.02) encounter rate is observed in Dhoba block inside the park, in
contrast lowest rate of livestock (0.25) and human (1.26) are observed in Mugai and
Ayodhyapuri buffer zone block respectively.
32

%U%U
%U%U%U
%U
%U
%U
%U
%U
%U
%U%U
%U
%U
%U
%U%U
%U
%U%U
%U%U
%U
%U
%U%U
%U%U%U%U%U
%U
%U%U
%U%U%U
%U
%U%U
%U%U%U%U
%U%U%U%U%U%U%U%U
%U
%U%U
%U%U
%U
%U%U
%U
%U%U
%U
%U
%U
%U%U
%U%U
%U
%U%U
%U
%U
%U
%U%U%U%U%U%U%U%U%U
%U%U%U
%U
%U%U
%U
%U
%U %U%U
%U
%U
%U
%U
%U%U%U
%U%U%U
%U
%U%U%U%U %U
%U %U %U%U%U%U
%U%U
%U%U%U%U %U%U%U
%U%U%U
%U%U
%U%U
%U%U%U%U%U%U%U
%U%U%U%U%U
%U%U%U%U%U
%U%U
%U%U
%U
%U %U%U%U
%U%U %U
%U%U%U%U
%U
%U %U%U
%U
%U%U%U
%U
%U
%U
%U%U
%U%U%U
%U
%U%U %U
%U
%U%U
%U
%U
%U
%U%U
%U
%U%U
%U%U%U
%U%U
%U
%U
%U%U
%U %U%U
%U%U
%U%U%U
%U%U
%U
%U%U
%U
%U
%U
%U%U%U
%U%U%U
%U
%U%U%U
%U%U%U%U%U%U
Baghai Block
Ayodhyapuri Block
Dhoba Block
Mugai Khola Block
Ghanger Block
Pandu Nager Block
Survey BlocksSurvey Routes
%U Tiger Sign%U Leopard Sign
N
5 0 5 Kilometers
Madi Valley
Figure 18. Locations of tigers and leopards sign in Madi Valley
33

#
#
##
#
#
#
#
#
#
##
#
#
##
# #
#
#
#
#
##### #
#
# # ### ##
#
#
#
##
##
########
####
#
#
#
#
## ## #
#
##
###
#
##
Baghai Block
Ayodhyapuri Block
Dhoba Block
Mugai Khola Block
Ghanger Block
Pandu Nager Block
5 0 5 Kilometers
N
Madi Valley
Survey BlocksSurvey Routes
Livestock # 2 - 20# 21 - 50# 51 - 100
# 101 - 175
# 175 - 250
Figure 19. Number of livestock grazing in Madi Valley
34

%U
%U%U
%U
%U
%U
%U%U
%U
%U
%U
%U%U
%U %U
%U%U%U %U%U %U
%U
%U %U %U%U%U %U%U
%U%U
%U
%U%U
%U%U
%U %U%U%U%U
%U%U%U
%U%U
%U%U
%U
%U
%U%U %U
%U %U%U
%U%U
%U%U%U
%U
%U%U
%U%U
%U%U
%U
%U %U
%U
%U
%U %U%U
%U%U
%U
%U%U
%U
%U
%U%U
%U %U
%U%U%U
%U %U
%U%U
%U%U
%U
%U %U
%U
%U
%U
%U
%U
%U
%U
%U
%U%U
%U
%U
%U%U
%U%U
%U
%U%U %U
%U
%U
%U
%U
%U
%U
%U
%U
%U
%U
%U
%U
%U%U
%U
%U
%U
%U
%U
%U%U%U
%U%U
%U
%U
%U %U
%U
%U
%U%U
%U
%U
%U
%U
%U%U
%U
%U%U
%U %U%U
%U%U
%U%U
%U%U
%U
%U%U
%U
%U%U
%U
%U
%U%U%U
%U
%U%U
%U
%U
%U
%U
%U
%U
%U
%U
%U
%U
%U%U
%U
%U
%U
%U%U
%U
%U
%U%U
%U %U
%U
%U
%U
%U
%U
Baghai Block
Ayodhyapuri Block
Dhoba Block
Mugai Khola Block
Ghanger Block
Pandu Nager Block
%U Fuelwood%U Grass / Fodder
%U Fishing
%U Traveling%U Other Activity
Human Activities
%U Hunting
Survey BlocksSurvey Routes
%U Livestock Herder
Madi Valley
5 0 5 Kilometers
N
Figure 20. Human resource use in Madi Valley
35

Human Attitudes towards Tigers
A total of 400 hh were interviewed to understand the perceptions of Madi
population towards tigers (Figure 21). The total population of Madi Valley watershed is
39,314 with 48% male and 52% females living in 7,719 households. The majority of the
households are of hill immigrants belonging to many different ethnic groups, but majority
are Brahmin / Chhetri group (37%) (Table 8). The long time residents / Tharu ethnic
group constitutes 23% of the Madi population.
Respondents were male 54% and female 46% (Table 9). Respondent aged 15
years and above were interviewed. Forty two percent of the respondents were
uneducated, 34% had primary, and 20% had secondary level education (Table 10).
Majority of the sample (69%) were experienced working age group (30 to 59) (Table 11).
Local people perception is crucial in the management and protection of tigers
especially where human tiger conflicts are increasing. We investigated the local people’s
liking and disliking of tigers. The reason for liking was categorized into discrete values of
tiger as discussed by Kellert (1985). Approximately half of the (52%) respondents have
seen the tiger in the forest (Table 12). The majority of the respondents did not like tigers
living in the neighboring forest nor in the community forest (Table 13a and 14a). In
general the reason for not liking tigers living in those forests was threat to people getting
killed (Table 13c) and livestock depredation. Similarly, majority of the respondents did
not like tigers in the buffer zone community forests because they feel threatened of tigers
while extracting resource (Table 14c). With regards to liking tiger’s majority of the
respondents perceive tiger has ecological, moral and utilitarian values (Table 13b and
14b).
36

Long term protection of tiger is a biggest concern for park management and tiger
conservationists alike. When asked about where the tigers should be protected nearly half
of the respondents (47%) had the opinion that protecting of tigers should only in the
national park (Table 15). However, just over a quarter (27%) of the respondents had
supported protecting tiger everywhere they are currently found and 17% even felt that
tigers should be protected in areas where they expand their distribution.
37

$T$T
$T
$T$T
$T$T
$T
$T
$T
$T$T
$T
$T
$T
$T$T
$T$T
$T$T
$T$T$T
$T$T
$T$T$T$T $T$T$T$T$T$T
$T$T$T
$T
$T
$T
$T
$T
$T
$T
$T$T$T$T
$T$T
$T
$T$T
$T
$T
$T
$T
$T$T
$T
$T$T$T$T$T
$T
$T$T
$T$T$T
$T$T$T
$T
$T
$T
$T
$T
$T$T$T
$T$T
$T
$T
$T$T
$T
$T$T
$T
$T
$T
$T
$T
$T
$T
$T
$T $T
$T
$T
$T
$T
$T$T$T
$T
$T
$T
$T
$T$T
$T$T
$T
$T
$T
$T
$T
$T$T
$T
$T$T$T
$T$T$T$T
$T
$T $T$T
$T$T$T
$T$T
$T$T$T
$T
$T$T$T
$T$T
$T$T
$T$T$T$T $T$T$T$T$T$T$T
$T$T$T
$T $T
$T
$T$T
$T
$T$T$T$T
$T$T
$T
$T$T
$T$T
$T
$T
$T
$T$T
$T$T$T
$T$T
$T$T$T$T$T$T$T
$T$T$T$T $T
$T$T$T
$T $T
$T$T
$T
$T$T
$T$T$T
$T
$T
$T$T$T
$T
$T$T
$T$T $T$T
$T$T
$T$T$T
$T
$T
$T$T$T
$T$T
$T$T$T$T$T
$T
$T
$T$T
$T
$T
$T
$T$T
$T$T$T$T
$T$T$T$T
$T
$T$T$T$T$T
$T$T$T
$T
$T
$T$T$T
$T
$T$T$T$T$T $T$T$T$T
$T$T$T$T$T$T$T
$T
$T
$T$T$T
$T
$T$T
$T
$T$T$T
$T$T$T
$T$T
$T
$T
$T$T
$T$T$T$T
$T
$T$T$T
$T$T$T$T$T$T$T
$T$T
$T$T$T $T$T$T
$T$T
$T$T$T$T$T
$T$T$T
$T$T$T$T
$T$T$T$T$T
$T$T
$T$T$T
$T$T
$T$T$T$T$T
$T$T$T$T $T$T
$T
$T$T$T$T$T$T
$T$T
$T$T
$T$T$T $T
$T
$T $T
$T
$T$T$T
$T
AyodhyapuriKalyanpur
Baghauda
Gardi
Chitwan National Park
Valmiki Tiger Reserve India
N
5 0 5 Kilometers
VDC BoundaryPark Boundary
$T Household Suveyed
Figure 21. Locations of 400 hh sampled from four VDCs in Madi Valley.
38

DISCUSSIONS
Intensity of tiger human conflicts
The intensity of tiger and human conflicts in and around CNP has significantly
increased over the years. Increasing number of human death due to man-eating tigers
certainly possesses a serious concern to the local people and similar trend of losing
problem tigers indicates a serious threat to tiger survival. This conflict of human and
tigers potentially hinders the goal of TAL to increase the land base for tigers and to re-
establish tiger dispersal corridors between reserves.
This research indicated two important issues that may help achieve the goal of
TAL. The first encouraging issue is that tigers are using the buffer zone habitat more
frequently and are establishing breeding territories in community forests due to the
restoration of these forests. Tigers are not only settling in the buffer zone but are also
dispersing beyond into the national forests suggesting the possibilities for tigers to
disperse through the re-established corridor habitats. The second conflicting issue is that
once tigers settle in the buffer zone confrontations with humans harvesting resources
increases significantly. Encouraging local Community Forestry User Committees to
employ “Bagh Heralu” to monitor tigers will help inform local people about activities
that increase risks of tiger human conflicts.
The distribution map of human killed and problem tigers removed show that
tigers are using the buffer zone and dispersing into the national forests. This is most
likely due to the improved condition of the buffer zone forests through community- based
restoration programs. In early 1970s through the early 1990s, forests adjoining the park
were degraded and was not much used by the tigers (McDougal and Smith personal
39

communication); however, since the implementation of the buffer zone management
regulation of 1993, when buffer zone forests were handed over to the buffer zone user
committees forest protection increased natural prey creating additional tiger habitat.
Community-based management activities in recent years include controlling livestock
grazing and timber harvests, establishing tree plantations in severely degraded areas, and
allowing natural regeneration in low degraded forest habitats. Due to such efforts the
forests once degraded have regenerated, restored prey and increased tiger habitat. This
trend is important for long term tiger viability in the terai and should not be reversed. It
will take creative programs and local involvement to reduce human tiger conflict.
Many of the tigers in the unprotected forests in the terai region are killed in
retaliation to tigers killing livestock (Gurung 2002). Similar trend is observed in the
buffer zone of the CNP where every man-eating tigers are killed, poisoned or removed
from the area. Three man-eating tigers were killed in three consecutive days in the year
2004. If tigers are killed at such rate dispersal through out re-established corridor habitat
between reserves is likely to be unsuccessful. Mitigating the conflict between tiger and
human could provide opportunity for tiger to disperse from one reserve to another. Even
a single successful dispersal of tiger in one generation from one population to another
could contribute significantly to the population viability the ultimate goal of TAL.
Man-eating tiger’s behavior
Human beings are not a part of the tiger’s natural prey because tiger evolved to
prey on large ungulates. The upright, bipedal human is in stark contrast to the quadruped
form of natural prey (McDougal 1987). However, tigers do kill people accidentally or
deliberately. Man eating tigers can be defined as “problem tigers” that deliberately kill
40

people for food. Hunger is usually the reason that tigers kill humans.
In Chitwan we identified factors associated with man-eating behavior: (1) injured
or aged individuals find it difficult to kill natural prey, (2) there is an abundance of
domestic livestock and reduced natural prey in national forests, (3) aggressive behavior,
and (4) defensive or accidental killing.
Aged and injured tigers are often incapable of killing natural prey. Furthermore,
due to their condition they are forced out of territories in prime habitat to the marginal
areas by younger healthy animals. Inability to hunt down natural prey and low density of
natural prey in the marginal habitat were the most frequent factors associated with man-
eating behavior. Out of the 17 man-eating tigers that were investigated, nine were in poor
condition (e.g. worn canines and broken claws or other injuries from fights with other
tigers or gun shot wounds) making them incapable of hunting natural prey. A typical
example was an old male with worn out teeth and broken claws who killed two people
who were sleeping on the verandah of their homes. During the early and mid years of 20th
century most of the man-eating tigers that Jim Corbett (2005) and Arjun Singh (1993)
killed had injuries. However, not all aged tiger kill people; it is primarily old tigers that
are driven into the marginal or multiple use forests that turn into man-eaters.
Tigers living in a sub-optimal habitat with low density of natural prey, injured
animals or those with aggressive nature turned into “desperate man-eaters”. However, in
some cases, tigers kill humans as a result of defensive behavior or are simply accidental
killing. Bhimle Pothi is an example of a tiger killing by accidental; she killed a woman
inside the park in 2003 but did not eat the victim and has not killed since. Generally, a
tiger who kills a person as an accidental response to sudden encounter should not be
41

consider man-eater. For example a tigress with small cubs may attack and kill a person
who unintentionally gets too close. In three cases, tigresses almost certainly killed people
because the female felt that her cubs were threatened. This was the case when Tamor
Pothi killed her first victim inside the park in February 1999; no action was taken at that
time. Later in 2002 she was captured and released in another area because she went
outside the park and killed domestic livestock and was deemed to be a threat. In the new
released area she killed her second victim and was then considered a man-eater. The
second case is Ujeli Pothi. She had cubs < 6 months old with her when she killed a man.
No action was taken against her. The third case is Bhagedi Pothi who had three cubs ~ 9
months old with her when she killed three people in 20 minutes. She did not eat any of
the five people she killed indicating that sub-optimal habitat or hunger was not a factor
leading her to kill. Nearly one fourth of the victims killed in Chitwan were not eaten. In
many cases tigers did not have the opportunity to eat the kill due to human interference.
When should a tiger be labeled man-eater? Obviously a serial killer is a man-eater
but a tiger that kills only one person is often not considered to be man-eater, even if the
victim has been eaten. Of the 37 tigers that killed people, 18 killed only once and of
those, 6 were eliminated due to the fear that it would kill again. For example Baghmara
Pothi (old and impaired) and Syaulibas Pothi (injured) entered houses to kill their
victims. In contrast, Bachcha Bhale, a young healthy male tiger living in an optimal
habitat showed unusually aggressive behavior and was removed from the area.
More than half the people killed in CNP were grass cutters or fodder collectors.
Grass cutting requires people to sit or bend down. A person in such a posture in a dense
environment may resemble natural prey. Seidensticker and McDougal (1991) observed
42

tigers often kill peoples sitting or bending over. Furthermore, fodder collection requires
people to enter thick bushes where succulent foods preferred by livestock are located.
Entering such areas has higher risk of encountering tigers resting during the day. Most of
the victims killed during the midday were in dense vegetation. Taking precautions before
entering such areas could avoid the accidental killing.
When tigers kill people in the buffer zone, the park authorities take immediate
action. If tiger kills people inside the park action against the tiger is not taken because
people are trespassing. However, if the tiger is a deliberate man-eater, park authorities
take action (e.g. executions, capture / release, or detain in captivity). Although action may
be urgent, difficult terrain and identification of man-eater hampers efforts to eliminating
them from the area. For example, elimination of two males in the Daunne and
Someshwor Hills took several days.
Identification of true man-eater in a high tiger density area such as grassland and
riverine habitats inside the park also demands more expertise. In 80’s most of the people
were killed inside the park and many man-eating tigers were disposed from the area.
Field biologists and technicians from Tiger Ecology Project and ITNC have been
assisting the park authorities in identification and removal of the problem tigers. A long
term tiger monitoring program not only assists determining the status of individual tigers
but also helps in identification and removal of man-eaters. A tiger monitoring program
may be used in mitigating tiger human conflict by monitoring the daily movement pattern
of tiger in the buffer zone. Information of tiger movement in an area can be shared with
local villagers alerting them to avoid using high risk areas.
43
Tiger and Prey Abundance in Madi Valley
Madi Valley was selected to investigate the tiger behavior and prey abundance in
buffer zone forests due to the high human fatalities in the area (McDougal 2005). Our
goal was to understand the patterns of human activity, the ratio of abundance of domestic
and wild tiger prey, and the distribution and behavior of tigers so that local communities
can devise plans to better co-exist with tigers.
The recce surveys indicate that tiger and leopard are widely distributed in both the
park and the buffer zone. However, overall tiger abundance is relatively higher in the
park than the buffer zone despite of some blocks inside the park that showed low tiger
signs. The lowest encounter rate of tiger is observed at Dhoba block inside the park could
be explained due to relatively high human and livestock use in this forest block. In
contrast highest encounter rate of leopard is observed at Pandunagar block due to the
presence of cubs with female provided more track sets. The encounter rate comparison of
tiger track set is a good measure between the park and buffer zone because habitat type
and physical features are similar.
With regards to ungulate species in Madi valley, buffer zone has relatively low
prey abundance than the park. The lowest prey abundance measured as sambar unit was
observed in Mugai khola block in the buffer zone presumably due to the high human use
and hunting pressure. Fourteen hunters hunting deer with large nets were encountered
during the survey in this block. Nevertheless, forest blocks in the buffer zone other than
Mugai have good sambar deer abundance. Nearly fifty percent of the pellet composition
in the buffer zone was sambar. Canyon with dense vegetation provides good foraging
habitats for sambar and high ridge tops and its slope with grass supports basking and
44

resting area in winter. In contrast forest blocks inside the park offer a hilly terrain in the
Churia range and grazing lawn along the Reu River supporting both sambar in the hills
and chital in the low Sal forests and meadows. Chittal and sambar pellet composition are
relatively high.
The villagers that venture into the forests to graze livestock and collect forest
products inevitably come into conflict with tigers. The extent of livestock grazing and
human use of forest resources were measured as encountered rate of livestock and human
during the recce survey. There was a strong contrast in livestock grazing in the park and
buffer zone. The encounter rate of livestock was significantly high inside the park than
buffer zone. The livestock grazing is not allowed either inside the park or in the buffer
zone community forests. However, the livestock grazing has been very well controlled
inside the buffer zone by the community-based management. The local user groups
strictly follow and monitor the set rules. When the livestock are apprehended by the
forest guards in the community forests the owners are fined. Such rules also exists for the
park, however, the lack of guard post due to insurgency, and open access along the Reu
River, livestock grazing has become uncontrolled inside the park. The livestock grazing
is significantly higher all along the Reu River up to 2 km inside the park to the fire line.
This area has several grazing lawn or meadows where hundreds of livestock are grazed.
Parallel to livestock relatively high number of human was encountered inside the
park than the buffer zone as many accompanied their livestock as herder. Similarly, high
number of human uses buffer zone community forests for fuel-wood, fodder and
extraction of other forest products. Ayodhyapuri block in the buffer zone forest reported
lowest human encounter rate because people in that area were still scared to go into the
45

forest where tiger had killed 5 people in March, 2004.
Human Attitudes toward Tigers
Support of local people is critical to tiger conservation in the human dominated
landscape, especially in areas where conflict between the two is significantly high.
People’s attitude towards tiger can be determined by few important but simple
questionnaire surveys. One such question we asked was: do you like tiger living in the
neighboring or community forests? Majority of the people in Madi valley did not like
tiger in the neighboring or community forests because of danger of getting killed and
livestock depredation. Many people were also threatened of tigers would come to village
and harm them. Such perception of tigers coming to the village and kill people could
have been due to the fact that few man-eating tigers came to the house in the villages and
killed people. One such case was in Syaulibas where a woman was killed at home in
1999. Similarly, few people were also killed at close proximity of the houses.
Furthermore, few man-eating tigers were removed from the forests nearby the villages
where people observed and also took part in the man-eating tiger removal operations.
Experiencing such events may have impacted their perception of tiger coming to the
village and endangered human and livestock lives. Moreover, livestock depredation by
leopards at stockade at homes is more frequent than tigers. Such incidents could also
seem to have attributed to negative perceptions towards tiger.
On the other hand however, just less than half of the people in Madi valley liked
tigers living in the buffer zone or in the neighboring forest. The various reasons for liking
tigers were classified into seven categories of valuing endangered species described by
Kellert (1985). Most of the people liked tigers because of the ecological value in which
46

they inter-related tigers to the maintenance of forests. People perceived presence of tigers
help forest stay intact. Utilitarian and moral values were also expressed by many of the
respondents for liking tigers. Utilitarian value is expressed for tigers to attract wildlife
tourism because it is one of the main attraction and charismatic animal in CNP. Moral
values are also expressed as inherent rights to exist. Few people in the Madi valley also
like tigers due to the naturalistic, aesthetic and cultural value.
The problem of man-eating tigers need to be dealt seriously because people
perceived tiger as a threat to their lives in the Madi valley and has the potential to erode
support for tiger conservation. The current management of immediate action against man-
eating tigers in the buffer zone to eliminate the culprit has been effective. However, such
action may solve the immediate man-eating problem but victim’s families may not have a
supportive attitude towards tiger due to the loss. Likewise, elimination of man-eating
tigers or tigers risking human lives in the buffer zone reduces the overall tiger population
size and the potential for tiger dispersal. To mitigate the conflict between tigers and
humans, we recommend the following:
RECOMMENDATIONS
1. Establish Local Forest Guard as “Bagh Heralu”
The problem of human tiger conflict is directly related to people living around the
park; therefore mitigation of this problem should be discussed jointly between the
park management and local people. One of the ways could be to get the local
people involved in tiger and prey monitoring activities by establishing the local
people as “Bagh Heralu” to monitor tiger in their respective areas. Currently, the
buffer zone user committee and community forestry user group employs a forest
47

guard, to check illegal grazing and human activities in their buffer zone
community forests. These forest guards can be trained to monitor tigers, leopard,
and ungulates in addition to their current job. Monitoring tigers in their
community forest on a daily basis can help to understand the activity pattern of
tigers. Based on the activity pattern of the tiger’s movement, people can be alerted
when harvesting resources in the buffer zone in order to minimize confrontation
with tigers.
2. Monitor Tigers on a Regular Basis
Our simple method of surveying tiger, leopard and human pressure to evaluate
their status in the buffer zone and park can be easily repeated. We suggest
conducting the monitoring activities jointly with the park staff, “Bagh Heralu”
and wildlife technicians from different NGOs specialized in wildlife monitoring.
3. Enhance Tiger Research in Sub-optimal Habitats
More than half of the problem tigers removed was in the marginal or sub-optimal
tiger habitats. Impaired tigers turning into man-eater due to old age or injury are
easier to understand. It is important to study tigers living in the buffer zone of the
park. This can best be accomplished by having park rangers and local “Bagh
Heralu” team up on tiger behavioral research based on radio collaring animals
living in the buffer zone of CNP. These research teams could document the extent
to which tigers in the buffer zone depend on domestic prey, explore ways to
reduce tiger and human interactions.
48

4. Create Problem Tiger Response Team
During our research local people requested that a problem tiger response team be
created. We did respond to some problem tiger situations to explore how to
reduce conflict. For example, on the 6th June 2006, a goat was completely eaten
by the house and tiger track was reported at Sheruwa village in Meghauly VDC.
Chairman of the Buffer zone council resident of Meghauly VDC asked our team
working at Madi Valley to investigate the site where the goat was killed. We
visited the site and confirmed that the kill was made by a tiger and we were able
to identify the animal as a tigress, Bhimle Pothi, who was identified by her unique
pugmarks. We instructed the forest guards and the members of the community
forestry user group to inform villagers to stay alert at night, but we realized that
radio collaring animals is the only way to monitoring tigers on a regular basis.
Response teams should be headed by the park authorities and include, park staff, a
wildlife technicians from NTNC, ITNC, and local “Bagh Heralu”.
5. Tiger Conservation Awareness Program
Majority of the people in Madi valley did not like tigers living in the neighboring
or community forests. Such perception is an indication of negative support for
tiger conservation. We believe negative attitude of people could be due to not
having the understanding of tiger biology and behavior. Therefore tiger
conservation awareness program should be implemented to educate the local
people on tiger behavior, biology, its need, importance, status in the park and
buffer zone community forest. Additional discussion on how to mitigate man-
eating problem should be discussed.
49

6. Establish Tran boundary Co-operation between Valmiki Tiger Reserve and
Chitwan National Park
There has been a several high level meetings conducted on the trans-boundary co-
operation between India and Nepal on tiger related issues. The Chitwan NP and
Valmiki TR offers unique possibilities for trans-boundary co-operation as it
shares a long international border between the two reserves. The tiger monitoring
should be conducted jointly by the Indian and Nepalese wildlife technicians along
the border areas.
7. Allocation of Livestock Grazing Areas
It is interesting to learn that the community-based management has totally
controlled the grazing of livestock in the community forests in Madi Valley.
However, livestock grazing pressure has shifted from community forest to the
park as demonstrated by our study. There are no areas set aside for livestock
grazing. Grazing areas should be recognized along most of the river system or
some part of buffer zone forests in the Madi valley.
50

LITERATURE CITED
Ahearn, S.C., J.L.D. Smith, C. Wee. 1990. Framework for a geographically referenced tabular/visual conservation database: case study Nepal. Photogrammetric Engineering and Remote Sensing 56:1477-1481.
Ahearn, S.C., J.L.D. Smith, A.R.Joshi and J.Ding. 2001. TIGMOD: an individual-based
spatially explicit model for simulating tiger/human interaction in multiple use forests. Ecological Modeling 140: 81-97.
Ahearn, S.C. and J.L.D.Smith. 2005. Modeling the interaction between humans and
animals in multiple-use forests: a case study of Panthera tigris. Pages 358-387 in D. Maguire, M. Batty and M. Goodchild (eds.). GIS, Spatial Analysis, Modeling. ESRI Press, Redlands, California, USA.
Barlow, A. 2004. Monitoring wild tiger (Panthera tigris) populations: lessons from a
long-term camera trapping study in Royal Chitwan National Park, Nepal. MS thesis, University of Minnesota, St. Paul, MN, USA.
Corbett, J. 2005. The Jim Corbett Omnibus. Oxford University Press, New Delhi. Dhakal, N. 2006. Assessment of resident well-being and perceived biodiversity impacts
in the Padampur resettlement, Royal Chitwan National Park, Nepal. MS thesis, University of Minnesota, St. Paul, MN, USA.
Dinerstein, E., E. Wikramanayake, J. Robinson, U. Karanth, A. Rabinowitz, D. Olson, T.
Mathew, P. Hedao, M. Connor, G. Hemley, and D. Bolze. 1997. A framework for Identifying High Priority Areas and Actions for the Conservation of Tigers in the Wild. Part 1. Washington DC, World Wildlife Fund-US and Wildlife Conservation Society.
Dinerstein, E., A. Rijal, M. Bookbinder, B. Kattel, and A. Rajuria. 1999. Tigers as
neighbors: efforts to promote local guardianship of endangered species in lowland Nepal. Pages 316-332 in J. Seidensticker, S. Christie and P. Jackson, editors. Riding the tiger: Tiger conservation in human-dominated landscapes. Cambridge University Press, Cambridge, United Kingdom.
DNPWC. 1999. Tiger conservation action plan for the Kingdom of Nepal. WWF Nepal
Program, Kathmandu. DNPWC/MFSC. 1999. Buffer Zone Management Regulation, 1996 and Buffer Zone
Management Guidelines, 1999. Department of National Parks and Wildlife Conservation, Babar Mahal, Kathmandu.
DNPWC and PPP. 2000. Royal Chitwan National Park and Buffer zone, Resource
Profile. Babar Mahal, Kathmandu.
51

Dhungel, S.K. 1985. Ecology of the hog deer in Royal Chitwan National Park, Nepal. Ph.D. thesis, University of Montana, USA.
Gurung, B., J.L.D. Smith and M. Shrestha. 2006. Using “Bagh Heralu” network to map
the metapopulation structure of tigers in Nepal, in J. McNeely, T. McCarthy, A. Smith, L. Whittaker and E. Wikramanayake, editors. Conservation Biology in Asia. Kathmandu, Nepal.
Gurung, B.B. 2002. Mapping the meta-population structure of tigers throughout Nepal by
establishing a tiger monitoring network of “Village Rangers”. MS thesis, University of Minnesota, St. Paul, MN, USA.
Gurung, K.K. 1983. Heart of the Jungle. Andre Deutsch, London. Hemley, G. and J. Mills. 1999. The beginning of the end of tigers in trade? Pages 217-
229 in J. Seidensticker, S. Christie and P. Jackson, editors. Riding the tiger: Tiger conservation in human-dominated landscapes. Cambridge University Press, Cambridge, United Kingdom.
HMGN/MFSC, 2004. Terai Arc Landscape-Nepal Strategic Plan (2004-2014), Broad
Strategy Document. Ministry of Forest and Soil Conservation, Planning and Human Resource Development Division. Kathmandu, Nepal.
Jackson, P. 1997. The status of the tiger in 1997 and threats to its future. Cat News 27: 8-
10. Kellert, S.R. 1985. Social and perceptual factors in endangered species management.
Journal of Wildlife Management 49(2): 528-536. Kenney, J. S., J. L .D. Smith, A. M. Starfield, and C. McDougal. 1995. The long-term
effects of tiger poaching on population viability. Conservation Biology 9: 1127-1133.
Luo, S.J., J.H. Kim, W.E. Johnson, J. van der Walt, J. Martenson, N. Yuhki, D.G.
Miquelle, O.Uphyrkina, J.M.Goodrich, H.B.Quigley, R.Tilson, G.Brady, P.Martelli, V.Subramaniam, C.McDougal, S.Hean, S.Huang, W.Pan, U.K.Karanth, M. Sunquist, J.L.D.Smith and S.J.O’Brien. 2004. Phyloeography and genetic ancestry of tigers (Panthera tigris). PLOS Biology 2(12):2275-2293.
McDougal, C. 1977. The face of the tiger. Rivington Books, Andre Deutsch, London. McDougal, C. 1987. The Man-eating tiger in geographical and historical perspective.
Pages 435-448 in R. L. Tilson and U. S. Seal, editors. Tigers of the World: The Biology, Biopolitics, Management and Conservation of an Endangered Species. Park Ridge, New Jersey, Noyes Publications.
52

McDougal, C. 1999. You can tell some tigers by their tracks with confidence. Page 190
in J. Seidensticker, S. Christie and P. Jackson, editors. Riding the tiger: Tiger conservation in human-dominated landscapes. Cambridge University Press, Cambridge, United Kingdom.
McDougal, C., A. Barlow, D. Thapa, S. Kumal and D. B.Tamang. 2005. Tiger and
Human Conflict Increase in Chitwan Reserve Buffer Zone, Nepal. Cat News 40: 3-4.
McDougal, C. 2005. Preliminary report of tiger presence in the Buffer Zone of Royal
Chitwan National Park (RCNP). Report submitted to Department of National Park and Wildlife Conservation. Babar Mahal, Kathmandu. Nepal.
Mills, J.A. and P. Jackson. 1994. Killed for a cure: A review of the world-wide trade in
tiger bone. Cambridge, TRAFFIC International. Mishra, H.R. 1982. The ecology and behavior of chital (Axis axis) in the Royal Chitwan
National Park, Nepal. Ph.D. thesis, University of Edinburgh, UK. Pradhan, A. S. and P. J. Parks. 1995. Environmental and socioeconomic linkages of
deforestation and forest land use change in the Nepal Himalaya. Pages 167-179 in S. Hanna and M. Munasinghe, editors. Property rights in a social and ecological context. The World Bank, Washington D.C., USA.
RCNP, 2004. Royal Chitwan National Park and Buffer zone, Annual Report 2004.
Sulabh Printing Press, Narayanghat, Chitwan. Seidensticker, J. 1976. On the ecological separation between tigers and leopards.
Biotropica 8: 225-234. Seidensticker, J. and C. McDougal. 1993. Tiger predatory behavior, ecology and
conservation. Symposia of the Zoological Society of London 65: 105-125. Shrestha, M. 2004. Relative Ungulate Abundance in a Fragmented Landscape:
Implications for Tiger Conservation. Ph.D. thesis, University of Minnesota, St. Paul, MN, USA.
Singh, A. 1993. The Legend of the Man-eater. Ravi Dayal Publisher, New Delhi. Smith, J.L.D., M.E.Sunquist, K.M.Tamang and P.B.Rai. 1983. A technique for capturing
and immobilizing tigers. Journal of Wildlife Management 47: 255-259. Smith, J.L.D. 1984. Dispersal communication and conservation strategies for the tiger
(Panthera tigris) in Royal Chitwan National Park, Nepal. Ph.D. thesis. University of Minnesota, MN, USA.
53

Smith, J. L. D., C. McDougal and M. E. Sunquist. 1987. Female land tenure systems in
tigers. Pages 97-109 in R. L. Tilson and U. S. Seal, editors. Tigers of the World: The Biology, Biopolitics, Management and Conservation of an Endangered Species. Park Ridge, New Jersey, Noyes Publications.
Smith, J.L.D., C. McDougal and D. Miquelle. 1989. Scent marking in free-ranging tigers
Panthera tigris. Animal Behavior 37: 1-10. Smith, J.L.D. and C. McDougal. 1991. The contribution of variance in lifetime
reproduction to effective population size in tigers. Conservation Biology 5: 484-490.
Smith, J. L. D. 1993. The role of dispersal in structuring the Chitwan tiger population.
Behavior 124: 165-95. Smith, J.L.D, S.C. Ahearn and C. McDougal. 1998. Landscape analysis of tiger
distribution and habitat quality in Nepal. Conservation Biology 12 (6): 1338-1346.
Smith, J. L. D., C. McDougal, S. C. Ahearn, A. Joshi and K. Conforti. 1999.
Metapopulation structure of tigers in Nepal. Pages 176-189 in J. Seidensticker, S. Christie and P. Jackson, editors. Riding the tiger: Tiger conservation in human-dominated landscapes. Cambridge University Press, Cambridge, United Kingdom.
Smythies, E. A. 1942. Big Game Shooting in Nepal. Thacker, Spink and Co., Calcutta. Sunquist, M. E. 1979. The movements and activities of tigers (Panthera tigris tigris) in
Royal Chitwan National Park, Nepal. PhD. Thesis. University of Minnesota, St. Paul, MN, USA.
Sunquist, M. 1981. The social organization of tigers (Panthera tigris) in Royal Chitwan
National Park, Nepal. Smithsonian Contributions to Zoology, 336: 1-98. Sunquist, F. and M. Sunquist. 1988. Tiger Moon. Chicago, University of Chicago Press. Tamang, K.M. 1982. The Status of the tiger (Panthera tigris) and its impact on principal
prey populations in Royal Chitwan National Park, Nepal. East Lansing, Michigan State University, PhD Dissertation. MI, USA.
Wikramanayake, E.D., E. Dinerstein, G. Robinson, K.U. Karanth, A.R.Rabinowitz, D.
Olson, T. Matthew, P. Hedao, M.Connor, G. Hemley and D. Bolze. 1998. An ecology-based method of defining priorities for large mammal conservation: the tiger as case study. Conservation Biology 12: 865-878.
54

Wikramanayake, E., M. McKnight, E. Dinerstein, A.R.Joshi, B. Gurung and D. Smith.
2004. Designing a conservation landscape for tigers in human-dominated environments. Conservation Biology 18 (3):839-844.
WWF. 2001. Terai arc landscape, Nepal. WWF Nepal Program, Kathmandu.
55
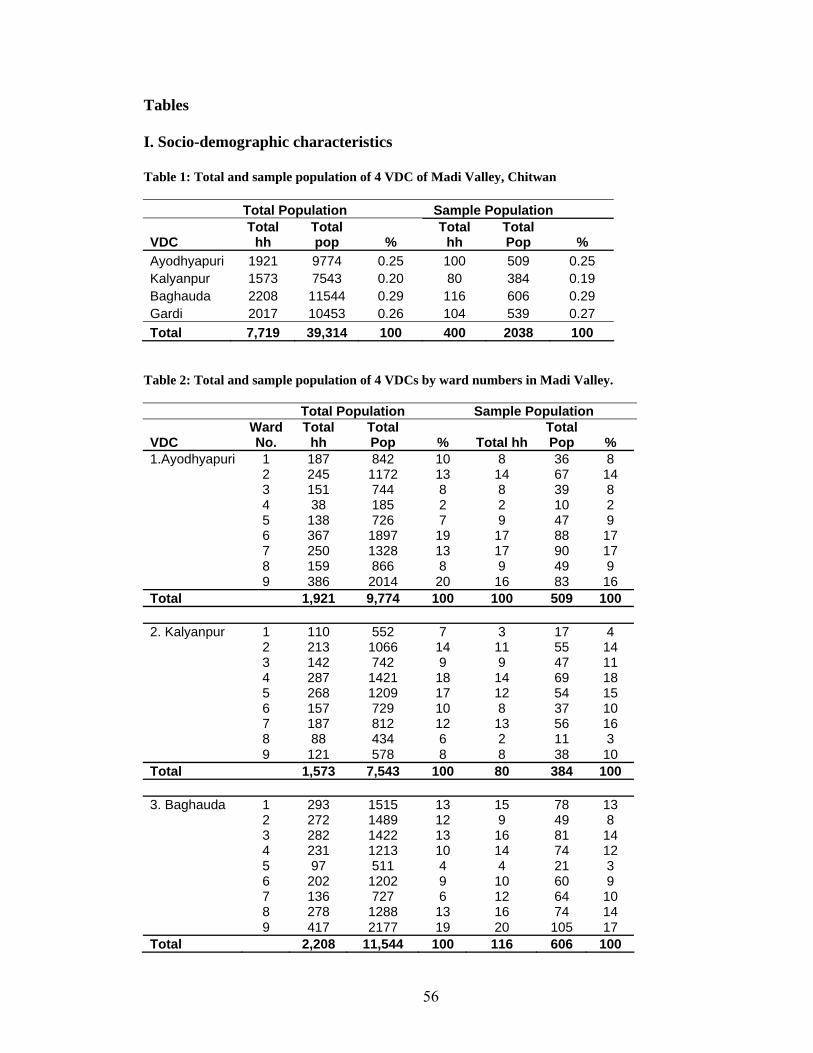
56
Tables
I. Socio-demographic characteristics
Table 1: Total and sample population of 4 VDC of Madi Valley, Chitwan Total Population Sample Population
VDC Total
hh Total pop %
Total hh
Total Pop %
Ayodhyapuri 1921 9774 0.25 100 509 0.25 Kalyanpur 1573 7543 0.20 80 384 0.19 Baghauda 2208 11544 0.29 116 606 0.29 Gardi 2017 10453 0.26 104 539 0.27 Total 7,719 39,314 100 400 2038 100
Table 2: Total and sample population of 4 VDCs by ward numbers in Madi Valley. Total Population Sample Population
VDC Ward No.
Total hh
Total Pop % Total hh
Total Pop %
1.Ayodhyapuri 1 187 842 10 8 36 8 2 245 1172 13 14 67 14 3 151 744 8 8 39 8 4 38 185 2 2 10 2 5 138 726 7 9 47 9 6 367 1897 19 17 88 17 7 250 1328 13 17 90 17 8 159 866 8 9 49 9 9 386 2014 20 16 83 16 Total 1,921 9,774 100 100 509 100 2. Kalyanpur 1 110 552 7 3 17 4 2 213 1066 14 11 55 14 3 142 742 9 9 47 11 4 287 1421 18 14 69 18 5 268 1209 17 12 54 15 6 157 729 10 8 37 10 7 187 812 12 13 56 16 8 88 434 6 2 11 3 9 121 578 8 8 38 10 Total 1,573 7,543 100 80 384 100 3. Baghauda 1 293 1515 13 15 78 13 2 272 1489 12 9 49 8 3 282 1422 13 16 81 14 4 231 1213 10 14 74 12 5 97 511 4 4 21 3 6 202 1202 9 10 60 9 7 136 727 6 12 64 10 8 278 1288 13 16 74 14 9 417 2177 19 20 105 17 Total 2,208 11,544 100 116 606 100

4. Gardi 1 211 1088 10 13 67 13 2 334 1756 17 18 95 17 3 269 1306 13 13 63 13 4 160 904 8 6 34 6 5 176 945 9 7 38 7 6 148 705 7 10 48 10 7 160 873 8 8 44 8 8 405 2076 20 16 82 15 9 154 800 8 13 68 13 Total 2,017 10,453 100 104 539 100 Grand Total 7,719 39,314 400 2,038 100
Table 8: Ethnicity of respondents and total population of Madi
Ethnicity Sample % Total % Brahmin & Chhetri 170 43 15497 37
Tharu 84 21 9714 23 Others 146 36 16133 39 Total 400 100 41344 100
Table 9: Respondents gender categories Gender n % Male 218 54 Female 182 46 Total 400 100
Table 10: Respondents education level Level n % Valid % Uneducated 162 41 42 Primary 129 32 34 Secondary 76 19 20 Higher Secondary 13 3 3 College 5 1 1 Total 385 96 100 Missing 15 4 Total 400 100
57

Table 11: Age categories of respondents Age n % 15-29 69 17 30-59 276 69 60-100 55 14 Total 400 100
II. Attitudes
Table 12: Respondents tiger sighting Have you seen tiger in the forest? Response n % Yes 207 52 No 168 42 Did not answer 25 6 Total 400 100
Table 13a: Respondents attitudes towards tiger Do you like tiger living in the neighboring forests? Response n % Yes 163 41 No 234 58 Did not answer 3 1 Total 400 100
Table 13b: Respondents reasons for liking tiger in the neighboring forests Reasons n % Valid % Naturalistic / Outdoor recreational value (beauty, entertainment) 5 3 3 Ecological value (intact forests, increases forest charm) 45 28 29 Moral / Existence value (right to live in the forest) 30 18 19 Aesthetic value (endangered / protected species) 13 8 8 Utilitarian value (tourism) 30 18 19 Cultural / Religious value (King of the jungle, symbol of god) 21 13 13 I like tiger if no harm is done 14 9 9 Total 158 97 100 Missing 5 3 Total 163 100
58

Table 13c: Respondents reason for not liking tiger in the neighboring forests Reasons n % Threat to people and livestock 68 29 Threat to people getting killed 98 42 Threat to livestock killing 20 8 Threat of tiger coming to village 16 7 Threat to people using the forest 27 12 I do not like tiger because it should be in the national park 5 2 Total 234 100
Table 14a: Respondents attitudes towards tiger Do you like tiger living in the buffer zone community forests Response n % Yes 177 44 No 220 55 Did not answer 3 1 Total 400 100
Table 14b: Respondents reasons for liking tiger in the community forests Reasons n % Valid % Naturalistic / Outdoor recreational value (beauty, entertainment) 2 1 1 Ecological value (intact forests, increases forest charm) 62 35 37 Moral / Existence value (right to live in the forest) 26 15 15 Aesthetic value (endangered / protected species) 7 4 4 Utilitarian value (tourism) 49 28 29 Cultural / Religious value (King of the jungle, symbol of god) 12 7 7 I like tiger if no harm is done 11 6 7 Total 169 96 100 Missing 8 4 Total 177 100
Table 14c: Respondents reason for not liking tiger in the community forests Reasons n % Valid % Threat to people and livestock 33 15 15 Threat to people getting killed 27 12 12 Threat to livestock killing 7 3 3 Threat of tiger coming to village 13 6 6 Threat to people while using the forests using the forest 135 61 62 I do not like tiger because it should be in the national park 4 2 2 Total 219 99 100 Missing 1 1 Total 220 100
59

Table 15: Respondents opinion about tiger protection Opinion n % Tiger should not be protected 8 2 Tiger only be protected in national park and reserve 189 47 Tiger be protected everywhere currently found 106 27 Tiger be protected even beyond its current distribution 69 17 Did not answer 28 7 Total 400 100
60

Appendix: Survey Questionnaires for the Assessment of Human Attitudes Towards Tigers Name of interviewer: …………………………………………. Date: ……………….
District: ………………… VDC: …………………. Ward No: ……………………. Village: ……..…………. GPS Location: UTM X: ………………….UTM Y: ………………… Altitude: …….…. Name of interviewee: ………………………………….. Age: …………Sex: ………….. Education: …………………………………… Occupation: Crop farmer/ Livestock farmer / Mixed farmer / Business / Other: Ethnicity: ………………………
Attitude 1. Have you seen a tiger in the forest? 2. Do you like tigers living in your neighboring forests? Yes or No?
If yes why, if no why not……………………………………………………………
3. In your opinion tigers in Nepal should: (Circle one): 1. not be protected 2. Only be
protected in protected areas 3. Be protected everywhere currently found 4. Be
protected even beyond its current distribution.
4. Do you like tigers living in the buffer zone community forests? Yes or No?
If yes why, if no why not………………………………………………………………
61