tidal mixing and cross-frontal particle exchange over a
TRANSCRIPT
Journal ofMARINE RESEARCHVolume 56, Number 6
Tidal mixing and cross-frontal particle exchange overa � nite amplitude asymmetric bank: A model study
with application to Georges Bank
by Changsheng Chen1 and Robert C. Beardsley2
ABSTRACTTidal mixing, internal wave bores, and cross-bank particle transport over a � nite amplitude
asymmetric bank are examinedusing a two-dimensionalprimitive equation ocean model with Mellorand Yamada (level 2.5) turbulent closure. Driven by the surface M2 tide, the model results show thattidal mixing exhibits temporal and spatial asymmetries on southernand northern � anks of the bank. Itis strongest near the bottom around maximum on-bank tidal � ow as a result of gravitationalinstability when denser water is advected upslope over lighter water. A sharp thermal depressionoccurs on the steep northern � ank, which produces large current shear and strong tidal mixingthroughout the upper 50 m of the water column. Dissipation also exhibits a strong tidal variation,with the largest values (of order 10 2 5 W/kg) occurring near-bottom around maximum on- andoff-bank tidal � ow. Dissipation generally decreases upward, with a distinct phase lag in the vertical.Fluid particles are advected upslope near the bottom in the upper slope region (depth , 150 m) onboth � anks, with some particles moving across the tidal mixing fronts near the bottom. Thenear-bottom residual Lagrangian current is opposite in direction to the residual Eulerian current onthe northern � ank due to strong nonlinearity over the steep bottom slope. The mean upslopeadvection of � uid particles near the bottom on both � anks is consistent with model passive tracerexperiments, suggesting that strong tidal forcing of a strati� ed � uid over the bank can provide onephysical mechanism responsible for high concentrationsof nutrients and hence phytoplanktonat thefronts on Georges Bank. The model predictions of eddy viscosity and turbulent dissipation rates arein good agreement with estimates based on recent current and microstructuremeasurements made onGeorges Bank.
1. Department of Marine Sciences, The University of Georgia, Athens, Georgia, 30602-2206,U.S.A.2. Department of Physical Oceanography, Woods Hole Oceanographic Institution, Woods Hole, Massachu-
setts, 02543, U.S.A.
Journal of Marine Research, 56, 1163–1201, 1998
1163

1. Introduction
The water motion over Georges Bank (Fig. 1) is controlled dominantly by strong M2
tidal currents. These currents exhibit a rotary character over the bank and increase as thewater becomes shallower. The maximum velocity is about 30 cm/s near the shelf break on
Figure 1. Bathymetry (in meters) of the southern New England continental margin (a) and a crosssection of the 2-D model domain (b). In (a), the heavy solid line and � lled triangle indicate thelocations of the cross-bank section used in numerical experiments (A, B, and C) and anchormeasurement stations (D-H). The model is forced by the M2 surface tide at the southern openboundary on the right. A radiation boundary condition plus a sponge layer are imposed at thenorthern open boundary on the left. The sponge layer at the southernopen boundary is only appliedto the current � eld.
1164 Journal of Marine Research [56, 6
the southern � ank and about 100 cm/s at the edge of the northern � ank (Moody et al.,1984). Tidal-induced turbulent mixing across this � nite-amplitude,asymmetric bank variestemporally and spatially and is closely related to the dynamics of the sloping bottomboundary layer (Loder et al., 1992; Chen et al., 1995; Horne et al., 1996; Yoshida andOakey, 1996). Physical processes controlling the sloping bottom boundary layers on thenorthern and southern � anks differ due to the large difference in bottom slope. Thesedynamics are not well understood.
Strong tidal mixing creates a well-de� ned tidally mixed front (TMF) around the shallowcap of Georges Bank. This TMF acts like a barrier separating well-mixed water on the topof the bank from strati� ed water on the � anks. During late spring through summer, theTMF is located near the 40-m isobath on the northern � ank and about the 60-m isobath onthe southern � ank (Flagg, 1987; Chen et al., 1995). During winter, the TMF disappearsover the southern � ank as strong wind mixing and surface cooling homogenize the localwater column.
The kinematics of cross-frontal water exchange over Georges Bank have been onlypartially examined. For the weak nonlinear case in which the cross-isobath tidal excursionlength is much shorter than the cross-isobath variation scale of the Eulerian velocity, theEuler-Lagrange transformation can be expanded in the form of a Taylor series. In this case,the Lagrangian velocity of a � uid parcel is approximately equal to the sum of Eulerian andStokes velocities. Here the Stokes velocity is de� ned as the � rst derivative term of theTaylor series expansion of the Euler-Lagrange transformation (Longuet-Higgins, 1969;Zimmerman, 1979; Loder, 1980). Based on this assumption, Loder and Wright (1985) useda 2-D model to estimate the cross-frontal Lagrangian residual current over Georges Bankand found the predicted Lagrangian � ow pattern was similar to the Eulerian � ow on bothnorthern and southern � anks. They also noted that their model results may not apply forGeorges Bank because of the likely effect of high-order terms in the Taylor expansion.Thereal circulation over the bank is controlled by tidal recti� cation processes associated withstrong nonlinearity (Loder, 1980; Chen et al., 1995). For example, on the northern � ank,the cross-isobath variation scale of the Eulerian velocity is about 10 km or less, which isequal to or less than the tidal excursion length (10 km or more), invalidating the keyassumption for the Taylor expansion of the Euler-Lagrange transformation. Thus, impor-tant and unanswered questions arise about how � uid particles move across topography inthe strongly nonlinear � ow regime over Georges Bank.
The northern � ank of Georges Bank has been identi� ed as a location of complex stronginternal waves (Loder and Horne, 1991; Loder et al., 1992; Marsden, 1986). Internal tidesare generated through the interaction of the barotropic tides with the variable bottomtopography (Wunsch, 1969; Baines, 1982; Chen and Beardsley, 1995). In the deep regionaway from the bank, the internal tidal � ow is always subcritical. Over the northern � ankand top of the bank, however, it can be supercritical during � ood and ebb tides andsubcritical near the tidal transition. The existence of two critical states over the banksuggests that a hydraulic jump or lee wave may occur at the lee side of the bank during the
1998] 1165Chen & Beardsley: Tidal mixing over Georges Bank
local ebb tide (Farmer and Smith, 1980; Pratt, 1991; Loder et al., 1992). The off-bank tidalcurrent tends to prevent the internal waves from propagating on-bank, causing anaccumulation of wave energy on the lee side of the bank during ebb tide. The accumulatedwave energy propagates on-bank when tidal currents reverse during local � ood tide(Maxworthy, 1979).
Internal wave generation over the northern � ank of Georges Bank has been examined byLamb (1994). Using a two-dimensional, nonhydrostaticmodel, he reproduced the develop-ment of a large internal density depression over the northern � ank during off-bank � ow,with subsequent on-bank internal wave propagationand steeping as the tidal current turnedon-bank. However, the model was inviscid, the numerical computation became unstableafter just a few tidal cycles, and the relationshipbetween internal wave generation and tidalmixing remains unexplored.
As observational components of the US Global Ecosystem (GLOBEC) Georges BankProgram, multiple instruments such as Conductivity-Temperature-Depth (CTD), VectorMeasuring Current Meters (VMCMs), a Benthic Acoustic Stress Sensor (BASS) tripod,Acoustic Doppler Current Pro� ler (ADCP), and the microstructure pro� ler, were deployedon the southern � ank of Georges Bank to measure currents, temperature, and salinitywithin the bottom boundary layer (Werner, 1996; Burgett et al., 1996; Burgett, 1997).Similar � eld measurements were made on the northern � ank of Georges Bank by Canadianscientists (Yoshida and Oakey, 1996; Horne et al., 1996). These measurements haveprovided the detailed vertical microstructure of turbulence kinetic energy, mixing, anddissipation, and also given us an opportunity to identify, qualify, and quantify the physicalprocesses controlling tidal mixing over Georges Bank.
In this paper, we examine tidal mixing, internal wave generation, and cross-bank particletransport over a � nite-amplitude bank using a two-dimensional version of the Blumbergand Mellor (1987) numerical primitive-equation coastal ocean circulation model withMellor and Yamada level 2.5 turbulent closure (see Chen and Beardsley, 1995 (denotedC&B) for a detailed description of the 2-D model). The model domain represents anidealized cross-bank slice of Georges Bank, with no along-isobath variation allowed.Using this 2-D approach facilitates numerical experiments with high resolution, which isrecognized as critically important in particle tracking and bottom boundary layer simula-tion (Zimmerman, 1979; C&B). Recently, we have developed a fully 3D model of the Gulfof Maine/Georges Bank region. Comparison of the 2-D and 3-D model results for the caseof tidal spin-up with summer strati� cation shows good agreement in the structure of thetidal mixed front, along-front residual current, and secondary cross-frontal circulationalong the 2-D model cross-bank section. This supports the use of the 2-D model to studyspeci� c processes in an idealized setting.
The remaining sections of this paper are organized as follows. Section 2 describes thephysical model and Lagrangian particle tracking approach. Section 3 presents the modelresults of turbulent mixing and dissipation across the bank and comparison with recent� eld measurements. Section 4 describes the internal waves over the southern and northern
1166 Journal of Marine Research [56, 6

� anks. In Section 5, the trajectories of particles released at different locations across thebank are used to study the cross-frontal exchange of water masses and marine organisms.An alternative study using a dissolved passive tracer is included to compare with theparticle trajectories.An additionaldiscussion on the up-slope water transport and turbulentclosure model is given in Section 6, and conclusions are summarized in Section 7.
2. The physical model
The physical model used in this study is a modi� ed 2-D version of the Blumberg andMellor (1987) prognostic coastal ocean circulation model (C&B). This model includes afree surface and parameterization of vertical mixing using the Mellor and Yamada (1974,1982) level 2.5 (MY-2.5) turbulent closure scheme as modi� ed by Galperin et al. (1988).To better understand the dynamics of the turbulent mixing presented in this paper, we givenext a brief description of the MY-2.5 turbulent closure model.
In the boundary layer approximation where the shear production of turbulent kineticenergy is assumed to be produced by vertical shear of the horizontal � ow near theboundary, the 2-D equations for q2 and q2l can be simpli� ed to
(q2)t 1 u(q2)x 1 w(q2)z 5 2(Ps 1 Pb 2 e ) 1 (Kq(q2)z)z 1 Fq (1)
(q2l )t 1 u(q2l)x 1 w(q2l )z 5 1.8l(Ps 1 Pb 2 0.56e W ) 1 (Kq(q2l )z)z 1 Fl (2)
where q2 5 (u82 1 v82)/2 is the turbulent kinetic energy, l the turbulent macroscale, Kq thevertical eddy diffusion coefficient of the turbulent kinetic energy, Fq and Fl represent thehorizontal diffusion of the turbulent kinetic energy and macroscale, Ps 5 Km(uz
2 1 vz2) and
Pb 5 (gKh r z)/r o the shear and buoyancy production terms of turbulent kinetic energy, e 50.06q3/l the turbulent kinetic energy dissipation rate, W 5 1 1 1.33l2/(k L)2 a wallproximity function where L 2 1 5 ( z 2 z) 2 1 1 (H 1 z)2 1, k 5 0.4 the von Karman constant,H the mean water depth, and z the free surface elevation. In general, Fq and Fl were kept assmall as possible to reduce the effects of horizontal diffusion on the solutions.
The turbulent kinetic energy and macroscale equations are closed by de� ning
Km 5 lqSm, Kh 5 lqSh, Kq 5 0.2lq. (3)
Sm and Sh are de� ned as the stability functions
Sm 50.39 2 3.89Gh
1 2 34.68Gh(1 2 10.1Gh), and Sh 5
0.49
1 2 34.66Gh, (4)
where Gh 5 [(l2g)/(q2 r o )] r z. In the original MY level 2.5 turbulent closure model (Mellorand Yamada, 1974, 1982), Sm and Sh were functions of the gradient Richardson number. Byremoving a slight inconsistency in the scaling analysis, Galperin et al. (1988) simpli� ed theMY turbulent closure model so that Sm and Sh depend only on Gh. Gh has an upper bound of0.023 for the case of unstable ( r z . 0) strati� cation and with a lower bound of 2 0.28 forthe case of stable ( r z , 0) strati� cation. As in C&B, the surface and bottom boundary
1998] 1167Chen & Beardsley: Tidal mixing over Georges Bank
conditions for the turbulent kinetic energy and macroscale equations are
q2 5 q2l 5 0 at z 5 z , q2l 5 0, q2 5 B12/3u t b
2 at z 5 2 H, (5)
where ut b is the friction velocity associated with the bottom stress and B1 an empiricalconstant equal to 16.6. The boundary conditions for velocities and temperature are given indetails in C&B.
The numerical domain featured a cross-bank section cut from southeast to northwestacross the center of Georges Bank (Fig. 1). The water depth varied from 300 m off the bankto 100 m at the southern shelf break, and then gradually decreased to 40 m at the northernedge of the bank. The numerical model used the s -coordinate transformation de� ned bys 5 (z 2 z )/(H 1 z ) where s varied from 0 (at the surface) to 2 1 (at the bottom). Auniform grid was used in s , with vertical resolution D s 5 0.011 (91 points in the vertical).This resolution corresponds to a maximum vertical D z of 3.3 m off the bank and to 0.44 mat the northern � ank. A nonuniform horizontal grid was used in the cross-bank direction.The horizontal D x was 500 m near and across the bank and increased linearly over aninterval of 30 grid points to 11.96 km outside the domain of interest. The model time stepwas 110.4 sec, corresponding to 405 time steps over a M2 (12.42 hr) tidal cycle.
Particle trajectories were traced by solving the x and z velocity equations
dx
dt5 u,
d s
dt5
v
H 1 z, (6)
where u and v are the x and s components of water velocity, respectively. The relationbetween v and w is de� ned as
v 5 w 2 (1 1 s )dz
dt2 s
dH
dt(7)
where w is the vertical velocity in the z coordinate direction. The kinematic equations for uand v were calculated by means of a fourth-order Runge-Kutta scheme with a truncationerror of order ( D t)5. Particle velocities used in this calculation were obtained using abilinear interpolationfrom the four nearest grid points.At each time step, each particle waschecked to see if it was located inside the numerical domain. If a particle hit the bottom, itwas reinitialized to a new position using the theory of wave re� ection on the slope wherethe angle of re� ection equaled the angle of incident.An alternative method, which was tokeep the particle at the bottom once it moved out of the model domain, was also tested inour numerical experiments. No signi� cant differences between these two methods werefound for those cases in which high vertical resolution was used.
The fourth-order Runge-Kutta method requires that the time step D t is chosen to satisfythe criterion D tK , 0.05, where K is an upper bound of the spatial gradient of velocity. Inour numerical experiments, K can be approximated by v (the M2 tidal frequency), whichyields D t v < 0.016 for D t 5 110.4 sec, a much smaller value than the above criterion. We
1168 Journal of Marine Research [56, 6
tracked particles in the model space (x, s ) and then converted their trajectories back to thephysical space (x,z). This method avoids the interpolation errors due to repeated transfor-mations from the s - to the z-coordinate.
Since the � ow is nondivergent in the cross-bank plane, the cross-bank velocity � eld canbe described by a streamfunction de� ned as
c 5 2 eH
zudz, (8)
which satis� es u 5 2 c z and w 5 c x.The model was forced by the barotropic M2 tidal elevation at the southern open
boundary.A gravity wave radiation boundary conditionplus a sponge layer was speci� ed atthe northern open boundary to allow the tidal wave to propagate out of the computationaldomain with minimum re� ection (Chapman, 1985). To simulate summertime strati� cation,the initial temperature distribution was speci� ed as a linear function of z, with atemperature of 20°C at the surface and 11°C at the bottom. To simplify the numericalexperiments and interpretation of model results, a constant salinity of 35 PSU was chosenthroughout the model domain, so that the model density depended solely on temperature.To minimize the transient response to sharp initial forcing, the boundary tidal forcing wasinitially ramped up to its full value over two tidal cycles, and the model integrationcontinued in time until a periodic quasi-equilibriumstate was attained, typically after about20 tidal cycles (C&B). The residual � elds of current and temperature presented here aretaken from the periodic quasi-equilibriumstate.
3. Features of tidal mixing
a. Tidal currents, tidal mixing fronts and residual currents
For the case of strong (summer) strati� cation, the periodic equilibrium state is character-ized by strong rotary M2 tidal currents over the bank, with a maximum cross-bank surfacecurrent of about 100 cm/s at the bank crest. The model M2 tidal ellipse has a ratio of majoraxis to minor axis of 1.44–1.48, consistent with the theoretical value of v / f 5 1.47 for aSverdrup plane wave propagating across the bank (Brown, 1984). The model M2 majoraxis is oriented about 1 to 3° counter-clockwise from the on-bank direction, so that thecross-bank component of current is a good approximation for the tidal current along themajor axis. The model M2 tidal current vector leads in time as the bottom is approached;i.e., the current vectors at all levels rotate anticyclonically (clockwise) with an offset of thecurrent vector near the bottom as a result of the bottom friction. Thus, the transitionbetween on- and off-bank � ows occurs � rst in time at the bottom.
The increased tidal mixing over the top of the bank creates the TMFs near the 50 to 60-misobath on the southern � ank and the 40-m isobath on the northern � ank (Fig. 2a). Thesefronts separate vertically, well-mixed water over the top from strati� ed water over the� anks. The presence of strati� cation increases the cross-bank density gradient near thesefronts, enhances cross-bank tidal current advection (strati� ed tidal recti� cation), and
1998] 1169Chen & Beardsley: Tidal mixing over Georges Bank

Figure 2. Cross-bank distributionsof temperature, along-bank velocity, and cross-bank streamfunc-tion averaged over a tidal cycle on the 15th model day for the case of summer strati� cation. Filleddowntriangles labeled A, B, and C indicate the sites where the time-dependent behavior isexamined in detail. The southern � ank, crest, and northern � ank sites correspond to the followingisobaths:A-78 m; B-44 m; and C-67 m. In (b): the direction of the along-bank residual current isindicated by symbols at the top of the � gure. In (c): the direction of the cross-bank residual currentis indicated by arrows on the streamlines.
1170 Journal of Marine Research [56, 6
reduces internal friction (C&B). As a result, the along-bank residual current is intensi� ed atfronts. On the northern � ank, the maximum along-isobath current increases from 16 cm/sin the case of no strati� cation (Chen et al., 1995) to 32 cm/s in the case of summerstrati� cation presented here. On the southern � ank, the along-isobath residual currentintensi� es at the top of the bottom mixed layer, with a maximum along-isobath current of8 cm/s at a height of 27 m above the bottom at the front (Fig. 2b).
The model-predicted pattern of secondary cross-bank circulation varies signi� cantlywith different bottom slopes and tidal mixing. On the northern � ank, the model predictsdouble closed circulation cells, with horizontal divergence near the surface and conver-gence near the bottom at the edge of the front and a near-surface convergence in thestrati� ed region near the front (Fig. 2c). The residual Eulerian velocity near the slopingbottom is characterized by an off-bank downwelling current with a maximum velocity of10 cm/s in the horizontal and 0.3 cm/s in the vertical. On the southern � ank, the secondarycirculation is characterized by multiple closed cells within the frontal zone between the50-m and 100-m isobaths. The cross-bank and vertical residual velocitiesvary in a range of0.5–3 cm/s and of 0.01–0.05 cm/s, respectively (Fig. 2c).
b. Vertical eddy viscosity
In the MY 2.5 level turbulent closure model, the vertical eddy viscosity, Km, isdetermined by a product of the turbulent kinetic energy q, the turbulent macroscale l, andthe stability function Sm (Eqs. 3 and 4). Here q and l are functions of the magnitude of thevertical current shear and vertical gradient of density (here temperature), while Sm dependson the vertical density gradient. Tide-induced shear production of turbulent kinetic energy,Ps, exhibits maximum values near the bottom due to the large vertical shear caused bybottom friction. Since bottom friction increases with the magnitude of the tidal currents,the shear production should be largest where the cross-bank tidal current component islargest. The buoyancy production of turbulent kinetic energy, Pb, depends on the localvertical gradient of temperature (Pb ~ 2 T/ z). As a result of combined shear andbuoyancy productions, the vertical eddy viscosity Km should vary markedly with space andtime over the bank during � ood and ebb tidal cycles. We will now describe thetime-dependent behavior of Km and other variables at three representative sites (A–C) overthe bank (Fig. 2).
Southern � ank (site A). On the southern � ank, at the 78-m isobath (site A), strong turbulentmixing occurs only in the bottom boundary layer, a 25 to 30-m thick layer with weakstrati� cation (Fig. 3). In this layer Km varies periodically with the magnitude and directionof cross-bank tidal current, with a maximum Km < 0.04 m2/s occurring within one hourafter maximum on-bank tidal current (40 cm/s) and a minimum Km < 0.015 m2/s occurringaround tidal transition.
The stability function Sm( 5 Km/ql) also exhibits a similar asymmetry in time, with amaximum value of 0.5 near the bottom about 1 to 2 hours after the maximum Km. Due tothe rotary nature of these tidal currents, q exhibits two maxima during each tidal cycle.
1998] 1171Chen & Beardsley: Tidal mixing over Georges Bank
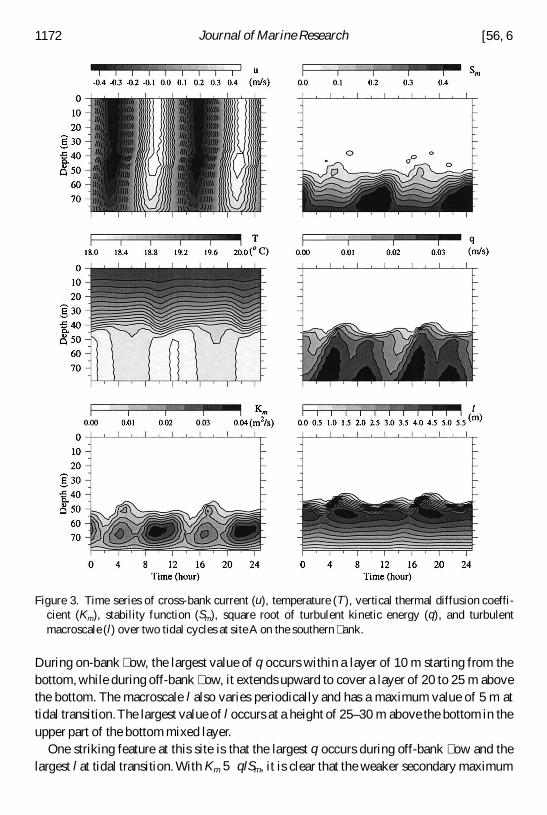
During on-bank � ow, the largest value of q occurs within a layer of 10 m starting from thebottom, while during off-bank � ow, it extends upward to cover a layer of 20 to 25 m abovethe bottom. The macroscale l also varies periodically and has a maximum value of 5 m attidal transition.The largest value of l occurs at a height of 25–30 m above the bottom in theupper part of the bottom mixed layer.
One striking feature at this site is that the largest q occurs during off-bank � ow and thelargest l at tidal transition. With Km 5 qlSm, it is clear that the weaker secondary maximum
Figure 3. Time series of cross-bank current (u), temperature (T), vertical thermal diffusion coeffi-cient (Km), stability function (Sm), square root of turbulent kinetic energy (q), and turbulentmacroscale (l) over two tidal cycles at site A on the southern � ank.
1172 Journal of Marine Research [56, 6
in Km during off-bank � ow is due to the smaller values of Sm and l but not q (which was atits maximum), while the primary maximum of Km during the on-bank � ow is due to anenhanced Sm plus increased ql.
What is the explanation of this asymmetric behavior of tidal mixing according to themodel physics? As seen in the temperature time series (Fig. 3), the temperature in thebottom boundary layer decreases during on-bank � ow. Due to the strong shear of thecross-bank current near the bottom, the temperature drops more rapidly in the upper part ofthe boundary layer than near the bottom, as cooler water is preferentially carried over thewarmer water nearest the bottom. This results in gravitational instability near the bottom ina period of about 3 to 4 hours during on-bank tidal � ow. The unstable vertical pro� le oftemperature produces a positive Pb, increases Sm, and thus enhances Km. During off-bank� ow, the vertical shear of the tidal current causes the water to warm up more slowly nearthe bottom than in the upper part of the boundary layer, enhancingvertical strati� cation andreducing vertical mixing.
Crest (site B). Over the top of the bank between TMFs, the water is vertically well mixed(Fig. 2) and Km is characterized by a parabolic curve in the vertical, which varies inmagnitude as a function of the magnitude of the cross-bank tidal current. At the 44-misobath (site B), Km has a maximum value of about 0.07 m2/s at a depth of 25 m, decreasingupward to the surface and downward to the bottom (Fig. 4). Km varies almost symmetri-cally in time, with its maximum value occurring about one hour after maximum on- andoff-bank currents.
The symmetric variation of Km over the crest is a result of the basic rotary nature of theM2 tidal current. In this well-mixed region, turbulent kinetic energy is produced by shearproduction. Since shear production is independent of the current direction, the variation ofq is nearly symmetric in time through � ood and ebb tidal cycles. l is largest aroundmid-depth and decreases toward both surface and bottom boundaries. This contributesdirectly to the largest value of Km found at mid-depth about one hour after maximum � oodand ebb currents.
Northern � ank (site C). On the northern � ank at the 67-m isobath (site C), Km and othervariables exhibit much more complex time-dependent patterns (Fig. 5). The cross-bankcurrent is asymmetric in time, with a faster (slower) off-bank (on-bank) � ow over a shorter(longer) time interval (Figs. 5 and 7). The off-bank current also exhibits a signi� cantO(1 hour) time lag in the vertical, which is not seen in the on-bank � ow. During off-bank� ow, mixing is moderate in strength and restricted in a thin bottom boundary layer of5–10 m during the initial phase. Just after maximum off-bank � ow, the temperature withinthe upper 50 m reverses its warming tendency and remains cooler with a much reducedvertical density gradient for about two hours. This produces a large Km of about0.01–0.04 m2/s in the upper 50 m.
During on-bank tidal � ow, the temperature within the lower 50 m above the bottom
1998] 1173Chen & Beardsley: Tidal mixing over Georges Bank

decreases monotonically as the on-bank tidal current increases, with a cold core formingnear the bottom about one hour after maximum on-bank � ow. Near the bottom, tidalmixing also increases upward as the on-bank � ow increases, with a maximum Km of about0.04 m2/s occurring at a depth of about 58 m (8 m above the bottom), about one hourbefore maximum on-bank � ow.
At site C, q generally decreases with height above the bottom, with the largest value near
Figure 4. Time series of cross-bank current (u), temperature (T), vertical thermal diffusion coeffi-cient (Km), stability function (Sm), square root of turbulent kinetic energy (q), and turbulentmacroscale (l) over two tidal cycles at site B at the crest of the bank.
1174 Journal of Marine Research [56, 6
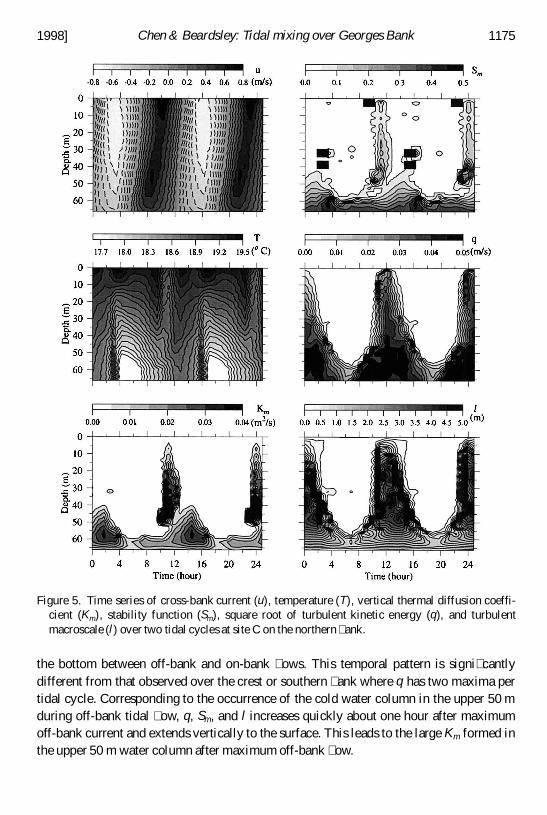
the bottom between off-bank and on-bank � ows. This temporal pattern is signi� cantlydifferent from that observed over the crest or southern � ank where q has two maxima pertidal cycle. Corresponding to the occurrence of the cold water column in the upper 50 mduring off-bank tidal � ow, q, Sm, and l increases quickly about one hour after maximumoff-bank current and extends vertically to the surface. This leads to the large Km formed inthe upper 50 m water column after maximum off-bank � ow.
Figure 5. Time series of cross-bank current (u), temperature (T), vertical thermal diffusion coeffi-cient (Km), stability function (Sm), square root of turbulent kinetic energy (q), and turbulentmacroscale (l) over two tidal cycles at site C on the northern � ank.
1998] 1175Chen & Beardsley: Tidal mixing over Georges Bank
Comparisons with observationsand previous model results. The model-predictedasymme-try of tidal mixing during off- and on-bank tidal � ows is evident in recent observations onthe northeastern � ank of Georges Bank. Combined CTD, ADCP, and microstructuremeasurements made at site D (Fig. 1) during summer–fall, 1988 showed a cold core oftemperature near the bottom during on-bank � ow, which resulted in relatively strongertidal mixing occurring around maximum on-bank tidal current (Yoshida and Oakey, 1996).Microstructure measurements made in the bottom boundary layer at the shelf break in theEast China Sea also showed stronger mixing as cold water was advected onto the shelfduring � ood tidal � ow (Matsuno et al., 1994).
Estimates of Km have been made using in-situ data at several sites on Georges Bank.Using high resolution current pro� le data obtained at a weakly strati� ed site on the 75-misobath (site E, Fig. 1) on the southern � ank during February–March, 1995, Werner (1996)found that Km increased to a maximum value of 0.06 6 0.02 m2/s at a height of 30 m abovethe bottom. Based on turbulent dissipation rate estimates and the mean vertical currentshear observed during April–June, 1995, Burgett (1997) calculated the time-depth aver-aged Km at a mixed site on the 45-m isobath (site F, Fig. 1) to be 0.032 6 0.003 m2/s (with adepth-averaged tidal range of 0.01 to 0.05 m2/s with an uncertainty of 6 0.003 m2/s, and ata strati� ed site on the 76-m isobath on the southern � ank (site G, Fig. 1) to be 0.023 60.004 m2/s (with a depth-averaged tidal range of 0.003 to 0.044 m2/s with an uncertainty of6 0.004 m2/s). A similar estimation made by Yoshida and Oakey (1996) showed that Km
was higher than 0.01 m2/s near the bottom around maximum on-bank and off-bank � ows atthe strati� ed site D on the northern � ank.
Model predictions of Km are consistent with these recent � eld estimates. At site A, themodel-predicted, time-depth averaged Km in the bottom mixed layer was 0.023 m2/s with adepth-averaged tidal range of 0.003 to 0.044 m2/s. This value was in good agreement withBurgett’s (1997) results at site F. At site C, the model predicted Km near the bottom variedfrom 0.01 to 0.04 m2/s, which was in the same range as the observed values estimated byYoshida and Oakey (1996).
To compare with Werner’s (1996) results, we re-ran the model with weaker initialstrati� cation to simulate the winter case. At the 76-isobath on the southern � ank, themodel-predicted, tidally averaged Km varies parabolically in the vertical, with a maximumvalue of 0.05 m2/s at a height of 30 m above the bottom.This shape and amplitude comparewell with Werner’s pro� le over the lower half of the water column.
Naimie (1996) used a turbulent closure � nite-element model to study the 3-D circulationover Georges Bank during weak and strong strati� cation periods. He also noticed a denselens occurring near the bottom during the � ood tide. Our model results, with an idealizedstrati� cation and bottom topography, support the similar � nding by Naimie (1996) and alsoprovide additional insights into gravitational instability related to enhanced tidal mixingaround the maximum � ood tide.
1176 Journal of Marine Research [56, 6

c. Thickness of the bottom boundary layer
Physical processes controlling tidal mixing over the southern and northern � anks differ.On the southern slope during on-bank tidal � ow, the interaction of the tidal current with thesloping bottom results in a counter-clockwise,cross-isobath circulation cell near the bottombelow 150 m (Fig. 6). This current advects colder water upslope in the interior and warmerwater downslope near the bottom, thus enhancing vertical mixing. When the tidal � owturns off-bank, the near-bottom, cross-isobath circulation cell reverses, advecting warmerwater downslope in the interior and colder water upslope near the bottom and thus reducingvertical mixing. The thickness of the bottom boundary layer is de� ned here as the heightabove the bottom where D T 5 T(z) 2 Tb # 0.02°C. Here T(z) is the temperature at z and Tb
is the temperature at the bottom (Lentz and Trowbridge, 1991; Trowbridge and Lentz,1991). Over the upper � ank in water depths less than 150 m, the counter-rotary bottomcirculation cell disappears but the temporal variation of the thickness of the bottom
Figure 6. The cross-bank streamfunction C at maximum � ood and ebb tides on the southern (right)and northern (left) � anks. The contour interval for C is 4 m2/s.
1998] 1177Chen & Beardsley: Tidal mixing over Georges Bank
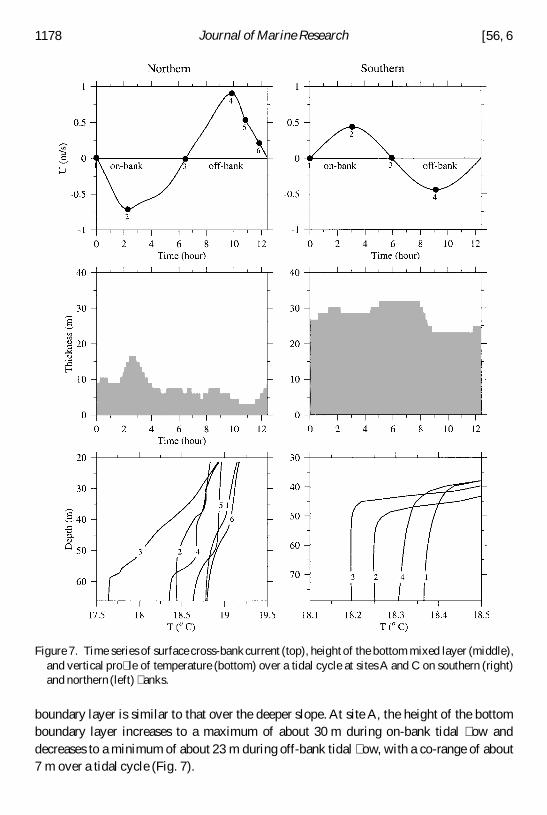
boundary layer is similar to that over the deeper slope. At site A, the height of the bottomboundary layer increases to a maximum of about 30 m during on-bank tidal � ow anddecreases to a minimum of about 23 m during off-bank tidal � ow, with a co-range of about7 m over a tidal cycle (Fig. 7).
Figure 7. Time series of surface cross-bankcurrent (top), height of the bottom mixed layer (middle),and vertical pro� le of temperature (bottom) over a tidal cycle at sites A and C on southern (right)and northern (left) � anks.
1178 Journal of Marine Research [56, 6

On the steep northern � ank, however, the off-bank current acts like a waterfall to advectwarmer water downslope with a displacement of 50 m in a narrow region near the bottom(Fig. 6). As a result, a large cross-isobath temperature gradient forms over the slope. Whenthe tidal � ow reverses, the upslope current carries colder water upward along the slope,which decreases the cross-isobath temperature gradient within the bottom boundary layer.A deep depression of streamlines is found about 15 km away from the northern edge of thebank at maximum off-bank current. This structure also is observed at maximum on-bankcurrent, but the depth of the depression is less and its width is wider. At site C, the height ofthe bottom boundary layer reaches a maximum of 15 m near maximum on-bank tidalcurrent and decreases to a minimum of 3 m just after maximum off-bank current. Thebottom mixed layer is poorly de� ned in four hours around the transition time from off-bankto on-bank � ows due to strong mixing throughout the water column (Figs. 5 and 7). Thebottom mixed layer reappears as the on-bank � ow increases and mixing is restricted to thebottom.
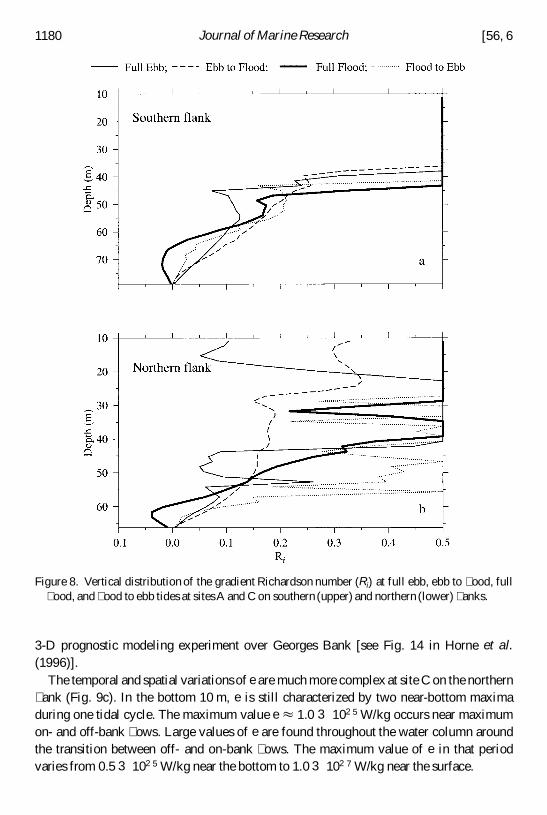
Over the southern � ank, the bottom boundary layer is characterized by a small gradientRichardson number (Ri , 0.2) over a tidal cycle. At site A, a negative Ri occurs atmaximum on-bank current, with the maximum absolute value at about 8 m above thebottom (Fig. 8a), indicative of the unstable density gradient occurring during on-bank � ow.Over the northern � ank, the vertical structure of Ri is more complex. At site C, Ri , 0.2occurs up to a height of 40 m above the bottom during the transition from off- to on-bank� ow, consistent with the large mixing within the water column (Fig. 5). As over thesouthern � ank, the near-bottom density gradient becomes unstable during on-bank � ow,causing negative Ri.
d. Dissipation rate
Temporal and vertical variations of the turbulent dissipation rate e at southern � ank, top,and northern � ank sites are shown in Figure 9. At site A, e varies periodically with thecross-bank tidal current, reaching maximum values near the maximum cross-bank current.e is largest near the bottom and decreases monotonically upward within the bottomboundary layer (Fig. 9a). e is about 0.5 3 10 2 5 W/kg near the bottom at maximum on- andoff-bank � ows, and about 10 2 7 W/kg at the top of the bottom boundary layer. The time lagbetween the occurrence of maximum e at the bottom and top of the boundary layer(thickness , 40 m) is about 1 hour. This time lag is probably caused by the phase-laggedlocal production of turbulent kinetic energy (Simpson et al., 1996).
At site B, e also varies periodically with cross-bank tidal current, with a monotonicvertical decay (Fig. 9b). The maximum value of e < 8 3 10 2 5 W/kg occurs at the bottomduring maximum cross-bank � ow. The vertical phase shift is still noticeable in Figure 9bbut the time lag at the bottom and surface is less than 0.5 hour, suggesting a quicker upwardtransfer rate of the turbulent shear production. A similar time-dependent distribution of ewas found at a mixed site on the northeast � ank of Georges Bank by Naimie (1996) in a
1998] 1179Chen & Beardsley: Tidal mixing over Georges Bank
3-D prognostic modeling experiment over Georges Bank [see Fig. 14 in Horne et al.(1996)].
The temporal and spatial variations of e are much more complex at site C on the northern� ank (Fig. 9c). In the bottom 10 m, e is still characterized by two near-bottom maximaduring one tidal cycle. The maximum value e < 1.0 3 10 2 5 W/kg occurs near maximumon- and off-bank � ows. Large values of e are found throughout the water column aroundthe transition between off- and on-bank � ows. The maximum value of e in that periodvaries from 0.5 3 10 2 5 W/kg near the bottom to 1.0 3 102 7 W/kg near the surface.
Figure 8. Vertical distribution of the gradient Richardson number (Ri) at full ebb, ebb to � ood, full� ood, and � ood to ebb tides at sites A and C on southern (upper) and northern (lower) � anks.
1180 Journal of Marine Research [56, 6

Figure 9. Time series of turbulent dissipation rates at site A, B, and C on the southern (a), crest (b),and northern (c) � anks over two tidal cycles.
1998] 1181Chen & Beardsley: Tidal mixing over Georges Bank

These model-predicted values of e can be compared with recent estimates based onin-situ microstructure measurements on Georges Bank. Burgett (1997) used power spectraof the observed velocity shear to estimate e at the mixed site F and the strati� ed site E onthe southern � ank (Fig. 1). At the mixed site, e varied periodically, having a large valuenear maximum off- and on-bank currents. The maximum e was about 1.0 3 10 2 5 W/kg atthe bottom and decreased to 1.0 3 10 2 6 W/kg at 35 m above the bottom.The vertical phaselag of maximum e was less than one hour over the 45-m water column. At the deeperstrati� ed site, the maximum e was about 0.5 3 102 5 W/kg near the bottom and decreased to1.0 3 102 7 W/kg at the base of the pycnocline, about 40 m above the bottom. The phaselag of maximum e at the bottom and the base of the pycnocline was about two to two and ahalf hours. At site D on the northern � ank, Yoshida and Oakey (1996) also found that evaried periodically with on- and off-bank tidal � ows, which reached a maximum value as eexceeded 1.0 3 10 2 6 W/kg near the bottom and decreased to 1.0 3 10 2 7 W/kg at the baseof the pcynocline, about 40 m above the bottom. Horne et al. (1996) found similar results atthe mixed site H, where the maximum e ranged from 1.0 3 10 2 5 W/kg at the bottom to1.0 3 102 6 2 0.5 3 10 2 5 W/kg at a depth of 10 m below the surface.
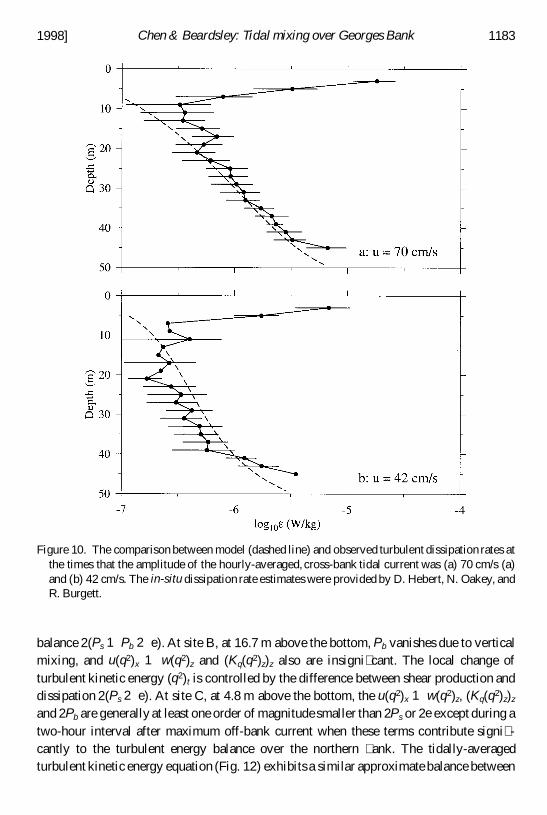
A direct comparison between model and observed dissipation rates on the southern � ankis shown in Figure 10. The observed data used in this comparison were obtained at ananchor station at site F, at the 45-m isobath on the southern � ank, where the amplitude ofcross-bank tidal current was about 70 cm/s. This site was about 40 km away from thecross-bank slice used in our model (Fig. 1). The model e shown here was taken at a gridpoint at the 54-m isobath on the model southern � ank where the cross-bank tidal currenthas the same amplitude as that observed at site F. The comparison is made at the timeswhen the amplitudes of the tidal � ow is 70 cm/s (Fig. 10a) and of 42 cm/s (Fig. 10b). Theobserved dissipation rates were calculated as a 10-sample average over one hour.Considering the uncertainty of measurements and the idealized 2D nature of the numericalmodel, the model dissipation rate agrees well in both magnitude and vertical phase with theobserved e within the water column. The disagreement near the surface is not surprising,since the large dissipation rate observed near the surface was caused by wind mixing whichis not included in our current model study.
e. Balance of turbulent kinetic energy
The turbulent kinetic energy balance produced by the MY level 2.5 turbulent closuremodel for summer strati� cation is presented next. The results show that in the turbulentkinetic energy equation (1), the shear production of turbulence, Ps, approximately balancesthe turbulentdissipation e over the bank (Fig. 11). For example, at 13.3 m above the bottomat site A, the nonlinear advection [u(q2)x 1 w(q2)z] and vertical diffusion [(Kq(q2)z)z] termsare much smaller than 2Ps or 2 e , so that they can be neglected in the bottom boundary layer.Although the buoyancy production of turbulence term Pb is about one order of magnitudesmaller than Ps, it plays an important role in mixing asymmetry during the on- and off-bank� ows. The local change of turbulent kinetic energy (q2)t is controlled by the approximate
1182 Journal of Marine Research [56, 6
balance 2(Ps 1 Pb 2 e ). At site B, at 16.7 m above the bottom, Pb vanishes due to verticalmixing, and u(q2)x 1 w(q2)z and (Kq(q2)z)z also are insigni� cant. The local change ofturbulent kinetic energy (q2)t is controlled by the difference between shear production anddissipation 2(Ps 2 e ). At site C, at 4.8 m above the bottom, the u(q2)x 1 w(q2)z, (Kq(q2)z)z
and 2Pb are generally at least one order of magnitude smaller than 2Ps or 2 e except during atwo-hour interval after maximum off-bank current when these terms contribute signi� -cantly to the turbulent energy balance over the northern � ank. The tidally-averagedturbulent kinetic energy equation (Fig. 12) exhibits a similar approximate balance between
Figure 10. The comparison between model (dashed line) and observed turbulent dissipation rates atthe times that the amplitude of the hourly-averaged, cross-bank tidal current was (a) 70 cm/s (a)and (b) 42 cm/s. The in-situ dissipation rate estimates were provided by D. Hebert, N. Oakey, andR. Burgett.
1998] 1183Chen & Beardsley: Tidal mixing over Georges Bank

Figure 11. Time series of terms in the turbulent kinetic energy equation at depths of 64.7 m (13.3 mabove the bottom) at siteA (southern� ank), 27.3 m (16.7 m above the bottom) at site B (crest), and60.2 m (4.8 m above the bottom) at site C (northern � ank).
1184 Journal of Marine Research [56, 6

Figure 12. Vertical distribution of major terms in the turbulent kinetic energy equation at site A(southern � ank), site B (crest), and site C (northern � ank).All terms are averaged over a tidal cycleon the 15th model day.
1998] 1185Chen & Beardsley: Tidal mixing over Georges Bank

shear production and dissipation, with both Ps and e decaying vertically from maximumvalues at the bottom.
These model results suggest that tidal mixing over Georges Bank is driven primarily bylocal turbulent production, with a basic balance between shear production and dissipation.Although buoyancy production is generally much smaller than shear production, Pb
contributes to mixing asymmetry during on- and off-bank � ows. Over the southern � ankand shallow top, tidal mixing is characterized by a vertical 1-D balance between shearproduction,buoyancy production (in the strati� ed region), and dissipation.On the northern� ank where the bottom slope is large, as a � rst-order approximation,advection and verticaldiffusion of turbulent kinetic energy also contribute to the turbulent kinetic energy balance.
4. Tide-induced internal waves
With sufficiently high vertical and horizontal resolutions, internal waves form at theedges of the model bank. Characteristics of these waves differ over the � anks. On thesouthern � ank, the 19°C isotherm develops a small initial depression over the shelf breakduring maximum off-bank current (Fig. 13). This internal feature, approximately stationaryduring the period of decreasing off-bank � ow, begins to move on-bank with a speed thatvaries over time. The fastest speed co < 103 cm/s occurs during a three-hour periodbracketing the maximum on-bank current (time 5 7 to 11 in Fig. 11). During that period,the time-averaged, on-bank current over the propagation region is u 5 20 cm/s. The localphase speed cp 5 co 2 u < 83 cm/s. This phase speed is in the range of 43 to 195 cm/sestimated for the lowest internal wave mode based on the mean density (temperature)pro� le and local water depth near site A (C&B).
The amplitude of this internal wave can be estimated from the vertical excursion of the19°C isotherm. It decays in time as the water becomes shallower and disappearscompletely in the TMF (located near x 5 45 km from the southern edge of the bank,Fig. 2). The maximum amplitude is about 8 m, occurring near x 5 5 km at maximumon-bank current. The horizontal separation scale is about 15 km. The remarkable verticalvariation of the temperature, which was found at site A near maximum on-bank current(Fig. 3), is a part of this internal wave feature at a location of the trough.
On the northern � ank, a depression of the 19°C isotherm occurs at the outer edge of thebank one hour before the on-bank � ow reverses (Fig. 14). This depression becomes sharperin the early phase of off-bank � ow and then spreads horizontally as the TMF migratesoff-bank. A second depression of the 19°C isotherm forms at the outer edge of the bankaround maximum off-bank current. The maximum vertical scale of this thermal depressionis about 50 m, occurring one hour after maximum off-bank � ow. The amplitudes of thesedepressions decrease rapidly as they are advected onto the bank during on-bank tidal � ow.
The formation of the depression at the northern edge of the bank might be a result ofhydraulic jump that occurs on the lee side of the bank where the tidal motion becomessupercritical. At the 80-m isobath where the sharp depression begins during maximumoff-bank � ow, the vertically-averaged tidal current ub is about 43 cm/s, very close to co 5
1186 Journal of Marine Research [56, 6

Figure 13. Time sequencesof the cross-bankcurrent (u) at the depth of 30 m on the 70-m isobath andthe 19°C isothermal line on the southern � ank over a tidal cycle. The isothermal line at time n isoffset in the vertical by 10(n 2 1) where n varies from 1 to 16. The mean depth of the 19°Cisotherm at the 70-m isobath is about 35 m.
1998] 1187Chen & Beardsley: Tidal mixing over Georges Bank
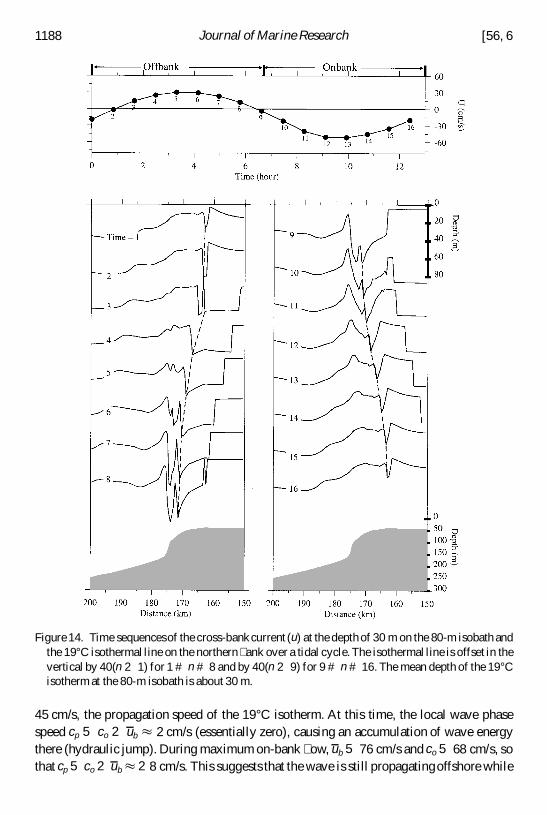
45 cm/s, the propagation speed of the 19°C isotherm. At this time, the local wave phasespeed cp 5 co 2 ub < 2 cm/s (essentially zero), causing an accumulation of wave energythere (hydraulic jump). During maximum on-bank � ow, ub 5 76 cm/s and co 5 68 cm/s, sothat cp 5 co 2 ub < 2 8 cm/s. This suggests that the wave is still propagatingoffshore while
Figure 14. Time sequencesof the cross-bankcurrent (u) at the depth of 30 m on the 80-m isobath andthe 19°C isothermal line on the northern � ank over a tidal cycle. The isothermal line is offset in thevertical by 40(n 2 1) for 1 # n # 8 and by 40(n 2 9) for 9 # n # 16. The mean depth of the 19°Cisotherm at the 80-m isobath is about 30 m.
1188 Journal of Marine Research [56, 6
it is being advected back onto the bank. The formation of the depression can be explainedalso by mass conservation. During off-bank � ow, the steep bottom topography on thenorthern � ank causes the current to converge near the surface at the edge of the bank. Themaximum convergence occurs at maximum off-bank � ow, causing a strong downwardcurrent and thus leading to the sharp depression of isotherms. The strong vertical shearsassociated with this depression contribute directly to strong tidal mixing found in the upper50 m after maximum off-bank � ow (Fig. 5).
5. Cross-bank water exchange
To study the cross-bank water exchange during tidal mixing and recti� cation, wereleased passive particles at different depths on both � anks of the model bank. Since themodel tidal forcing increased from zero to full value over two tidal cycles, all particleswere deployed at the time when the model forcing was at full strength and tidal mixing wasjust beginning at the end of the second tidal period. The primary experiments wereconducted with summer strati� cation. Particle tracking was carried out for four weeks. InFigures 15 and 16, we show particle trajectories obtained after about 10.3 model days whenan equilibrium state of tidal mixing is reached. In Figure 17, the particles are traced fromtheir initial deployment positions. An alternative experiment in which particles weredeployed at the end of the 10th model day were made to examine the sensitivity of particletrajectories to their initial locations; no signi� cant differences were found for the pattern ofparticle trajectories over the bank. To investigate the effects of strati� cation on cross-banktransport, we also conducted experiments using weaker initial strati� cation and nostrati� cation. In the weak strati� cation case, the initial temperature distribution wasspeci� ed as a linear function of z, with a temperature of 13°C at the surface and 11°C at thebottom (Chen et al., 1995).
a. Cross-frontal particle exchange
For the summer strati� cation case, particles released initially in the strati� ed region inthe bottom boundary layer within the southern frontal zone mainly move in a clockwiseresidual circulation cell (Fig. 15) in addition to oscillating within a tidal excursion length of2U/ v . Some particles near the bottom, however, move on-bank across the TMF withmaximum speeds of 0.6–1.0 cm/s and enter the mixed region on the top of the bank. Thissuggests that a net on-bank water � ux through the TMF can occur near the bottom on thesouthern � ank. The clockwise pattern of residual particle trajectories is similar to thecross-bank secondary circulation pattern found by Garrett and Loder (1981), suggestingthat ageostrophic frontal circulation is a predominant factor to the cross-bank � ow on thesouthern � ank.
At the northern edge, particles tend to be advected upslope along the sloping bottom and
1998] 1189Chen & Beardsley: Tidal mixing over Georges Bank

Figure 15. Tidal-cycle residual trajectories of particles on the southern � ank for 19.67 days. Thesolid circle indicates the particle’s location at which it started to be traced (after 10.3 model days).
1190 Journal of Marine Research [56, 6

Figure 16. Tidal-cycle residual trajectories of particles on the northern � ank for 19.67 days. Thesolid circle indicates the particle’s location at which it started to be traced (after 10.3 model days).
1998] 1191Chen & Beardsley: Tidal mixing over Georges Bank
then recirculate counter-clockwise near the TMF (Fig. 16). Although many particles crossthe front and enter the mixed region, they all tend to move back to the strati� ed region viagyres. The center of the counter-clockwise gyre is located about 5 km on-bank from thenorthern front. No particles leave this circulation cell except near the bottom where a fewparticles move onto the top of the bank.
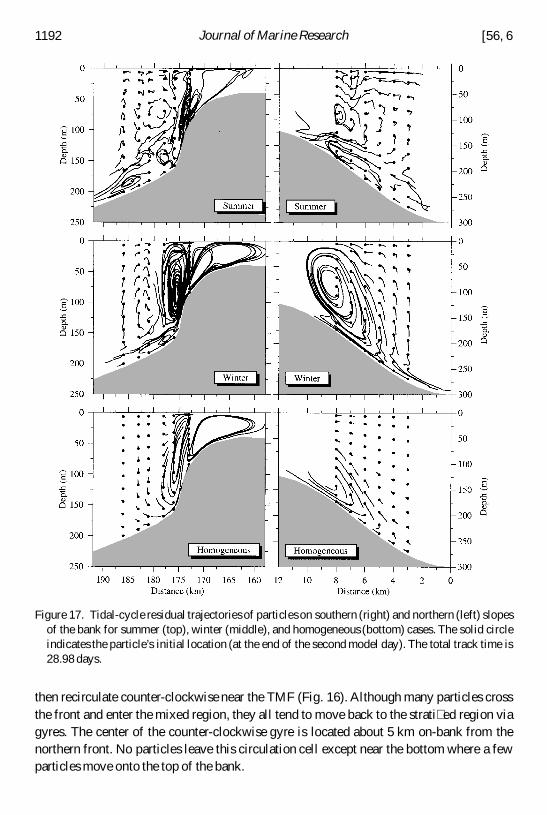
Figure 17. Tidal-cycle residual trajectories of particles on southern (right) and northern (left) slopesof the bank for summer (top), winter (middle), and homogeneous (bottom) cases. The solid circleindicates the particle’s initial location (at the end of the second model day). The total track time is28.98 days.
1192 Journal of Marine Research [56, 6

b. Particle trajectories over the � anks
On the deep southern � ank, particles released initially in the strati� ed region outside thesloping bottom boundary layer for the summer strati� cation move in a clockwise residualcirculation cell. Particle trajectories near the bottom consist of two groups. Particles overthe shallow slope (depth less than 250 m) tend to move upslope onto the bank, whileparticles over the deeper slope move offbank along the bottom (Fig. 17). The maximummean up-slope speed is about 0.2–0.3 cm/s, occurring near the top of the bottom boundarylayer. On the deep northern � ank, the near-bottom particles below 180 m move downslope,though particles in the upper slope tend to climb along the sloping bottom. The up-slopevelocity near the bottom in the upper slope is about 2 cm/s. At this speed, a particle at adepth of 74 m could be carried to the surface along the slope in about 4 days.
Particle trajectories in the weak strati� cation case are very different from those in thesummer strati� cation case. On the southern slope, although the pattern of the trajectories issimilar to that found in the summer strati� cation case, particle trajectories in the shallowslope above 250 m are characterized by a much stronger clockwise gyre with a center at thedepth of 75 m on the 150-m isobath. The particles near the bottom in the deep slope alsomove off-bank at a much faster speed. On the northern slope, particles near the bottom inthe upper slope (shallower than 100 m) generally move in a counter-clockwise cell, with anupslope � ow near the bottom. Particles in the deep slope tend to move along two paths, onein a narrow, elliptically clockwise cell, and another off-bank along the bottom.
Trajectories of particles in the homogeneous case are very similar to those in the weakstrati� cation case: a single clockwise Lagrangian residual circulation cell on the southernslope and double Lagrangian circulation cells on the northern slope. However, on thesouthern slope, the mean particle displacements are almost zero in the upper layer, so thatthe residual movement of particles is restricted to the bottom. This is consistent with thetheory of barotropic tidal recti� cation. That theory suggests that the tidal residual � ow issigni� cant only over a sloping bottom where nonlinear advection and friction are large(Loder, 1980; Zimmerman, 1978; C&B). The same applies to the northern slope, wheremean particle motion is restricted in the narrow region over the steep bottom topographyand the mean particle displacements in the deep off-bank region tend to be zero (Fig. 17).
c. The Euler-Lagrange comparison
The particle trajectories described above differ from the patterns of cross-bank residualEulerian circulation shown in Figure 2. On the southern � ank, the residual Eulerian � eldhas multiple closed circulation cells within the frontal zone between the 50- and 100-misobaths, while particle trajectories show a clockwise cell at the front and more complexmultiple cells within the frontal zone. According to the Lagrangian particle trajectories,water is upwelled at the edge of the front and moves to the strati� ed region near the surface.A convergence region exists near the surface in the strati� ed side, which pushes particles tomove downward along the top of the bottom mixed layer. Some of these particles are
1998] 1193Chen & Beardsley: Tidal mixing over Georges Bank
recirculated in multiple cells in the bottom mixed layer or the upper strati� ed region withinthe frontal zone.
On the northern � ank, the Eulerian � eld features a clockwise residual circulation cell atthe front with downwelling along the bottom (Fig. 2), while the Lagrangian particletrajectories suggest a counterclockwise residual circulation cell with upwelling along thebottom (Fig. 16). These two patterns are completely opposite! To check our model results,we repeated our experiment by releasing particles after the TMF reached an equilibriumstate. The results of the particle trajectories were almost identical.
The trajectory of a selected particle is shown in Figure 18 to examine particledisplacement over a tidal cycle on the northern � ank. This particle was initially released ata depth of 82 m near the bottom after 15 model days. During the � rst tidal cycle, theparticle moves over an excursion of about 80 m in the vertical and 5 km in the horizontal.After one tidal period, the position of the particle shifts about 1.2-km on-bank and 11.4 mupward. The tidally-averaged Lagrangian velocity of that particle was about 2 3 cm/s inthe cross-bank direction (on-bank) and about 0.03 cm/s in the vertical (upward). Thetidally-averaged,near-bottom Eulerian velocity at the 80-m isobath on the northern � ank isabout 9 cm/s in the cross-bank direction (off-bank) and 2 0.09 cm/s in the vertical(downward). This suggests that the tidally-averaged Stokes velocity is about 2 12 cm/s inthe cross-bank direction (on-bank) and about 0.12 cm/s in the vertical (upward). Thus theparticle follows a similar pattern in successive tidal cycles and moves up from a depth of80 m to 25 m over 10 tidal cycles.
These experiments with Lagrangian particle tracking suggest that the residual Lagrang-ian and Eulerian currents are very different over Georges Bank. Strong nonlinearity on thenorthern � ank can cause the cross-bank Lagrangian current to oppose the cross-bankEulerian current over the upper slope at the edge of the bank. The different Eulerian andLagrangian current patterns were suggested � rst by Loder and Wright (1985) based on thetruncated Taylor series expansion and also were demonstrated in a particle-tracking modelstudy for homogenous case by Loder et al. (1997). Opposite directions of cross-bankEulerian and Lagrangian currents in a strong strati� ed case have not been demonstrateduntil this current study.
d. Passive tracer experiments
In the summer strati� cation case, the particle trajectories indicate an up-slope watertransport on both southern and northern slopes of the bank. Cross-isobath � ow is furtherexamined here using a passive tracer. Experiments were made with two different initialdistributionsof a passive tracer
P 5 5 0 as z , 50 m
1 as z $ 50 m(case 1) and P 5 5 0 as z , 150 m
1 as z $ 150 m(case 2),
where P is the concentration of the tracer. To examine the in� uences of advection anddiffusion on the movement of P, we have run the model with pure advection and advection
1194 Journal of Marine Research [56, 6

Figure 18. The trajectoriesof a particle over three tidal cycle on the northern � ank. That particlewasreleased at the beginning of the 15th model day. The � lled triangle and circle indicate the startingand ending positions of the particle over each tidal period.
1998] 1195Chen & Beardsley: Tidal mixing over Georges Bank

plus diffusion, respectively. For this study, we used the MultidimensionalPositive De� niteAdvection Transport Algorithm (MPDATA) introduced by Smolarkiewicz (1984). Thebasic concept of this scheme is the successive application of an upwind scheme with acorrection to the � rst-order truncation error by using a so-called ‘‘anti-diffusion’’ velocity.The repeated procedure yields a positive de� nite advection algorithm with second-orderaccuracy (Smolarkiewicz and Clark 1986; Smolarkiewicz and Grabowski, 1990).
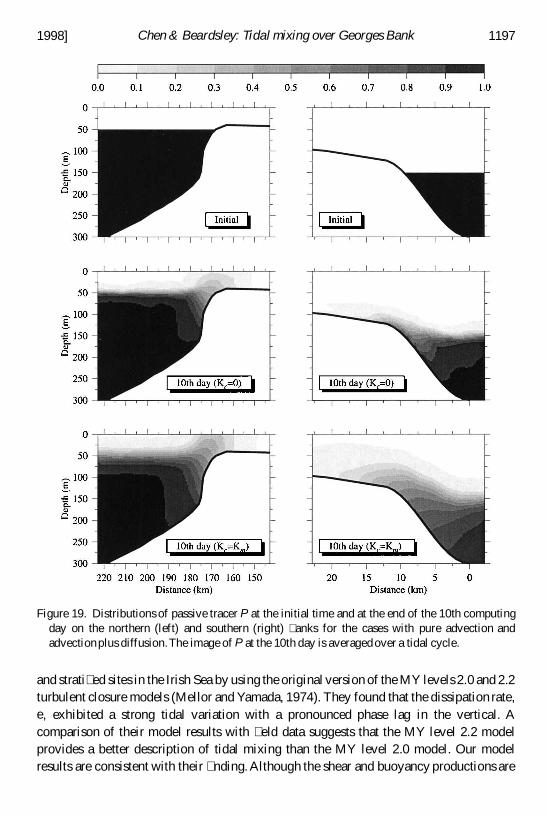
Figure 19 shows the distribution of P at the initial time and the 10th day on the northern� ank for case 1 and on the southern � ank for case 2. With no diffusion (Kc 5 0), the modelexhibits an up-slope advection toward the TMF on both southern and northern � anks. Thenet up-slope advection of P is increased and spread out when tracer diffusion (Kc Þ 0) isadded. These passive tracer experiments are consistent with the basic results of the particletracking experiments described in the previous section, and support the suggestion that atidally-induced physical mechanism can transport materials (e.g., nutrients) upslope onboth sides of Georges Bank during summer.
6. Discussion
Past � eld work provides evidence of the up-slope intrusion of nutrient-rich slope wateron the southern � ank and nutrient-rich Gulf of Maine intermediate water on the northern� ank during summer (Hopkins and Gar� eld 1979; Magnell et al., 1981; Pastuszak et al.,1982). The prevailing winds in summer are northeastward which tend to generateupwelling on the southern � ank and downwelling on the northern � ank. The fact thatnutrients are advected over both � anks suggests that another physical mechanism besideswind forcing (which is weak in summer) must be important. The model particle trajectoryand tracer experiments presented above suggest that upwelling can occur near the bottomin the shallow slope on both sides of the bank during strong summer strati� cation. Theformation of these upwelling currents is associated with strati� ed tidal recti� cation over asloping bottom topography.
The 2-D model results presented here are generally consistent with recent 3-D modelexperiments conducted by Naimie (1996) using more realistic Georges Bank/Gulf ofMaine topography and climatological hydrographic conditions. Analysis of the turbulentkinetic equation in our study suggests that tidal mixing over Georges Bank is characterizedto lowest order by a 1-D balance between shear production of turbulence, buoyancyproduction (in the strati� ed region), and turbulent dissipation. This result indicates that the1-D MY-2.5 model used in the 3-D circulation model by Naimie (1996) is a goodapproximation for tidal mixing over most of Georges Bank except perhaps the northern� ank where advection of turbulent kinetic energy can contribute to the local balance. The1-D nature of turbulence with a basic balance between turbulent shear production anddissipation found over Georges Bank is consistent with the method that is widely used toestimate the turbulent dissipation rate from the � eld measurement data (Osborn, 1980). Inthat method, the dissipation rate is proportional to the variance of vertical shear of velocity.
Simpson et al. (1996) examined the vertical structure of turbulent dissipation at mixed
1196 Journal of Marine Research [56, 6
and strati� ed sites in the Irish Sea by using the original version of the MY levels 2.0 and 2.2turbulent closure models (Mellor and Yamada, 1974). They found that the dissipation rate,e , exhibited a strong tidal variation with a pronounced phase lag in the vertical. Acomparison of their model results with � eld data suggests that the MY level 2.2 modelprovides a better description of tidal mixing than the MY level 2.0 model. Our modelresults are consistent with their � nding. Although the shear and buoyancy productions are
Figure 19. Distributions of passive tracer P at the initial time and at the end of the 10th computingday on the northern (left) and southern (right) � anks for the cases with pure advection andadvectionplus diffusion.The image of P at the 10th day is averaged over a tidal cycle.
1998] 1197Chen & Beardsley: Tidal mixing over Georges Bank
mainly balanced by dissipation in the MY 2.5 model, the vertical diffusion, as a � rst orderapproximation, may play a role in the transfer of turbulent kinetic energy upward from thebottom into the interior.
Our hydrostatic model with a high vertical resolution shows the formation of a hydraulicjump on the northern � ank similar to that found by Lamb (1994) using an inviscidnonhydrostatic model. In his experiments, the initial depression evolves into large-amplitude solitary-like internal waves. This behavior is not seen in our experiments, dueboth to the hydrostatic vertical momentum balance and the inclusion of turbulent mixing.
7. Summary
High resolution numerical experiments over a 2-D asymmetric bank provide a detailedpicture of tidal mixing, internal wave generation, and cross-bank particle exchanges. Themodel bathymetry represents a southeast-northwest slice across Georges Bank, with abroad southern � ank, shallow crest, and steep northern � ank. The model results show thattidal mixing varies in time and space over the bank. On the southern � ank, the strongesttidal mixing occurs within the bottom boundary layer around the maximum on-bank tidal� ow. This is caused by a gravitational instability near the bottom when denser water wasadvected upslope over lighter water. On the northern � ank, the temporal variation of tidalmixing near the bottom is similar, except that strong turbulent mixing occurs throughoutthe upper 50 m of the water column associated with a deep thermal depression that formsafter maximum off-bank tidal � ow.
The model turbulent dissipation rate, e , exhibits a strong tidal variation with a phase lagin the vertical. During a tidal cycle, e is generally largest around the maximum on- andoff-bank tidal � ow. In the vertical, e is generally larger near the bottom and decreasesupward, with maximum e occurring � rst near the bottom. At site A in the strati� ed regionon the southern � ank, the maximum e is about 0.5 3 10 2 5 W/kg near the bottom anddecays to about 102 7 W/kg at the top of the bottom mixed layer. The phase lag of themaximum e between the bottom and top of the bottom layer ( , 40 m) is about one hour. Atsite B in the mixed region on the crest of the bank, e varies from a near-bottom maximumof about 8 3 102 5 W/kg to about 102 6 W/kg at the height of 35 m above the bottom, with avertical phase lag of less than 0.5 hour. At site C on the northern � ank, the temporal andvertical variations of e are much more complex. Within 10 m of the bottom, e is stillcharacterized by two maximum cores over one tidal cycle, with a maximum value of about102 5 W/kg. Large dissipation is found throughout the water column after maximumoff-bank � ow, associated with the large thermal depression which forms during off-bank� ow. The model-predicted dissipation pro� les agree well with microstructure measure-ments made recently on the southern � ank of Georges Bank during the US GLOBEC/Georges Bank program.
During strati� ed tidal recti� cation, � uid particles are advected up-slope near the bottomin the upper slope region (depth , 150 m) on both northern and southern � anks of the bank.Particles also can move across the TMFs near the bottom. The Lagrangian trajectories of
1198 Journal of Marine Research [56, 6
particles differ signi� cantly from those predicted by the residual Eulerian current � eld. Onthe northern � ank, the near-bottom residual Lagrangian current is opposite in direction tothe residual Eulerian current over the upper slope, suggesting that the Stokes velocity iscomparable or larger than the residual Eulerian velocity due to the highly nonlinear natureof the � ow there. The model up-slope mean advection of � uid particles is consistent withan alternative study of passive tracer evolution. With no diffusion, the tracer is carriedup-slope near the bottom toward the TMF on both � anks of the bank. This up-slope tracer� ux is increased when diffusion is added. Taken together, the model particle tracking andpassive tracer results suggest that strong tidal forcing of a strati� ed � uid over the bankprovides one physical mechanism responsible for high concentrations of nutrients andhence phytoplanktonat the TMFs on Georges Bank.
This model study focuses on physical processes driven by strong tidal forcing of astrati� ed � uid over a � nite-amplitude asymmetric bank in a highly idealized setting, withone objective being to develop better intuition about those processes which may dominate� ow and strati� cation on Georges Bank. Additional model studies are now underway toexamine the in� uences of surface forcing (both wind stress and heat � ux) and morerealistic 3-D topography and initial strati� cation on the tidally-forced � ow over GeorgesBank. Preliminary results suggest that the basic patterns of near-bottom tidal mixing,dissipation, and particle motion are similar to those described here. We hope to present theresults of these new numerical experiments shortly in this sequence of idealized modelstudies.
Acknowledgments. This research was supported by the NSF/NOAA US GLOBEC Georges BankProgram under grants NA56RG0487 to Changsheng Chen and under NSF grant OCE93-13671 andOCE96-32357 to Robert Beardsley. The turbulent dissipation data used in this paper were providedby Dave Hebert (URI), Neil Oakey (BIO), and Russ Burgett (URI) under NSF grants OCE93-13671and OCE96-31175. We want to express our thanks for their efforts in the analysis and interpretationof the data. The direct comparison between model-predictedand observed turbulent dissipation rateswould be impossible without their kind and generous support. We also want to thank Glenn Flierl atMIT, Glen Gawarkiewicz, Karl Helfrich and Steve Lentz at WHOI for their valuable comments andsuggestions.Two anonymous reviewers provided many critical comments and constructive sugges-tions which really helped to improve the model-data comparisons and clarify the � nal manuscript.This paper is U.S. GLOBEC contributionno. 107.
REFERENCESBaines, P. G. 1982. On internal tide generation models. Deep-Sea Res., 29, 307–338.Blumberg, A. F. and G. L. Mellor. 1987. A description of a three-dimensional coastal ocean
circulation model. Three-DimensionalCoastal Models.Amer. Geophys. Union, 1–16.Brown, W. S. 1984. A comparison of Georges Bank, Gulf of Maine, and New England shelf tidal
dynamics. J. Phys. Oceanogr., 14, 145–167.Burgett, R. 1997. The structure of tidal mixing on the southern � ank of Georges Bank. M.S. thesis,
University of Rhode Island, 142 pp.Burgett, R., D. Hebert and N. Oakey. 1996. U.S. GLOBEC Georges Bank microstructure data. GSO
Technical Report No. 96-6, 414 pp.
1998] 1199Chen & Beardsley: Tidal mixing over Georges Bank
Chapman, D. C. 1985. Numerical treatment of cross-shelf open boundaries in a barotropic coastalmodel. J. Phys. Oceanogr., 15, 1060–1075.
Chen, C. and R. C. Beardsley. 1995. A numerical study of strati� ed tidal recti� cation over� nite-amplitudebanks. Part I: Symmetric banks. J. Phys. Oceanogr., 25, 2090–2110.
Chen, C., R. C. Beardsley and R. Limeburner. 1995.A numerical study of strati� ed tidal recti� cationover � nite-amplitudebanks. Part II: Georges Bank. J. Phys. Oceanogr., 25, 2111–2128.
Chen, C., H. Tian, R. C. Beardsley and P. J. S. Franks. 1998. In� uences of diurnal heat � ux oncirculation and strati� cation over Georges Bank and adjacent coastal regions: a 3-D prognosticmodeling study. J. Geophys. Res., (submitted).
Farmer, D. M. and J. D. Smith. 1980. Tidal interaction of strati� ed � uid with a sill in Knight Inlet.Deep-Sea Res., 27A, 239–254.
Flagg, C. N. 1987. Hydrographic structure and variability, in Georges Bank, R. H. Backus, ed., MITPress, 108–124.
Galperin, B., L. H. Kantha, S. Hassid and A. Rosati. 1988. A quasi-equilibrium turbulent energymodel for geophysical � ows. J. Atmos. Sci., 45, 55–62.
Garrett, C. J. R. and J. W. Loder. 1981. Dynamical aspects of shallow sea fronts. Phil. Trans. Roy.Soc. Lond., A302, 563–581.
Hopkins, T. S. and N. Gar� eld III. 1979. Gulf of Marine Intermediate Water. J. Mar. Res., 37,103–139.
Horne, E. P. W., J. W. Loder, C. E. Naimie and N. S. Oakey. 1996. Turbulence dissipation rates andnitrate supply in the upper water column on Georges Bank. Deep-Sea Res., 43, 1683–1712.
Lamb, K. G. 1994. Numerical experiments of internal wave generation by strong tidal � ow across a� nite-amplitudebank edge. J. Geophys. Res., 99, 843–864.
Lentz, S. J. and J. H. Trowbridge. 1991. The bottom boundary layer over the northern Californiashelf. J. Phys. Oceanogr., 21, 1186–1201.
Loder, J. W. 1980. Topographic recti� cation of tidal currents on the sides of Georges Bank. J. Phys.Oceanogr., 10, 1399–1416.
Loder, J. W., D. Brickman and E. P. W. Horne. 1992. Detailed structure of currents and hydrographyon the northern side of Georges Bank. J. Geophys. Res., 97, 14331–14351.
Loder, J. W. and E. P. W. Horne. 1991. Skew eddy � uxes as signatures of nonlinear tidal currentinteractions,with application to Georges Bank. Atmos.-Oceans., 29, 517–546.
Loder, J. W., Y. Shen and H. Ridderinkhof. 1997. Characterizationof three-dimensionalLagrangiancirculation associated with tidal recti� cation over a submarine bank. J. Phys. Oceanogr., 27,1729–1742.
Loder, J. W. and D. G. Wright. 1985. Tidal recti� cation and front circulation on the sides of GeorgesBank. J. Mar. Res., 43, 581–604.
Longuet-Higgins, M. S. 1969. On the transport of mass by time-varying ocean currents. Deep-SeaRes., 16, 431–447.
Magnell, B. A., J. J. Cura, C. N. Flagg and D. E. Frye. 1981. Interpretation of the physicaloceanography of Georges Bank. Preliminary results. U.S. Department of the Interior, Bureau ofLand Management, by EG&G EnvironmentalConsultants,ContractAA 851-CTI-39, 186 pp.
Marsden, R. F. 1986. The internal tide on Georges Bank. J. Mar. Res., 44, 35–50.Matsuno, T., S. Kanari, C. Kobayashi and T. Hibiya. 1994. Vertical mixing in the bottom mixed layer
near the continental shelf break in the East China Sea. J. Oceanogr., 50, 437–448.Maxworthy, T. 1979. A note on the internal solitary waves produced by tidal � ow over a
three-dimensionalridge. J. Geophys. Res., 33, 338–346.Mellor, G. L. and T. Yamada. 1974.A hierarchy of turbulenceclosure models for planetary boundary
layers. J. Atmos. Sci., 33, 1791–1896.
1200 Journal of Marine Research [56, 6

—— 1982. Development of a turbulence closure model for geophysical � uid problem. Rev.Geophys. Space Phys., 20, 851–875.
Moody, J. A., B. Butman, R. C. Beardsley, W. S. Brown, P. Daifuku, J. D. Irish, D. A. Mayer, H. O.Mofjelf, B. Petrie, S. Ramp, P. Smith and W. R. Wright. 1984. Atlas of tidal elevation and currentobservationson the northeastAmerican continental shelf and slope. U.S. Geological Survey Bull.,1611, 122 pp.
Naimie, C. E. 1996. Georges Bank residual circulation during weak and strong strati� cation periods:prognosticnumerical model results. J. Geophys. Res. 101(C3), 6469–6486.
Naimie, C. E., J. W. Loder and D. R. Lynch. 1994. Seasonal variation of the three-dimensionalresidual circulation on Georges Bank. J. Geophys. Res., 99, 15,967–15,989.
Osborn,T. R. 1980. Estimates of the local rate of vertical diffusion from dissipationmeasurements. J.Phys. Oceanogr., 10, 83–89.
Pastuszak, M., W. R. Wright and D. Patanjo. 1982. One year of nutrient distribution in the GeorgesBank region in relation to hydrography,1975–1976. J. Mar. Res., 40, (Suppl.), 525–542.
Pratt, L. J. 1991. Hydraulics of rotating strati� ed and sill � ow. Ann. Rev. Fluid Mech., 23, 81–106.Simpson, J. H., W. R. Crawford, T. P. Rippeth,A. R. Campbell and J. V. S. Cheok. 1996. The vertical
structure of turbulent dissipation in shelf seas. J. Phys. Oceanogr., 26, 1579–1590.Smolarkiewicz, P. K. 1984. A fully multidimensional positive de� nite advection transport algorithm
with small implicit diffusion. J. ComputationalPhys., 54, 325–362.Smolarkiewicz, P. K. and T. L. Clark. 1986. The multidimensional positive de� nite advection
transport algorithm: further development and applications.J. ComputationalPhys., 67, 396–438.Smolarkiewicz, P. K. and W. W. Grabowski. 1990. The multidimensionalpositive de� nite advection
transport algorithm: nonoscillatoryopinion. J. ComputationalPhys., 86, 355–375.Trowbridge, J. H. and S. J. Lentz. 1991.Asymmetric behavior of an oceanic boundary layer above a
sloping bottom. J. Phys. Oceanogr., 21, 1171–1185.Werner, S. 1996.The vertical structure of the bottom boundary layer on the southern � ank of Georges
Bank during later winter. M.S. thesis, MIT/WHOI Joint Program, 135 pp.Wunsch, C. 1969. Progressive internal waves on slopes. J. Fluid Mech., 35, 131–144.Yoshida, J. and N. S. Oakey. 1996. Characterization of vertical mixing at a tidal-front on Georges
Bank. Deep-Sea Res., 43, 1713–1744.Zimmerman, J. T. F. 1978. Topographic generation of residual circulation by oscillatory tidal
currents. Geophys.Astrophys. Fluid Dyn., 11, 35–47.—— 1979. On the Euler-Lagrange transformationand the Stokes’ drift in the presence of oscillatory
and residual currents. Deep-Sea Res., 26A, 505–520.
Received: 17 June, 1997; revised: 28 July, 1998.
1998] 1201Chen & Beardsley: Tidal mixing over Georges Bank