tick size wars, high frequency trading, and market quality · tick size wars, high frequency...
TRANSCRIPT

Tick Size Wars, High Frequency Trading, and Market Quality
Tom Grimstvedt Meling and Bernt Arne Ødegaard*
June 2017
Abstract
We show that competitive stock exchanges undercut other exchanges’ tick sizes to gain marketshare, and that this tick size competition increases investors’ trading costs. Our empirical analysisis focused on an event in 2009 where three stock exchanges, Chi-X, Turquoise, BATS Europe,reduced their tick sizes for stocks with an Oslo Stock Exchange (OSE) primary listing. We findthat the tick size-reducing exchanges captured market shares from the large-tick OSE. Tradingcosts at the OSE increased while trading costs in the competing exchanges remained unchanged.High frequency trading appears to be the main driver behind the market share and trading costresults. Our findings suggest that unregulated stock markets can produce tick sizes that areexcessively small.
Keywords: Equity Trading; Limit Order Markets; Tick Sizes; High Frequency TradingJEL Codes: G10; G20
*Meling is at the University of Bergen. [email protected]. Ødegaard is at the University of [email protected]. This paper has benefited from discussions with Tamás László Bátyi, Terrence Hendershott,Hans K. Hvide, Teis Lunde Lømo, Christine Parlour, Bjørn Sandvik, Eirik A. Strømland, and Jonas Tungodden. We aregrateful for comments from seminar participants at the “Conference on the Econometrics of Financial Markets” at theStockholm Business School and the “2nd Paris-Dauphine Workshop on Microstructure.” We are particularly grateful forcomments from our discussants Gernot Doppelhofer, Carole Gresse, and Stig Lundeby.
1

Introduction
Over the past two decades, regulatory reforms in the United States and Europe have facilitated
increased competition between stock exchanges.1 Competition between stock exchanges can benefit
market participants by promoting more efficient trading services. However, competition can also
harm market participants if there are negative externalities. This paper studies a situation where
competition induces exchanges to implement market design changes that worsen trading conditions
for market participants. Our empirical setting involves European stock exchanges and their choice of
tick size — the smallest price increment on the exchange. We show that competitive stock exchanges
undercut each other’s tick sizes to gain market share, and that market participants’ trading costs
increase as a consequence.
How large should tick sizes be? The early theoretical literature concluded that the optimal tick
size is small but not zero (e.g., Cordella and Foucault 1999; Foucault, Kadan, and Kandel 2005). A
larger tick size increases the cost of undercutting the limit orders of other investors, which can give
incentives for investors to provide liquidity with limit orders. Moreover, a larger tick size can force
the quoted bid-ask spread to be artificially wide, providing incentives for traders to make markets
and thus increase liquidity. Meanwhile, this increase in the minimum bid-ask spread also increases
investors’ trading costs, partly offsetting the liquidity gains from incentivizing market making. Hence,
the optimal tick size involves a trade-off between increasing investors’ trading costs and providing
incentives for liquidity provision.2
Opening for competition between stock exchanges can put downward pressure on tick sizes. Buti,
Consonni, Rindi, Wen, and Werner (2015) show theoretically that exchanges with small tick sizes can
capture market shares from large-tick exchanges — potentially giving an incentive for competitive
exchanges to undercut the tick sizes of other exchanges to gain market share. However, the exchanges
in the Buti et al. (2015) model are restricted from strategically adjusting their tick sizes. For this
reason, the model does not provide clear predictions about what tick size would arise endogenously
through competition between stock exchanges, and whether the competitive tick size would increase
or decrease market quality compared to the tick size in a non-competitive stock market. Absent
theoretical predictions, empirical work may provide guidance about the mechanisms through which
competition can affect exchanges’ tick size choice and market quality.3
1In the United States, the Regulation National Market System (Reg NMS) was introduced in 2005, while the Markets inFinancial Instruments Directive (MiFID) was implemented in Europe in late 2007. Both Reg NMS and MiFID introducednew rules that intensified competition between trading platforms. For example, MiFID opened for competition betweenEuropean stock exchanges by abolishing the so-called ‘concentration rule’, which previously forced all regulated trades tobe executed in specific domestic marketplaces.
2The tick size is currently among the most controversial market design features in the current equity market policydebate, as market regulators in the United States and Europe are considering comprehensive market design reforms insearch of a suitable tick size. For example, market regulators in the U.S. have recently implemented a large-scale pilotprogram that will increase the tick size for 1200 randomly chosen securities. The current proposal by European regulatorsis that tick sizes should be stock-specific, and be determined as a function of both the stock price and the stock liquidity.
3Tick sizes are heavily regulated in many of the world’s most important stock markets, which may partly explain whythe existing theoretical literature has yet to explore the consequences of having market forces determining the tick size. Forexample, the U.S. market regulator mandates a fixed tick size at $0.01 for most securities and stock exchanges. In Europe,the proposed MiFID II legislation will enforce a common tick size regime across exchanges that compete for the sameorder flow. The pervasiveness of tick size regulations in stock markets around the world also means there are few empiricalsettings that researchers can analyze to understand the strategic tick size choices of competitive stock exchanges.
2

The purpose of this paper is to empirically assess the impact of opening for competition on
exchanges’ choice of tick size, and the consequence of competitive tick size choices for market quality.
To this end, we study exchanges’ strategic tick size decisions for Oslo Stock Exchange (OSE) listings
in the aftermath of the MiFID reform, which in November 2007 opened for competition between
European stock exchanges.4 We focus on an event where three entrant exchanges, Chi-X, Turquoise,
and BATS Europe reduced the tick size for their selections of OSE listed stocks. Chi-X moved first,
and reduced the tick size on June 1, 2009. Turquoise and BATS quickly followed and reduced their
tick sizes on June 8 and June 15, respectively. The OSE responded within a month by reducing its
own tick size. This race to the bottom ended when the Federation of European Securities Exchanges
(FESE) brokered a common tick size across all the exchanges, mandating much smaller tick sizes than
before the ‘tick size war.’
We leverage extremely rich data on the trading of OSE listed stocks across all European trading
platforms to explore why opening for competition between exchanges seems to drive tick sizes down.
Our findings suggest that reducing the tick size can be an effective strategy for entrant exchanges
to increase their market share. In particular, we find that Chi-X nearly doubled its market share of
overall trading from the first day with reduced tick sizes. In contrast, the late-movers Turquoise and
BATS Europe were unable to capture market shares from the OSE with similar tick size reductions.
Likewise, when the OSE retaliated and reduced its own tick sizes, it was unable to reclaim the lost
market share. Thus, our findings suggest that competitive stock exchanges have a strong incentive
to undercut other exchanges’ tick sizes, as such tick size competition can permanently increase their
market share.
Our data also allow us to estimate the impact of tick size competition on measures of market
quality at individual trading platforms. Using a difference-in-differences approach, we find that tick
size competition negatively affected stock liquidity at the OSE and Chi-X — the two exchanges with
market share gains or losses during the tick size war in June 2009. Our empirical strategy is to
compare changes in stock liquidity for stocks that were directly affected by the tick size war (stocks
listed at both the OSE and Chi-X) to changes in stock liquidity for stocks unaffected by the tick size
war (stocks listed only at the OSE). We find that trading costs at the OSE increased after the Chi-X
tick size reduction, while trading costs at Chi-X remained unchanged, suggesting an overall increase
in trading costs. We also find that order book depth at both Chi-X and the OSE suffered greatly from
the OSE retaliatory tick size reduction. Our results persist after controlling for stock-level changes in
trading volume, suggesting that the observed changes to stock liquidity cannot fully be explained by
a redistribution of trading volume between exchanges.
To explore the mechanisms through which small-tick exchanges capture market share, and to
assess why tick size competition seems to decrease market quality, we leverage very detailed order
book data from the OSE. A key theoretical result in the Buti et al. (2015) model is that traders
migrate to small-tick markets because the bid-ask spread is constrained by the tick size in the large-
4Before the implementation of MiFID in 2007, the OSE was the monopolist marketplace for the trading in stocks withan OSE primary listing. After the MiFID reform, new exchanges quickly entered to offer trading in OSE stocks. Theseentrant exchanges long struggled to get a toe-hold in the market, but competition had slowly taken hold by early 2009.Section 1 provides further details on the MiFID reform, the ensuing increase in competition for OSE listed stocks, and ticksize regulations in Europe.
3

tick market. The mechanism behind this result is that a constrained bid-ask spread makes it harder
for traders to undercut limit orders to gain execution priority, which induces impatient traders to send
their orders to an exchange where the tick size is smaller and undercutting is easier. Inconsistent
with this theoretical prediction, we find that the extent of OSE market share loss during the tick size
war is unrelated to the severity of bid-ask spread constraints at the OSE. In fact, few stocks in our
sample trade with bid-ask spreads that are close to being constrained by the tick size.
Rather than constraints to bid-ask spreads, preliminary results suggest that high-frequency traders
(HFTs) appear to be responsible for the observed redistribution of market share from large-tick to
small-tick exchanges. We generate a stock-level proxy for HFT activity (the ‘order to trade ratio’), and
find that OSE stocks with more HFT activity experienced a greater loss in market share following
the Chi-X tick size reduction. To further investigate this mechanism, we show that certain traders,
who we conjecture are HFTs, migrated the OSE in favor of Chi-X to execute at prices that were
unattainable with the coarse price grid at the OSE. Finally, we find that HFTs became much more
active at the OSE after the OSE tick size reduction, illustrating that HFTs prefer to trade when tick
sizes are small.
We offer a tentative mechanism through which HFT order flows can account for the observed
changes to stock liquidity. Since stock liquidity at Chi-X seemingly did not improve from an inflow
of HFT volume, we conclude that the HFTs that migrated to Chi-X traded as liquidity-demanders
or alternatively that these HFTs were informed investors whose trading imposed an adverse selection
cost on limit order traders at Chi-X. However, given the observed increase in trading costs at the
OSE in the same period, the same HFTs appear to improve liquidity when they trade at the OSE.
We interpret this finding as consistent with HFTs switching from trading as liquidity-providers in the
large-tick OSE market to trading as liquidity-demanders in the small tick Chi-X market.
Our paper contributes to several threads in the current academic debate over optimal tick sizes
in equity markets.5 First, a recent empirical literature studies how a regulatory-mandated tick size
difference between over-the-counter markets (‘dark pools’) and regular exchanges in the United States
affects the order-routing decisions of investors (e.g. Bartlett and McCrary 2015, Kwan, Masulis, and
McInish 2015, Buti et al. 2015). Consistent with this literature, we find that investors send their orders
to trading platforms that allow for trading at smaller tick sizes. However, we add to this literature
by exploring the tick size that arises endogenously through competition between exchanges that can
strategically adjust their tick size, and estimate the effects of this competitive tick size on market
quality.
Second, our findings seem to contradict the empirical literature which shows that HFTs trade
more actively when tick sizes are large. For example, O’Hara, Saar, and Zho (2015) and Yao and Ye
(2015) provide empirical evidence that HFTs are more active in liquidity provision and have larger
profit margins when tick sizes are large. The mechanism that the authors propose is that the HFT
speed advantage becomes more valuable when price competition is constrained by the tick size.
Our results, in contrast, suggest that HFT seem to migrate the large-tick OSE in favor of small-tick
5For recent surveys of the voluminous empirical and theoretical academic literatures on the role of tick sizes in equitymarkets, see Holden, Jacobsen, and Subrahmanyam (2013), Securities and Exchange Commision (2012) and Verousis,Perotti, and Sermpinis (2017).
4

competing exchanges, indicating an opposite HFT preference over tick sizes. These conflicting results
may suggest that certain types of HFT strategies may require a small tick size whereas other HFT
strategies, such as liquidity-provision, may require a larger tick size.
Finally, our results provide empirical support for the current market regulations in the United
States that enforce a common tick size across competing exchanges, and for the proposed regulations
in Europe that aim to accomplish the same (see footnote 3). Specifically, our results show that
individual stock exchanges have an incentive to reduce their tick sizes to capture market shares and,
at the same time, that such tick size reductions can have negative effects on the stock liquidity in
competing marketplaces. Thus, a conceivable consequence of tick size competition is that combined
market liquidity (across all trading venues) declines. Market regulators can restrict stock exchanges’
ability to engage in destructive tick size competition by enforcing a common tick size regime across
all exchanges competing for the same order flow.
The paper proceeds as follows. Section 1 provides institutional background on equity trading at
the Oslo Stock Exchange and describes the tick size war for OSE listed stocks; Section 2 develops
testable theoretical hypotheses; Section 3 describes our data; Section 4 studies the impact of tick size
competition on the distribution of market shares across exchanges; Section 5 estimates the impact
of tick size competition on market quality; Section 6 explores the mechanisms that link tick size
competition to market fragmentation and market quality; and Section 7 concludes.
1 Institutional Background
This paper explores exchanges’ strategic tick size decisions for Oslo Stock Exchange listings in the
aftermath of the MiFID reform, which in November 2007 opened for competition between European
exchanges. We focus on a series of tick size reductions for OSE listed stocks during the Summer of
2009, which we collectively refer to as the ‘tick size war.’ In this section, we first provide institutional
details concerning the trading in Norwegian equities — both at the Oslo Stock Exchange and at
competing trading platforms — before we summarize the events of the ‘tick size war’ in 2009.
1.1 The Oslo Stock Exchange
The Oslo Stock Exchange is a medium-sized stock exchange by European standards, currently rank-
ing among the 30 largest (by market capitalization) equity markets in the world. At the end of 2010,
the combined market capitalization of the OSE was about 1.8 trillion NOK, distributed across 239
companies. Over the last decade, the OSE has collaborated and shared trading technology with other
European stock exchanges.6 The collaboration with other exchanges has implied the use of common
technology and, to some extent, common market models. Nevertheless, the OSE has remained rela-
tively free to implement individual trading rules and compose an individual market model.
6In 2002, the OSE introduced the SAXESS trading platform in cooperation with NASDAQ OMX. In 2009, the OSEpartnered with the London Stock Exchange Group (LSEG) and implemented their TradElect trading platform in April 2010.The OSE now employs the Millennium trading system — the same trading system used by, for example, the London StockExchange and Borsa Italiana.
5

The OSE operates a fully computerized limit order book, and has done so since January 1999.
The order book allows for conventional limit orders, market orders, iceberg orders and various other
common order types. As is normal in electronic order-driven markets, order placements follow price-
time priority — incoming orders are first sorted by their price and then, in case of equality, by the
time of their arrival. The trading day at the OSE consists of three sessions: an opening call period,
a continuous trading period, and a closing call period. Call auctions may also be initiated during
continuous trading if triggered by price monitoring or to restart trading after a trading halt.7
The distributions of firm size and trading volume at the OSE are both heavily skewed. The OSE
is dominated by a few very large companies. For example, the most valuable listed company, Statoil
(an oil company), accounted in 2009 for about 25% of the OSE market capitalization. Two other
companies, Telenor (telecommunications) and Den Norske Bank (integrated financial) each accounted
for about 10% of the total market capitalization of the OSE. The large companies at the OSE also
dominate in terms of trading activity. A considerable portion of overall trading volume takes place in
the largest stocks at the OSE, and in particular in the constituent stocks of the large-cap OBX index.
The OBX index comprises at any point of time the 25 most-traded (and typically the most valuable)
stocks at the OSE.8
1.2 Competition for European order flow (MiFID)
Competition for European order flow is a fairly recent phenomenon. National stock exchanges,
such as the Oslo Stock Exchange, long operated as monopolist marketplaces for trading in domestic
shares. However, the introduction in 2007 November of the Markets in Financial Instruments Direc-
tive (MiFID) legislation unleashed competition for European order flow by abolishing the so-called
‘concentration rule’, which forced any regulated trade to be executed in the primary market. Today,
European equity trading is scattered across a large number of trading venues that compete vigorously
to attract order flow.
Three types of trading venues have emerged to compete for European order flow — Regulated
Markets (RMs), Multilateral Trading Facilities (MTFs), and Systematic Internalisers (SIs). The RMs
(such as the OSE) and the MTFs share similar features. For example, both RMs and MTFs can
decide on the type of orders allowed on their order books, the structure of member fees (e.g. fixed,
variable, maker-taker), and to some extent the transparency of the trading process. Moreover, both
RMs and MTFs are allowed to organize primary listings. In practice, however, MTFs do not offer
primary listing services, and can be viewed as the European equivalent of ECNs in the United States.
Distinct from both RMs and MTFs, the SIs are investment firms that systematically match client
orders internally or against their own accounts.
Some stylized facts based on publicly available data from Fidessa, a data vendor, may help
understand MiFID’s impact on the trading of OSE listed stocks. At the time of writing, in 2016, more
than twenty regulated markets, multi-lateral trading facilities, systematic internalisers, or unregulated
7For details on the trading fees and market transparency at the OSE, see for example Jørgensen, Skjeltorp, and Ødegaard(2017) or Meling (2016).
8The composition of the OBX index is revised twice a year, in June and December, primarily based on total stocktrading volume at the OSE over the previous six months. Meling (2016) provides more details on the OBX index.
6

over-the-counter trading venues offer trading in the most liquid stocks at the Oslo Stock Exchange.
The OSE retains the largest market share, followed by BATS over-the-counter (OTC), BATS CXE
(formerly known as Chi-X), Turquoise, and BATS BXE (formerly known as BATS Europe). The OSE
market share of overall trading (including over-the-counter trading) in its most liquid stocks has
declined from 100% in 2007 to close to 40% in 2016.
1.3 OSE competitors: Chi-X, Turquoise and BATS
Three MTFs — Chi-X, Turquoise and BATS Europe — feature prominently in our study due to
their proclivity to adapt their market designs to capture market shares. Established in 2007 by
a consortium of investment banks, Chi-X was the first MTF in Europe. Both BATS Europe and
Turquoise were established in 2008 — BATS by BATS Global Markets, a U.S. exchange operator, and
Turquoise by a consortium of investment banks. In December, 2009, the London Stock Exchange
Group acquired a 60% stake in the Turquoise platform. After our sample period, in 2011, BATS
Europe has acquired Chi-X.
Similar to the OSE, Chi-X, Turquoise and BATS operate fully electronic matching engines where
anonymous orders are matched continuously, according to price-time priority. Unlike the OSE, the
MTFs aggressively employ maker-taker fees to incentivize liquidity supply. For example, at Chi-X,
liquidity demander (takers) pay a transaction fee of 0.3 basis points while liquidity suppliers (makers)
earn a rebate of 0.2 basis points.
Chi-X, Turquoise and BATS Europe offer trading in some, but not all, of the 200–300 stocks listed
at the OSE. The three MTFs initially opened trading in only the largest and most liquid stocks at
the OSE, before gradually expanding their selection. For example, Chi-X initially offered trading in
only the five largest stocks at the OSE. By 2015, Chi-X offers trading in more than 50 OSE products.
Similarly, Turquoise initially opened trading in 28 OSE stocks but has since greatly expanded its
selection to by 2015 include more than 150 OSE products.
1.4 ‘Tick size war’ for OSE listed stocks
The introduction of MiFID in November 2007 opened for competition between European trading
platforms. However, the MiFID reform did not specify regulations concerning exchanges’ choice of
tick size — the smallest price increment on a stock exchange. This allowed competitive European
exchange operators to strategically adjust their own tick sizes.9 The purpose of our paper is to analyze
an event where three entrant trading platforms, Chi-X, Turquoise, and BATS Europe unexpectedly in
June 2009 decided to reduce the tick size for several of their stock listings.10 The entrants’ unexpected
9That European trading venues can determine their own tick sizes contrast with the regulatory setting in the UnitedStates. The U.S. market regulator (the Securities and Exchange Commission) mandates a fixed tick size for all stocks pricedabove $1 of $0:01.
10In the absence of formal tick size regulations after the MiFID reform, the Federation of European Securities Exchanges(FESE) brokered in March 2009 a ‘gentlemen’s agreement’ between several European stock exchanges and MTFs to im-plement a common tick size regime. The motivation behind the tick size agreement was that individual trading venuescan capture market shares by reducing their tick sizes but that such tick size competition can have a detrimental effect onstock liquidity (FESE 2009). The March 2009 tick size agreement involved four alternative tick size schedules that shoulddetermine a stock’s tick size as functions of the stock price. However, the agreement did not clarify which of the four ticksize schedules should be used, when the tick size schedules should be implemented, or who should make these decisions.
7

tick size reductions sparked a frenzy of tick size reductions which commentators at the time called a
‘tick size war.’
The tick size war during the Summer of 2009 can conveniently be divided into three phases. In
the first phase, which we call the break-out phase, Chi-X, Turquoise and BATS challenged the market
positions of the Scandinavian primary markets (Oslo, Stockholm, and Copenhagen) by successively
reducing the tick size for their selection of Danish, Norwegian, and Swedish stocks. The tick size
war began on June 1, 2009, when Chi-X reduced its tick size. Turquoise followed on June 8, reducing
the tick size for Scandinavian stocks as well as for five London listed stocks. Finally, BATS Europe
reduced the tick sizes for Scandinavian stocks, ten London stocks, and five Milan stocks on June 15
(BATS, 2009).
The tick size reductions by Chi-X, Turquoise, and BATS during the break-out phase were substan-
tial. In Table 1, we summarize the tick size schedules used by all four stock exchanges throughout
the calendar year 2009. At the time of the Chi-X tick size reduction, on June 1, 2009, the OSE
operated with three tick size schedules: a flat tick size of NOK 0.01 for Statoil (the most liquid stock
at the OSE); a general tick size schedule for all OBX shares, with tick sizes varying between 0.01 and
0.25; and a separate tick size schedule for all illiquid (non-OBX) shares. The new Chi-X tick size
schedule, in contrast, introduced a NOK 0.001 tick size for all OSE stocks traded at Chi-X with prices
below NOK 10 and a NOK 0.005 tick size for stocks priced above NOK 10. The tick size schedules
introduced by Turquoise and BATS were less aggressive, but they still offered substantially smaller
tick sizes than the OSE.11
In the second phase of the tick size war — the retaliation phase — the OSE responded in kind
to its tick size reducing competitors. On July 6, 2009, the OSE reduced its tick size uniformly to
NOK 0.01 for the 25 stocks in the OBX index. In a press release, the OSE declared that other trading
venues “offer trading with tick sizes that are significantly lower than Oslo Børs offers. Oslo Børs has
therefore found it necessary to respond to these changes.” Doing so, the OSE largely mitigated the
between-exchange tick size differences that arose during the break-out phase.
What can explain the exchanges’ decisions to reduce their tick sizes during the Summer of
2009? First, to understand the strategic decision the OSE faced following its competitors’ tick size
reductions, we give a preview of our results concerning the OSE market share in its own stock listings.
Figure 1 compares the distributions of daily market shares for the OSE and Chi-X before (May 2009)
and after ( June 2009) the Chi-X tick size reduction. The figure illustrates a sizable shift of market
shares from the large-tick OSE market to the small-tick Chi-X market. More precisely, in Section 4.1
we estimate the OSE market share loss after the Chi-X tick size reduction to nearly three percentage
points. Observing this rapid decline in market share, it is straight-forward to understand why the
OSE found it ‘necessary’ to respond to competing exchanges’ tick size reductions. Similarly, entrants
Evidently, this ambiguous ‘gentlemen’s agreement’ was insufficient to prevent Chi-X, Turquoise, and BATS from reducingtheir tick sizes.
11We can point out that prior to the tick size war, tick sizes for stocks listed at the OSE were large compared to thecurrent penny tick size in the United States. For example, converted at the 2009 exchange rate of 6.3 NOK per USD, thepre-tick-size-war tick size of NOK 0.01 for Statoil translates into 0.15 cents. However, the post-war Chi-X tick size of 0.005translates to only 0.08 cents. Thus, the tick size war pushed tick sizes for OSE listed stocks below the current US tick sizeregime.
8

Table 1 Tick size schedules at the OSE, Chi-X, BATS, and TQ.Panel A: The Oslo Stock Exchange
– July 2009Price Tickband Size
Most Liquid – 0.01stocks (Statoil)
Other – 14.99 0.01OBX stocks 15 – 49.95 0.05
50 – 99.90 0.10100 – 249.75 0.25250 – 499.50 0.50500 – 1.00
Non- – 9.99 0.01OBX 10 – 14.95 0.05stocks 15 – 49.90 0.10(illiquid) 50 – 99.75 0.25
100 – 249.50 0.50250 – - 1.00
July 2009Price Tickband Size
All – 0.01OBXStocks
Fall 2009 –Price Tickband Size
All – 0.4999 0.0001OBX 0.5 – 0.9995 0.0005stocks 1 – 4.9990 0.001
5 – 9.995 0.00510 – 49.990 0.0150 – 99.95 0.05100 – 499.90 0.1500 – 999.50 0.5
1,000 – 4,999.00 15,000 – 9,995.00 510,000 – – 10
Panel B: Chi-X and Turquoise/BATS
Chi-X – June 2009Price Tickband Size
OBX 0 – 9.99 0.001Shares 10 – 0.005(selected)
Turqoise/BATS – June 2009Price Tickband Size
OBX – 0.9999 0.0001shares 1 – 4.9995 0.0005(selected) 5 – 9.999 0.001
10 – 49.995 0.00550 – 99.99 0.01100 – 499.95 0.05500 – 999.90 0.1
1,000 – 4,999.50 0.55,000 – 9,999 110,000 – 99,995 5
100,000 - 10
The table presents the tick size schedules used by the Oslo Stock Exchange (OSE), Chi-X, Turquoise, and BATS Europe during the ticksize war of June, 2009. Chi-X implemented its tick size schedule on June 1, 2009, Turquoise on June 8, 2009, and finally BATS Europe onJune 15, 2009. The tick size schedules for BATS Europe and Turquoise have been collected from BATS (2009). The tick size schedule forChi-X has been collected from BATS-Chi-X (2012) (the ‘eurozone’ tick size schedule).
9

may have an incentive to drive tick sizes further down, as this strategy seems to enable them to gain
market share.
Figure 1 Distribution of market shares, May-June 2009
OSE Market Share
May ’09
Market Share
Fre
quency
0.80 0.85 0.90 0.95 1.00
0100
200
300
June ’09
Market Share
Fre
quency
0.80 0.85 0.90 0.95 1.00
050
100
150
200
250
Chi-X Market Share
May ’09
Market Share
Fre
quency
0.00 0.05 0.10 0.15 0.200
50
100
150
June ’09
Market Share
Fre
quency
0.00 0.05 0.10 0.15 0.20
020
40
60
80
The figure presents the distribution of daily market shares at the Oslo Stock Exchange (left) and Chi-X (right). The top panel presents thedistribution of market shares during May, 2009. The bottom panel presents the distribution of market shares during June, 2009.
Second, contemporary observers argued that the exchanges’ decisions to reduce their tick sizes
were rooted in pressure from influential high-frequency trading (HFT) firms who desired smaller tick
sizes (e.g., Financial Times 2009). As a preliminary exploration of this hypothesis, Figure 2 plots the
order-to-trade ratio (OTR) separately for OBX index stocks at the OSE who were exposed to the July
6, 2009 OSE tick size reduction and non-OBX index stocks who were not exposed to the tick size
reduction. The OTR is a commonly used proxy for HFT activity, and we define this proxy in more
detail in Section 3.3. Consistent with HFTs wanting to trade in small-tick markets, Figure 2 shows a
remarkable increase in HFT activity for OSE stocks affected by the July 6, 2009 tick size reduction.12
12It is useful to point out the parallels between our analysis and Menkveld (2013), who explores the entry of a HFTmarket maker in the Dutch stock market in the beginning of 2008. Anecdotal evidence suggests that the market maker
10
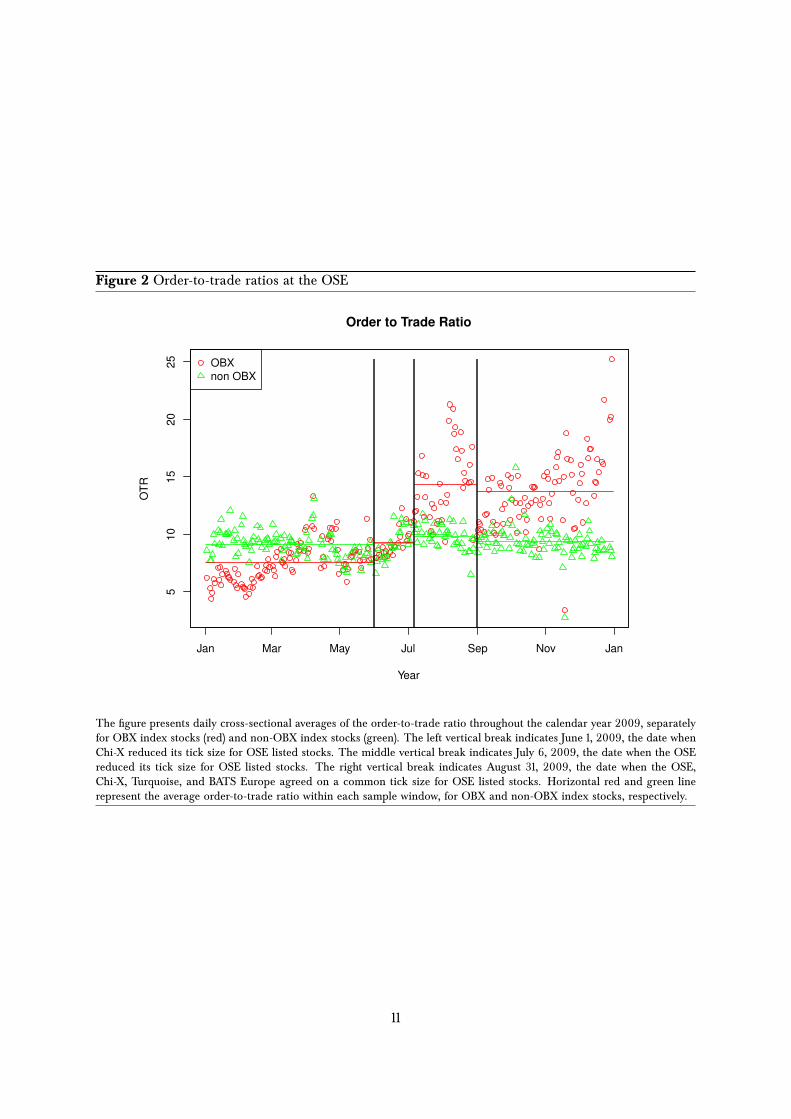
Figure 2 Order-to-trade ratios at the OSE
Jan Mar May Jul Sep Nov Jan
51
01
52
02
5
Year
OT
R
Order to Trade Ratio
OBX
non OBX
The figure presents daily cross-sectional averages of the order-to-trade ratio throughout the calendar year 2009, separatelyfor OBX index stocks (red) and non-OBX index stocks (green). The left vertical break indicates June 1, 2009, the date whenChi-X reduced its tick size for OSE listed stocks. The middle vertical break indicates July 6, 2009, the date when the OSEreduced its tick size for OSE listed stocks. The right vertical break indicates August 31, 2009, the date when the OSE,Chi-X, Turquoise, and BATS Europe agreed on a common tick size for OSE listed stocks. Horizontal red and green linerepresent the average order-to-trade ratio within each sample window, for OBX and non-OBX index stocks, respectively.
11

The final stage of the tick size war is the harmonization phase. On June 30, 2009, the FESE
brokered a harmonization of tick sizes between the stock exchanges and the MTFs. FESE argued
that the recent tick size reductions were not in the interest of end investors and that too granular
prices could have detrimental effects on stock market depth. The FESE agreement facilitated a pan-
European harmonization of tick size schedules for the most actively traded stocks, which significantly
simplified and reduced the number of different tick size schedules used by the exchanges. The far
right panel of Panel A in Table 1 displays the tick size schedule chosen by the OSE. These changes
were to be implemented within two weeks and six months depending on the needs of the exchange.
The Scandinavian markets responded in steps. OSE harmonized tick sizes August 31, 2009. The
other markets followed later, Stockholm on October 26 and Copenhagen on January 4, 2010.13
2 Hypothesis development
Theoretical work in the equity market microstructure literature predicts that between-exchange dif-
ferences tick size differences can influence investors’ order-routing decisions and measures of stock
liquidity. This section discusses the potential mechanisms through which the tick size war for OSE
listed stocks (Section 1.4) can affect these stock market outcomes. To simplify the exposition, we
assume the following sequence of mechanisms: First, there is an exogenous shock to the tick size
at exchange v while the tick sizes at exchanges v� remain unchanged. Second, investors reconsider
whether to route their orders to exchanges v or v�. Third, stock liquidity in each of the exchanges
is affected directly by the choice to reduce the tick size (exchange v) and indirectly by investors’
order-routing decisions (both exchanges v and v�).14
Distribution of trading volume across exchanges: We present two mechanisms through which between-
exchange tick size differences can affect affect investors’ order-routing decisions, and subsequently
alter the distribution of trading volume across stock exchanges. These mechanisms are motivated
by two different strands of academic literature. First, recent theoretical work suggests that between-
market tick size differences can shift trading volume from large-tick markets to small-tick markets. For
example, Buti et al. (2015) predict that when a large-tick market faces competition from a small-tick
market, some traders with access to both markets will route their orders to the small-tick market. The
mechanism which generates their theoretical result is that large tick sizes make it more difficult for
traders to undercut orders in the limit order book to gain execution priority. This induces impatient
traders to route their orders to markets where price competition is less constrained by the tick size
in Menkveld (2013), Getco, and other similar trading firms, gradually expanded their operations into other Europeanmarketplaces. The increase in HFT activity at the OSE in July 2009 can therefore indicate the entry of new HFTs in theNorwegian stock market.
13For a short while, the FESE tick size agreement successfully warded off competitive tick size reductions. However, in2011, Euronext decided to implement a smaller tick size than agreed upon in the FESE agreement for certain liquid stocks,sparking "outrage" among competing trading platforms amid concerns of a new tick size war (e.g. Financial Times 2011).As a response to the seemingly unstable tick size agreements in Europe, the updated MiFID II regulation is expected tomandate a common tick size regime across all European trading platforms.
14We need to assume a sequence of mechanisms because, as econometricians, we only observe the initial shock to ticksizes and the simultaneous outcomes that correspond to step two (order-routing decisions) and step three (stock liquidity).This means that we cannot disentangle empirically whether tick size-induced changes to order-routing decisions causallyaffect stock liquidity, or whether tick size-induced changes to stock liquidity causally affect order-routing decisions.
12

and undercutting is easier. A key prediction in Buti et al. (2015) is therefore that between-exchange
tick size differences are more important for stocks where price competition is constrained by the tick
size than for stocks where price competition is unconstrained.
The second mechanism we consider is that high-frequency traders (HFTs) and non-HFTs may
react differently to changes in the tick size. For example O’Hara et al. (2015) and Yao and Ye (2015)
argue that HFTs are more active in liquidity provision and have larger profit margins in a large-tick
size environment. They argue that the HFT speed advantage becomes more valuable when price
competition is more constrained by the tick size. By this logic, one should expect that HFTs react to
the tick size reductions during the tick size war by routing their orders to large-tick size exchanges
instead of small-tick size exchanges, and thereby influence the distribution of market shares across
exchanges.
However, other HFT strategies than liquidity-provision may become more profitable when tick
sizes are small than when they are large. For example, cross-market arbitraging strategies rely on
small and fleeting price discrepancies for the same security at different exchanges. A reduction in
the tick size in one exchange means the increments by which prices can move will differ between
exchanges, giving HFTs more opportunities to seek out trading opportunities across-exchanges. A
different HFT strategy involves reacting to the arrival of new and valuable information before other
traders have time to modify their previous (now mispriced) offers to buy or sell (Menkveld, 2016). This
strategy may be easier to implement in small-tick markets as a reduction in the tick size lowers the
marginal cost of undercutting existing quotes. In other words, we expect the extent to which HFTs
prefer to route their orders to large-tick or small-tick markets to depend on the trading strategies
that HFTs follow.
Stock liquidity in each of the exchanges: The tick size war for OSE listed stocks can also affect mea-
sures of stock liquidity in each of the involved stock exchanges. We conjecture that the overall impact
of the tick size war on stock liquidity can be separated into three components. The first compo-
nent is the same-market effect from reducing the tick size. Inspired by a voluminous empirical and
theoretical literature on the impact of tick size reductions in monopolist limit order books, our base-
line prediction is that stock exchanges that reduce their tick sizes should experience tighter bid-ask
spreads and shallower order books (e.g., Securities and Exchange Commision 2012).
The second component of the overall effect of the tick size war on stock liquidity comes from
the changing distribution of trading volume across exchanges. Exchanges that reduce their tick sizes
may experience inflows of trading volume from exchanges that keep large tick sizes. Inflows (or
outflows) of trading volume can improve or degrade stock liquidity, depending on the characteristics
and trading strategies of the investors that migrate between exchanges. For example, reducing the
tick size may cause wider (narrower) bid-ask spreads if it leads to an inflow of informed (uninformed)
investors, on account of the greater (smaller) adverse selection costs faced by liquidity providers
(e.g. Glosten and Milgrom 1985 or Kyle 1985). Similarly, if between-exchange tick size differences
affect the order-routing decisions of HFTs, an inflow or outflow of HFT trading volume can improve
or degrade stock liquidity, depending on whether the HFTs engage in market-making activities or
13

conversely demand or degrade liquidity.15
The final theoretical mechanism we consider concerns the potential disruption of network ex-
ternalities in liquidity provision, along the lines of Pagano (1989). Loosely speaking, a consolidated
market that is already liquid can attract even more liquidity because of positive network externalities.
This is because each additional trader in the liquid market reduces the search and trading costs for
other potential traders, which attracts even more traders. Conversely, traders may be discouraged
from entering an illiquid market because of high search and trading costs, which further degrades the
illiquid market’s liquidity (a negative network externality). The presence of such network externalities
implies in our setting that an inflow (outflow) of trading volume at the liquid Oslo Stock Exchange can
be relatively more beneficial (detrimental) to stock liquidity than a corresponding inflow or outflow
of trading volume at the fairly illiquid MTFs.
Summary: This section discusses mechanisms through which the tick size war for OSE listed
stocks can affect stock market outcomes. To summarize, we expect the tick size war to shift trading
volume and market share from the large-tick size OSE exchange to its small-tick size competitors.
This shift in market shares should be motivated by constraints to price competition at the OSE or by
changes in the order-routing decisions of HFTs, or a combination of these two mechanisms. For the
exchanges that reduce their tick size, we expect the direct effect to be narrower bid-ask spreads and
shallower order books. This direct effect will be amplified or weakened by inflows of trading volume,
depending on whether the migrating traders are informed or uninformed, and whether the migrating
traders supply or consume liquidity. For the exchanges that maintain large tick sizes (the OSE), we
expect that stock liquidity is affected through an outflow of trading volume and from the disruption
of liquidity externalities. Sections 4 to 6 test these mechanisms empirically.
3 Data
This section presents the data we use to explore the impact of the tick size war between the Oslo
Stock Exchange, Chi-X, Turquoise, and BATS, on the distribution of market shares across exchanges
and the quality of trading in each of the exchanges. The section also defines our main outcome
variables, and presents descriptive statistics of stock trading at the Oslo Stock Exchange, Chi-X,
Turquoise and BATS.
3.1 Data Sources
We use several datasets in our empirical analysis. First, we use proprietary order-level data obtained
from the ‘market surveillance’ group at the OSE. This dataset contains information on all orders
15Empirical evidence suggests that a majority of HF traders behave as market makers, with a business model of providingliquidity, compensated by the bid-ask spread, which can improve stock liquidity (e.g. Menkveld 2013 and Hagströmer andNordén 2013). However, the empirical evidence also point to the presence of other forms of HFTs, who for example, usetheir speed advantage to “snipe” stale quotes before other traders can modify them. Another hypothesized HF strategyinvolves predicting future order flow, trying to determine the presence of large trades being worked over time, and tradingin front of these. Some HFT strategies even resemble illegal price manipulation: for example the “spoofing” strategyinvolves filling the order book with orders away from the best bid and/or ask in order to manipulate other traders’ orderplacement strategy.
14

submitted to the exchange, regardless of whether the order is executed or not. Orders are flagged
indicating whether they are executed (a trade), canceled, or modified. The fact that we observe
individual orders, not just the trades, allows us to calculate empirical measures of high-frequency
trading activity, such as the “order-to-trade” ratio (equivalently, the “quote-to-trade” ratio).
Second, to analyze trading in OSE listed stocks on competing stock exchanges, we use the Thom-
sonReuters Tick History (TRTH) Database. The TRTH contains trade-and-quote data for OSE listed
stocks across all European equity market places. For lit market places (markets with displayed order
books) the dataset provides information on the ten best levels of the bid and ask side of the limit
order book. The ThomsonReuters data also includes information on over-the-counter trading of OSE
shares through the inclusion of trades reported by Markit BOAT (a MiFID-compliant trade reporting
facility). We use the TRTH database to compute each stock exchange’s market share of trading, as
well as a wide range of stock liquidity measures (defined in Section 3.3).
Finally, we supplement these two datasets with information on end-of-day prices, OBX index
constituency, and tick size levels, obtained from the Oslo Stock Exchange Information Service (OBI).
3.2 Sample restrictions
In our empirical analysis, we focus exclusively on stocks with a primary listing on the Oslo Stock
Exchange (OSE) for which we have detailed data on the trading process. We restrict the sample
period to the calendar year 2009, which encompasses all the relevant tick size changes (see Section
1.4). We restrict our attention to the trading that occurs on the OSE, Chi-X, Turquoise, and BATS
Europe order books, as these were the four exchanges involved in the tick size war.
Throughout most of the empirical analysis, we restrict our sample to stocks in the large-cap
index at the OSE, the OBX index. Only OBX index stocks were affected by the July 6, 2009 tick size
reduction by the OSE. Moreover, though Chi-X, Turquoise, and BATS offered also offered trading in
non-OBX stocks, most of their trading activity was focused on OBX index stocks. For this reason, our
main sample comprises the 26 individual stocks in the OBX index.16 We will in some of our analyses
expand the sample to include all OSE listed stocks. This allows us to compare OSE listed stocks that
were affected by the tick size changes to corresponding stocks unaffected by the tick size war.
3.3 Variable definitions
We explore the impact of the tick size war between the Oslo Stock Exchange, Chi-X, Turquoise, and
BATS, on a number of common measures of stock market quality. To measure the transaction cost
dimension of stock liquidity we use four spread measures of liquidity. First, the relative spread is
defined as the difference between the current best bid and ask divided by the quote midpoint. We
update the relative spread whenever the limit order book is updated, and calculate the average of
these estimates throughout the trading day.
Second, the effective spread captures the cost of demanding liquidity. We define the effective
proportional half-spread for trade j in stock i as qji(pji � mji)=mji, where qji is an indicator
16One stock (RCL) moves into the OBX index and another (AKER) moves out of the OBX index during the sampleperiod (the relevant OBX revision date is June 19, 2009). We do not remove these stocks from the sample.
15

variable that equals +1 for buyer-initiated trades and �1 for seller-initiated trades; pji is the trade
price; and mji is the quote midpoint prevailing at the time of the trade. To determine whether an
order is buyer or seller initiated, we compare the transaction price to the previous quote midpoint —
if the price is above (below) the midpoint we classify it as a buy (sell). We compute average effective
spreads across all transactions during the trading day.
Third, the realized spreads measure the gross revenue to liquidity suppliers after accounting for
adverse price movements following a trade. The 5-minute realized spread for transaction j in stock i
is given by qji(pji �mi;j+5min)=mji, where mi;j+5min is the quote midpoint 5 minutes after the j’th
trade. qji and pji are defined as before. Similar to the effective spread, we calculate the daily average
of realized spreads for all trades during the day.
Fourth, the price impact captures the gross losses to liquidity demanders due to adverse selection.
The five-minute price impact for a given transaction j in stock i is defined as qji (mi;j+5min �mi;j) =mji.
We calculate our measure of price impact at the stock-day level by averaging the price impact across
all trades during the trading day.
We estimate the depth of the limit order book by calculating the sum of pending trading interest
at the best bid and ask prices. Our measure of order book depth is updated whenever the limit order
book is updated, and averaged across all order book states throughout the trading day. To proxy
for the noise in the price process, we estimate realized volatility as the second (uncentered) sample
moment of within-day ten-minute returns.
We use the so-called order-to-trade ratio (OTR) to proxy for the extent of high-frequency trading
activity at the stock-day level. The OTR is the ratio of messages (orders, order cancellations, order
modifications) submitted to the exchange’s limit order book relative to the number of completed
transactions. As high-frequency trading typically involves rapid cancellations and modifications of
outstanding orders, an increase in high-frequency trading activity may be captured by an increase in
the OTR.17
We proxy for order flow fragmentation by the dispersion of trading volume across trading venues.
In particular, we define our measure of order flow fragmentation for each stock i on date t as the
number of shares traded on venue v relative to the total trading volume across the OSE, CHI, TQ,
and BATS. This measure can be interpreted as the daily market share of venue v in stock i.
3.4 Descriptives I: Stock liquidity at the OSE (2007–2009)
To place the tick size war of 2009 in a broader context, Figure 3 plots time-series of stock liquidity
and stock prices for OBX index stocks at the Oslo Stock Exchange in the period 2007 to May,
2009. The figure shows that stock liquidity worsened significantly as stock prices declined during
the financial crisis in the Autumn of 2008. During the first few months of 2009, however, both stock
prices and stock liquidity at the OSE were gradually improving. This is particularly visible for average
quoted spreads, which declined from 0.5% at the height of the financial crisis to about 0.25% in May,
2009 — almost the same level as before the crisis.17The OTR is also commonly referred to as the ‘quote-to-trade’ or the ‘message-to-trade’ ratio. Jørgensen et al. (2017)
provide more details on order-to-trade ratios at the OSE.
16

Figure 3 Stock prices and stock liquidity, 2007–2009
2007 2008 2009
0.0
00
0.0
02
0.0
04
Year
Sp
rea
ds
20
03
00
40
05
00
OB
X in
dex
OBX index
Quoted Spread
Effective Spread
Realized Spread
The figure presents the daily average price level of stocks in the OBX index (right axis) and monthly averages of three different spreadmeasures of stock liquidity (left axis). The spread measures of liquidity are relative quoted spreads, effective spreads, and realized spreads(defined in Section 3.3). Our spread measures of liquidity are first computed on the stock-day level before they are averaged across allstocks in the OBX index on a monthly basis.
The sample period we consider surrounding the tick size war — the calendar year 2009 — is
therefore in the tail-end of the financial crisis in 2008. This means that our data are drawn from a
period when stock liquidity at the Oslo Stock Exchange was improving for reasons that are likely to
be unrelated to the tick size war of 2009. If unaccounted for in the empirical identification procedure,
these pre-existing trends will erroneously be attributed to the estimated impact of the tick size war.
In our empirical analysis of the impact of the tick size war on stock liquidity (Section 5), we attempt
to overcome the problem of confounding pre-existing trends by using a difference-in-differences
approach, which allows us to control for marked-wide trends in stock liquidity.18
3.5 Descriptives II: Trading at the OSE, Chi-X, Turquoise, and BATS (2009)
Table 2 summarizes our main outcome variables for the period January–May 2009 (the period before
the tick size war) separately for the OSE, Chi X, BATS, and Turquoise. The table shows that the
four stock exchanges in our sample differ notably in terms of estimated market quality. Transaction
costs are smallest at the OSE with an average effective spread of 0.13%, followed by Turquoise with
an average effective spread of 0.23%. The most expensive trading venue is Chi-X, with an average
effective spread of 0.56%. Similarly, for our other two measures of transaction costs, relative and
realized spreads, transaction costs are considerably smaller at the OSE than at the competing stock
18The Internet Appendix provides further descriptive statistics concerning the evolution of stock liquidity at the OsloStock Exchange, including summary statistics of our market quality measures both before and after the tick size war (in2008 and 2010).
17

Table 2 Descriptive statistics, January–May 2009
mean std min median max n
Oslo Stock ExchangeRelative spread (%) 0.404 0.212 0.089 0.341 1.668 2626Effective spread (%) 0.132 0.065 0.036 0.116 0.573 2626Realized spread (%) 0.025 0.061 -0.596 0.021 0.762 2626Price Impact (%) 0.103 0.080 -0.234 0.090 0.923 2626Depth (thousand NOK) 733 835 72 442 16758 2626Realized Volatility (%) 0.970 1.790 0.179 0.677 46.864 2626Volume (thousands NOK) 193023 322364 3000 71233 3942873 2626Order to Trade Ratio 8.0 5.6 2.2 6.4 111.2 2525Chi-XRelative spread (%) 2.366 1.705 0.159 1.809 8.589 2368Effective spread (%) 0.556 0.437 0.059 0.414 3.248 1863Realized spread (%) 0.174 0.513 -4.160 0.077 5.404 1859Price Impact (%) 0.378 0.469 -4.077 0.292 3.760 1857Depth (thousand NOK) 187 106 12 174 981 2388Realized Volatility (%) 0.558 0.269 0.047 0.515 5.603 1693Volume (thousands NOK) 2364 4594 0 782 66823 2507BATSRelative spread (%) 0.696 0.752 0.099 0.529 9.856 1429Effective spread (%) 0.294 0.281 0.042 0.219 4.209 654Realized spread (%) 0.106 0.676 -7.046 0.113 4.043 653Price Impact (%) 0.235 0.610 -2.375 0.157 7.383 629Depth (thousand NOK) 78 45 16 74 993 1674Realized Volatility (%) 0.500 0.305 0.045 0.434 3.033 415Volume (thousands NOK) 212 363 1 93 5777 1581TRQRelative spread (%) 0.536 0.723 0.118 0.360 7.798 656Effective spread (%) 0.233 0.265 0.047 0.172 3.155 608Realized spread (%) 0.105 0.311 -1.751 0.073 2.251 611Price Impact (%) 0.157 0.311 -1.458 0.104 2.280 599Depth (thousand NOK) 136 71 3 124 801 750Realized Volatility (%) 0.522 0.258 0.086 0.472 2.390 611Volume (thousands NOK) 1618 2519 1 843 37203 889Market SharesOSE 99.0 1.5 77.4 99.6 100.0 3747Chi-X 1.3 1.5 0.0 0.8 22.6 2321BATS 0.2 0.3 0.0 0.1 2.8 1613TRQ 0.4 0.6 0.0 0.3 11.0 908
The table summarizes stock trading characteristics separately for trading at the Oslo Stock Exchange, Chi-X, BATS, and Turquoise. Thesample period is January–May, 2009 (time period before the tick size war). Market quality measures: Quoted (relative) spread : The differencebetween the best bid and best ask in the order book, divided by price. Averaged across all order books during a trading day. Effectivespread : Difference between trade price and a pre-trade benchmark, relative to benchmark. Realized spread : Difference between trade priceand a post-trade benchmark, relative to trade price. Price Impact: Difference between post-trade and pre-trade benchmark, relative topre-trade benchmark. Depth: The total (NOK) amount outstanding at the best bid and ask. Volume: The total amount (in NOK) traded.Realized volatility: The (uncentered) standard deviation over ten minute interval returns. Order to Trade Ratio: Ratio of messages to theexchange’s order book divided by the number of consummated trades, on a daily basis. Only calculated for the OSE. Market shares: Theproportion of share trading volume on a given trading venue relative to the total share trading volume across the OSE, Chi-X, BATS, andTurquoise. At the OSE, the sample comprises all OBX index stocks.
18

exchanges.19
The OSE order books are also by far the deepest. The average order book depth at the OSE is
733 thousand NOK. While this average to some degree is inflated by the depth in Statoil (The median
OSE depth is 442 thousand), all the other exchanges (Chi-X, BATS, and Turquoise) have depths below
200 thousand. The OSE is also (by far) the most actively traded venue. Consequently, the OSE
holds a commanding market position for trading in stocks with an OSE primary listing. The average
market share of OSE in the period January–May 2009 is 99%. The Chi-X market share is 1.3% in the
shares they offer trading in while BATS and Turquoise hold market shares of less than half a percent.
4 Market shares during the tick size war
In this section, we explore the impact of the tick size reductions during the tick size war in June 2009
on the distribution of market shares across stock exchanges. Consistent with theoretical predictions
by Buti et al. (2015), we find that that small-tick size markets capture market shares from markets that
keep large tick sizes. This finding suggests that competitive stock exchanges may have an incentive
to undercut other exchanges’ tick sizes, as such tick size competition can allow them to increase their
market share.
4.1 Results: Distribution of market shares
We begin our empirical analysis by exploring the evolution of market shares during the tick size war.
To quantify the changes in market shares, we define three time periods. We define a pre-war period
from May 1 to May 31, a break-out period from June 1 to July 5, and a retaliation period from July 6
to August 31. Within each of these time periods, we compute market shares for each stock i on date
t for trading venue v.
In Table 3, we present the average market share for each trading venue in each of the three time
periods, as well as the change in average market shares between a given time period and the pre-
war period. The change in average market shares is obtained in a univariate regression framework
where we compare daily observations of market shares in one period (the break-out period or the
retaliation period) to daily observations of market shares in the pre-war period. We conduct a similar
regression analysis for the natural logarithm of daily trading volume, to understand whether market
share changes arise from flows of trading volume from one exchange to another, or alternatively from
trader entry or exit.
Table 3 shows a considerable shift in market shares from the OSE to Chi-X. Before the tick
size war, OSE market shares averaged 97.6% while Chi-X, the biggest competitor, operated with an
average market share of 2.19%. During the break-out period, OSE market shares declined by a highly
19Notice, however, that a direct comparison of transaction costs across exchanges may be misleading. For example, asindicated by the number of observations, Chi-X is active in more stocks than the other competing stock exchanges, BATSand Turquoise. That BATS and Turquoise appear to have smaller transaction costs than Chi-X may be because their tradingactivity is limited to only the most liquid stocks. Another reason to caution against a direct comparison of transactioncosts is that our spread measures of liquidity do not account for the maker-taker fees applied at the MTFs. As such, weare comparing the gross transaction costs between venues, which may differ substantially from the net transaction costs,depending on the aggressiveness on the trading strategy.
19

Table 3 Distribution of market shares during tick size war
Pre-warMay 1 - May 31
Break-outJune 1 - July 5
RetaliationJuly 6 - August 31
Oslo Stock ExchangeMarket share 97.60 94.74 94.95Diff. -2.86*** -2.65***
Trading volume (log) 18.72 18.46 18.18Diff. -0.26*** -0.53***
Chi-XMarket share 2.19 4.87 4.67Diff. 2.67*** 2.48***
Trading volume (log) 14.50 15.18 14.90Diff. 0.68*** 0.40***
TurquoiseMarket share 0.34 0.45 0.44Diff. 0.11** 0.10**
Trading volume (log) 12.71 12.59 12.37Diff. -0.11 -0.34*
BATSMarket share 0.16 0.17 0.11Diff. 0.01 -0.04**
Trading volume (log) 11.74 11.52 10.57Diff. -0.22** -1.17***
The table presents average market shares and trading volume for trading in stocks with an Oslo Stock Exchange primary listing, separatelyfor the Oslo Stock Exchange, Chi-X, Turquoise, and BATS Europe. Market share in stock i on date t for venue v, is given by the sharetrading volume on venue v relative to the share trading volume across OSE, Chi-X, Turquoise, and BATS. Average market shares andtrading volume are computed for three time periods: the pre-war period (May 1 to May 31); the break-out period ( June 1 to July 5); andthe retaliation period ( July 6 to August 31). The table also presents the change in market share and trading volume between a givenperiod (the break-out period or the retaliation period) and the pre-war period. The between-period changes in market share and tradingvolume are obtained by separately comparing daily observations of market shares or trading volume in either the break-out period or theretaliation period to daily observations of market shares or trading volume in the pre-war period in a regression framework. Standarderrors are clustered at the stock level.
20

statistically significant 2.86 percentage points. These market shares were captured almost exclusively
by Chi-X, which saw its market share more than double in the same period. Table 3 also shows that
the shift in market shares appears to be driven by a flow of trading volume from the OSE to Chi-X
— trading volume at the OSE fell by 26% after the Chi-X tick size reduction while trading volume at
Chi-X increased by 68%. Turquoise market shares for OSE listed stocks increased slightly, while we
find no impact on the market shares of BATS. Most of the order flow fragmentation occurs during
the break-out period in June, while market shares remain relatively stable following the OSE tick size
period (the retaliation period).20
To assess whether it is plausible that the market share changes in Table 3 are causally linked
to tick size reductions, Figure 4 provides evidence on the timing of the market share changes. The
figure shows an immediate and sizeable transfer of market shares from the OSE to Chi-X on the
day of the Chi-X tick size reduction. Market shares for Turquoise and BATS show no such patterns.
Following the OSE decision to reduce tick sizes in July, the OSE reclaims some of its lost market
shares from Chi-X. Overall, Figure 4 provides appealing evidence that the market share changes
during the Summer of 2009 are causally related to the tick size reductions during the tick size war.
Why did Chi-X, but not the other tick size-reducing exchanges, capture market shares from the
OSE? The answer to this question is most likely a combination of three factors. First, Chi-X probably
benefited from a ‘first mover’ advantage. Traders may have been settled and content with trading on
the Chi-X platform when Turquoise and BATS decided to reduce their tick sizes. Second, out of the
four stock exchanges, Chi-X operated with the smallest tick sizes during the break-out phase, meaning
that the Turquoise and BATS tick size reductions offered nothing extra compared to Chi-X. Third,
trading at Chi-X was already established and well-functioning before the tick size war; its market
share, trading volume, and order book depth was reasonably high compared to Turquoise and BATS
(see Table 2), which may explain why traders migrated to Chi-X and not the two other MTFs.
5 Tick size competition and market quality
Section 4 shows that the tick size war between the OSE, Chi-X, Turquoise, and BATS during the
Summer of 2009 led to considerable shifts in the distribution of market shares across stock exchanges.
In particular, the OSE experienced a considerable loss of market share to Chi-X. This section uses
a difference-in-differences design to explore the impact of the tick size war on various measures of
market quality.
20Though our findings in Table 3 mostly pass the bar of statistical significance, it is not clear how we should assess theeconomic significance of the tick size reductions during the tick size war. On the one hand, a market share transfer ofapproximately 3% only amounts to a 50 million USD loss in trading volume, given a total trading volume of 10.22 billionNOK at the OSE on May 29, 2009. On the other hand, the 3% market share change was sufficient to prompt the OSE tomake considerable changes to its market structure. It may be the case that the OSE judged the 3% market share change aseconomically sufficient by itself to respond to the Chi-X tick size reduction. More realistically, however, the OSE respondedbecause the Chi-X tick size reduction also had an impact on the overall quality of trading at the OSE. In Section 5, weexplore the market quality dimension of the tick size war.
21

Figure 4 Market shares throughout 2009
9294
9698
100
Mar
ket s
hare
Jan 2
009
Jun 2
009
Jul 2
009
Aug 20
09
Dec 20
09
(a) OSE
02
46
8M
arke
t sha
re
Jan 2
009
Jun 2
009
Jul 2
009
Aug 20
09
Dec 20
09
(b) CHI
0.5
11.
52
2.5
Mar
ket s
hare
Jan 2
009
Jun 2
009
Jul 2
009
Aug 20
09
Dec 20
09
(c) TQ
0.2
.4.6
.8M
arke
t sha
re
Jan 2
009
Jun 2
009
Jul 2
009
Aug 20
09
Dec 20
09
(d) BATS
The figure presents daily averages of stock-level market shares of trading in stocks with an Oslo Stock Exchange primarylisting, presented separately for the Oslo Stock Exchange (OSE), Chi-X (CHI), Turquoise (TQ), and BATS Europe (BS). Themarket share in stock i on date t for venue v is given by the share trading volume on venue v relative to the share tradingvolume across OSE, Chi-X, Turquoise, and BATS. The left vertical break indicates June 1, 2009, the date when Chi-Xreduced its tick size for OSE listed stocks. The right vertical break indicates July 6, 2009, the date when the OSE reducedits tick size for OSE listed stocks. Red lines are local polynomial smoothing regressions with a bandwidth of twenty tradingdays, that are fit separately within each of the sample windows.
22
5.1 Empirical specification
We use a difference-in-differences specification to estimate the impact of the tick size war on market
quality. In our setting, the difference-in-differences approach involves comparing changes in market
quality for a group of ‘treated’ stocks that were directly affected by the tick size reductions during the
tick size war to changes in market quality in an unaffected ‘control group’ of stocks. This comparison
between ‘treated’ and ‘control’ stocks is possible in our setting because only a subset of all OSE
stocks were listed for trading at competing exchanges and therefore affected by the Chi-X, Turquoise,
or BATS tick size reductions. The remaining OSE stocks were only traded at the OSE and were not
affected by the tick size reductions (the ‘control’ group)
The most useful feature of the difference-in-differences design is that it allows us to control for
confounding market-wide trends. This is achieved by estimating the effect of the tick size reductions
during the Summer of 2009 net of the time trend in the control group of unaffected stocks. Con-
trolling for market-wide trends is crucial in our setting since, as illustrated in Section 3.4, the sample
period we consider is at the tail-end of a long positive trend in stock liquidity. If unaccounted for —
using for instance a simple before-and-after event study design — this pre-existing trend would be
attributed to our estimate of the impact of the tick size war on stock liquidity.21
We are mostly interested in the impact of the tick size war on market quality at the OSE and
Chi-X, since trading at BATS and Turquoise appears to be largely unaffected by the tick size war. For
this reason, we define two separate treatment groups that we evaluate in the difference-in-differences
specification. The first treatment group is OBX index stocks traded on the OSE. The second treatment
group is OBX index stocks traded on Chi-X. Both groups were directly affected by the Chi-X tick size
reduction for OSE listed stocks on June 1, 2009 (labelled t�1) and the OSE tick size reduction for OBX
index stocks on July 6, 2009 (labelled t�2).
We compare separately the evolution of stock trading in our two treatment samples to a single
control sample. Our initial control sample consists of non-OBX index OSE stocks that were not
traded on Chi-X, Turquoise, or BATS throughout the calendar year 2009. Since these stocks were
not traded on any of the three MTFs, they were not directly affected by the MTF tick size reductions
during June 2009. Moreover, since these stocks did not belong to the OBX index, they were not
directly affected by the OSE tick size reduction on July 6. In order to maximize the comparability
between our highly liquid OBX index treatment group stocks and our control group stocks, we use
as control sample the 25 most-traded non-OBX stocks, where we use overall trading volume during
May 2009 to rank the stocks outside the OBX index.
The difference-in-differences design is implemented with the following regression model:
yit = �i + �t + �Treatmentit + !it; (1)
21In the Internet Appendix we estimate before-and-after event study designs that do not account for pre-existing trends.The Internet Appendix also provides further descriptive evidence for why such before-and-after designs are unlikely toinform us about the causal impact of the tick size war on stock liquidity. As an alternative way to estimate the impact of thetick size war on market quality, the Internet Appendix also includes an estimation of a so-called regression discontinuitydesign. The results from this specification are broadly consistent with the results we obtain with the difference-in-differencesdesign.
23

where Treatmentit = 1 for stock i that belongs to the treatment group on date t � t� and zero
otherwise; �i are stock-level fixed effects; and �t are date-level fixed effects. The inclusion of stock
and date fixed effects in equation (1) controls for fixed differences in yit between treatment and control
sample stocks and ensures that the effect of Treatmentit on yit is measured net of the time trend
in the control sample. Under the identifying assumption that treatment and control stocks follow the
same trend in yit in the absence of treatment, the coefficient � in equation (1) can be interpreted as
the causal impact of the tick size war on stock market quality.
Equation (1) is estimated separately for the two tick size reduction events of interest — the Chi-X
tick size reduction on June 1, 2009 (t�1) and the OSE tick size reduction on July 6, 2009 (t�2). We
restrict the sample period surrounding the June 1 event to April 1 to July 5. Surrounding the July 6
event, we use a sample period from June 1 to August 31. Figure 5 illustrates how our sample periods
are defined.
Figure 5 Illustration: Sample restrictions
Janu
ary20
09 ...
April20
09
May
2009
t� 1=June
1,20
09
t� 2=July
6,20
09
Aug
ust20
09
Septem
ber20
09 ...
Decem
ber20
09
Sample period 2Sample period 1
The figure illustrates how we define the difference-in-differences sample periods surrounding our two event dates. Our firstevent, t�1, is the beginning of the ’tick size war’ on June 1, 2009. Our second event, t�2, is the Oslo Stock Exchange ticksize reduction on July 6, 2009. First, surrounding the June 1, 2009, event, we restrict the sample period to April 1, 2009,to July 5, 2009. Second, surrounding the July 6, 2009 event, we restrict the sample period to June 1, 2009, to August 31,2009. Solid curly braces span the sample period surrounding June 1, 2009. Dashed curly braces span the sample periodsurrounding July 6, 2009.
5.2 Results: Market quality
In the top panel of Table 4, we use the difference-in-differences specification to assess the impact of
the Chi-X tick size reduction (t�1 = June 1, 2009) on the quality of trading at the OSE and Chi-X. The
table shows that stock liquidity at the OSE deteriorates as a result of the Chi-X tick size reduction. For
example, effective (realized) spreads increase by 9.9 (6.5) basis points for OSE listed stocks directly
affected by the tick size reduction relative to a control group of OSE listed stocks not affected by
the tick size reduction. These findings are robust to alternative specifications of the difference-in-
differences design.22 Despite capturing market shares, we find only weak evidence that Chi-X market
quality increased. In particular, effective and realized spreads at Chi-X decrease but the effects are
statistically insignificant. Order book depth at Chi-X improves by almost 15%, but the coefficient is
only statistically significant at the 10% level.
22The Internet Appendix estimates alternative specifications of the difference-in-differences design. For example, theInternet Appendix shows that our results are robust to alternative control groups and shorter sample periods.
24

Table 4 Difference-in-differencesPanel A: Chi-X tick size reduction (t� = June 1, 2009)
Effective spread Realized spread Depth Volatility
(1) (2) (3) (4) (5) (6) (7) (8)OSE� 0.099*** 0.091** 0.065** 0.056** 0.101 0.119 -0.001 -0.001
(2.70) (2.61) (2.56) (2.31) (1.23) (1.53) (-0.68) (-0.49)Controls No Yes No Yes No Yes No YesN 3018 3018 3021 3021 3157 3125 2921 2921Adj. R2 0.66 0.67 0.29 0.30 0.85 0.87 0.05 0.07CHI� -0.052 -0.001 -0.008 0.030 0.148* 0.038 -0.000 -0.002**
(-1.09) (-0.01) (-0.18) (0.69) (1.76) (0.44) (-0.51) (-2.04)Controls No Yes No Yes No Yes No YesN 2825 2825 2825 2825 3106 3021 2629 2629Adj. R2 0.52 0.54 0.19 0.20 0.63 0.66 0.10 0.13
Panel B: OSE tick size reduction (t� = July 6, 2009)
Effective spread Realized spread Depth Volatility
(1) (2) (3) (4) (5) (6) (7) (8)OSE� -0.002 0.004 -0.035 -0.026 -0.425***-0.436***-0.000 -0.000
(-0.09) (0.13) (-1.66) (-1.33) (-5.23) (-5.33) (-0.16) (-0.39)Controls No Yes No Yes No Yes No YesN 3121 3121 3120 3120 3271 3226 3022 3022Adj. R2 0.72 0.73 0.38 0.39 0.82 0.84 0.05 0.07CHI� -0.077** -0.070** -0.023 -0.015 -0.201** -0.207** 0.001 0.000
(-2.21) (-2.07) (-0.92) (-0.61) (-2.44) (-2.54) (1.11) (0.84)Controls No Yes No Yes No Yes No YesN 3078 3078 3077 3077 3258 3200 2923 2923Adj. R2 0.63 0.64 0.30 0.32 0.58 0.61 0.12 0.14
The table presents estimates of � from the difference-in-differences specification applied separately to the Chi-X tick size reduction (t� =June 1, 2009) and the OSE tick size reduction (t� = July 6, 2009). Surrounding the June 1, 2009, event, we restrict the sample period toApril 1, 2009, to July 5, 2009. Surrounding the July 6, 2009 event, we restrict the sample period to June 1, 2009, to August 31, 2009.The regression specification is yit = �i + �t + �Treatmentit + !it. Treatmentt is a dummy variable equal to 1 for all treatmentgroup observations on dates t � t�. The difference-in-differences specification is estimated separately for two treatment groups. The firsttreatment group is OBX index stocks traded on the OSE. The second treatment group is OBX index stocks traded on Chi-X. Our controlsample of stocks consists of the 25 most-traded (based on total trading volume) non-OBX index OSE stocks that were not traded onthe multilateral trading facilities (MTFs) Chi-X, Turquoise, or BATS throughout the calendar year 2009. Espread is the effective spreads,in percentage points. Rspread is the realized spreads, in percentage points. Depth is order book depth, transformed with the naturallogarithm. Volatility is measured in percentage points. Standard errors are clustered at the stock-level.
25

To what extent are the observed changes in market quality at the OSE and Chi-X accounted for
by a simple redistribution of trading volume? Section 4.1 documents that the shift in market shares
between the OSE and Chi-X is mostly accounted for by a flow of trading volume from the OSE
to Chi-X. Given the tight relationship between trading volume and measures of stock liquidity, one
could imagine that the reduction (improvement) in stock liquidity at the OSE (Chi-X) is mechanically
related to the flow of trading volume documented in Section 4.1. To determine the extent to which the
observed changes to market quality are driven by changes in the distribution of trading volume, we
include trading volume as a control variable in our difference-in-differences regressions. For Chi-X,
we find that the entire increase in order book depth can be accounted for by an increase in trading
volume. Meanwhile, for the OSE, the negative effects of the tick size war on trading costs persist even
after controlling for trading volume.
In the bottom panel of Table 4, we evaluate the impact of the OSE tick size reduction (t�2=July
6, 2009) on stock market quality. The OSE tick size reduction causes a considerable reduction in
order book depth at both the OSE (�42:5%) and Chi-X (�20%) — both effects measured relative to
OSE listed stocks with no tick size change. We find no impact of the OSE tick size reduction on
spread measures of liquidity at the OSE. In contrast, effective spreads at Chi-X appear to decline
slightly following the OSE tick size reduction. Meanwhile, this effect fails to replicate in alternative
specifications of the difference-in-differences design, which means that we cannot place much weight
on this finding (see the Internet Appendix).
6 Mechanisms
Section 4 shows that Chi-X was able to capture market shares from the OSE by reducing its tick size,
while Section 5 shows that this tick size competition was detrimental to stock liquidity. In this section
we investigate competing mechanisms that can potentially explain the redistribution of market shares
from the OSE to Chi-X following the Chi-X tick size reduction, and the ensuing changes to market
quality.
We begin by distinguishing between two competing mechanisms for how between-exchange tick
size differences affect the distribution of market shares. The first mechanism we consider is whether
tick sizes affect market share changes by constraining the bid-ask spread in the main market, inducing
traders to ‘queue-jump’ by sending orders to alternative markets where the bid-ask spread is less
contrained (Buti et al., 2015). The second mechanism we consider is whether the tick size affects the
distribution of market shares through its impact on the trading behavior of high-frequency traders
(HFT).
6.1 Empirical specification
To distinguish between our two candidate mechanisms we estimate a cross-sectional regression where
the change in the OSE market share is explained by proxies related to our candidate mechanisms.
To implement this empirical test, we collapse all our stock characteristics into averages within two
separate time periods — a pre-tick size war period in May 2009 and a post-tick size war period
26

between June 1, 2009 and July 6, 2009 — and estimate the following cross-sectional regression:
�Post�PreMarketshareOSEi = �0 + �XPrei + "i (2)
where �Post�PreMarketshareOSEi is the change in average OSE market share between May 2009
(pre period) and June 2009 (post period) for stock i, and Xi is a vector of average pre-tick size war
covariates, which includes proxies for tick size constraints and HFT at the OSE. The vector Xi is
constructed using data from the pre-tick size war period to avoid that the stock characteristics in Xi
themselves are affected by the tick size war. The sample we use to estimate equation (2) includes only
the stocks that were directly affected by the Chi-X tick size reduction (our main sample of OBX index
stocks).
Similar to our approach in Section 5, we simplify the analysis by focusing on the the trading that
occurs at the OSE and Chi-X. Consequently, MarketshareOSEi is computed as the distribution of
share trading volume between the OSE and Chi-X.
6.2 Our proxies: ‘Tick constrained’ and ‘Order-to-trade’
Before we estimate equation (2), we define our empirical proxies for the stock-level extents of tick size
spread constraints and HFT activity.
First, an order book is potentially constrained by the tick size when the distance between the best
bid and best ask is equal to a single tick. Tick size constraints can either be measured by a binary
variable for whether or not the bid-ask spread is constrained by the tick size, or by a discrete variable
that counts the number of ticks between the best bid and ask. We use a binary variable constructed
following the procedure in O’Hara et al. (2015), where we first compute the average number of ticks-
per-quoted-spread (the quoted spread divided by the tick size) during the pre-war period, and then
define a stock to be Tick Constrained if the average number of ticks-per-quoted spread is less than
two.23
Second, to proxy for the extent of HFT activity, we use the order-to-trade ratio (OTR). The OTR
is a commonly-used proxy for HFT activity, and is computed by counting the number of orders that
are submitted to the limit order book and dividing this count by the number of executed trades.
Descriptive statistics of the OTR are presented in Table 2. In the period January–May 2009, the
average number of orders per executed trade at the OSE was 8, with a standard deviation of 5.6 and
a median of 6.4.
In addition to our proxies for tick size constraints and HFT activity, we allow for alternative
determinants of market share changes. In the regressions we include measures of trading costs
(quoted and effective spreads) as well as measures of trading volume (NOK volume or order book
depth).
23In the period January–May 2009, the average ticks-per-spread has a minimum of 1.272 and a median of 1.866. Inunreported regressions, we have also used the actual number of ‘ticks per spread’ as an explanatory variable, instead of thebinary Tick Constrained variable. The conclusions with this specification are similar.
27

6.3 Results I: Cross-sectional regressions
Table 5 presents estimates of the cross-sectional regression (2), where the change in OSE market share
between the pre-war period and the break-out period is the dependent variable. Starting with our
proxy for tick size constraints, the table shows a negative regression coefficient, which indicates that
tick size constrained shares fragment more as a result of the Chi-X tick size reduction in June 2009.
This positive relationship between tick size constraints and order flow fragmentation is in line with
theoretical predictions (Buti et al., 2015). However, the relationship is not statistically significant in
any of the regression specifications in Table 5.
Table 5 Explaining market share changes with OSE characteristics
Dependent variable:
Change in OSE Market Share
(1) (2) (3) (4) (5) (6) (7) (8)
Quoted (rel) spread 2.756 6.004(2.625) (4.073)
Effective spread 13.538�� 18.728��
(6.456) (7.161)
Depth �0.001 0.001(0.005) (0.006)
Volume 0.001 �0.00000(0.003) (0.005)
Tick Constrained �0.007 �0.005 �0.005(0.006) (0.005) (0.005)
Order to Trade �0.002�� �0.003�� �0.002���
(0.001) (0.001) (0.001)
Constant �0.034��� �0.045��� �0.010 �0.046 �0.022��� �0.013� �0.019 �0.045(0.008) (0.009) (0.066) (0.053) (0.004) (0.007) (0.116) (0.090)
Observations 26 26 26 26 26 26 26 26Adjusted R2 0.004 0.120 �0.039 �0.035 0.031 0.144 0.316 0.416
Note: �p<0.1; ��p<0.05; ���p<0.01
The table presents coefficient estimates from the regression �Post�PreMarketshareOSEi
= �0 + �XPre
i+ "i. The regressions
explain changes in OSE market share between the pre-war period period (May ’09) and the break-out period ( June-July 5). Each columnis a separate regression. Explanatory variables: Quoted (relative) spread : The difference between best bid and best ask in the order book,divided by price. Averaged across all order books during a trading day. Effective spread : Difference between trade price and a pre-tradebenchmark, relative to trade price. Depth: The natural log of the total (NOK) amount outstanding at the best bid and ask. Volume: Thenatural log of the total amount (in NOK) traded. Tick Constrained : Dummy variable equal to one if “Spreads per tick” (Quoted spreaddivided by tick size) is less than two. Order to Trade Ratio: The number of orders (messages) in the trading system per trade. All theexplanatory variables are measured as averages over daily observations at the OSE during May, 2009 (the pre-war period).
In contrast, we find a strong and statistically significant relationship between our measure of HFT
in the pre-war period and subsequent order flow fragmentation. Specifically, stocks that have more
HFT activity at the OSE fragment more following the Chi-X tick size reduction. This result remains
statistically significant across various regression specification. As a consequence, our results more
28

strongly favor that between-exchange tick size differences affect the distribution of market shares
through its impact on HFT activity. This result contrasts with the existing empirical evidence from
U.S. markets, which suggests that between-exchange tick size differences affect market shares because
of queue jumping driven by differences in the severity of spread constraints (e.g. Buti et al. 2015).
One possible explanation for why we find no significant relationship between our measure of tick
size spread constraints at the OSE and the change in market share is that our proxy may not capture
the aspects of tick size spread constraints that are relevant for traders. After all, what matters to
traders is not necessarily whether the bid-ask spread at the OSE is constrained by the minimum tick
or not. Instead, traders may care about whether the spread at the OSE is more or less constrained
than at Chi-X.
Another possible explanation for the lack of correlation is that our measure of tick size spread
constraints is computed in the pre-tick size war period, and not during the tick size war. One can
imagine that Chi-X’s tick size reduction relaxed the tick size spread constraints at Chi-X compared
to the OSE, an aspect which we do not capture with our regression specification (2).
To address these potential concerns, we construct an alternative proxy which attempts to capture
the difference in tick size spread constraints between the OSE and Chi-X. We also measure this
difference during, instead of before, the tick size war. To this end we estimate the following cross-
sectional regression model:
�Post�PreMarketshareOSEi = �1 + �1�TSOSEi � TSCHI
i
�Post+ �2
�XOSE
i �XCHIi
�Pre+ "i
(3)
where TSOSEi and TSCHIi are the average ticks-per-quoted-spread measured during the tick size war
period at the OSE and Chi-X, respectively. To address the possibility that between exchange differ-
ences in tick size spread constraints are correlated with between-exchange differences in stock liquid-
ity, we generate a set of relative liquidity measures. In particular, the vector term�XOSE
i �XCHIi
�
captures the differences in our measures of stock liquidity and trading volume at the OSE and Chi-X.
Table 6 presents estimates from our cross-sectional regressions using differences in trading char-
acteristics between the OSE and Chi-X as explanatory variables. The table confirms our previous
findings that the extent of tick size constraints is a poor explanatory variable for the extent of market
share changes during the tick size war. The only statistically significant explanatory variable we find
is trading volume — shares that tend to be heavily traded at the OSE compared to Chi-X fragment
less despite cross-market differences in the tick size.
6.4 Results II: High-frequency trading
Section 6.3 shows that the stock-level change in OSE market share following the Chi-X tick size
reduction is positively related to the stock-level extent of high-frequency trading (HFT) at the OSE,
even after controlling for observable characteristics of the stock’s trading environment. This result is
consistent with HFTs routing their orders to small-tick exchanges rather than large-tick exchanges.
In this section we further explore the potential mechanism that HFTs can account for the observed
redistribution of market shares from the OSE to Chi-X.
29

Table 6 Explaining fragmentation with difference main market (OSE) and aggressor (Chi-X)
Dependent variable:
Change in OSE Market Share
(1) (2) (3) (4) (5) (6) (7)
Quoted (rel) spread �0.156 �0.273(0.274) (0.313)
Effective spread �0.587 0.793(1.172) (1.073)
Depth 0.002 0.003(0.007) (0.008)
Volume 0.009��� 0.011���
(0.003) (0.003)
Relative Tick �5.861 �5.512 �5.698(6.370) (6.670) (5.078)
Constant �0.029��� �0.029��� �0.030��� �0.068��� �0.019�� �0.028 �0.064���
(0.004) (0.004) (0.011) (0.011) (0.008) (0.017) (0.013)
Observations 25 25 25 25 26 25 25Adjusted R2
�0.029 �0.032 �0.039 0.341 �0.006 �0.074 0.354
Note: �p<0.1; ��p<0.05; ���p<0.01
The table shows results of estimation of�Post�PreMarketshareOSE
i= �1 + �1
�TSOSE
i� TSCHI
i
�Post+ �2
�XOSE
i�XCHI
i
�Pre+ "i The regressions explain
changes in OSE market share between the pre-war period period (May, 2009) and the break-out period ( June-July 5). Each columnis a separate regression. Explanatory variables: Quoted (relative) spread : The difference between best bid and best ask in the order book,divided by price. Averaged across all order books during a trading day. Effective spread : Difference between trade price and a pre-tradebenchmark, relative to trade price. Depth: The natural log of the total (NOK) amount outstanding at the best bid and ask. Volume: Thenatural log of the total amount (in NOK) traded. Relative tick: Quoted spread (average through trading day) divided by tick size. Allexplanatory variables X except Relative tick are first measured on a daily basis as XOSE �XCHI , and then averaged within the pre-warperiod May, 2009. Relative tick is measured as the daily difference in ‘Spreads per tick’ at the OSE and Chi-X, and averaged within thebreak-out period June 1 to July 6.
30

Two data limitations force us to rely on indirect empirical evidence in support of the HFT mech-
anism. First, the ideal empirical test for whether HFTs account for the market share changes would
be to explore whether HFT activity at Chi-X increased after its tick size reduction, and that HFT
activity at the OSE decreased. Unfortunately, our data do not permit such a test. This is because we
can only proxy for HFT activity for trading at the OSE, and not for trading at Chi-X. The second
limitation is that aggregate HFT activity at the OSE is unlikely to change much on account of the
three percentage point market share loss to Chi-X. Nevertheless, we proceed by shedding light on two
mechanisms that can illustrate why HFTs may be important in our setting.
The first mechanism we consider is that between-exchange tick size differences can create me-
chanical price differences for the same security at different stock exchanges, which allows for profitable
cross-market arbitraging. For instance, a coarser price grid at the OSE implies that it is more difficult
to bid the security price to its marginal fundamental value than at Chi-X. Traders with access to both
markets can exploit these arbitrary between-exchange price differences by, for example, buying shares
at Chi-X for prices that are unattainable at the OSE, and selling the shares in the price-constrained
OSE market. HFTs’ speed advantage make them prime candidates for exploiting such cross-market
arbitrage opportunities, because it is typically the first mover who gets the best prices.
We leverage the granularity of our data to assess whether the tick size war introduced cross-market
arbitraging opportunities, and whether investors actually traded on these arbitrage opportunities. To
do so, we divide the trading day into separate five-minute intervals (e.g., 09:00am – 09:05am, or
09:06am – 09:10am), and collect from each five-minute interval the highest and the lowest trade
prices that occur at the OSE.24 Next, we infer whether trades at Chi-X in the same five-minute
intervals occur at prices that are within the price bands at the OSE. The idea behind this comparison
is that the coarse price grid at the OSE may prevent trades from happening at certain prices, while
the granular price grid at Chi-X can accommodate these trades. For this reason, more Chi-X trades
happening outside the OSE price bands indicates that traders route their orders to Chi-X to achieve
better prices, perhaps with the intention of offloading the position for profit at the OSE.
Figure 6 presents striking evidence that the tick size war between the OSE and Chi-X introduced
between-exchange price differences that traders acted on. Before the June 1 Chi-X tick size reduction,
nearly 90% of all trades at Chi-X took place within the price bands established at the OSE. However,
during the tick size war a much larger portion of Chi-X trades took place at prices outside the OSE
price bands. Indeed, immediately after the Chi-X tick size reduction, the fraction of Chi-X trades
occurring outside the OSE price bands increased from approximately 10% to more than 20%. In
other words, as prices at the OSE and Chi-X deviate more often, cross-market arbitraging becomes
more profitable.
However, cross-market arbitraging cannot be the only mechanism to explain why Chi-X captures
market shares from the OSE. For one, cross-market arbitraging is a two-sided trading strategy, which
means that any position that HFTs take at Chi-X is offset by an equal-sized position at the OSE. This
24By using five-minute intervals instead of, for instance, one-second or split second intervals, we at least partly circumventthe problem that trading feeds from different exchanges may be imperfectly time-synchronized. Differences in processingtimes across exchanges makes it difficult to determine whether trades that are reported within very small time periodsactually took place at comparable times.
31

Figure 6 Fractions of Chi-X trades outside the OSE price bands
Jan Mar May Jul Sep Nov Jan
0.1
0.2
0.3
0.4
Index
avg
s
Average across firms with Chi−X trading
The figure presents daily cross-sectional averages of the fraction of Chi-X trades that take place outside the price bandsestablished at the OSE. We define price bands by splitting the trading day into separate five-minute trading intervals (e.g.,09:00am – 09:05am, or 09:06am – 09:10am), and collect from each five-minute interval the highest and the lowest tradeprices that occur at the OSE. Next, we infer whether trades at Chi-X in the same five-minute intervals occur at prices thatare within the price bands at the OSE. We generate first a stock-day level variable which captures the fraction of trades atChi-X that take place outside the OSE price bands, before we average this variable across all OSE stocks with trading atChi-X.
32
implies that trading volume should increase at both the OSE and Chi-X while market shares remain
the same, which is at odds with our findings in Section 4.1. An alternative mechanism, which is also
compatible with the findings in Figure 6, is that the small tick size at Chi-X reduces the marginal cost
of undercutting existing quotes, which makes it easier and perhaps more profitable for HFTs to pick
off stale quotes at the arrival of new information.
To assess whether it is plausible that HFTs are drawn to Chi-X because its small tick size makes it
easier for HFTs to implement their trading strategies, we explore how HFTs at the OSE responded to
the OSE tick size reduction on July 6, 2009. Figure 2 plots our measure of HFT activity throughout
the calendar year 2009, separately for OBX index stocks directly affected by the tick size war and for
non-OBX index stocks unaffected by the tick size war. The most striking feature of Figure 2 is that
HFT activity at the OSE increased notably for OBX index stocks after the OSE tick size reduction
but remained stable for the unaffected non-OBX stocks. This finding suggests that HFTs trade more
actively when tick sizes are small, which can help explain our finding in Section 6.3 that the extent
of market share losses at the OSE during the tick size war positively correlates with HFT activity.
6.5 Discussion of potential mechanisms
Section 4 shows that Chi-X was able to capture market shares from the OSE by reducing its tick size.
Moreover, Section 5 shows that trading costs at the OSE increased as a consequence of the Chi-X
tick size reduction, while trading costs at Chi-X remained unchanged. The current section presents
supplementary evidence that high-frequency traders (HFTs) appear to be responsible for the observed
redistribution of market shares from the OSE to Chi-X. We now propose two potential mechanisms
that can unify our findings on HFT trading strategies and trading costs at Chi-X and the OSE during
the tick size war.
The first mechanism we have in mind is that HFTs route their orders to the markets that offer the
smallest tick size, in our case Chi-X, which drives the observed redistribution of market shares from
the OSE to Chi-X. Moreover, since we find that stock liquidity at Chi-X does not appear to improve
from the inflow of HFT trading volume, we conclude that these HFTs consume liquidity and do not
supply liquidity. Alternatively, the finding that HFT activity does not improve liquidity at Chi-X is
consistent with HFTs being informed investors whose trading imposes an adverse selection cost for
limit order traders at Chi-X, which forces bid-ask spreads to widen.
Meanwhile, the interpretation that informed and liquidity-demanding HFTs migrate the OSE in
favor of Chi-X cannot explain why trading trading costs at the OSE increased after the Chi-X tick
size reduction. This is because trading costs at the OSE should worsen when informed liquidity-
demanders leave the exchange. We interpret the finding that the same trading volume can have
opposite impacts on the trading costs at the OSE and Chi-X as consistent with a mechanism where
HFTs switch from trading as liquidity-providers in the large-tick OSE market to trading as liquidity-
demanders in the small-tick Chi-X market.
Most of our empirical analysis has focused on HFT trading strategies and investors’ trading costs
following the June 1 Chi-X tick size reduction, and relatively little attention has been given to the OSE
retaliatory tick size reduction in July, 2009. This is mainly because most of the change in market
33

shares during the tick size war occurs in a small time period following the Chi-X tick size reduction
(see Section 4.1). However, though we find little change in market shares following the OSE retaliatory
tick size reduction, we do observe that investors adapt their trading strategies to the new tick size.
For example, we find that order book depths at both the OSE and Chi-X declined considerably as the
OSE tick sizes came down. This finding suggests that tick size reductions lower the incentives to post
limit orders at the top of the order book. Moreover, this finding suggests that tick size reductions
in one market can have negative spill-over effects on the order book depths in markets that do not
change their tick size.
7 Conclusion
This paper studies a situation where competition can induce stock exchanges to implement mar-
ket design changes that worsen trading conditions for market participants. Our empirical analysis
considers an event in 2009 where three European stock exchanges, Chi-X, Turquoise, BATS Europe,
reduced their tick sizes (the smallest price increment on the exchange) for stocks with an Oslo Stock
Exchange (OSE) primary listing. The OSE quickly responded by reducing its own tick sizes, before
all the exchanges agreed on a common tick size structure. We find that the tick size-reducing ex-
changes captured market share from the OSE, and that the competitive tick size reductions increased
trading costs for market participants. High frequency trading appears to be the main driver behind
the market share and trading cost results.
The results in this paper contribute to the existing empirical literature on tick sizes. First, a
recent literature shows that trading venues that offer small tick sizes can capture market shares from
large-tick trading venues (e.g. Bartlett and McCrary 2015, Biais, Bisière, and Spatt 2010, Kwan et al.
2015). Consistent with the existing literature, we find that trading platforms with relatively small tick
sizes capture market share from large-tick trading platforms. We add to the existing literature by
exploring the tick size that arises endogenously through competition between stock exchanges that
strategically adjust their tick size, and estimate the effects of this competitive tick size on market
quality.
Second, our results connect to the empirical debate over HFTs’ optimal response to tick size
changes. O’Hara et al. (2015) and Yao and Ye (2015) argue that HFTs become more active in liquidity
provision and have larger profit margins in a large-tick environment. They propose that HFTs’ speed
advantage becomes more valuable when price competition is constrained by the tick size. Our results,
in contrast, suggest that HFT seem to migrate large-tick exchanges in favor of small-tick exchanges.
The conflicting results in our paper can indicate that certain types of HFT strategies may require a
fine pricing grid whereas other HFT strategies, such as liquidity-provision, can benefit from a large
tick size.
Finally, this paper provides empirical support for current market regulations in the United States
that enforce a common tick size across competing stock exchanges, and for proposed regulations in
Europe that aim to accomplish the same. Our results suggest that individual stock exchanges have an
incentive to reduce the tick size to capture market shares and, at the same time, that competitive tick
size reductions can reduce overall market quality. Policy makers can limit stock exchanges’ ability to
34

engage in such destructive tick size competition by strictly enforcing a shared tick size regime across
all trading venues competing for the same order flow.
35

ReferencesBartlett, III, R. P. and J. McCrary (2015): “Dark Trading at the Midpoint: Pricing Rules, Order Flow and High Frequency
Liquidity Provision,” Working Paper, University of Berkeley.
BATS (2009): “Pan European Tick Size Pilot,” BATS Trading Working Paper.
BATS-Chi-X (2012): “BATS Chi-X Europe Reference Data Specification,” Tech. rep., BATS – Chi-X.
Biais, B., C. Bisière, and C. Spatt (2010): “Imperfect Competition in Financial Markets: An Empirical Study of Island andNasdaq,” Management Science, 56, 2237–2250.
Buti, S., F. Consonni, B. Rindi, Y. Wen, and I. Werner (2015): “Sub-Penny and Queue-Jumping,” Working paper, Ohio StateUniversity, Columbus OH.
Cordella, T. and T. Foucault (1999): “Minimum Price Variations, Time Priority, and Quote Dynamics,” Journal of FinancialIntermediation, 8, 141–173.
Federation of European Securities Exchanges (2009): “European exchanges introduce harmonised tick size regimes inEurope,” Press Release, Brussels, 30th June 2009.
Foucault, T., O. Kadan, and E. Kandel (2005): “Limit Order Book as a Market for Liquidity,” The Review of FinancialStudies, 18, 1171.
Glosten, L. R. and P. R. Milgrom (1985): “Bid, ask and transaction prices in a specialist market with heterogenouslyinformed traders,” Journal of Financial Economics, 14, 71–100.
Grant, J. (2009): “LSE bows to tick size pressure as war erupts,” Financial Times, London. Available athttps://www.ft.com/content/1b386f66-5b69-11de-be3f-00144feabdc0.
——— (2011): “Euronext sparks outrage with tick size reduction,” Financial Times, London.
Hagströmer, B. and L. Nordén (2013): “The Diversity of High Frequency Traders,” Journal of Financial Markets, 16, 741–770.
Holden, C. W., S. Jacobsen, and A. Subrahmanyam (2013): “The Empirical Analysis of Liquidity,” Foundations and Trendsin Finance, 8, 263–365.
Jørgensen, K., J. Skjeltorp, and B. A. Ødegaard (2017): “Throttling hyperactive robots - Order to Trade Ratios at the OsloStock Exchange,” Working Paper, University of Stavanger.
Kwan, A., R. Masulis, and T. H. McInish (2015): “Trading Rules, Competition for Order Flow and Market Fragmentation,”Journal of Financial Economics, 28, 592–636.
Kyle, A. (1985): “Continous auctions and insider trading,” Econometrica, 53, 1315–35.
Meling, T. G. (2016): “Anonymous trading in equities,” Working Paper, SSRN.
Menkveld, A. J. (2013): “High frequency trading and the new market makers,” Journal of Financial Markets, 16, 712–740.
——— (2016): “The Economics of High-Frequency Trading: Taking Stock,” in Annual Review of Financial Economics, ed.by A. Lo and R. Merton, Annual Reviews, vol. 8 of Annual Review of Financial Economics.
O’Hara, M., G. Saar, and Z. Zho (2015): “Relative Tick Size and the Trading Environment,” Working Paper, SSRN.
Pagano, M. (1989): “Trading Volume and Asset Liquidity,” Quarterly Journal of Economics, 104, 255–274.
Securities and Exchange Commision (2012): “Report to Congress on Decimalization,” SEC Report.
Verousis, T., P. Perotti, and G. Sermpinis (2017): “One size fits all? High frequency trading, tick size changes and theimplications for exchanges: Mmarket quality and market structure considerations,” Rview of Quantitative Finance andAccounting, forthcoming.
Yao, C. and M. Ye (2015): “Why Trading Speed Matters: A tale of Queue Rationing under Price Controls,” Working Paper,University of Warwick and University of Illinois at Urbana-Champaign.
36