thunderstorm effects on sporadic e propagation in 144 mhz · thunderstorm effects on sporadic e...
TRANSCRIPT

This document is copyright (C) of the above authors, 2005. All rights reserved. No part of this documentmay be reproduced in any form or by any means, or stored in a database or retrieval system, without
prior written permission of the authors.
April 17, 2005
Thunderstorm Effectson Sporadic E Propagation in 144 MHz
Volker Grassmann, DF5AISabine Cremer, DL1DBCJoachim Kraft, DL8HCZUdo Langenohl, DK5YA
Allard Munters, PE1NWLGabriel Sampol, EA6VQ
Abstract. Radio amateurs speculate about the possibility of thunderstorm effects on ionosphericsporadic E radio propagation on very high frequencies. This speculation is however not generallyaccepted in the ham community because convincing evidence is not yet available. Consideringscientific resources, thunderstorm effects on the ionosphere cannot be generally excluded thoughwhich is in particular evident when considering investigations on travelling ionospheric disturbancesand spread-F irregularities in the equatorial F region. This paper discusses the model of thunder-storm-triggered gravity waves travelling from the troposphere and stratosphere into the ionospherewhere the gravity waves may cause wind shears at E region level which are considered one causeof sporadic E layers in mid-latitudes. The GPS/MET radio occultation experiment appears to supportthis model by statistical analyses providing an impressive correlation between convectively gener-ated gravity waves in the lower atmosphere and electron density irregularities in the E region of theionosphere. OH nightglow measurements also provide clear evidence of mesospheric gravity wavesassociated with underlying thunderstorms. The paper presents a ham radio project which analysesthe spatiotemporal correlation between 144 MHz sporadic E long-distance communication and VLFradio emissions from lightnings (sferics). The June 27, 2004 event shows a surprising correlationbetween the geographical position of sferics and the geographical position of sporadic E scatterers.In order to support statistical studies of sferic and sporadic E positions, the paper proposes a dataanalysis method which may be easily implemented in amateur radio propagation studies if scientificobservatories would provide the required raw data material.

Thunderstorm effects on sporadic E propagation in 144 MHz Page 2
Volker Grassmann, DF5AISabine Cremer, DL1DBC
Joachim Kraft, DL8HCZUdo Langenohl, DK5YA
Allard Munters, PE1NWLGabriel Sampol, EA6VQ
Contents
1 Introduction .......................................................................................................................... 3
2 Geophysical background information .................................................................................. 4
2.1 Neutrals, ions and electrons in the ionosphere............................................................... 4
2.2 Wind shear theory........................................................................................................... 5
2.3 Wave phenomena in the Earth atmosphere .................................................................... 6
2.4 Convectively generated gravity waves.......................................................................... 7
2.5 Sferics and global thunderstorm activity......................................................................... 8
2.6 Seasonal and latitudinal variations of sporadic E.......................................................... 11
3 Possible model of thunderstorm effects on sporadic E..................................................... 13
3.1 Assembling the puzzle.................................................................................................. 13
3.2 Thunderstorm effects on the F region of the ionosphere............................................. 14
3.3 Example 1: E region irregularities over tropical convection zones................................ 163.3.1 The GPS/MET radio occultation experiment......................................................... 163.3.2 Analysis of the Febuary 1997 prime-time data.................................................... 163.3.3 Orographic effects.............................................................................................. 173.3.4 Geographical distribution of E region irregularities.............................................. 183.3.5 Comments............................................................................................................ 18
3.4 Example 2: Thunderstorms generating sprites and gravity waves .............................. 19
3.5 Scientific investigations versus ham radio studies....................................................... 21
4 The thunderstorm analysis project .................................................................................... 23
4.1 The project team............................................................................................................ 23
4.2 Data acquisiton and data analysis ................................................................................ 244.2.1 General overview................................................................................................ 24
4.3 Data acquisiton and data analysis ................................................................................ 244.3.1 General overview................................................................................................ 244.3.2 Sferic data........................................................................................................... 244.3.3 Automatic data retrieval systems........................................................................ 254.3.4 Sporadic E dx information.................................................................................... 254.3.5 Current data analysis tools.................................................................................. 25
4.4 First results obtained during the sporadic E season 2004............................................ 26
4.5 Next steps in data analysis........................................................................................... 28
5 Summary and concluding comments ................................................................................. 29
6 References........................................................................................................................ 31

Thunderstorm effects on sporadic E propagation in 144 MHz Page 3
Volker Grassmann, DF5AISabine Cremer, DL1DBC
Joachim Kraft, DL8HCZUdo Langenohl, DK5YA
Allard Munters, PE1NWLGabriel Sampol, EA6VQ
1 Introduction
Do thunderstorms create sporadic E layers enabling long distance VHF communication?KYRIAZIS (5B4AZ), for example, claims that sporadic E clouds located over the Balkans north ofGreece are “strongly related” to “big [thunderstorm] formations” in that region [35]. We mayeven find radio amateurs considering a more general relationship between the weather andsporadic E activity in 144 MHz. GYDE (ZL3NE), for example, considers sporadic E propagation in144 MHz a general misinterpretation, i.e. he denies all long distance sporadic E QSOs in Austra-lia and New Zealand and interprets all this QSOs by tropospheric propagation [19], [20]. Manyradio amateurs remain sceptical though. GRAYER (G3NAQ), for example, notes that none of theclaimed connections between thunderstorms and sporadic E “have yet been demonstrated withscientific conviction” [13]. HAWK (AM and FM Dxer’s resource) concludes that thunderstormeffects on sporadic E “is a theory that refuses to die” [33]. Dealing with this subject may evenresult in harsh reactions, from professionals (see, e.g., [43]) and from radio amateurs too (see,e.g., [44]).
The authors of this paper were also sceptical and reluctant in accepting any relationship be-tween thunderstorms and sporadic E activity. The weather and thunderstorms on one handand sporadic E on the other hand represent very different geophysical phenomena verticallyseparated by 90 to 100 kilometers in very different regions of the Earth atmosphere. Further-more, we are not aware of any study demonstrating a convincing correlation between the spa-tiotemporal occurrence of thunderstorms and 144 MHz sporadic E dx propagation. From thisperspective, there is little reason to breathe new life in a theory which is supposed to die butrefuses to do so.
In early 2004, one of us (DF5AI) has suggested a data analysis project to compare 144 MHzsporadic data (i.e. dx information from radio amateurs) with sferic observations in meteorology(i.e. burstlike radio emissions from lightnings). This suggestion was motived by two reasons:first, by using the benefits from the internet, radio amateurs may easily access meteorologicaldata and sporadic E reports for data analysis purposes; second, he believed the above theorymay be settled once and for all by demonstrating the failure of correlation between the datasets. CREMER (DL1DBC) has very soon initiated our project team, has implemented appropriatesoftware tools and has managed the legal requirements for accessing commercial weatherdata.
To address the most important question of this paper already here: no, we haven’t found clearevidence for thunderstorm-triggered sporadic E events, i.e. we cannot demonstrate a convinc-ing correlation between 144 MHz dx QSOs and sferic data in the 2004 sporadic E season. Fromthis perspective, we may now contribute to the burial of the theory – we won’t. This does notmean, in no case, we consider thunderstorm effects on 144 MHz sporadic E propagation anexisting phenomenon which still awaits its discovery. However, in the spectrum of arguments,i.e. between yes and no (where we have initially started at the no position), we were forced toconsider a maybe too. In our view, there are more details which need to be examined and clari-fied before closing the case:
• We learnt from scientific resources that thunderstorm effects on the ionosphere are in-deed seriously discussed by atmospheric scientists (see chapter 3.1).
• The GPS/MET radio occultation experiment shows an impressive statistical correlationbetween convection processes in the lower atmosphere and electron density irregulari-ties in the E region of the ionosphere (see chapter 3.3).
• OH nightglow measurements demonstrate the impact of severe thunderstorms on themesosphere in 85 kilometers height (see chapter 3.4). We may therefore speculateabout similar effects on the ionosphere as well.

Thunderstorm effects on sporadic E propagation in 144 MHz Page 4
Volker Grassmann, DF5AISabine Cremer, DL1DBC
Joachim Kraft, DL8HCZUdo Langenohl, DK5YA
Allard Munters, PE1NWLGabriel Sampol, EA6VQ
• We became aware that our current data analysis method must be possibly consideredno appropriate tool, i.e. it has directed our studies in the wrong direction, perhaps.Hence, the above mentioned failure of correlation does not reflect final results becausealternative analysis methods need to be considered too but have not been implementedyet (see chapter 4.5).
• Finally, we have found a striking example of sporadic E and sferic data which stronglymotivates further analyses in this subject (see chapter 4.4).
Thus, we currently do not feel in a position to form final judgement at this stage of investigationand we wonder if somebody can. This paper therefore documents our current understanding,it addresses open questions and it discusses thoughts and ideas to solve the puzzle. We alsowish to encourage fellow radio amateurs to conduct their own studies because we considerthis subject a fascinating element in the world of amateur radio propagation studies.
2 Geophysical background information
2.1 Neutrals, ions and electrons in the ionosphere
Less than a thousandth of the atmospheric constituents are ionized in the ionosphere, i.e. neu-tral particles still dominate the chemical composition even in a fully developed E or F layer. Todistinguish between the neutral and charged particles in the ionosphere, scientists generallyrefer to the neutral gas, the ion gas and the electron gas, respectively (altogether referred toas the ionospheric plasma). The ion gas is strongly coupled to the neutral gas, i.e. bulk motionsof the neutral particles (e.g. high atmospheric winds) also affect the ion motion because ofparticle collisions transfering energy and momentum from the neutrals to the ions. The ions, onthe other hand, drag the electrons by electrostatic forces, i.e. the dynamical behaviour of theions (which are controlled by the neutrals) is also present in the electron gas. This is the rea-son, by the way, why radars may examine neutral particle dynamics in the upper atmosphereby detecting radiowaves scattered by the electrons.
However, the charged particles are also affected by electrostatic fields in the ionosphere andby the Earth magnetic field, i.e. mechanical and electromagnetic forces both control the ion andelectron motion. This leads to a large variety of complex physical effects and phenomena. In theF region of the ionosphere (200 to 400 kilometers), the thin neutral atmosphere results in a smallion-neutral collision frequency, i.e. the ion motion is primarily controlled by electromagneticforces (the so-called E ×B drift) rather than particle collisions. In the E region (90 to 110 kilo-meters), on the other hand, the neutral atmosphere is relatively dense1 resulting in frequent ion-neutral collisions, i.e. the ion motion is very much affected by particle collisions contrary to thesmall electrons which still experience the dominating role of electromagnetic forces. In conse-quence, the ion drift and the electron drift may differ significantly in speed and direction result-ing in charge separation associated with electric fields which again lead to various complex
1 Note that space scientists consider 100 kilometers the height where the Earth atmosphere endsand where space begins. This definition amuses many scientists in ionospheric physics because ofthe high particle density at E layer heights and even above. In fact, the upper atmosphere be-tween, say 100 and 500 kilometers shows a large variety of phenomena (e.g. winds and tides)which wouldn’t exist in a space vacuum and, in consequence, high atmospheric friction preventssatellites from orbiting around Earth at 100 kilometers height.

Thunderstorm effects on sporadic E propagation in 144 MHz Page 5
Volker Grassmann, DF5AISabine Cremer, DL1DBC
Joachim Kraft, DL8HCZUdo Langenohl, DK5YA
Allard Munters, PE1NWLGabriel Sampol, EA6VQ
phenomena in the E region of the ionosphere, e.g. plasma instabilities which may causestrong backscatter of radiowaves.
Referring to the above terms, we may argue that thunderstorm related effects originate in theneutral component of the lower atmosphere (which is an obvious statement because the loweratmosphere shows no ion and electron components similar to the ionosphere). Sporadic E, onthe other hand, represents a phenomenon of the ion and electron gas around 100 and 110 kmheight (the term sporadic E actually denotes short-term enhancements of the ion and electrondensity in the E region of the ionosphere). Discussing the possibility of thunderstorm effects onsporadic E, we may therefore speculate about the existence of two independent mechanisms,i.e.:
• A vertically directed transport process which transports those “thunderstorm effects”(which we need to define more precisely) from the lower into the upper atmosphere,somehow. Because thunderstorms represent a feature of the atmosphere’s neutral gascomponent, we may speculate that the E region signature of thunderstorms is initially visiblein the ionosphere’s neutral gas component only. Thus, the postulated transport processmay be considered an exclusive feature of the neutral atmosphere, we therefore do notneed to take the ions and electrons into consideration here.
• A coupling process which transforms the thunderstorm’s signature in the neutral gas com-ponent into ion and electron density enhancements in order to generate sporadic E layers.This coupling process is effective within the E region of the ionosphere, i.e. we do not needto take large scale transport processes into consideration here (the local neutral, ion andelectron drift will play a dominant role though).
2.2 Wind shear theory
Sporadic E layers contain a considerable amount of long-lived metallic ions (i.e. Fe+ and Mg+
besides O2+ and NO+, the usual dominant ions at E region height) which are transported effi-
ciently by wind fields, e.g. by tides in the upper atmosphere which exist similar to the tides inthe oceans. In fact, the ion motion is very much controlled by the bulk motion of the neutral par-ticles due to ion-neutral collisions as described above. At convergent nulls of the wind speed(see the broken line in Fig. 2.1), the ions may accumulate in dense sporadic E layers. However,convergent nulls (i.e. the height-dependent reversal of the wind speed) must not be consideredthe only wind shear scenario that can create sporadic E layers.
Fig. 2.1. Horizontal wind shear creating a sporadic E layerby wind speed reversal (northern hemisphere). The windfield (green) denotes bulk motions of the neutral particleswhich collide with the positive ions in the E region of theionosphere causing momentum and energy transfer fromthe neutrals to the ions. Being charged particles in a mag-netic field, the ions can only spiral upward or downwardalong the Earth magnetic fieldlines depending on the actualwind direction. Assuming a reversal of the meridional winddirection (wind shear) from south-north to north-southwith descending height, the ions may accumulate in adense sporadic E layer (broken line).

Thunderstorm effects on sporadic E propagation in 144 MHz Page 6
Volker Grassmann, DF5AISabine Cremer, DL1DBC
Joachim Kraft, DL8HCZUdo Langenohl, DK5YA
Allard Munters, PE1NWLGabriel Sampol, EA6VQ
This so-called wind shear theory has been developed by WHITEHEAD (1961), AXFORD (1963)and others and has been featured in many amateur radio articles too, see, e.g., [13]. Becausethe vertical ion velocity is proportional to the cosine of the dip angle (i.e. the inclination of thelocal Earth magnetic fieldlines), it has been argued that the wind shear mechanism is more orless ineffective in polar latitudes where the dip angle is large. It is also ineffective over themagnetic equator where the horizontal magnetic field lines can hardly generate vertical ion dis-placements. The wind shear model therefore appears applicable only in mid-latitudes2 and ishere accepted as one cause of sporadic E layers.
However, with this model there is now a need to explain the origin of metallic ions3 and thecause of wind shears in the E region of the ionosphere. In this paper, we cannot discuss thewind shear model’s benefits and complications in detail but wish to emphasize that even theaccumulation of ions and electrons cannot fully explain the origin of strong backscatter echoesat very high frequencies without taking further considerations into account too (see the dis-cussion further below and a separate paper which will appear on the Amateur Radio Propa-gation Studies webpage [58]).
Nevertheless, the wind shear model can fulfil the requirement of the above mentioned couplingprocess (see chapter 2.1) because it represents a feature of the neutral atmosphere whichcan modify the density distribution of the ions and electrons in the E region of the ionosphere,i.e. neutral particle dynamics is identified a driving element in the generation of sporadic E lay-ers.
Note that the wind shear model is only one of many which all wish to explain the generation ofsporadic E layers. Another model, for example, refers to sporadic neutral layers which werediscovered twenty years ago, i.e. layers of sodium and other chemical species “with a thick-ness between a few hundred meters and several kilometers … in the same height range asionospheric sporadic E” [16]. Those sporadic neutral layers “are undoubtedly related to spo-radic E although, at a given location and time, the presence of one does not necessitate theexistence of the other” [16]. These layers also appear associated with atmospheric waveswhich indeed play an important role in the lower and upper atmosphere.
2.3 Wave phenomena in the Earth atmosphere
Smooth ripples on the sea surface, giant waves breaking on the shore, tsunamis travelling athigh speed and slowly varying oscillations of global wavelength (i.e. tides) all represent wavephenomena in the oceans. Note that all this waves show different properties and features, arecreated by different mechanisms, are affected by different parameters and, finally, are de-scribed by different mathematical models. Thus, we are not facing the same type of waves atdifferent scale lengths but we are facing waves of different characteristics and of differentphysical nature – in fact, we may find a large variety of wave phenomena in the oceans.
The Earth atmosphere is often referred to as the atmospheric ocean, it shows a variety ofphenomena which do not exist in the real ocean though (e.g. charge separation in the iono-sphere), we may nevertheless find a large variety of wave phenomena in the atmosphere too.We all know, for example, short wavelength pressure oscillations propagating in the air, i.e.acoustic waves which represent an example of the so-called internal waves.
2 Recent analyses however indicate the model’s relevance also in polar latitudes, see [34].3 The presence of metal ions in the E region of the ionosphere is interpreted, for example, by mete-orits and cometary material deposited in the Earth’s upper atmosphere, see, e.g., [14].
Thunderstorm effects on sporadic E propagation in 144 MHz Page 7
Volker Grassmann, DF5AISabine Cremer, DL1DBC
Joachim Kraft, DL8HCZUdo Langenohl, DK5YA
Allard Munters, PE1NWLGabriel Sampol, EA6VQ
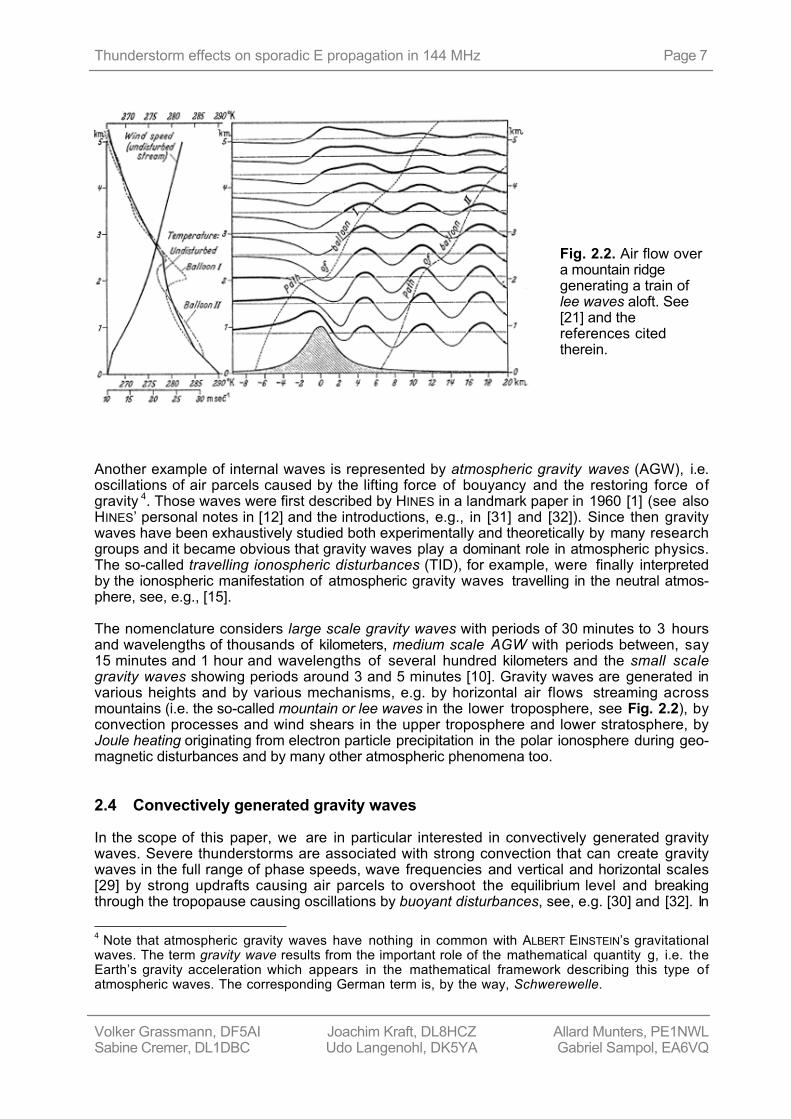
Fig. 2.2. Air flow overa mountain ridgegenerating a train oflee waves aloft. See[21] and thereferences citedtherein.
Another example of internal waves is represented by atmospheric gravity waves (AGW), i.e.oscillations of air parcels caused by the lifting force of bouyancy and the restoring force ofgravity 4. Those waves were first described by HINES in a landmark paper in 1960 [1] (see alsoHINES’ personal notes in [12] and the introductions, e.g., in [31] and [32]). Since then gravitywaves have been exhaustively studied both experimentally and theoretically by many researchgroups and it became obvious that gravity waves play a dominant role in atmospheric physics.The so-called travelling ionospheric disturbances (TID), for example, were finally interpretedby the ionospheric manifestation of atmospheric gravity waves travelling in the neutral atmos-phere, see, e.g., [15].
The nomenclature considers large scale gravity waves with periods of 30 minutes to 3 hoursand wavelengths of thousands of kilometers, medium scale AGW with periods between, say15 minutes and 1 hour and wavelengths of several hundred kilometers and the small scalegravity waves showing periods around 3 and 5 minutes [10]. Gravity waves are generated invarious heights and by various mechanisms, e.g. by horizontal air flows streaming acrossmountains (i.e. the so-called mountain or lee waves in the lower troposphere, see Fig. 2.2), byconvection processes and wind shears in the upper troposphere and lower stratosphere, byJoule heating originating from electron particle precipitation in the polar ionosphere during geo-magnetic disturbances and by many other atmospheric phenomena too.
2.4 Convectively generated gravity waves
In the scope of this paper, we are in particular interested in convectively generated gravitywaves. Severe thunderstorms are associated with strong convection that can create gravitywaves in the full range of phase speeds, wave frequencies and vertical and horizontal scales[29] by strong updrafts causing air parcels to overshoot the equilibrium level and breakingthrough the tropopause causing oscillations by buoyant disturbances, see, e.g. [30] and [32]. In
4 Note that atmospheric gravity waves have nothing in common with ALBERT EINSTEIN’s gravitationalwaves. The term gravity wave results from the important role of the mathematical quantity g, i.e. theEarth’s gravity acceleration which appears in the mathematical framework describing this type ofatmospheric waves. The corresponding German term is, by the way, Schwerewelle.
Thunderstorm effects on sporadic E propagation in 144 MHz Page 8
Volker Grassmann, DF5AISabine Cremer, DL1DBC
Joachim Kraft, DL8HCZUdo Langenohl, DK5YA
Allard Munters, PE1NWLGabriel Sampol, EA6VQ
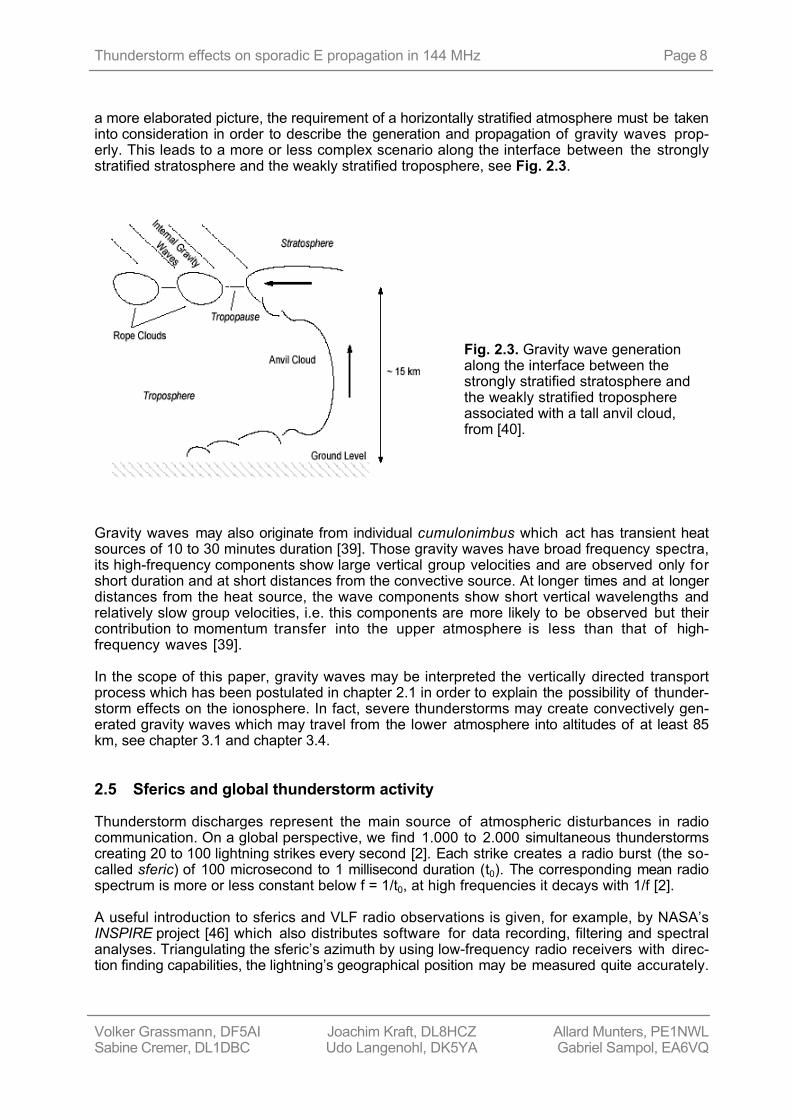
a more elaborated picture, the requirement of a horizontally stratified atmosphere must be takeninto consideration in order to describe the generation and propagation of gravity waves prop-erly. This leads to a more or less complex scenario along the interface between the stronglystratified stratosphere and the weakly stratified troposphere, see Fig. 2.3.
Fig. 2.3. Gravity wave generationalong the interface between thestrongly stratified stratosphere andthe weakly stratified troposphereassociated with a tall anvil cloud,from [40].
Gravity waves may also originate from individual cumulonimbus which act has transient heatsources of 10 to 30 minutes duration [39]. Those gravity waves have broad frequency spectra,its high-frequency components show large vertical group velocities and are observed only forshort duration and at short distances from the convective source. At longer times and at longerdistances from the heat source, the wave components show short vertical wavelengths andrelatively slow group velocities, i.e. this components are more likely to be observed but theircontribution to momentum transfer into the upper atmosphere is less than that of high-frequency waves [39].
In the scope of this paper, gravity waves may be interpreted the vertically directed transportprocess which has been postulated in chapter 2.1 in order to explain the possibility of thunder-storm effects on the ionosphere. In fact, severe thunderstorms may create convectively gen-erated gravity waves which may travel from the lower atmosphere into altitudes of at least 85km, see chapter 3.1 and chapter 3.4.
2.5 Sferics and global thunderstorm activity
Thunderstorm discharges represent the main source of atmospheric disturbances in radiocommunication. On a global perspective, we find 1.000 to 2.000 simultaneous thunderstormscreating 20 to 100 lightning strikes every second [2]. Each strike creates a radio burst (the so-called sferic) of 100 microsecond to 1 millisecond duration (t0). The corresponding mean radiospectrum is more or less constant below f = 1/t0, at high frequencies it decays with 1/f [2].
A useful introduction to sferics and VLF radio observations is given, for example, by NASA’sINSPIRE project [46] which also distributes software for data recording, filtering and spectralanalyses. Triangulating the sferic’s azimuth by using low-frequency radio receivers with direc-tion finding capabilities, the lightning’s geographical position may be measured quite accurately.
Thunderstorm effects on sporadic E propagation in 144 MHz Page 9
Volker Grassmann, DF5AISabine Cremer, DL1DBC
Joachim Kraft, DL8HCZUdo Langenohl, DK5YA
Allard Munters, PE1NWLGabriel Sampol, EA6VQ
This information is used, for example, by insurance companies, meteorologists and by geo-physicists studying dynamical processes in the atmosphere.
Fig. 2.4. Audio spectrum (zero to 10 kHz) oflow-frequency radio bursts emitted by lightnings(sferics). Each of the vertical lines denotes alightning stroke within a distance of a few hun-dred to one thousand kilometers from the radiosensor. Adopted from [46].
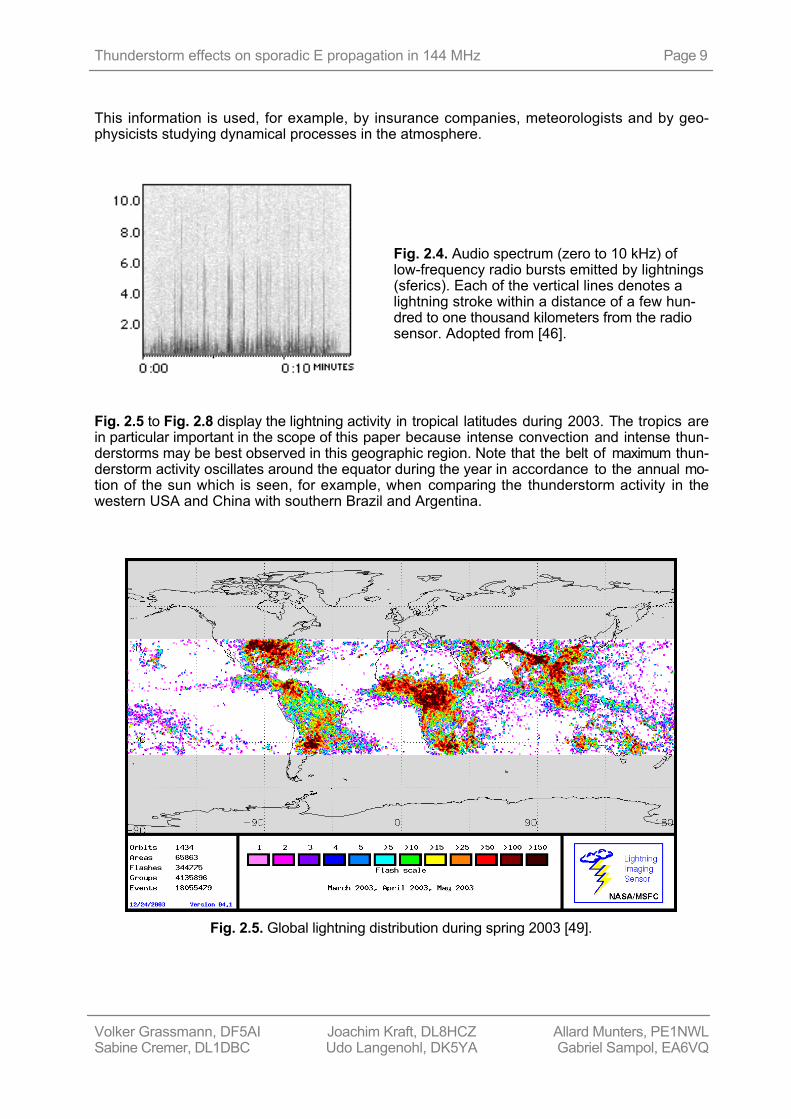
Fig. 2.5 to Fig. 2.8 display the lightning activity in tropical latitudes during 2003. The tropics arein particular important in the scope of this paper because intense convection and intense thun-derstorms may be best observed in this geographic region. Note that the belt of maximum thun-derstorm activity oscillates around the equator during the year in accordance to the annual mo-tion of the sun which is seen, for example, when comparing the thunderstorm activity in thewestern USA and China with southern Brazil and Argentina.
Fig. 2.5. Global lightning distribution during spring 2003 [49].

Thunderstorm effects on sporadic E propagation in 144 MHz Page 10
Volker Grassmann, DF5AISabine Cremer, DL1DBC
Joachim Kraft, DL8HCZUdo Langenohl, DK5YA
Allard Munters, PE1NWLGabriel Sampol, EA6VQ
Fig. 2.6. Global lightning distribution during summer 2003 [49].
Fig. 2.7. Global lightning distribution during fall 2003 [49].

Thunderstorm effects on sporadic E propagation in 144 MHz Page 11
Volker Grassmann, DF5AISabine Cremer, DL1DBC
Joachim Kraft, DL8HCZUdo Langenohl, DK5YA
Allard Munters, PE1NWLGabriel Sampol, EA6VQ
Fig. 2.8. Global lightning distribution during winter 2003 [49].
2.6 Seasonal and latitudinal variations of sporadic E
In paragraph 3.3 we will discuss the GPS/MET radio occultation experiment which can detectlayered structures in the upper atmosphere with horizontal scales of around 100 km and verti-cal scales of a few hundred meters at the Earth’s limb [28]. This experiment can therefore pro-vide information on the vertical structure of sporadic E and its seasonal variation. Fig. 2.9 toFig. 2.11 display the vertical distribution of electron density irregularities which are considereda measure for sporadic E occurrence.
Fig. 2.9. Sporadic E occurrence for June 19 to July 10, 1995, from [28].

Thunderstorm effects on sporadic E propagation in 144 MHz Page 12
Volker Grassmann, DF5AISabine Cremer, DL1DBC
Joachim Kraft, DL8HCZUdo Langenohl, DK5YA
Allard Munters, PE1NWLGabriel Sampol, EA6VQ
Fig. 2.10. Sporadic E occurrence for October 10-25, 1995, from [28].
Fig. 2.11. Sporadic E occurrence for Febuary 2-16, 1997, from [28].
Fig. 2.9 displays the data from June/July 1995 with a band of sporadic E activity between 30°southern latitude and 60° northern latitude. The sporadic E height varies between, say 95 and105 km including intermediate layers separated by around 6 km which are best seen between0° and 30° northern latitude. HOCKE et al. [28] interpret this feature by the signature of “the ver-tical wavelength of the atmospheric waves forming these ionization layers.” Note also the lay-ers occurring at high geographic latitudes which are interpreted by Polar Mesopheric SummerEchoes (PSME) [28]. By comparing Fig. 2.9 (June/July) to Fig. 2.10 (October) and Fig. 2.11(February), we can see the sporadic E activity moving from northern to southern latitudes dur-ing the year similar to the latitudinal variation observed in thunderstorm activity.

Thunderstorm effects on sporadic E propagation in 144 MHz Page 13
Volker Grassmann, DF5AISabine Cremer, DL1DBC
Joachim Kraft, DL8HCZUdo Langenohl, DK5YA
Allard Munters, PE1NWLGabriel Sampol, EA6VQ
3 Possible model of thunderstorm effects on sporadic E
3.1 Assembling the puzzle
The above details represent pieces of a puzzle which may be assembled to a quite complicatedmodel of thunderstorm effects on the ionosphere. The model has been discussed in scientificliterature (unfortunately, we couldn’t identify the original source though) and even in ham radio,see, e.g., [13]. Fig. 3.1 is an attempt at visualizing the scenario which links sporadic E activity inthe ionosphere to lower atmosphere dynamics. There is perhaps reason not to be fully happywith this schematic diagram but it may demonstrate the principle idea behind the model.
Fig. 3.1. Schematic dia-gram displaying the pos-sible link between loweratmospheric dynamicsand the generation ofsporadic E in the iono-sphere.
Intense atmospheric convection breaking the tropopause (which separates the tropospherefrom the stratosphere) is considered the driving element in the generation of those type ofgravity waves which in particular attract our interest, i.e. convectively generated gravitywaves. These gravity waves may propagate from the lower stratosphere into the mesosphere(this feature is verified by observation, see chapter 3.4) and may even arrive at E region levelaround 100 kilometers height (which appears verified by statistical analyses, see chapter 3.3).Representing an oscillatory perturbation of the neutral wind field, the gravity waves may sup-
Thunderstorm effects on sporadic E propagation in 144 MHz Page 14
Volker Grassmann, DF5AISabine Cremer, DL1DBC
Joachim Kraft, DL8HCZUdo Langenohl, DK5YA
Allard Munters, PE1NWLGabriel Sampol, EA6VQ
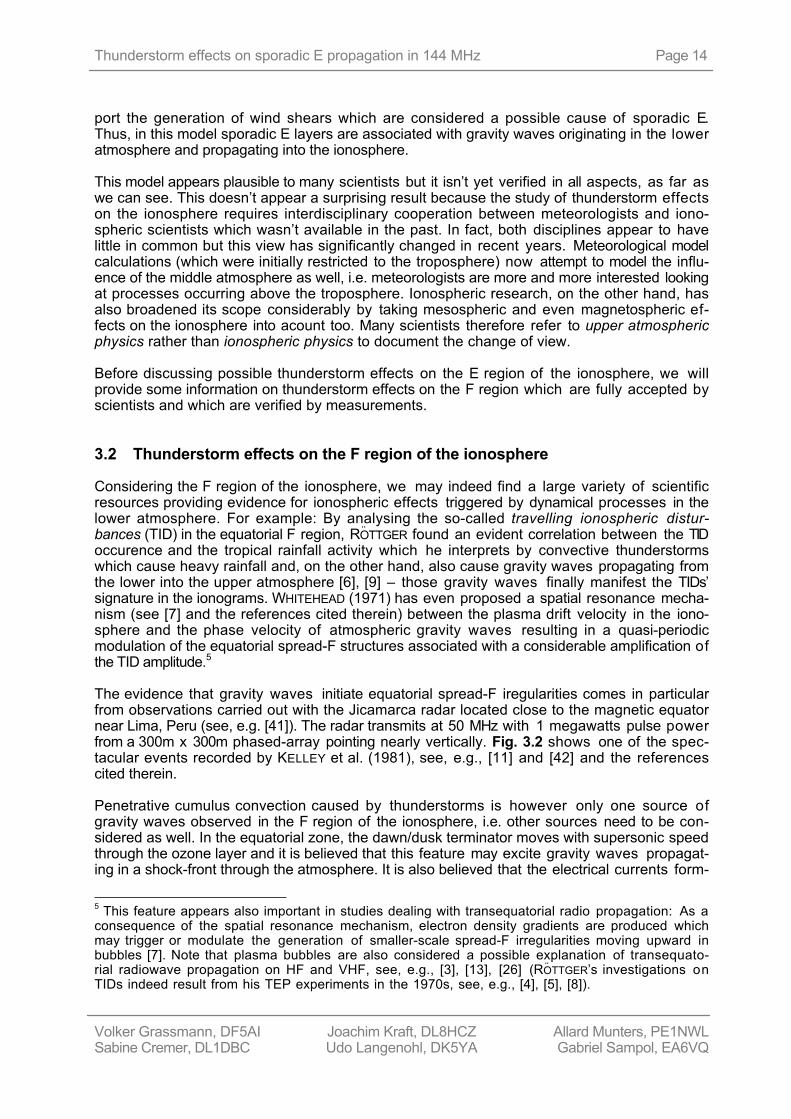
port the generation of wind shears which are considered a possible cause of sporadic E.Thus, in this model sporadic E layers are associated with gravity waves originating in the loweratmosphere and propagating into the ionosphere.
This model appears plausible to many scientists but it isn’t yet verified in all aspects, as far aswe can see. This doesn’t appear a surprising result because the study of thunderstorm effectson the ionosphere requires interdisciplinary cooperation between meteorologists and iono-spheric scientists which wasn’t available in the past. In fact, both disciplines appear to havelittle in common but this view has significantly changed in recent years. Meteorological modelcalculations (which were initially restricted to the troposphere) now attempt to model the influ-ence of the middle atmosphere as well, i.e. meteorologists are more and more interested lookingat processes occurring above the troposphere. Ionospheric research, on the other hand, hasalso broadened its scope considerably by taking mesospheric and even magnetospheric ef-fects on the ionosphere into acount too. Many scientists therefore refer to upper atmosphericphysics rather than ionospheric physics to document the change of view.
Before discussing possible thunderstorm effects on the E region of the ionosphere, we willprovide some information on thunderstorm effects on the F region which are fully accepted byscientists and which are verified by measurements.
3.2 Thunderstorm effects on the F region of the ionosphere
Considering the F region of the ionosphere, we may indeed find a large variety of scientificresources providing evidence for ionospheric effects triggered by dynamical processes in thelower atmosphere. For example: By analysing the so-called travelling ionospheric distur-bances (TID) in the equatorial F region, RÖTTGER found an evident correlation between the TIDoccurence and the tropical rainfall activity which he interprets by convective thunderstormswhich cause heavy rainfall and, on the other hand, also cause gravity waves propagating fromthe lower into the upper atmosphere [6], [9] – those gravity waves finally manifest the TIDs’signature in the ionograms. WHITEHEAD (1971) has even proposed a spatial resonance mecha-nism (see [7] and the references cited therein) between the plasma drift velocity in the iono-sphere and the phase velocity of atmospheric gravity waves resulting in a quasi-periodicmodulation of the equatorial spread-F structures associated with a considerable amplification ofthe TID amplitude.5
The evidence that gravity waves initiate equatorial spread-F iregularities comes in particularfrom observations carried out with the Jicamarca radar located close to the magnetic equatornear Lima, Peru (see, e.g. [41]). The radar transmits at 50 MHz with 1 megawatts pulse powerfrom a 300m x 300m phased-array pointing nearly vertically. Fig. 3.2 shows one of the spec-tacular events recorded by KELLEY et al. (1981), see, e.g., [11] and [42] and the referencescited therein.
Penetrative cumulus convection caused by thunderstorms is however only one source ofgravity waves observed in the F region of the ionosphere, i.e. other sources need to be con-sidered as well. In the equatorial zone, the dawn/dusk terminator moves with supersonic speedthrough the ozone layer and it is believed that this feature may excite gravity waves propagat-ing in a shock-front through the atmosphere. It is also believed that the electrical currents form-
5 This feature appears also important in studies dealing with transequatorial radio propagation: As aconsequence of the spatial resonance mechanism, electron density gradients are produced whichmay trigger or modulate the generation of smaller-scale spread-F irregularities moving upward inbubbles [7]. Note that plasma bubbles are also considered a possible explanation of transequato-rial radiowave propagation on HF and VHF, see, e.g., [3], [13], [26] (RÖTTGER’s investigations onTIDs indeed result from his TEP experiments in the 1970s, see, e.g., [4], [5], [8]).

Thunderstorm effects on sporadic E propagation in 144 MHz Page 15
Volker Grassmann, DF5AISabine Cremer, DL1DBC
Joachim Kraft, DL8HCZUdo Langenohl, DK5YA
Allard Munters, PE1NWLGabriel Sampol, EA6VQ
ing the equatorial electrojet (EEJ) may also generate gravity waves due to Joule heating andLorentz forces. The non-linear breaking of atmospheric tides is also considered a possiblesource of gravity waves and other sources have been discussed as well. In [6], all this possi-ble sources are analysed in order to explain the above mentioned correlation between the TIDoccurence and the tropical rainfall activity together with the fact that the majority of TIDs appearto originate from the tropical rain forest located north of the HF radar system which was usedin the TID measurements (all this measurements were carried out in Huancayo, Peru). RÖTTGERfinally considers penetrative cumulus convection as the most probable source of the medium-scale TIDs observed in the equatorial regions [6].
Fig. 3.2. Radar map showing echo traces due to backscatter from equatorial spread-F irregu-larities at altitudes higher than 200 kilometers, from [42].
In fact, F region effects caused by convectively generated gravity waves have been investi-gated theoretically and experimentally and represent a generally accepted phenomenon in up-per atmosphere physics. Compared to F region studies, the amount of scientific resourcesdealing with thunderstorm effects on the E region of the ionosphere is however much smallerbut, nevertheless, some scientific resources are indeed available, see, e.g., [6] and the refer-ences cited therein.6
From this perspective, the model discussed in paragraph 3.1 does not appear revolutionary atall – with one exception though: all the scientific scenarios consider the tropical atmospherebecause severe thunderstorms are best observed in this part of the world. The above modelhowever adopts this results in order to explain sporadic E events in mid-latitudes. Thus, if radioamateurs can document thunderstorm effects on mid-latitude sporadic E (the June 27, 2004event may lead in this direction, see paragraph 4.4), ham radio may indeed contribute to iono-spheric research.
In the following paragraphs, examples of scientific results are given relevant to the E region ofthe ionosphere and to the mesosphere underneath, i.e. the GPS/MET radio occultation experi- 6 RÖTTGER in particular cites studies from DATTA (1971) but, unfortunately, we couldn’t access thisdocument (Ind. J. Pure Appl. Phys., 9, 394, 1971) which apparently provides some indication ofthunderstorm-triggered sporadic E events in the tropical atmosphere.

Thunderstorm effects on sporadic E propagation in 144 MHz Page 16
Volker Grassmann, DF5AISabine Cremer, DL1DBC
Joachim Kraft, DL8HCZUdo Langenohl, DK5YA
Allard Munters, PE1NWLGabriel Sampol, EA6VQ
ment and optical observation of gravity waves associated with a severe thunderstorm. Inchapter 3.5 we will examine the differences between the scientific approach and the radioamateur’s perspective in this subject.
3.3 Example 1: E region irregularities over tropical convection zones
3.3.1 The GPS/MET radio occultation experiment
Similar to radio occulation experiments for studying planetary atmospheres in radio astronomy,the GPS/MET program uses the 24 satellites of the Global Positioning System (GPS) for activeremote sensing of the Earth atmosphere. A receiver aboard of a Low Earth Orbit (LEO) satellitetracks the 1575.42 MHz and 1227.6 MHz radio signals originating from GPS satellites occultedby the Earth atmosphere, i.e. the GPS signals travel through the dense layers of the atmos-phere along a tangent to the Earth’s surface. The LEO satellite can observe more than 500 radiooccultations per day which provide information on the vertical structure of the Earth atmos-phere in various geographical regions of the world (more information on this experiment isavailable on the GPS/MET web site [47]).
3.3.2 Analysis of the Febuary 1997 prime-time data
HOCKE and TSUDA [27] have analysed GPS/MET observations of the tropical atmosphere duringFebruary 1997, i.e. during the so-called prime-time where the encryption of the GPS signals(antispoofing) was turned off to support best data quality. The results are considered relevantto this paper because intense solar radiation in the tropics cause strong cumulous convectionswhich excite various atmospheric waves, atmospheric tides and gravity waves transportingenergy and momentum from the lower into the upper atmosphere [37].
Fig. 3.3 displays the GPS/MET results summarized over ten days between 5° and 25° southernlatitude as a function of geographical longitude. The lower panel (e) shows the number of oc-culation events analysed. Panel d displays the Earth surface topography, i.e. the black peakscorrespond to high mountains in Brazil (80° W), Africa (40° E) and Indonesia (120° E), respec-tively. Curve c denotes the average water vapor pressure in the troposphere between 4 and 6km altitude. Note that water vapor clouds at higher tropospheric altitudes indicate an increaseof tropical convection, i.e. this panel provides a measure of the intensity of tropical convectionand convectively generated gravity waves. Panel b shows the relative temperature variance
∆T T( )2 in the stratosphere where the solid and dotted line refer to the height of 22-28 km and
32-38 km, respectively. These curves may be considered a measure for gravity wave activitymodulating the stratosphere’s background temperature. Finally, the maximum of the small-scalefluctuation amplitude (vertical scale less than 7 km) of electron density between 80 and 120 kmaltitude is displayed in panel a.
The results provide an impressive indication of E region irregularities correlating with dynamicprocesses in the lower atmosphere. The high correlation between the data curves may be in-terpreted by enhanced gravity wave activity in the lower stratosphere (22-28km, see the solidline in panel b) associated to areas of strong tropical convection in the troposphere (4-6 km,see panel c). The correlation between gravity waves (panel b) and E region irregularities (panela) suggests “convergence of electron density occuring due to the wind shear, associated withgravity waves and geomagnetic effects” [37].

Thunderstorm effects on sporadic E propagation in 144 MHz Page 17
Volker Grassmann, DF5AISabine Cremer, DL1DBC
Joachim Kraft, DL8HCZUdo Langenohl, DK5YA
Allard Munters, PE1NWLGabriel Sampol, EA6VQ
Fig. 3.3. Various pa-rameters of the south-ern tropics as a functionof geographical longi-tude during GPS/METprime-time in February1997, from [27]. See textfor more details.
However, referring to the dotted line in panel b, we find little gravity wave activity in 32-38 kmaltitude and the correlation with all the other curves is rather low, in fact. Similar changes, bythe way, are also reported from GPS/MET data observed at northern mid-latitudes, i.e. highgravity wave activity in the lower stratosphere around 25 km altitude but low activity around 35km [36]. In [27], this feature is considered an indication of gravity waves created by tropo-spheric rather than stratospheric sources which raises an important question in our view: at-tributing the generation of sporadic E to gravity waves travelling from the troposphere (or, al-ternatively, from the lower stratosphere) into the E region of the ionosphere, we would expectdetection of gravity waves at all intermediate heights which is evidently not the case here.Thus, gravity wave activity around 25 km height shows correlation with E region irregulartiesbut gravity wave activity around 35 km doesn’t – this feature is difficult to understand in ourview (in chapter 3.3.5 we will discuss more open questions in the interpretation of theGPS/MET data). However, GPS/MET data can also provide data examples in which sporadic Eis clearly correlated with gravity wave activity in the lower and in the upper stratosphere aswell (see, e.g., figure 7 in [37]).
3.3.3 Orographic effects
Another important feature of the GPS/MET data addresses the generation of sporadic E associ-ated with orographic features, i.e. high mountains acting as obstacles in the low atmosphericair flow. The distribution of gravity wave activity (see panel b in Fig. 3.3) shows in particularmaxima over mountain ridges (see panel d and also figure 7 in [37]) which suggests “wavegeneration by the interaction of surface wind with topographical obstacles” [36]. However, the

Thunderstorm effects on sporadic E propagation in 144 MHz Page 18
Volker Grassmann, DF5AISabine Cremer, DL1DBC
Joachim Kraft, DL8HCZUdo Langenohl, DK5YA
Allard Munters, PE1NWLGabriel Sampol, EA6VQ
results communicated in [36] (which are not shown here), also mentions significant gravitywave activity in the lower stratosphere over the Atlantic Ocean and Eurasia which cannot beexplained by orographic effects, obviously (see also the discussion in chapter 3.3.5).
Radio amateurs have also discussed the geographical correlation between sporadic E and highmountains but were forced to accept that orographic effects can hardly explain the geographi-cal distribution of sporadic E in Europe, see, e.g. [13]. GRAYER, G3NAQ, therefore concludesthat the effect of mountains on the generation of sporadic E – assuming it would exist – is“clearly rather small” [13]. Thus, GPS/MET data and amateur radio observations provide thesame inconsistent picture, i.e. examples in which sporadic E appears correlated to mountainridges and, on the other hand, counter-examples which do not support this assumption at all.
3.3.4 Geographical distribution of E region irregularities
Fig. 3.4 shows a summary of electron density irregularities in the lower ionosphere observedby GPS/MET in 1995 and 1997 (compare to Fig. 2.9 to Fig. 2.11 on page 11 and 12, respec-tively). Note, in particular, the observations over southern Spain and north-western Africa.Unfortunately, no data is available showing all the parameters similar to Fig. 3.3, i.e. we cannotcompare the sporadic E activity in Fig. 3.4 neither with water vapor pressure data in the tropo-sphere nor with temperature variances in the stratosphere.
Fig. 3.4. Electron density irregulari-ties observed by GPS/MET [37].Each dot indicates a radio occulta-tion event, its radius denotes thecorresponding electron density en-hancement at 105-110 km height.Red dots are observed in June/July1995, green dots are in October1995 and blue dots are in February1997. The gray band comprises thedata apparently used in Fig. 3.3.
3.3.5 Comments
The data displayed in Fig. 3.3 is apparently identical to the blue dots located in the gray band ofFig. 3.4 because both figures refer to prime-time data from February 1997. Thus, we may com-pare the data within the gray band of Fig. 3.4 to the features displayed in Fig. 3.3. Doing so,we are facing a couple of questions which we currently cannot solve at all.
• We would expect, for example, full consistency between Fig. 3.3 and Fig. 3.4 with respectto the longitudinal distribution of electron density irregularities, i.e. between the peaks of thequantity max ∆ne( ) in panel a of Fig. 3.3 and the horizontal distribution and size of the bluedots within the gray band of Fig. 3.4, respectively. However, no such conformance be-comes visible to us in the data.
Thunderstorm effects on sporadic E propagation in 144 MHz Page 19
Volker Grassmann, DF5AISabine Cremer, DL1DBC
Joachim Kraft, DL8HCZUdo Langenohl, DK5YA
Allard Munters, PE1NWLGabriel Sampol, EA6VQ
• The same is true when considering the orographic features suggested by panel d in Fig.3.3 because we cannot identify appropriate counterparts in Fig. 3.4, i.e. the blue dots donot appear accumulated in geographical regions in which high mountains exist.
• Furthermore, in accordance to Fig. 3.4 the most intense electron density irregularities arefound around the southern tip of South America which does not indicate any special im-portance of high mountains (e.g. the Andes) contrary to panel d in Fig. 3.3. In our view, themassive concentration of blue dots around Tierra del Fuego (50° southern latitude) simplyreflects the high season of sporadic E occurrence in the southern hemisphere around Feb-ruary.
• In fact, considering all data in Fig. 3.4, the distribution of data points seems to reflect theknown latitudinal variance of sporadic E during the year without showing centers of activityin the tropical regions which, in our view, is inconsistent with the results shown in Fig. 3.3.
Thus, words of caution appear justified to prevent incorrect conclusions because we currentlycannot understand Fig. 3.3 together with Fig. 3.4. In our view, tropospheric convection and, inconsequence, gravity waves may indeed play an important role in the generation of sporadic E(which is supported by the impressive results shown in Fig. 3.3) but, on the other hand, w eare reluctant to interpret all sporadic E occurrences by gravity waves without considering al-ternative mechanisms and processes too (which appears supported by Fig. 3.4, in our view).
It is also worth to mention that the term sporadic E is used synonymous for electron densityirregularities and vice versa in [27] but it is doubtful that the quantity max ∆ne( ) indeed pro-vides a direct measure of sporadic E activity as described by 144 MHz radio amateurs. Note
that the maximum amplitude of max ∆ne( ) is less than 80 ⋅109m−3, see panel a in Fig. 3.3,which corresponds to only one hundredth, or so, of the total electron density in a fully devel-oped E layer insufficient to explain sporadic E propagation on very high frequencies. In [28], theterm sporadic E is considered “a name convention in the science community which does not fitto the thin ionization layers observed in the D, E and F1 regions” – this statement indeed indi-cates that the term sporadic E does not address identical subjects when applied in GPS/METdata and in amateur radio, respectively.
We also got the impression that the analysis and geophysical interpretation of the GPS/METresults is still a matter of dynamical development and improvement (see, e.g., [48]). However, itis generally accepted that radio occultation experiments indeed bear high potential not only inthe understanding of the weather and the Earth climate but also in studying atmospheric wavephenomena and processes affecting the upper atmosphere [25]. In the scope of this paper itmeans: we do not consider the GPS/MET data clear evidence for sporadic E dx propagationgenerated by thunderstorms but a valuable indication which motivates further analyses in thissubject.
3.4 Example 2: Thunderstorms generating sprites and gravity waves
In around 85 kilometers height, we may find the OH nightglow layer created by vibrationallyexcited hydroxyl (OH) in the nighttime mesosphere as a result of a series of chemiluminescentreactions between odd oxygen and odd hydrogen species [38]. Gravity waves may modulatethis infrared airglow in the night sky by generating ripples in the airglow distribution. Thus, byusing suitable CCD cameras (see, e.g. [23] and [24]), the signature of gravity waves may beobserved even by optical instruments. In this paragraph, we will discuss a spectacular eventdocumented by the University of Alaska when studying a severe thunderstorm over Nebraskaon August 18, 1999.

Thunderstorm effects on sporadic E propagation in 144 MHz Page 20
Volker Grassmann, DF5AISabine Cremer, DL1DBC
Joachim Kraft, DL8HCZUdo Langenohl, DK5YA
Allard Munters, PE1NWLGabriel Sampol, EA6VQ
Fig. 3.5. Concentric ripples observed in OH airglow caused by thunderstorm triggered gravitywaves propagating vertically to a height around 85 km. The sprite on the main page was also
recorded by a separate CCD camera as shown in the inlet. [38]
As part of a scientific campaign, SENTMAN et al. performed OH airglow observations at a U. S.Forest Service fire observation tower on Bear Mt., South Dakota. In this particular night, a veryintense thunderstorm moved from south-central Nebraska to eastern Nebraska/Iowa along astorm track perpendicular to the observation line of sight. Fig. 3.5 shows one of the CCD im-ages displaying the night sky above the city lights of Custer (note also the display lights of theCrazy Horse Monument in the lower left corner). The inlet shows a large sprite in high resolu-tion, i.e. one of this recently discovered lightning discharges extending from the lower atmos-phere into high altitudes at 50 to 90 kilometers (see, e.g. [17] and the references cited therein).The hazy elliptical feature in the lower central part displays the rippled signature of a gravitywave modulating the OH airglow. Analysing the full video sequence, “these elliptical featuresexhibit a distinctive outward propagation pattern originating from a well defined center” [38].Mapping this features onto the horizontal plane and comparing the findings to the correspondingGOES weather map of the Nebraska storm, SENTMAN et al. found strong correlation betweenthis gravity wave and the underlying thunderstorm [38].
Contrary to the GPS/MET data which reflects statistical results, this is an example of an explicitthunderstorm event (lower atmosphere) that causes gravity waves in the middle atmosphere ina height around 85 kilometers. This example demonstrates in particular that thunderstorm ef-fects must not be considered restricted to the troposphere and stratosphere but may also af-fect higher altitudes more or less close to the E region of the ionosphere.

Thunderstorm effects on sporadic E propagation in 144 MHz Page 21
Volker Grassmann, DF5AISabine Cremer, DL1DBC
Joachim Kraft, DL8HCZUdo Langenohl, DK5YA
Allard Munters, PE1NWLGabriel Sampol, EA6VQ
3.5 Scientific investigations versus ham radio studies
How do the speculations on thunderstorm effects on 144 MHz sporadic E propagation relate tothe scientific results discussed above? First of all, we need to clarify the meaning of the termsthunderstorm effects and 144 MHz sporadic E, respectively. From our perspective, the actualmeaning of the term thunderstorm effects remains more or less unclear in ham radio discus-sions, i.e. all this speculations do not specify what property may actually support the genera-tion of sporadic E. In fact, many radio amateurs seem to consider lightnings the driving force inthe generation of sporadic E. This assumption is certainly not justified and has possibly contrib-uted to the many sceptical comments on thunderstorm effects on 144 MHz sporadic E propaga-tion. We may also find speculations considering those sprites and jets a possible trigger in thegeneration of sporadic E but all this recently dicovered phenomena (see, e.g., [17] and the ref-erences cited therein) do not yet allow far-ranging conclusions at this early stage of investiga-tion.
We are willing to admit that even our project’s working title is perhaps misleading becausethunderstorms do certainly not affect sporadic E layers directly. All what we may expect is theabove mentioned chain of cause and effects (see chapter 3.1) with thunderstorms at one endand sporadic E dx propagation at the other end of the chain and a large variety of geophysicalphenomena in between. Thus, thunderstorms may only be considered a tracer indicating dy-namical processes in the lower atmosphere which may initiate a sequence of atmospheric ef-fects that may possibly lead to sporadic E layers.
The term sporadic E needs to be clarified as well. In the GPS/MET data and in ham radio, theterm sporadic E apparently denotes different subjects, i.e. E region irregularities on one handand 144 MHz long distance communication on the other hand (see the discussion in chapter3.3.5). It is important to note that electron density irregularities in the E region of the ionospheredo not necessarily support forward scatter of radio waves on very high frequencies. Also, thepresence of a sporadic E layer (i.e. enhanced electron density around 105 km) does not nec-essarily indicate the availability of sporadic E dx QSOs in VHF.
In fact, forward scatter of VHF radio waves must not be considered identical to ionosphericskip propagation similar to short radio waves below 30 MHz because such high electron den-sity does not exist in the Earth’s ionosphere. 144 MHz sporadic E QSOs are associated withcomplicated plasmaphysical processes which create various wave phenomena in the E regionof the ionosphere capable to support coherent scatter of VHF radio waves at high fieldstrengths. Contrary to the simple model of radio waves reflected by an ionized media (whichapplies in short wave propagation), electrostatic fields in the E region, the Earth magnetic fieldand, in particular, the drift motion of the electrons and ions and particle collisions need to be con-sidered in order to explain this scatter mode properly.
Considering the scientific material from above in the scope of this paper, we must thereforeconclude that scientists and VHF radio amateurs are discussing similar but no identical sub-jects. Hence, the scientific material can provide valuable information but cannot prove what w eare looking for, i.e. a possible link between thunderstorm activity and long distance QSOs in 144MHz. Fig. 3.6 makes an attempt at integrating the scientific results and ham radio speculationsin a framework. The yellow area denotes the scientific model already discussed in Fig. 3.1, i.e.it shows the possible link between dynamical processes in the lower atmosphere and the gen-eration of sporadic E irregularities. The green area, on the other hand, considers those addi-tional topics which were introduced by VHF radio amateurs, i.e. 144 MHz sporadic E and sfericactivity, respectively. This additional elements are attached to both ends of the scientific modelwhich we have called chain of cause and effects in chapter 3.1. Although this chain of causeand effects isn’t yet verified in all aspects, radio amateurs apparently wish to extend this chainbeyond its original limits.

Thunderstorm effects on sporadic E propagation in 144 MHz Page 22
Volker Grassmann, DF5AISabine Cremer, DL1DBC
Joachim Kraft, DL8HCZUdo Langenohl, DK5YA
Allard Munters, PE1NWLGabriel Sampol, EA6VQ
Fig. 3.6. Schematic dia-gram visualizing theradio amateur’s ap-proach to thunderstormeffects on ionosphericsporadic E. The yellowarea denotes the scien-tific model, the greenarea denotes additionalelements discussed byradio amateurs.
Fig. 3.6 may in particular indicate the principle difference between the scientific approach andham radio studies: scientific instruments can investigate each individual chain link, may compareadjacent links and may analyse the entire chain of cause and effects systematically. Radioamateurs, on the other hand, can only address both ends of this chain, i.e. all the processesand mechanisms in between remain unknown to us. Because sporadic E events and sfericevents are found in opposition on both ends of this chain, we can hardly expect strong corre-lation between this two features. In fact, if such a strong correlation would exist, thunder-storms would influence sporadic E dx propagation considerably which is not the case, obvi-ously. Also, considering sferic observations a tracer of thunderstorms and thunderstorms atracer of the dynamical processes which may create gravity waves, we must conclude thatsferic observations can only provide a highly indirect measure of the geophysical phenomenawe are actually interested in.
Thus, radio amateurs are challenged by a complicated problem when exploring the possibility ofthunderstorm effects on 144 MHz sporadic E propagation: our situation is very much describedby a pilot navigating in an unknown airspace without reliable navigational instruments. There-fore, no guarantee is given that we may close this case in amateur radio propagation studiessuccessfully, in one or the other direction.

Thunderstorm effects on sporadic E propagation in 144 MHz Page 23
Volker Grassmann, DF5AISabine Cremer, DL1DBC
Joachim Kraft, DL8HCZUdo Langenohl, DK5YA
Allard Munters, PE1NWLGabriel Sampol, EA6VQ
4 The thunderstorm analysis project
4.1 The project team
The thunderstorm analysis project was launched in early 2004 and comprises six team mem-bers: CREMER, DL1DBC, develops and operates the data acquisition and data analysis softwaretools, maintains the data base and manages contacts to commercial weather information serv-ices providing actual sferic data. LANGENOHL, DK5YA, contributes sporadic E observationsresulting from his European sporadic E summary reports [60] and he organizes access toweather information archives. MUNTERS, PE1NWL, operates the DXrobot internet service [61],i.e. he can access the latest sporadic E information communicated by radio amateurs. The in-terconnection between his and CREMER’s computer system exchanges data with short reactiontimes, see below. SAMPOL, EA6VQ, contributes his experience in the analysis of 144 MHz spo-radic E openings and provides data and results originating from his studies [62]. KRAFT,DL8HCZ, editor of the Dubus and Funktelegramm magazines, analyses ham radio publicationsrelevant to this project and investigates the details of ham radio observations which need to beanalysed in more detail. GRASSMANN, DF5AI, communicates the latest project status reports onthe Amateur Radio Propagation Studies web site [58] and manages the contacts to the scien-tific community.
Fig. 4.1. Schematical diagram of the data flow in the thunderstorm analysis project.

Thunderstorm effects on sporadic E propagation in 144 MHz Page 24
Volker Grassmann, DF5AISabine Cremer, DL1DBC
Joachim Kraft, DL8HCZUdo Langenohl, DK5YA
Allard Munters, PE1NWLGabriel Sampol, EA6VQ
4.2 Data acquisiton and data analysis
4.2.1 General overview
The project benefits from existing infrastructure in the meteorological community and from vari-ous alerting and analysis services in ham radio, see Fig. 4.1. Because of the high geographicaldensity of VHF ham radio stations in Europe, radio amateurs can hardly fail detecting at leastthe majority of 144 MHz sporadic E events in the European sector.
Thus, the ham radio community (orange box) provides the raw data by uploading dx informationto the OH9W/OH2AQ dx cluster network and by submitting logbook information, for example, toDK5YA’s sporadic E summary service in the internet [60] (yellow box). The dx cluster informa-tion is permanently scanned by PE1NWL’s DXrobot service [61] which distributes dx alerts toemails, mobile phones and pagers (green box). This service also triggers DL1DBC’s SfericsRetriever software which now downloads actual sporadic E and sferic data (pink box) fromthe internet. Thus, all relevant data concentrates on DL1DBC’s computer system which finallylaunches the data analysis and graphical post processing routines (red box).
4.3 Data acquisiton and data analysis
4.3.1 General overview
The project benefits from existing infrastructure in the meteorological community and from vari-ous alerting and analysis services in ham radio, see Fig. 4.1. Because of the high geographicaldensity of VHF ham radio stations in Europe, radio amateurs can hardly fail detecting at leastthe majority of 144 MHz sporadic E events in the European sector.
Thus, the ham radio community (orange box) provides the raw data by uploading dx informationto the OH9W/OH2AQ dx cluster network and by submitting logbook information, for example, toDK5YA’s sporadic E summary service in the internet [60] (yellow box). The dx cluster informa-tion is permanently scanned by PE1NWL’s DXrobot service [61] which distributes dx alerts toemails, mobile phones and pagers (green box). This service also triggers DL1DBC’s SfericsRetriever software which now downloads actual sporadic E and sferic data (pink box) fromthe internet. Thus, all relevant data concentrates on DL1DBC’s computer system which finallylaunches the data analysis and graphical post processing routines (red box).
4.3.2 Sferic data
The sferic data is distributed by various weather services in the internet, see, e.g., the Wet-terzentrale [51] and the WetterOnline [50] service which compile and analyse radio observa-tion data, for example, from the European Cooperation for Lightning Detection (EUCLID) [53],from the Blitz Informationsdienst von Siemens (BLIDS) [52] or, alternatively, from the BritishTornado and Storm Research Organisation (TORRO) [54] which is a privately supported re-search body using data from the ATD system operated by the UK Met Office [55]. The BLIDSservice, for example, operates sixty low-frequency radio sensors in Germany, Switzerland,France and neighbouring contries, the British service operates sensors in Cornwall, on theShetland Islands and in overseas locations such as Iceland, Finland, the German North Seacoast, Gibraltar and Cyprus, respectively. The British Met Office specifies the geographicalaccuracy to be around five kilometers in the UK and between 20 and 100 kilometers in the restof Europe. Before using sferic information from the internet, there is an important need to ex-amine the service’s individual data coverage carefully. The Wetterzentrale service, for exam-ple, provides data only for one half of every hour which affects data analyses considerably.

Thunderstorm effects on sporadic E propagation in 144 MHz Page 25
Volker Grassmann, DF5AISabine Cremer, DL1DBC
Joachim Kraft, DL8HCZUdo Langenohl, DK5YA
Allard Munters, PE1NWLGabriel Sampol, EA6VQ
4.3.3 Automatic data retrieval systems
All sferic data is directly retrieved from the relevant internet sources which generally reflects ajust-in-time effort in order to take the data’s transient nature into consideration. The data re-trieval is maintained by a TCP client software which is triggered by PE1NWL’s DXrobot service[61]. The DXrobot comprises two modules, i.e. a front end TCP client searching data patterns inthe OH9W/OH2AQ dx cluster network [56] which might indicate an actual sporadic E dx eventand, on the other hand, an alerting system which addresses radio amateurs subscribed to theDXrobot’s mailing list. MUNTERS has also introduced a status table denoting quiet, high MUF (i.e.high maximum usable frequency) and E-skip alert propagation conditions, respectively.
During the so-called idle mode, CREMER’s Sferics Retriever software reads the DXrobot’sstatus table every 15 minutes. In the case of a high MUF warning, the Sferics Retriever soft-ware accesses the DXrobot’s status table every five minutes. If the E-skip alert has been re-ceived, the software activates its individual alert status which now addresses the internetweather services to transfer actual sferic data into a local SQL database. The DXrobot alsoterminates the Sferics Retriever’s alert status by indicating the end of the actual band openingwhich returns the Sferics Retriever software to the idle mode. The Sferics Retriever softwareand all the other tools are written in the Perl programming language and are operated in a LINUXserver environment.
4.3.4 Sporadic E dx information
The team members LANGENOHL (DK5YA) and SAMPOL (EA6VQ) both operate web sites whichcompile and analyse VHF dx information from radio amateurs for many years (see [60] and [62],respectively). Their data was used in our studies when analysing 144 MHz dx QSOs from the2004 sporadic E season. All data originates from the European community of VHF radio ama-teurs which represents a large number of radio operators submitting actual observation reportsby uploading station logbooks and dx summaries.
However, ham radio logbooks show a large variety of data formats, i.e. the dx information can-not be uploaded into a database without a considerable amount of data pre-processing in orderto identify, for example, the radio callsigns, UTC information, geographical coordinates (i.e. QTHlocators), signal reports and other type of information. CREMER has therefore developed a Perlscript which can read more than 97 percent of the dx information automatically, i.e. only theremaining three percent still require manual editing. Without this software tool, we wouldn’t beable to manage our studies in reasonable time because of the large amount of dx informationthat needs to be analysed.
4.3.5 Current data analysis tools
In the setup phase of the project, we have focused on geographical analyses using sferic dis-tribution maps published in the internet (we have in particular used material from the WetterOn-line service [50]). Note that the internet resources do not provide numerical information on thesferics’ geographical position, i.e. those maps must be used “as they are” which limits our flexi-bility in graphical visualization considerably. The midpoints of the above mentioned sporadic EQSOs are therefore plotted on the original sferic data maps. We however plan to implement amuch broader spectrum of analysis tools in the future, one of this tools is discussed in chapter4.5.
Fellow radio amateurs wishing to implement their own data analyses are advised to examinethe internet maps carefully because the majority of internet weather services does not providesufficient information on the actual map projection. Calculation routines and programming codemay be found in various internet resources, see, e.g., [18] and [57]. We in particular considerthe General Mapping Tools [45] very useful which are distributed by WESSEL and SMITH, Uni-

Thunderstorm effects on sporadic E propagation in 144 MHz Page 26
Volker Grassmann, DF5AISabine Cremer, DL1DBC
Joachim Kraft, DL8HCZUdo Langenohl, DK5YA
Allard Munters, PE1NWLGabriel Sampol, EA6VQ
versity of Hawaii, under the GNU General Public Licence (see [45] and the references citedtherein.)
4.4 First results obtained during the sporadic E season 2004
In May/June 2004, the setup went operational but, unfortunately, we were facing were fewsporadic E dx events during 2004. However, we found an example of sporadic E activity whichindeed attracts our interest in the scope of this paper, i.e. the sporadic E opening on June 27,2004.
Fig. 4.2. The June 27, 2004 spo-radic E opening. The vertical barsdenote the number of two-way dxQSOs per 15 minutes (left scale),the line denotes the accumulatednumber of QSOs during the day(right scale).
Fig. 4.2 displays the distribution of 144 MHz dx QSOs during that day indicating various phasesof sporadic E activity between 08 and 17 UTC. By calculating the geographical center of thecorresponding dx QSOs, we may estimate the location of the actual scatter volume in the Eregion of the ionosphere, see Fig. 4.3. In the early hours (i.e. between 08 and 09 UTC), thecenters of sporadic E forward scatter were all located in a wide area in the Adriatic Sea(green) which has then moved towards northern Italy (yellow). In the afternoon, the geo-graphical distribution of sporadic E positions shows a remarkable feature, i.e. a band of activityextending over more than 1.500 kilometers from southern France to eastern Germany (red,purple) within a corridor of 200 to 400 kilometers width.
Referring to the sferics data distributed by the Wetteronline service [50], we found little sfericactivity in central Europe between 08 and 12 UTC. No thunderstorm activity was in particularavailable close to the green and yellow scatter area, i.e. this sporadic E openings are definitelynot associated with any thunderstorm effects.
However, beginning 12.30 UTC the sferic activity has permanently increased and some areasshow more than 60 sferic events per 30 minutes between 16 and 17 UTC (a localized spot incentral France even displays more than 80 sferics/30min which indicates severe thunderstormactivity). Surprisingly all these sferic events are more or less perfectly aligned along that redand purple band of sporadic E activity, see Fig. 4.4 (readers may visit CREMER’s webpage [59]which provides an animated sequence of this scenario).
We are reluctant to cite this feature as evidence for 144 MHz sporadic E propagation triggeredby thunderstorms because we cannot exclude an accidental occurrence of sferics and spo-radic E activity in this example (in fact, central European thunderstorms indeed appear to bealigned from south-west to north-east quite often in summertime). Nevertheless, we considerthis a striking feature which motivates further analyses in this subject.

Thunderstorm effects on sporadic E propagation in 144 MHz Page 27
Volker Grassmann, DF5AISabine Cremer, DL1DBC
Joachim Kraft, DL8HCZUdo Langenohl, DK5YA
Allard Munters, PE1NWLGabriel Sampol, EA6VQ
Fig. 4.3. QSO midpoints representing the geographical position of sporadic E on June 27, 2004.The color code is identical to Fig. 4.2, i.e. the red and purple positions correspond to dx QSOs
between 12.30 and 15.30 UTC.
Fig. 4.4. Geographical distribution of sferics observed on June 27, 2004 at 0900-1230 UT (left)and 1230-1700 UT (right). The color code denotes the number of sferics per 30 minutes. Origi-
nal data from [50], post processed data from [59].

Thunderstorm effects on sporadic E propagation in 144 MHz Page 28
Volker Grassmann, DF5AISabine Cremer, DL1DBC
Joachim Kraft, DL8HCZUdo Langenohl, DK5YA
Allard Munters, PE1NWLGabriel Sampol, EA6VQ
4.5 Next steps in data analysis
Geographical presentations similar to Fig. 4.3 and Fig. 4.4 can provide information on particularsferic and sporadic E events but cannot support statistical analyses dealing with long time se-ries resulting from long-term observations. For example: analysing all sporadic E events be-tween, say 1990 and 2004, the many data points would overlap and would finally overload themap display destroying all systematical features in the graphics. Even if thunderstorm effectson 144 sporadic E may be considered a real phenomenon, doubt will continue to exist whenstudying individual events only, i.e. there is a need to employ statistical methods in our studies.
Fig. 4.5 therefore suggests an alternative approach when analysing sporadic E and sfericevents: by calculating the actual time difference ∆ t and the actual distance d between allsferics and all the sporadic E events, a transformation is obtained replacing all absolute data(i.e. geographical coordinates and UTC information) by relative data (i.e. time differences anddistances). Assuming the number of sferic events is N and the number of sporadic events is M,the new data set will comprise N times M data records in total. With this transformation, allavailable data may be plotted in only one diagram, see Fig. 4.6, i.e. we obtain an easy but pow-erful tool for analysing the spatiotemporal correlation between sporadic E and sferic events.
Fig. 4.5. Data set indicat-ing the time differenceand geographical dis-tance between all sfericsand all sporadic E events.
Assuming, the sferic and sporadic E data would show no spatiotemporal correlation at all, theabove procedure will result in a random distribution of data points (graphical noise) similar topanel a in Fig. 4.6. Any existing correlation will however result in some sort of accumulation ofdata points as shown be fictive examples in the next panels.
Panel b, for example, shows fictive data indicating sporadic E positions close to sferic positionsassociated with a variable time-delay though. Such a scenario would indicate gravity wavespropagating in vertical direction at variable speed. Panel c shows a fictive example of gravitywaves propagating with contant velocity in vertical and also in horizontal direction, i.e. the spo-radic E and the sferic events show a time-delay proportional to the distance between the thun-derstorm cells and the scatter position in the E region of the ionosphere. Panel d, on the otherhand, shows a fictive scenario in which the sporadic E activity occurs more or lesssimultaneously in close vicinity to the sferic activity (which appears an unlikey scenariothough). This type of graphical presentation can therefore disclose the spatiotemporalcorrelation between sporadic E and sferic events and, if an evident correlation would indeedbecome visible, can also provide valuable information on the horizontal and vertical propagationcharacteristics of gravity waves.

Thunderstorm effects on sporadic E propagation in 144 MHz Page 29
Volker Grassmann, DF5AISabine Cremer, DL1DBC
Joachim Kraft, DL8HCZUdo Langenohl, DK5YA
Allard Munters, PE1NWLGabriel Sampol, EA6VQ
Fig. 4.6. Diagrams displayingthe relative time differenceand distance between sfer-ics and sporadic E events.The plots show fictive data,see text.
We cannot predict what pattern may be expected when using real data but we may speculateon the time differences and distances that need to be considered in this type of analysis. Con-sidering the correlation between the TID occurrence in the F region of the ionosphere and thetropical rainfall activity reported by RÖTTGER ([6], see also chapter 3.2), the displacement ofsporadic E events relative to the sferic events will be only a few hundred kilometers, probablyeven less than 100 kilometers. This assumption results from the TID measurements carried outsouth of the Peruvian rainforst (see figure 8 in [6]) and by considering the height differencebetween the F and E region (assuming gravity waves in the tropics and in mid-latitudes propa-gate with an identical elevation angle relative to the Earth surface). Because the correlationbetween the TID occurrence and the rainfall activity also shows a time lag around three hours[6] (which is interpreted the period of time in which gravity waves propagate from the uppertroposphere into the F region of the ionosphere), we may also conclude that sporadic E andsferic events will exhibit a time delay of approximately one hour or so.
Although we are indeed curious carrying out this type of analysis in practice, we cannot pre-sent results in the near future, unfortunately. A severe practical complication results from thefact that we currently cannot access neither the numerical geographical coordinates nor theevent time of individual sferic events because this type of data is not available with the internetresources which only provide summary plots instead. We therefore plan to apply for directcooperation with the sferic observatories in order to access the raw data material required inthis type of analyses.
5 Summary and concluding comments
The existence of thunderstorm effects on the ionosphere appears generally accepted in at-mospheric sciences for three reasons:
• Various ionospheric effects are clearly associated with atmospheric gravity waves travel-ling in the E and F region of the ionosphere. Gravity waves are in particular considered one

Thunderstorm effects on sporadic E propagation in 144 MHz Page 30
Volker Grassmann, DF5AISabine Cremer, DL1DBC
Joachim Kraft, DL8HCZUdo Langenohl, DK5YA
Allard Munters, PE1NWLGabriel Sampol, EA6VQ
cause of wind shears around 100 km height which may stimulate the generation of spo-radic E layers.
• Gravity waves originating in the troposphere and in the stratosphere may propagate up-wards into the mesosphere (80 km) and, very likely, may also arrive at D and E regionheights around 90 to 110 km.
• It is a well known fact that thunderstorms may create convectively generated gravitywaves in the upper troposphere and in the lower stratosphere.
Scientists believe that this three individual effects may also occur in combination, at least par-tially. Hence, thunderstorms are interpreted the origin of gravity waves propagating from thelower into the upper atmosphere where they may create wind shears in the E region of theionosphere which, finally, stimulate or support the generation of sporadic E. This model appearsplausible to many scientists but, as far as we can see, it isn’t yet verified in all aspects anddetails. However, scientific measurements can provide some indications leading in this direc-tion. In this paper, we have presented two examples communicated in the scientific community:
• The Nebraska thunderstorm documented by the University of Alaska in August 1999 pro-vides strong evidence of thunderstorm-triggered gravity waves propagating upwards intothe mesosphere (detected by optical instruments measuring the spatial distribution of theOH nightglow at 85 km). However, the mesosphere is not identical to the ionosphere but lit-tle imagination is required to assume gravity waves travelling even higher than 85 kilome-ters.
• The statistical results of the GPS/MET experiment provides additional information indicatingan impressive correlation between thunderstorm and gravity wave activity in the lower at-mosphere on one hand and E region irregularities on the other hand. However, we haveraised words of caution because that E region irregularities must not be considered similarto sporadic E events as discussed by VHF radio amateurs.
Unfortunately, radio amateurs have no instrumentation capable to detect the presence of grav-ity waves, therefore we need to deal with tracers as an alternative. Thunderstorm-triggeredgravity waves are associated with strong updrafts (convectively generated gravity waves)causing charge separation within the thunderstorm cloud which results in cloud-to-cloud andcloud-to-ground lightning strikes, respectively. Each strike creates a sferic, i.e. an electromag-netic impulse of short duration which direction-finding radio receivers may detect quite easily.Thus, by analysing the geographical position of sferics we may localize the geographical posi-tion of thunderstorms more or less accurately. However, gravity waves travel in vertical andalso in horizontal direction, i.e. the position of gravity waves penetrating the E region of iono-sphere may differ considerably from thunderstorm positions. Thus, sferics may trace thunder-storm positions but can hardly predict the geographical position of sporadic E.
Nevertheless, in our project’s early analyses we have compared sferic positions and sporadicE positions based on observations made during the 2004 sporadic E season in Europe. Thesferic positions were derived from the Wetteronline internet service and the sporadic E posi-tions were calculated from 144 MHz dx QSOs reported by radio amateurs. It was no surprisefinding many examples of sporadic E not associated with any thunderstorm at all. In fact, w ebelieve that less than, say ten percent or even less of mid-latitude sporadic E is triggered bythunderstorms, if any. It is important to note that previous researchers did not find any con-vincing correlation between thunderstorms and 144 MHz sporadic E propagation, i.e. all whatwe may expect is a small effect or, alternatively, no effect at all. However, we are surprisedabout one data example (June 27, 2004) which shows a geographical pattern of sporadic Eactivity almost identical to the geographical distribution of sferics.
Thunderstorm effects on sporadic E propagation in 144 MHz Page 31
Volker Grassmann, DF5AISabine Cremer, DL1DBC
Joachim Kraft, DL8HCZUdo Langenohl, DK5YA
Allard Munters, PE1NWLGabriel Sampol, EA6VQ
Map presentations do not appear an appropriate tool for identifying possible correlations in thespatiotemporal distribution of sporadic E and sferic activity. Map displays can only considershort observation periods with few data points (too many data may overload the map display)and cannot reveal possible time delays between sfercis and sporadic E events. We havetherefore suggested an alternative approach which considers relative rather than absolutedata, i.e. distances and time differences instead of geographical coordinates and UTC informa-tion. With this method even long-term observations may be plotted in only one diagram whichwill hopefully support future statistical analyses. However, we cannot access numerical sfericdata required to calculate the distance between sporadic E and sferic events, i.e. our projectcurrently faces practical complications which our team needs to address in the near future.
Considering the scientific material and, perhaps, our findings from June 27, 2004, the possibilityof thunderstorm effects on 144 MHz sporadic E propagation cannot be generally excluded. Onthe other hand, it is much too early taking those effects for granted at this stage of investiga-tion. Also, this paper focuses on one particular model but alternative models are also worth tobe investigated in more detail. GRAYER, for example, draws our attention to cumulonimbus gen-erating “electic fields [which] are known to cause a drift of atmospheric electrons towards theE layer, charging it up to about 100 –300 kV” [63]. He even considers this “an equally interesting(and perhaps more persuasive) mechanisms for coupling between thunderstorms and Es”.
Thus, thunderstorm effects on VHF sporadic E propagation remain an open issue in amateurradio propagation studies worth to be investigated in more detail. The authors hope that thispaper may provide some new aspects and considerations and may stimulate ham cooperationin this fascinating subject which combines elements from meteorology (thunderstorms), iono-spheric physics (sporadic E), VLF radio techniques (sferic detection), VHF radio operation (144MHz dx QSOs), internet applications (weather services and dx alerting systems), softwareengineering (data acquisition and data processing) and data analysis methods.
Acknowlegements: The authors are to the WetterOnline Meteorologische DienstleistungenGmbH, to the Blitzinformationsdienst von Siemens (BLIDS) and to the Wetterzentrale GeorgMüller for granting permission of accessing their online data in our analyses. We thank Prof. J.RÖTTGER (DJ3KR) for providing valuable material on TIDs and spread-F irregularities relevant tothe scope of this paper. We thank G. GRAYER (G3NAQ) for reading the manuscript and for pro-viding many valuable comments. We are also grateful to the many VHF radio amateurs havingsubmitted their sporadic E observations to our web sites which has supported our studiesconsiderably.
6 References
[1] Internal atmospheric gravity waves at ionospheric heightsHines C. O.Can. J. Phys., 38, 1441-1481, 1960
[2] Wellenausbreitung IIGrosskopf J.BI Hochschultaschenbücher 539/539a, Mannheim, 1970
[3] Transäquatoriale UKW-AusbreitungHarrison R. L., VK2ZTBUKW-Berichte, 90-108, 1972

Thunderstorm effects on sporadic E propagation in 144 MHz Page 32
Volker Grassmann, DF5AISabine Cremer, DL1DBC
Joachim Kraft, DL8HCZUdo Langenohl, DK5YA
Allard Munters, PE1NWLGabriel Sampol, EA6VQ
[4] Die Untersuchung von Irregularitäten in der F-Schicht der äquatorialen Ionosphäre mit Hilfe
der transäquatorialen KurzwellenausbreitungRöttger J.Dissertation, Georg-August-Universität Göttingen, 1974
[5] Transäquatoriale KurzwellenfunkverbindungenRöttger J.cq-DL 2, 84-88, 1975
[6] Travelling disturbances in the equatorial ionosphere and their association with penetrativecumulus convectionRöttger J.J. Atmos. Terr. Phys., 39, 987-998, 1977
[7] Drifting patches of equatorial spread-F irregularities – experimental support for the spatialresonance mechanism in the ionosphereRöttger J.J. Atmos. Terr. Phys., 40, 1103-1112, 1978
[8] Transäquatoriale DX-Verbindungen auf 144 MHzRöttger J., DJ3KRcq-DL, 5, 198-200, 1979
[9] Equatorial spread-F by electric fields and atmospheric gravity waves generated by thun-derstormsRöttger J.J. Atmos. Terr. Phys., 43, 453-462, 1981
[10] Atmospheric gravity waves generated in the high latitude ionosphere: a reviewHunsucker R. D.Rev. Geo. and Space Phys., 20, 293-315, 1982
[11] Gravity waves seeding ionospheric irregularitiesRöttger J.Nature, 296, 111-112, 1982
[12] Internal atmospheric gravity waves at ionospheric heightsHines C. O.This week’s citation classics, 1985http://www.garfield.library.upenn.edu/classics1985/A1985AKX9400001.pdf
[13] VHF and UHF propagation modesGrayer G., G3NAQThe VHF/UHF DX Book, White I., G3SEK (editor), RSGB, 1995
[14] Cometary origin of sporadic ESpokes G. N., Annual meeting of the Society of Amateur Radio Astronomers, 1996http://users.erols.com/nspokes/paper_es.htm
[15] A study of atmospheric gravity waves and travelling ionospheric disturbances at equato-rial latitudesBalthazor R. L., Moffet R. J.Ann. Geophysicae 15, 1048-1056, 1997http://194.94.42.12/licensed_materials/00585/papers/7015008/70151048.pdf

Thunderstorm effects on sporadic E propagation in 144 MHz Page 33
Volker Grassmann, DF5AISabine Cremer, DL1DBC
Joachim Kraft, DL8HCZUdo Langenohl, DK5YA
Allard Munters, PE1NWLGabriel Sampol, EA6VQ
[16] Wave-associated sporadic neutral layers in the upper atmosphere
Clemesha B. R., Batista P. P., Simonich D. M.Rev. Bras. Geof., 15, no. 3, 1997http://www.scielo.br/scielo.php?script=sci_arttext&pid=S0102-261X1997000300003
[17] High-altitude atmospheric flashes (sprites and jets)Space Physics TextbookUniversity of Oulu, 1998http://www.oulu.fi/~spaceweb/textbook/Welcome.htmlhttp://www.oulu.fi/~spaceweb/textbook/sprites.html
[18] Dist – find great-circle distance between two points on earth’s surface (Perl code)Kindred D., 1998http://indo.com/distance/dist.pl
[19] VHF & UHF propagation, ”Predicting – be sure to do this daily”Gyde R., ZL1NE/1, 1999
[20] Personal communicationGyde R., ZL3NE/1, 2000
[21] ST radar observations of atmospheric waves over mountainous areas: a reviewRöttger J.Ann. Geophysicae 18, 750-765, 2000
[22] Coupling, energetics and dynamics at atmospheric regions: CEDAR Phase IIISummary report, year unknown
[23] Seasonal variations of gravity wave structures in OH airglow with a CCD imager at Shi-garakiNakamura T., Higashikawa A., Tsuda T., Matsushita Y.Earth Planets Space, 51, 897-906, 1999http://www.terrapub.co.jp/journals/EPS/pdf/5107_08/51070897.pdf
[24] Atmospheric gravity wave signature in the infrared hydroxyl OH airglowFrey H. U., Mende S. B., Arens J. F.Geophys. Res. Letter, 27, 41-44, 2000http://sprg.ssl.berkeley.edu/adminstuff/webpubs/2000_grl_41.pdf
[25] Gravity wave spectra from GPS/MET occultation observationsSteiner A. K., Kirchengast G.American Met. Soc., 495-503, 2000http://www.uni-graz.at/igam-arsclisys/publications/publ2000/AKSandGK-JAOT-v17p495y2000.pdf
[26] Equatorial propagationCracknell R, G2AHUhttp://www.uksmg.org/equitorialpropagation.htm
[27] Gravity waves and ionospheric irregularities over tropical convection zones observed byGPS/MET radio occultationHocke K., Tsuda T.Geophys. Res. Lett., 28, 2815-2818, 2001

Thunderstorm effects on sporadic E propagation in 144 MHz Page 34
Volker Grassmann, DF5AISabine Cremer, DL1DBC
Joachim Kraft, DL8HCZUdo Langenohl, DK5YA
Allard Munters, PE1NWLGabriel Sampol, EA6VQ
http://www.cosmic.ucar.edu/related_papers/2001_hocke_gravity_waves.pdf
[28] Global sounding of sporadic E layers by the GPS/MET radio occultation experimentHocke K., Igarashi K., Nakamura M., Wilkinson P., Wu J., Pavelyev A., Wickert J.J. Atmos. Solar-Terr. Phys., 63, 1973-1980, 2001http://www.cosmic.ucar.edu/related_papers/2001_hocke_sporadic_e.pdf
[29] Gravity wave dynamics and effects in the middle atmosphereFritts D. C., Alexander M. J.http://www.co-ra.com/dave/RG/RG03galleys.pdf
[30] Gravity wavesNajder, J., Azzolina M.http://vortex.weather.brockport.edu/~rochette/meso_presentations/Gravity_Waves.ppt
[31] Gravity waves: what’s the attractionComputer-aided forecasting exhibitionMc Noldy B.http://www.mcwar.org/articles/cafe/gw/gravwaves.html
[32] Buoyancy (gravity) waves in the atmosphereHocking W. K.University of Western Ontario, Dep. of Physics and Astronomyhttp://www.physics.uwo.ca/~whocking/p103/grav_wav.html
[33] Mid-latitude sporadic E – a reviewHawk M., The AM and FM Dxer’s resource, 2001http://www.amfmdx.net/propagation/Es.html
[34] High resolution observations of sporadic-E layers within the polar cap ionosphere using anew incoherent scatter radar experimentDamtie B., Nygrén T., Lehtinen M. S., Huuskonen A.Ann. Geophysicae, 20, 1429-1438, 2002
[35] News, comments & reportsKyriazis N., 5B4AZ, Dubus 3, p. 94-95, 2003
[36] A study of stratospheric GW fluctuations and sporadic E at midlatitudes with focus onpossible orographic effects of AndesHocke K., Tsuda T., de la Torre A.J. Geophys. Res., 107, D20, 4428, 2003http://www.agu.org/pubs/crossref/2002/2001JD001330.shtml
[37] Application of GPS occultation für studies of Atmospheric waves in the middle atmoso-phere and ionosphereTsuda T., Hocke K.Proceedings of the International Workshop on GPS Meteorology, Tokyo 2003http://dbx.cr.chiba-u.jp/Gps_Met/gpsmet/CD-1_Proceedings_PDF/04_Paper_S2%5C2-02_Tsuda.pdf
[38] Simultaneous observations of mesospheric gravity waves and sprites generated by amidwestern thunderstormSentman D.D., Wescott E.M., Picard R.H., Winick J.R., Stenbaek-Nielsen H.C., Dewan E.M.,Moudry D.R., Sao Sabbas F.S., Heavner M.J.

Thunderstorm effects on sporadic E propagation in 144 MHz Page 35
Volker Grassmann, DF5AISabine Cremer, DL1DBC
Joachim Kraft, DL8HCZUdo Langenohl, DK5YA
Allard Munters, PE1NWLGabriel Sampol, EA6VQ
J. Atmos. Solar-Terr. Phys., 65, 537-550, 2003http://nis-www.lanl.gov/~heavner/publications/gravity_wave/gravity_waves_Rev2.html
[39] On the spectrum of vertically propagating gravity waves generated by a transient heatsourceAlexander M. J., Holton J. R.Atmos. Chem. Phys. Discuss. 4, 1063-1090, 2004http://www.copernicus.org/EGU/acp/acpd/4/1063/acpd-4-1063_p.pdf
[40] Intrusive gravity currents and internal gravity wave generation in stratified fluidFlynn M. R., Sutherland B. R.J. Fluid Mech., 2004http://www.co-ra.com/dave/RG/RG03text.pdf
[41] The Jicamarca Radio Observatoryhttp://jicamarca.ece.cornell.edu/
[42] Incoherent and coherent scatter radars: Jicamarca examplesWoodman R.F.http://cedarweb.hao.ucar.edu/workshop/tutorials/2004/woodman04.pdf
[43] Coordinating amateur observations in scientific research {1}Email reflector service of the Propagation Studies Committee of the RSGBMelia A., G3NYK, July 4, 2004
[44] Coordinating amateur observations in scientific research {2}Email reflector service of the Propagation Studies Committee of the RSGBGrayer G., G3NAQ, July 5, 2004
[45] The generic mapping tools (GMT), version 4.0Wessel P, Smith W. H. F., 2004http://gmt.soest.hawaii.edu/
[46] INSPIRE projectGreen J. L., Goddard Space Flighrt Center, NASAhttp://image.gsfc.nasa.gov/poetry/inspire/http://image.gsfc.nasa.gov/poetry/inspire/basic.html
[47] GPS/MET – Active Limb Sounding
University Corporation for Atmospheric Research (UCAR)http://www.cosmic.ucar.edu/gpsmet/
[48] Analysis of gravity waves from radio occultation measurementsUniversity Corporation for Atmospheric Research (UCAR)Lange M., Jacobi Ch.Institut für Meteorologie, University Leipzig (year unknown)http://www.uni-leipzig.de/~jacobi/docs/2002_LIM_4.pdf
[49] Lightning & atmospheric electricity research at the Global Hydrology and Climate Centerhttp://thunder.msfc.nasa.gov/http://thunder.msfc.nasa.gov/data/query/distributions.html
[50] WetterOnlineMeteorologische Dienstleistungen GmbH, Bonn

Thunderstorm effects on sporadic E propagation in 144 MHz Page 36
Volker Grassmann, DF5AISabine Cremer, DL1DBC
Joachim Kraft, DL8HCZUdo Langenohl, DK5YA
Allard Munters, PE1NWLGabriel Sampol, EA6VQ
http://www.wetteronline.de
[51] Wetterzentrale Georg Müller, Bad Herrenalbhttp://www.wetterzentrale.de
[52] BLIDS – Blitz-Informationsdienst von SiemensSiemens AG, Industrial Solutions and Servcieshttps://www.blids.de/
[53] EUCLIDEuropean Cooperation for Lightning Detectionhttp://www.euclid.org/
[54] TORROTornado and Storm Research OrganisationUnited Kingdomhttp://torro.org.uk
[55] Arrival Time Difference System (ATD)UK Met Office, Exeterhttp://www.metoffice.com/climate/uk/averages/lightning.html
[56] DX SummitDx cluster networkhttp://oh2aq.kolumbus.com/dxs/
[57] Aviation formulary v1.42Ed William’s aviation pagehttp://williams.best.vwh.net/
[58] Amateur Radio Propagation StudiesGrassmann V., DF5AIhttp://www.df5ai.net
[59] Sporadic E and thunderstormsCremer S., DL1DBChttp://www.dl1dbc.net/
[60] The ‘World of DX above 50 MHz’Langenohl U., DK5YAhttp://www.vhfdx.de
[61] The DXrobotMunters A., PE1NWLhttp://www.gooddx.net
[62] The ‘VHF DX’ web siteSampol G., EA6VQhttp://www.vhfdx.net
[63] Personal communicationGrayer G., G3NAQ, 2004