thrombin assay. thrombin substrate peptidesequence charge substrate acetyl-n-d - d - -{nle}-tpr +...
TRANSCRIPT

Thrombin Assay
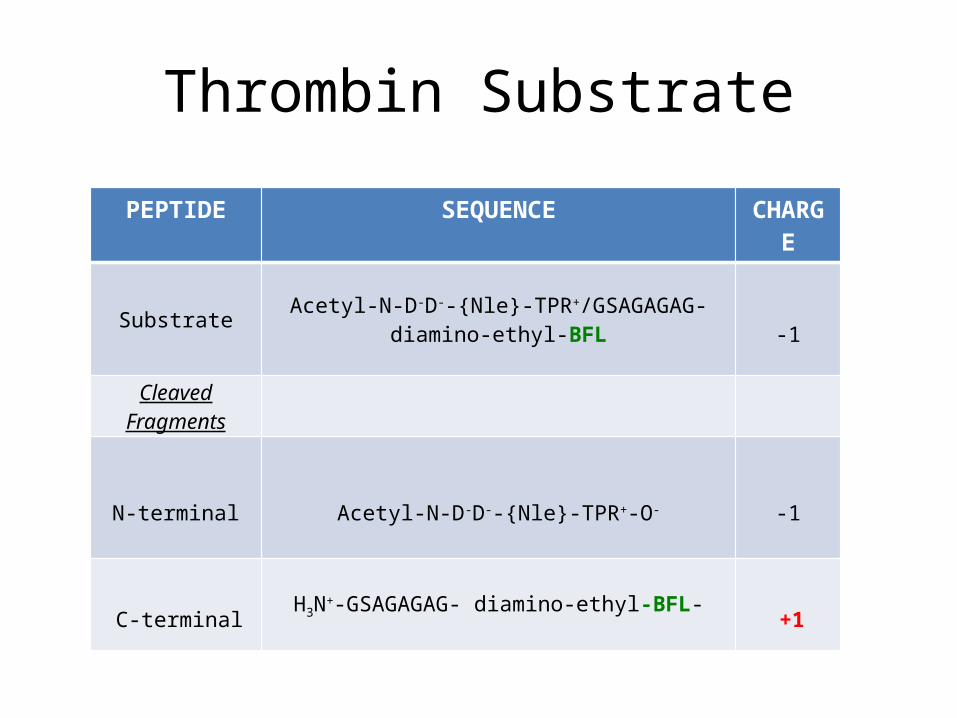
Thrombin Substrate
PEPTIDE SEQUENCE CHARGE
Substrate Acetyl-N-D-D--{Nle}-TPR+/GSAGAGAG- diamino-ethyl-BFL -1
Cleaved Fragments
N-terminal Acetyl-N-D-D--{Nle}-TPR+-O- -1
C-terminalH3N+-GSAGAGAG- diamino-ethyl-BFL-
+1

Thrombin Assay• Collect blood in untreated blood collection tube- Serum Tube
• Combine the blood and the thrombin specific substrate– The net charge of the thrombin substrate is -1; when thrombin cleaves
produces a -2 charged fragment and a +1 fluorescently labeled fragment
• Add EDTA to Stop the reaction– EDTA chelates the Calcium in the blood, and thus Thrombin is inhibited
• Separate the cleaved-labeled product from the un-cleaved substrate– An electric field is applied to achieve this

Thrombin H3N-GSAGAGAG-NH2
BFL
Ac-NDDNleTPR-O
BFL
Ac-NDDNleTPRGSAGAGAG-NH2
BLOOD SAMPLE SUBSTRATE

BFL
Ac-NDDNleTPRGSAGAGAG-NH2
BLOOD SAMPLE SUBSTRATE
BFL
Ac-NDDNleTPRGSAGAGAG-NH2
Thrombin
EDTA
EDTASUBSTRATE

Reaction Tube
} Focusing Gel
Extraction Gel
Sample Well
RBC
Thrombin
ProductUn-cleaved Substrate
EDTA
Substrate+ Blood + EDTA
1) Charge changing Substrate is added to a reaction tube
2) Fresh untreated blood is added to the tube
3) EDTA is added after some time desired4) A polyacrylamide gel is loaded with the
tube contents
Thrombin Assay Diagram

Increase Activity Increase Reaction Time
ANODE
CATHODE
Thrombin Assay Diagram
5) Electric field is applied to the gel 6) Positive charged labeled substrate products
travel to the cathode, everything else is negatively charged and travel to the anode

Increase Activity Increase Reaction Time
} Focusing Gel
Focused Product
Thrombin Assay Diagram
8) After some time the labeled positively charged products get focused in the focusing gel
9) The gel is scanned in a STORM scanner, and the image is then analyzed

Sample Results

0 5 10 15 20 25 30 35 40 450
2000000
4000000
6000000
8000000
10000000
12000000 Fresh Blood Thrombin Assay with EDTA
Reaction Time (mins)
Flu
ore
scen
ce x
10^
6
Calibration
Blood + T2 Substrate + EDTA
Time
Sample Vol (μL)
Subst Vol (μL)
EDTA(μL)
0 5.8 0.9 0.93 5.8 0.9 0.96 5.8 0.9 0.99 5.8 0.9 0.9
12 5.8 0.9 0.915 5.8 0.9 0.918 5.8 0.9 0.921 5.8 0.9 0.924 5.8 0.9 0.927 5.8 0.9 0.930 5.8 0.9 0.9
Fresh Whole Blood - Thrombin Assay- EDTA
• EDTA inhibits Thrombin action, and thus the reaction stops when it is added. As the reaction time increased, so did the thrombin activity
Reaction: Blood Samples with Substrate T2 (Thrombin); the reaction was stopped with EDTA at 3mins time intervals. Two different gels were ran in this experiment, and are represented in the graph. The total volume in the reaction was of 10 uLElectrophoresis: 6 μL Loading in 20% Polyacrylamide, 10 min.@500V

HEP Blood - Thrombin Assay- EDTA
Time
Sample Vol (μL)
Subst Vol (μL)
EDTA(μL)
0 5.8 0.9 0.93 5.8 0.9 0.96 5.8 0.9 0.99 5.8 0.9 0.9
12 5.8 0.9 0.915 5.8 0.9 0.918 5.8 0.9 0.921 5.8 0.9 0.924 5.8 0.9 0.927 5.8 0.9 0.930 5.8 0.9 0.9
• No signal was detected when using HEP blood, this is as expected, since HEP inhibits thrombin activity•This can be used as a negative control, since HEP only inhibits thrombin activity, and thus since no signal is detected, then other proteases are not reacting with our thrombin substrate (T2).
Reaction: Blood Samples collected in HEP tubes reacted with Substrate T2 (Thrombin); the reaction was stopped with EDTA at 3mins time intervals. Two different gels were ran in this experiment, and are represented in the graph. The total volume in the reaction was of 10 uLElectrophoresis: 6 μL Loading in 20% Polyacrylamide, 10 min.@500V
0 5 10 15 20 25 30 35 40 450
1000000
2000000
3000000
4000000
5000000
6000000
7000000
8000000
9000000
10000000
HEP Blood Thrombin Assay with EDTA
HEP-Blood EDTA
Reaction Time (mins)
Flu
ore
scen
ce x
10^
6
Buffer
Calibration

Aspirin Fresh Whole Blood- Thrombin Assay- EDTA
TimeSample Vol (μL)
Subst Vol (μL)
EDTA(μL)
0 5.8 0.9 0.93 5.8 0.9 0.96 5.8 0.9 0.99 5.8 0.9 0.9
12 5.8 0.9 0.915 5.8 0.9 0.918 5.8 0.9 0.921 5.8 0.9 0.924 5.8 0.9 0.927 5.8 0.9 0.930 5.8 0.9 0.9
NANegative Control
Negative Control
Negative Control
NA Control Control Control
• Fresh blood was collected from subject, who took 2 aspirin pills before the blood draw (one at night, and one in the morning). The detection of signal of thrombin activity was delayed by approx. 5 min.
Reaction: Blood Samples ( containing traces of Aspirin) reacted with Substrate T2 (Thrombin); the reaction was stopped with EDTA at 3mins time intervals. Two different gels were ran in this experiment, and are represented in the graph. The total volume in the reaction was of 10 uLElectrophoresis: 6 μL Loading in 20% Polyacrylamide, 10 min.@500V
0 5 10 15 20 25 30 35 40 450
2000000
4000000
6000000
8000000
10000000
12000000
Aspirin Fresh Blood Thrombin Assay with EDTA
Blood-Aspirin EDTA
Reaction Time (mins)
Flu
ore
scen
ce x
10^
6

Fresh Whole Blood- Thrombin Assay- EDTA (Aspirin and normal samples)
Normal Blood Sample:
Aspirin Blood Sample:
0 Reaction Time (min)35
0 Reaction Time (min) 37
Buffer
Buffer

Lane [Thrombin] nM
1 6003 5005 4007 3009 20011 10013 3014 Neg Control15 Neg Control
Calibration Curves: Citrate Blood +Thrombin
• Citrated blood was added with Thrombin substrate (T2), and thrombin enzyme•As the thrombin enzyme increased so did the fluorescent signal
Reaction: Blood Samples with Substrate T2 (Thrombin) and thrombin enzyme ; the reactants were added into a reaction tube, and the reaction was allowed for 30 mins. The total volume in the reaction was 15uL. Electrophoresis: 6 μL Loading in 20% Polyacrylamide, 10 min.@500V
0 2 4 6 8 10 124000000
4500000
5000000
5500000
6000000
6500000
7000000
7500000
8000000
f(x) = NaN x + NaNR² = 0
Thrombin Calibration Curve in Citrate Blood
Thrombin Concentration (nM)
Flu
ore
scen
ce x
10^
6

Bacterial Proteases

OmpT
• Outer membrane Bacterial Protease expressed by Escherichia coli
• Structure: – 10 stranded antiparallel β- Barrels , which protrudes out of the lipid bilayer
• Active Site:– Proteolytic activity in the extracellular part of the membrane– This extracellular part of OMPT contains a large negatively charge groove: thus it
has preference for Positively charged Residues

OmpT Structure
Electrostatic Surface Potential Overall Structure of OmpT
Negative Charged Residues Catalytic Residues
EMBO J. 2001 September 17; 20(18): 5033–5039.

OmpT Structure
EMBO J. 2001 September 17; 20(18): 5033–5039.

OmpT Substrate Design • The substrate needs to meet the following requirements:
– Specificity– Sensitivity – The whole substrate needs to have a net NEGATIVE CHARGE, the labeled
fragment caused by the enzymatic cleavage of the substrate needs to have POSITIVE CHARGE
• OmpT-Substrate Binding:• Amino acids in the substrate within six residue window
contribute to the binding of it to OmpT:– P1: Arg requirement– P1’: Lys, Gly, Val , Arg– P2: Val or Al– P3 and P4: Trp or Arg

OmpT Substrate Design
• Strategy• Identify OmpT specific peptide that is most negatively charged
or close to neutral
• Modify the ends of the peptide with charged amino acid residues
• Determine the net charge of the entire substrate: must be negative. And also determine charge of the cleaved fractions: one of them must be positive (c-end)
• Bind fluorophore to the positively charged fraction terminal

OmpT Substrate Design• Substrate Sequence of Interest
• Determined by the following techniques• In situ cleavage of phage that display protease-susceptible peptides by E
coli expressing OmpT• In vitro cleavage of phage-displayed peptides using purified enzyme
• McCarter’s group narrowed it down to the following after testing all combinations in their library:

OmpT Substrate Design
• Best sequence for charge changing substrate:
Ac-WGGK(+)YR(+) / R(+)AWGTI-NH2
- The peptide shown above has a net charge of +3. At least 4 negatively charged residues need to be added to the sequence, making the net charge of the substrate -1
- Must keep the peptide as short as possible to avoid complications in structure
- Notice the synthetic substrate sequence is 106 fold higher than peptide that corresponds to cleavage site of human plasminogen
Suggested Sequence:
- Use Asp(D) as the negatively charged residue: less bulky than Glu(E)- Add most of the negative residues to the N-terminus, since this will be
the unlabeled end.- This will make the label end of the substrate more positive, and the un-
label more negative Better separation

Suggested Sequence:
Acetyl-W-GD(-)D(-)GD(-) K(+) YR(+) / R(+)AWGD(-)TI(diamino-ethyl BFL)-Ac
PEPTIDE SEQUENCE CHARGE
Substrate Acetyl-W-GD(-)D(-)GD(-) K(+) YR(+) / R(+)AWGD(-)TI(diamino-ethyl BFL)-Ac -1
Cleaved Fragments
N-terminal Acetyl-W-GD(-)D(-)GD(-) K(+) YR(+) -O- -2
C-terminalH3N+-R(+)AWGD(-)TI(diamino-ethyl BFL)-Ac
+1
OmpT Substrate Design

OmpT Assay Similar to the thrombin assay, with the exception of a different substrate that targets OmpT.
Sample with OmpT enzyme
OmpT Specific substrate
Cleaved substrate
Pla
• Yersinia pestis surface protease
• An agent of plague and has been recognized as one of the most devastating, epidemic-causing bacteria experienced by mankind
• 9.5-kb plasmid pPCP expresses plague plasminogen activator (Pla)
• Responsible for fibrinolytic and coagulase activities

Pla Substrate Design
• Design strategy is very similar to the OmpT substrate
• DABCYL-Arg(+) / Arg(+)-Ile-Asn-Arg(+)-Glu(-)(EDANS)-NH2
• DABCYL is quencher molecule, EDANS is fluorophore
• +2 charge peptide sequence. Thus, we have to add -3 charge

Point of Care (POC) DeviceHand Held Device
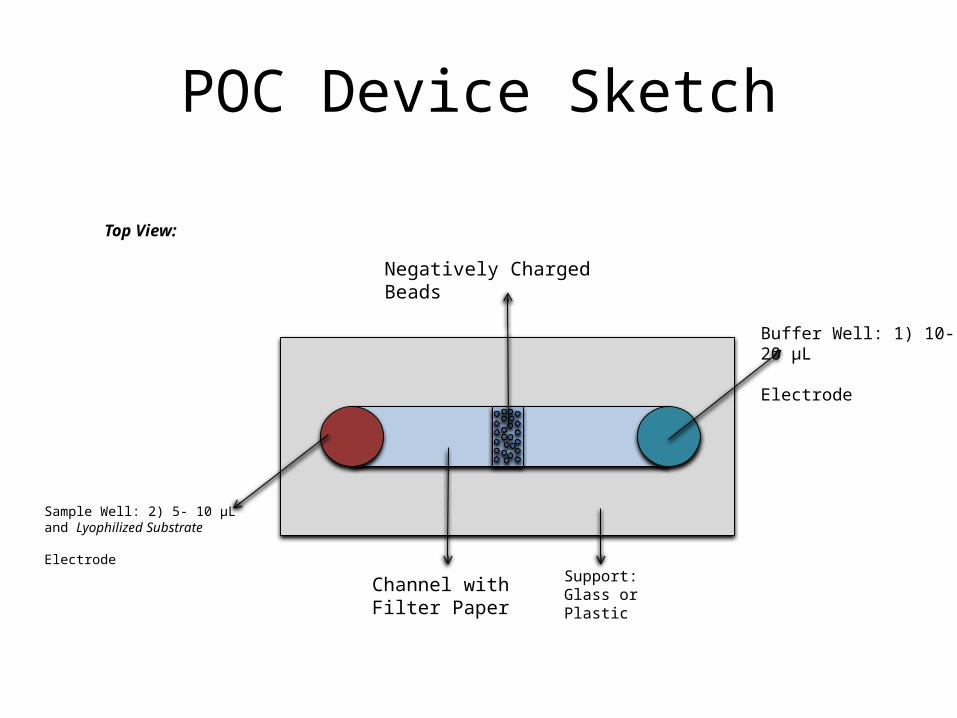
POC Device Sketch
Buffer Well: 1) 10- 20 μL
Electrode
Sample Well: 2) 5- 10 μLand Lyophilized Substrate
Electrode
Channel with Filter Paper
Negatively Charged Beads
Support: Glass or Plastic
Top View:

POC Device Sketch
Electrode Electrode
Buffer WellSample Well
Side View:
Wire Connection
Wire Connection
Lyophilized Reagents:-Charge Changing Substrate, Cofactors…
Cover: glass or plastic: transparent

POC Device Sketch
`
1) Buffer is added to the buffer gel: • Wetting the filter paper electrolyte connection between buffer and the
sample wells
2) Sample is added in the sample well:• Solubilizing the lyophilized reagents, and providing a connection between
the sample, and buffer wells
3) The reagents, and the sample are allowed to react for 10-15 min
4) A DC electric field is applied• Sample chamber (+) charge; Buffer chamber (-) charge
5) The positive charge fluorescently labeled product is collected in the beads
`

`
POC Device Sketch
``
Batteries
6) After the product is collected in the beads, imaging can be done by adding an excitation source (laser) under the device, then a filter on top, and the image is detected by a CCD camera on top.
Detector: CCD Camera
Filter
Excitation Source: Laser

CATHEPSIN-S

• Lysosomal cysteine protease– Involve in multiple diseases: cancer, diabetes, cardiovascular
diseases… and…
CATHEPSIN-S

CATHEPSIN-S
GRWHTVG//LRWE-Lys(Dnp)-DArg- NH2
From the sequence above, single amino-acid were replaced, the result is shown:The polypeptide seemed to be more sensitive to changes in P1’, P2,P1, and P3

• Broad substrate specificity Specific substrate is not known, but from the sequence shown before, the substrate seems to prefer the followings:
CATHEPSIN-S
Side Chain P-2 P-1P-1’ P-3’
Hydrophobic AromaticAliphaticMethionineProline
+(only Phe)+(not Ile)+-
-+--
-+--
+++Not tested
Neutral AmideSmall
--
++
--
0-
Basic --
++
0-
--
Acidic - - - -

CATHEPSIN-S

CATHEPSIN-S
Comparing Substrates
Ac-N-GD- PVG // LTA GAGK(BFL)-NH2 : Substrate for MMP2-9
Ac-GRWH-PMG // LPW ELys(Dnp)-DArg- NH2 : Substrate with higher specificity for CatS when compared to CatL, and CatB
The substrates are similar in the recognition sequence, so there might be non-specific cleavage of the substrate by MMP2/9 instead of Cathepsin S might be better to sacrify the specificity in comparison to CatB and CatL than that due to MMP2/9 (elevated in the blood-from the diabetes studies)
Might be better to go with: Ac-GRWH-TVG // LR WE-Lys(Dnp)-DArg- NH2

• Substrate 1:
Ac-GR(+)WH-TV G // L R(+) WE-dR(+)-K(+)(BFL) NH2
CATHEPSIN-S