thresholds- definitions, data collection, limitations and
TRANSCRIPT

Thresholds-Definitions, Data Collection,
Limitations and Harmonization
Steve L. Taylor, Ph.D.
Food Allergy Research & Resource Program
University of Nebraska
3rd Food Allergen Management Symposium
Melbourne, VIC, Australia
May 14, 2019

Why are we interested in Thresholds?
Very small amounts of specific allergens can provoke
reactions in some individuals, but
– we don’t know in how many
– we don’t know how small the amounts are
– we don’t know how severity of reaction relates to an
individual’s sensitivity
– allergic people are known to react differently on
different occasions
So it is difficult to assess how much needs to be done to achieve the desired level of safety with respect to allergens.
Source: R. Crevel, IUFoST - Chicago, July 2003

Historical Approach to Dose/Response
• Physicians recommended completed avoidance (ZERO threshold)
• Ingestion of small amounts (not well defined) could elicit allergic reactions
• DBPCFC was the gold standard for diagnosis but challenges often started at 400 – 500 mg
• 20%+ of patients reacted to first challenge dose – some severe rxns
©20193

Historical Approach to Dose/Response
• Peanut-allergic consumers have practiced complete avoidance (zero threshold)
• Peanut-allergic consumers still experienced occasional allergic reactions (hidden ingredients, cross contact, FOOD SERVICE)
• Unexpected allergic reactions to peanuts were occasional severe leading to widespread belief that low doses elicited severe reactions
©20194

Status of Dose/Response Knowledge circa 2005
• Trace amounts (low mg) can elicit allergic reactions
• Severity of response is related directly to dose (even that might not be universally held opinion)
• Individuals vary in degree of sensitivity
• How much is too much?
• A few clinics started doing very low dose DBPCFC and proved that safe doses exist for every subject and that severe reactions did not occur at very low doses (low mg)
Our 1st indication of safe doses
©20195

Current Situation
• Public health authorities have not established regulatory thresholds for allergenic foods
• U.S. FALCPA – de facto zero threshold for source labeling of ingredients
• Many regulatory authorities establish zero threshold for undeclared allergen
• Industry acutely aware of allergens, no guidance on thresholds so rampant use of precautionary labeling
©20196

©20197

Current Situation
• Quality of life for food-allergic consumers suffers partially as a result of difficulties in adherence to avoidance diets
• Food-allergic consumers increasingly ignore products with precautionary labels
• Some physicians advise food-allergic patients to avoid precautionary labels
• Allergic reactions continue to occur but rarely with packaged foods
©20198

US FDA Allergen Thresholds
Threshold Working Group Report
“Approaches to Establish Thresholds for Major Food Allergens and for Gluten in Food” (March, 2006)(Journal of Food Protection, Vol. 71, No. 5, 2008, Pages 1043–1088)
©20199

Terminology
• NOAEL – the No Observed Adverse Effect Level• NOAEL – the maximum tolerated dose that
produces no symptoms as determined by oral clinical challenge trials in food-allergic subjects
• LOAEL – the Lowest Observed Adverse Effect Level
• LOAEL - the minimal eliciting dose as determined by oral clinical challenge trials in food-allergic subjects
©201910

Terminology
• Individual Threshold – LOAEL or NOAEL for an
individual patient
• Population Threshold – LOAEL or NOAEL for a group of food-allergic individuals e.g.
- all peanut-allergic individuals
- peanut-allergic individuals in a particular clinic or group/sub-group
©201911

Terminology
• In reality, an individual’s personal threshold lies somewhere between their NOAEL and LOAEL
• Interval Sensoring Survival Analysis
- assigns equal probability that the true
threshold dose could fall anywhere on the continuum from NOAEL to LOAEL
©201912

Terminology – What Consitutes a Reaction?
• A response that poses a risk to human health- Regulatory view under U.S. FALCPA
• The first response of any type inclulding mild, subjective (cannot be confirmed by physician or other observer), transitory responses
• The first objective response that can be visually observed by a physician or other observer (also usually mild and transitory if oral challenges started at sufficiently low dose
• An objective response that meets some defined criterion e.g. 3 or more hives lasting 5 minutes or more, a single episode of vomiting, erythema, etc.
©201913

Data Collection – The FARRP/TNO DatasetWhat Consitutes a Reaction?
• A response that poses a risk to human health- Regulatory view under U.S. FALCPA
• The first response of any type inclulding mild, subjective (cannot be confirmed by physician or other observer), transitory responses
• The first objective response that can be visually observed by a physician or other observer (also usually mild and transitory if oral challenges started at sufficiently low dose
• An objective response that meets some defined criterion e.g. 3 or more hives lasting 5 minutes or more, a single episode of vomiting, erythema, etc.
©201914

FARRP/TNO Threshold DatabaseMethodological Approach
• Criteria for inclusion:- Published study or clinic files- Food-allergic by history or other factors- DBPCFC (open challenges for infants)- Description of NOAEL and/or LOAEL (if
dosing regimen provided, then can determine NOAEL from LOAEL)
- Data on individual patients- Objective symptoms @ doses
©201915
FARRP/TNO Threshold DatasetMining Existing Clinical Literature
• Individual NOAELs identified in some cases; discerned from LOAELs in other cases
• Individual LOAELs were available in many cases
• Data not available on all of the subjects from some studies because of method of reporting
• With interval-censoring survival analysis, both NOAEL and LOAEL are used to derive a “true” threshold value
©201916

LITERATURE REVIEW TOOL
©2019

LITERATURE REVIEW TOOL
TNO uses a literature review tool (developed in house) to keep track of published research and
considerations whether or not the published research contains data of interest
The literature review tool contains all (potentially) relevant publications from 2011 onwards
((allergy AND (food OR nutrition) AND (DBPCFC OR challenge OR provocation OR threshold OR
eliciting)))
Additional custom searches done by FARRP, which can be imported in the tool
©2019

LITERATURE REVIEW TOOL
©2019
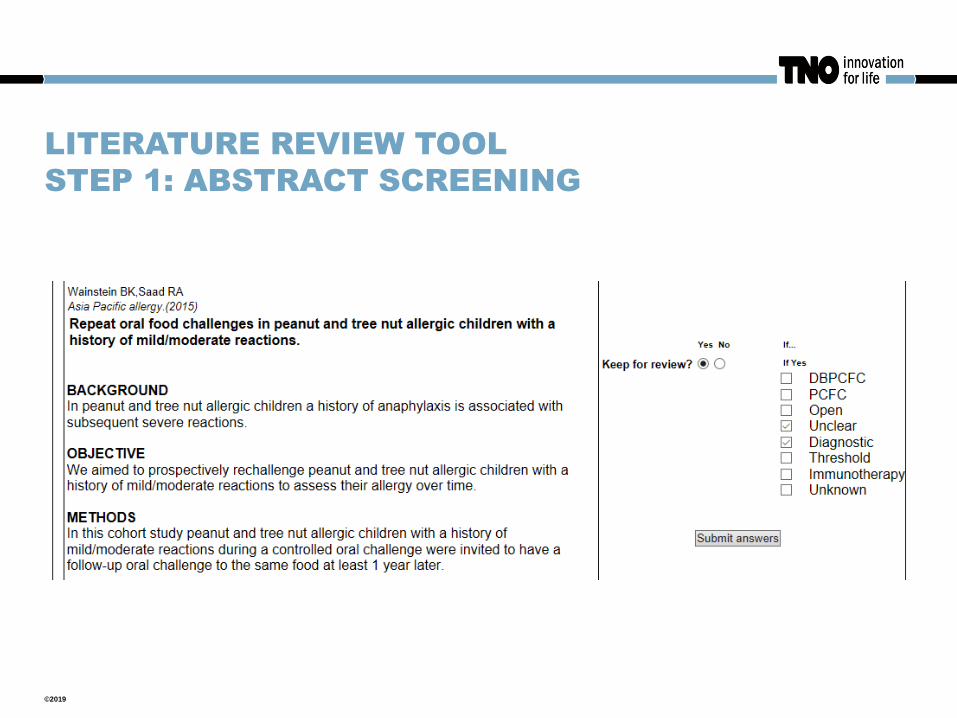
LITERATURE REVIEW TOOL
STEP 1: ABSTRACT SCREENING
©2019

LITERATURE REVIEW TOOL
STEP 2: READING FULL ARTICLE
©2019

LITERATURE REVIEW TOOL
STEP 2: READING FULL ARTICLE
©2019

LITERATURE REVIEW TOOL
STATISTICS
©2019

LITERATURE REVIEW TOOL
FROM 2011 TO NOW
> 2500 Titles and Abstracts reviewed
> 570 Kept for full PDF review
> 50 Identified as containing quantitative data in a usable format
©2019

Normalizing and Modelling Dose Distributions• Normalize doses on basis of total protein from the food
• Use individual NOAELs and LOAELs
• Done by interval-censoring survival analysis using three probability distribution models (Log-Normal, Log-Logistic, and Weibull); now model averaging
©201925

Peanut Threshold Population Distribution(expressed as mg peanut protein)
Cum
ulat
ive
Per
cent
age
of R
espo
nses
0%
10%
20%
30%
40%
50%
60%
70%
80%
90%
100%
Cumulative Dose of Protein (mg)
1.00E-03 1.00E-02 1.00E-01 1.00E+00 1.00E+01 1.00E+02 1.00E+03 1.00E+04 1.00E+05 1.00E+06
Log-Normal Log-Logistic Weibull
©201926

Food Allergy Research & Resource Program 2010
Table 2. ED10 and ED05 Doses for Whole Peanut as Assessed by the Log-Normal
Probability Distribution Models
Source
Total No. of
Peanut Allergic
Individuals
ED10 95% CI ED05 95% CI
Nancy Data 286 14.4 10.7, 19.6 7.3 5.2, 10.4
Published
Papers1 164 14.1 6.6, 29.9 4.2 1.7, 10.1
Combined 450 12.3 9.0, 16.8 5.2 3.6, 7.4
1Nine published studies yielded NOAELs and LOAELs for 164 peanut-allergic individuals. Twenty-one
individuals from 3 papers (A, B, and D; See Taylor et al., 2009) were excluded from analysis to avoid potential
duplication of individuals as these studies included individuals from the Nancy clinic.
All values reported in mg of whole peanut
27

VITAL® Reference Doses 2011-12
Allergen mg Protein Level
Peanut* 0.2
Milk* 0.1
Egg* 0.03
Hazelnut* 0.1
Soy* 1.0
Wheat* 1.0
Other Tree Nuts* 0.1
Sesame* 0.2
Crustacean shellfish* 10.0
Fish* 0.1
Mustard 0.05
©201928

Existing Threshold Data for Allergenic Foods
• Human data on individual minimal eliciting doses on dozens to hundreds of individuals
• Data from the actual sensitive sub-population: food-allergic human subjects
• Data from controlled clinical oral challenges conducted by experienced medical professionals
• Known, small challenge doses
©201929

The BIG Question
• Are these data sufficient to establish population threshold doses that could be used by public health authorities to protect food-allergic consumers?
• If not, what data gaps exist and how do we go about filling those data gaps?
©201930

Questions on the Existing Dataset
• Do we have sufficient data on all commonly allergenic
foods?
• Are the patients representative of the affected population?
• Do they include a sufficient number of the most highly
sensitive/severely affected individuals?
• Do differences exist between patients with and without
histories of severe reactions?
• Do differences exist between adults and children?
• Do geographic differences occur?
• Do differences occur between different clinic populations?
• How do you adjust for differences in clinical protocols?
• Does the form of the allergenic food make a difference?
©201931

Questions on the Existing Dataset• Do we have sufficient data on all commonly allergenic foods?
Except a few tree nuts
• Are the patients representative of the affected population?
Yes
• Do they include a sufficient number of the most highly
sensitive/severely affected individuals? Yes
• Do differences exist between patients with and without
histories of severe reactions? No
• Do differences exist between adults and children? No
• Do geographic differences occur? No
• Do differences occur between different clinic populations? ??
• How do you adjust for differences in clinical protocols? OK
• Does the form of the allergenic food make a difference? No??
©201932

©201933
Table 4. ED10 doses for whole peanut as assessed by the log-normal probability distribution
model for severity grade.
Severity GradeTotal No. of Peanut Allergic
IndividualsED10 95% CI
Severe1 40 10.4 4.8, 22.6
Non-Severe2 123 10.2 6.4, 16.1
No Prior History3 123 27.0 17.4, 42.0
1Severe reactions include three organ systems, asthma requiring treatment, laryngeal edema, and/or
hypotension.
2 Non-severe reactions include one or two organ systems, abdominal pain, rhinoconjunctivitis, urticaria,
eczema, non-laryngeal angioedema, and/or mild asthma (peak flow rate <80%)
3History of prior allergic reactions and severity of reactions were not available. These individuals were
identified as being sensitized to peanut by means of diagnostic tests.
All values reported in mg whole peanut

Questions on the Existing Dataset
• Uncertainty Factors
- exercise
- alcohol
- medications
- illnesses and general clinical health
- stress
- menstruation
• These factors exist for most chemical hazards in
foods
• Risk management
©201934

farrp.unl.edu