three-year comparison of cuny workforce demographics
TRANSCRIPT

2017 to 2019 Three-Year Comparison of
CUNY Workforce Demographics
UNIVERSITY OFFICE OF HUMAN RESOURCES MANAGEMENT- Program Management Office
PREFACE
The 2017 to 2019 Three-Year Comparison of CUNY Workforce Demographics is a compilation of fall CUNY Workforce Demographics Reports for 2017, 2018 and 2019 focusing on full-time titles only. It facilitates the comparison of employee’s demographic data across the numerous faculty and staff title groups over a 3-year period, highlighting any change that may have occurred to the CUNY workforce.
Data in this report is presented for each of CUNY’s 25 campuses and the Central Office and shows William E. Macaulay Honors College data separate from the Graduate School and University Center. In addition to the individual campuses, data is also presented at the University-wide level. The selection criteria for this report includes employees that are active or on a paid leave and excludes all unpaid leaves. It includes only full-time title groups and excludes adjunct faculty and other hourly staff titles.
In Part A, Figures 1- 6 displays a University-wide percentage representation respectively for all full-time titles including the Instructional Staff (Faculty, Executive Compensation Plan (ECP), Higher Education Officer and Other Instructional Staff) and Classified Staff (White Collar, Blue Collar, Skilled Trades and Stage and Theatre employees). Tables 1 to 6 provides the total and percentage representation for the same title groupings.
In Part B, Tables 7A to 7AA presents totals and percentages for Full-Time Instructional Staff by campus.
Should you have questions regarding any information found in this report, please contact the Office of Human Resources Management at [email protected].

Table of Contents
PART A – UNIVERSITY-WIDE Page # PART B – COLLEGES Page #
FIGURES: Percentage Representation 1 – Full -Time Instructional Staff 5 2 – Full-Time Classified Staff 6 3 – Full-Time Faculty by Rank 7 4 – Executive Compensation Plan Titles 8 5 – Higher Education Officers Series 9 6 – Other Instructional Staff Titles 10
TABLES: Number and Percentage Representation 1 – Full –Time Instructional Staff 12 2 – Full-Time Classified Staff 13 3 – Full-Time Faculty by Rank 14 4 – Executive Compensation Plan Titles 15 5 – Higher Education Officers Series 16 6 – Other Instructional Staff Titles 17
TABLES: Number and Percentage Representation 7A – Baruch College 19 7B – Brooklyn College 20 7C – City College of New York 21 7D – Medgar Evers College 22 7E – Graduate Center 23 7F – Hunter College 24 7G – John Jay College 25 7H – Lehman College 26 7I –Macaulay Honors College 27 7J – New York City College of Technology 28 7K – Queens College 29 7L – College of Staten Island 30 7M – York College 31 7N – Central Office 32 7O – CUNY School of Law 33 7P – School of Medicine 34 7Q – School of Professional Studies 35 7R – School of Journalism 36 7S – School of Labor and Urban Studies 37 7T – School of Public Health 38 7U – Borough of Manhattan Community College 39 7V – Bronx Community College 40 7W – Guttman Community College 41 7X – Hostos Community College 42 7Y – Kingsborough Community College 43 7Z – LaGuardia Community College 44 7AA – Queensborough Community College 45

Part A: Figures - UNIVERSITY-WIDE

GRAPH 2 GRAPH 3
GRAPH 1
GRAPH 4 GRAPH 5
Part A - Figure 1UNIVERSITY - WIDE
The City University of New York
2017 through 2019 Three Year Comparison - Full-Time INSTRUCTIONAL STAFF Percentage RepresentationSource: CUNY Workforce Demographics by College, Ethnicity, and Gender 2017, 2018 and 2019 - Includes substitutes, visitings and acting appointments.
NOTE: This report excludes the following types of leaves - Authorized/Unauthorized without pay; Disability no pay; Total Disability; Terminal; and Travia.
5.5
0.2
13.0
1.1
16.0
18.8
56.9
5.6
0.2
12.5
0.9
15.8
18.8
56.5
5.7
0.2
12.1
0.8
14.9
18.7
55.9
0.0 10.0 20.0 30.0 40.0 50.0 60.0 70.0
ItalianAmerican
Am. Ind./Al. Nat.
Asian/Nat. Haw./
Other Pac. Isl.
Two orMore Races
Hispanic
Black
Female
Full-Time Instructional StaffIncludes Full-Time Faculty, Executive Compensation Plan, Higher
Education Officer Series and Other Instructional Staff Titles
2017
2018
2019
5.4
0.2
14.1
0.9
10.3
12.2
49.5
5.3
0.2
13.6
0.8
10.3
12.2
49.4
5.4
0.2
13.2
0.6
9.6
12.3
48.9
0.0 10.0 20.0 30.0 40.0 50.0 60.0
ItalianAmerican
Am. Ind./Al. Nat.
Asian/Nat. Haw./
Other Pac. Isl.
Two orMore Races
Hispanic
Black
Female
Full-Time Faculty
2017
2018
2019
10.1
0.0
7.8
1.4
14.6
17.0
53.4
9.9
0.2
6.8
0.9
12.9
17.3
51.8
11.0
0.0
5.3
0.9
11.7
17.4
50.7
0.0 10.0 20.0 30.0 40.0 50.0 60.0
ItalianAmerican
Am. Ind./Al. Nat.
Asian/Nat. Haw./
Other Pac. Isl.
Two orMore Races
Hispanic
Black
Female
Executive Compensation Plan
2017
2018
2019
5.5
0.2
11.5
1.5
23.5
28.5
69.2
5.5
0.2
10.9
1.2
23.4
28.6
68.9
5.7
0.2
10.4
1.1
22.6
28.7
68.8
0.0 10.0 20.0 30.0 40.0 50.0 60.0 70.0 80.0
ItalianAmerican
Am. Ind./Al. Nat.
Asian/Nat. Haw./
Other Pac. Isl.
Two orMore Races
Hispanic
Black
Female
Higher Education Officer (HEO) Series
2017
2018
2019
4.1
0.3
18.0
0.4
18.6
14.6
42.7
4.9
0.1
17.1
0.3
18.0
15.2
42.6
5.2
0.3
17.0
0.3
18.3
14.8
40.8
0.0 5.0 10.0 15.0 20.0 25.0 30.0 35.0 40.0 45.0 50.0
ItalianAmerican
Am. Ind./Al. Nat.
Asian/Nat. Haw./
Other Pac. Isl.
Two orMore Races
Hispanic
Black
Female
Other Instructional Staff Series Titles (includes Registrar, College Laboratory Technician, Research and Hunter HS/ES Titles)
2017
2018
2019
Page 5 of 46

GRAPH 6
Part A - Figure 2UNIVERSITY - WIDE
The City University of New York
2017 through 2019 Three Year Comparison - Full-Time CLASSIFIED STAFF Percentage RepresentationSource: CUNY Workforce Demographics by College, Ethnicity, and Gender 2017, 2018 and 2019.
GRAPH 7
GRAPH 8 GRAPH 9 GRAPH 10 GRAPH 11
NOTE: This report excludes the following types of leaves - Authorized/Unauthorized without pay; Disability no pay; Total Disability; Terminal; and Travia.
White Collar Titles51.8%
Blue Collar Titles35.4%
Skilled Trade Titles12.7%
Stage and Theatre Group Titles
0.1%
2019White Collar, Blue Collar, Skilled Trades and Stage and Theatre
Percentage Representation
4.2
0.9
0.3
11.4
27.9
34.9
41.9
4.2
0.8
0.3
10.6
28.1
35.0
42.1
4.0
0.7
0.3
10.3
27.8
35.3
41.9
0.0 5.0 10.0 15.0 20.0 25.0 30.0 35.0 40.0 45.0 50.0
ItalianAmerican
Two orMore Races
Am. Ind./Al. Nat.
Asian/Nat. Haw./Other Pac.
Isl.
Hispanic
Black
Female
Full-Time Classified Staff
201720182019
5.1
1.2
0.2
15.4
26.6
29.9
59.6
5.1
1.2
0.2
14.2
26.6
29.9
60.0
4.9
1.0
0.3
14.0
26.1
30.4
60.6
0.0 20.0 40.0 60.0 80.0
ItalianAmerican
Two orMore Races
Am. Ind./Al. Nat.
Asian/Nat. Haw./
Other Pac. Isl.
Hispanic
Black
Female
White Collar Titles
201720182019
8.3
0.0
0.7
4.6
19.3
17.2
1.7
8.3
0.1
0.8
4.2
18.8
17.8
1.7
8.0
0.0
0.8
3.8
18.5
18.0
1.4
0.0 5.0 10.0 15.0 20.0 25.0
ItalianAmerican
Two orMore Races
Am. Ind./Al. Nat.
Asian/Nat. Haw./
Other Pac. Isl.
Hispanic
Black
Female
Skilled Trade Titles
201720182019
1.4
0.8
0.2
8.0
32.8
48.7
30.5
1.4
0.6
0.2
7.6
33.6
48.6
30.6
1.3
0.5
0.2
7.3
33.5
48.7
28.9
0.0 10.0 20.0 30.0 40.0 50.0 60.0
ItalianAmerican
Two orMore Races
Am. Ind./Al. Nat.
Asian/Nat. Haw./
Other Pac. Isl.
Hispanic
Black
Female
Blue Collar Titles
201720182019
0.0
0.0
0.0
0.0
0.0
0.0
33.3
0.0
0.0
0.0
0.0
0.0
0.0
0.0
0.0
0.0
0.0
0.0
25.0
0.0
25.0
0.0 10.0 20.0 30.0 40.0
ItalianAmerican
Two orMore Races
Am. Ind./Al. Nat.
Asian/Nat. Haw./
Other Pac. Isl.
Hispanic
Black
Female
Stage and Theater GroupTitles
201720182019
Page 6 of 46

GRAPH 17
GRAPH 13 GRAPH 18 GRAPH 19
GRAPH 15 GRAPH 20 GRAPH 21GRAPH 16
NOTE: This report excludes the following types of leaves - Authorized/Unauthorized without pay; Disability no pay; Total Disability; Terminal; and Travia.
Part A - Figure 3The City University of New York
FULL-TIME FACULTY BY RANK (including substitutes, visiting and research titles) - University-Wide 2017 through 2019 Percentage RepresentationGRAPH 12
GRAPH 14
CREATE NEW
CLIP/CUNY START
26
.6
3.1
3.1
6.3
0.0
0.0
3.9
27
.3
3.1 3.9 6
.3
0.0
0.0
3.9
26
.2
4.6
2.3
5.4
0.0
0.0
3.8
Female Black Hispanic Asian/Nat. Haw./
Other Pac. Isl.
Am. Ind./Al. Nat.
Two orMore Races
ItalianAmerican
Einstein and Distinguished Professors
2017 2018 2019
40
.2
8.1
7.2 1
0.8
0.1 0.2
7.4
40
.5
8.3
7.8 1
1.8
0.1 0.5
7.1
40
.7
7.8 8.0
12
.5
0.1 0.6
6.9
Female Black Hispanic Asian/Nat. Haw./
Other Pac. Isl.
Am. Ind./Al. Nat.
Two orMore Races
ItalianAmerican
Professors
2017 2018 2019
51
.1
11
.0
9.8
15
.0
0.2 0.5 5
.4
52
.2
10
.4
10
.0 15
.1
0.1 0.7 5
.4
52
.6
10
.4
10
.6 15
.4
0.1 0.6 5
.6
Female Black Hispanic Asian/Nat. Haw./
Other Pac. Isl.
Am. Ind./Al. Nat.
Two orMore Races
ItalianAmerican
Associate Professors
2017 2018 2019
53
.6
13
.8
11
.3 17
.3
0.1 1.0 3
.3
54
.8
14
.3
12
.7 17
.8
0.3 1.2 3
.6
54
.3
14
.6
12
.4 18
.8
0.3 1.4 3.1
Female Black Hispanic Asian/Nat. Haw./
Other Pac. Isl.
Am. Ind./Al. Nat.
Two orMore Races
ItalianAmerican
Assistant Professors
2017 2018 2019
54.3
19.7
10.88.7
0.2 0.85.3
53.1
19.0
12.08.8
0.3 0.95.3
54.1
19.2
11.69.3
0.1 1.15.7
Female Black Hispanic Asian/Nat. Haw./
Other Pac. Isl.
Am. Ind./Al. Nat.
Two orMore Races
ItalianAmerican
TOTAL NON-PROFESSORIATE(Instructors, CLIP/CUNY Start Instructors*, Distinguished Lecturers, and Lecturers)
2017 2018 2019
50
.0
8.1 9.3
4.7
0.0
0.0 2
.3
42
.6
10
.6
7.4
2.1
0.0
0.0 3
.2
45
.1
7.7 8.8
3.3
0.0
0.0 4
.4
Female Black Hispanic Asian/Nat. Haw./
Other Pac. Isl.
Am. Ind./Al. Nat.
Two orMore Races
ItalianAmerican
Distinguished Lecturers
2017 2018 2019
52
.9
20
.8
10
.8
8.4
0.2 0.8 5
.7
52
.3
20
.0
12
.1
9.0
0.3 0.9 5
.5
53
.4
20
.4
11
.6
9.8
0.1 1.1 5
.7
Female Black Hispanic Asian/Nat. Haw./
Other Pac. Isl.
Am. Ind./Al. Nat.
Two orMore Races
ItalianAmerican
Lecturers
2017 2018 2019
53
.2
22
.1
11
.7
11
.7
1.3
0.0
5.2
52
.7
21
.6
14
.9
12
.2
1.4
1.4 5
.4
56
.9
25
.5
15
.7
7.8
2.0
0.0
7.8
Female Black Hispanic Asian/Nat. Haw./
Other Pac. Isl.
Am. Ind./Al. Nat.
Two orMore Races
ItalianAmerican
Instructors
2017 2018 2019
47.8
10.8 9.3
14.2
0.1 0.65.4
48.6
10.8 10.014.6
0.2 0.85.4
48.5
10.6 10.0
15.2
0.2 0.85.3
Female Black Hispanic Asian/Nat. Haw./
Other Pac. Isl.
Am. Ind./Al. Nat.
Two orMore Races
ItalianAmerican
TOTAL PROFESSORIATE (Einstein and Distinguished Professors; Professors, Associate Professors; and Assistant Professors )
2017 2018 2019
66
.7
18
.1
11
.1
11
.8
0.0 1.4 4
.2
66
.0
15
.3
13
.2
9.7
0.0 2.1 4
.9
64
.7
15
.4
12
.5
9.6
0.0 2.2 5
.9
Female Black Hispanic Asian/Nat. Haw./
Other Pac. Isl.
Am. Ind./Al. Nat.
Two orMore Races
ItalianAmerican
CLIP/CUNY Start Instructors (commenced 2017)
2017 2018 2019
Page 7 of 46
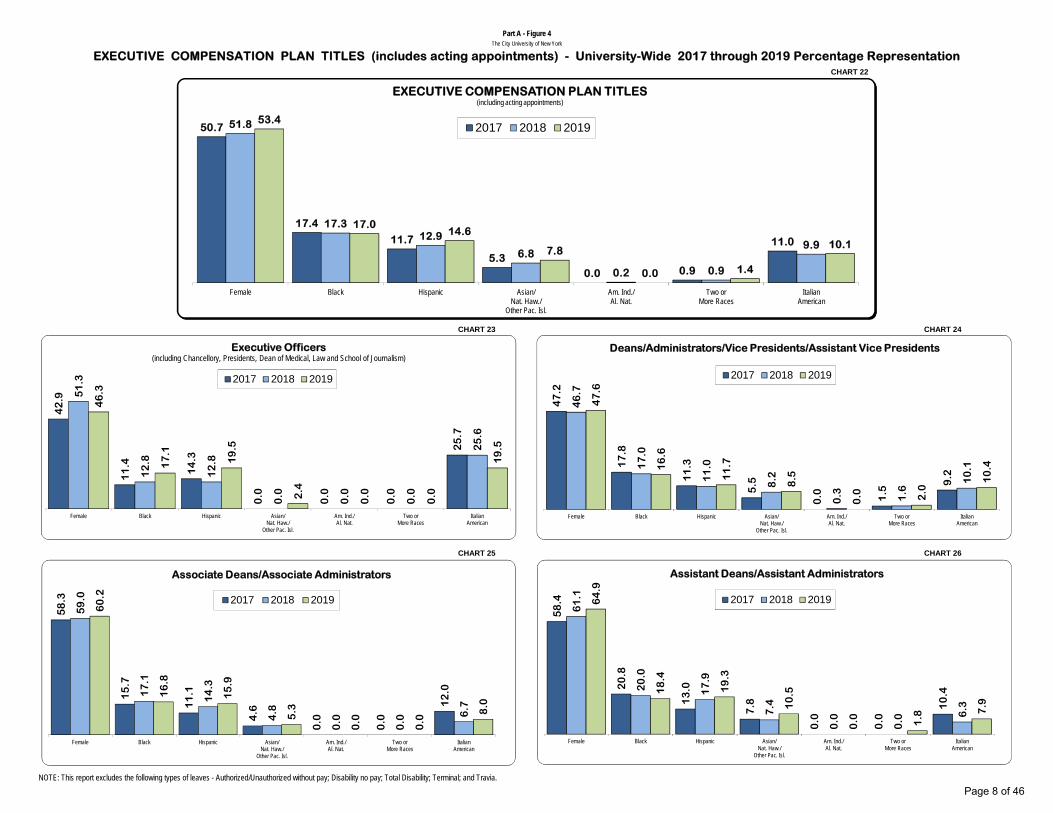
CHART 22
CHART 23 CHART 24
CHART 25 CHART 26
NOTE: This report excludes the following types of leaves - Authorized/Unauthorized without pay; Disability no pay; Total Disability; Terminal; and Travia.
Part A - Figure 4The City University of New York
EXECUTIVE COMPENSATION PLAN TITLES (includes acting appointments) - University-Wide 2017 through 2019 Percentage Representation
50.7
17.4
11.7
5.30.0 0.9
11.0
51.8
17.312.9
6.8
0.2 0.9
9.9
53.4
17.014.6
7.8
0.0 1.4
10.1
Female Black Hispanic Asian/Nat. Haw./
Other Pac. Isl.
Am. Ind./Al. Nat.
Two orMore Races
ItalianAmerican
EXECUTIVE COMPENSATION PLAN TITLES(including acting appointments)
2017 2018 2019
42
.9
11
.4
14
.3
0.0
0.0
0.0
25
.7
51
.3
12
.8
12
.8
0.0
0.0
0.0
25
.6
46
.3
17
.1
19
.5
2.4
0.0
0.0
19
.5
Female Black Hispanic Asian/Nat. Haw./
Other Pac. Isl.
Am. Ind./Al. Nat.
Two orMore Races
ItalianAmerican
Executive Officers(including Chancellory, Presidents, Dean of Medical, Law and School of Journalism)
2017 2018 2019
47
.2
17
.8
11
.3
5.5
0.0 1.5
9.2
46
.7
17
.0
11
.0
8.2
0.3 1.6
10
.1
47
.6
16
.6
11
.7
8.5
0.0 2.0
10
.4
Female Black Hispanic Asian/Nat. Haw./
Other Pac. Isl.
Am. Ind./Al. Nat.
Two orMore Races
ItalianAmerican
Deans/Administrators/Vice Presidents/Assistant Vice Presidents
2017 2018 2019
58
.3
15
.7
11
.1
4.6
0.0
0.0
12
.0
59
.0
17
.1
14
.3
4.8
0.0
0.0
6.7
60
.2
16
.8
15
.9
5.3
0.0
0.0
8.0
Female Black Hispanic Asian/Nat. Haw./
Other Pac. Isl.
Am. Ind./Al. Nat.
Two orMore Races
ItalianAmerican
Associate Deans/Associate Administrators
2017 2018 2019
58
.4
20
.8
13
.0
7.8
0.0
0.0
10
.4
61
.1
20
.0
17
.9
7.4
0.0
0.0 6
.3
64
.9
18
.4
19
.3
10
.5
0.0 1.8 7
.9
Female Black Hispanic Asian/Nat. Haw./
Other Pac. Isl.
Am. Ind./Al. Nat.
Two orMore Races
ItalianAmerican
Assistant Deans/Assistant Administrators
2017 2018 2019
Page 8 of 46

CHART 27
CHART 28 CHART 29
CHART 30 CHART 31
NOTE: This report excludes the following types of leaves - Authorized/Unauthorized without pay; Disability no pay; Total Disability; Terminal; and Travia.
Part A - Figure 5The City University of New York
HIGHER EDUCATION OFFICERS (HEO) SERIES (includes substitutes) - University-Wide 2017 through 2019 Percentage Representation
68.8
28.722.6
10.4
0.2 1.15.7
68.9
28.623.4
10.9
0.2 1.25.5
69.2
28.523.5
11.5
0.2 1.55.5
Female Black Hispanic Asian/Nat. Haw./
Other Pac. Isl.
Am. Ind./Al. Nat.
Two orMore Races
ItalianAmerican
HIGHER EDUCATION OFFICER SERIES TITLES (including substitutes)
2017 2018 2019
60
.8
22
.2
15
.9
9.3
0.0 0.3
9.0
60
.9
22
.6
15
.3
9.5
0.0 0.3
9.3
61
.3
21
.6
15
.7
10
.3
0.0 0.9
9.0
Female Black Hispanic Asian/Nat. Haw./
Other Pac. Isl.
Am. Ind./Al. Nat.
Two orMore Races
ItalianAmerican
Higher Education Officers (HEO)
2017 2018 2019
67
.9
25
.5
19
.5
11
.0
0.1 1.2 7
.0
68
.4
24
.5
21
.4
10
.7
0.1 1.3 6
.7
68
.5
25
.3
20
.9
11
.0
0.1 1.7 7
.0
Female Black Hispanic Asian/Nat. Haw./
Other Pac. Isl.
Am. Ind./Al. Nat.
Two orMore Races
ItalianAmerican
Higher Education Associates (HEA)
2017 2018 2019
70
.7
32
.1
24
.6
8.7
0.3 1.3 4.9
70
.0
32
.6
25
.0
9.7
0.3 1.5 4.5
70
.6
32
.2
25
.5
10
.1
0.3 1.6 4.3
Female Black Hispanic Asian/Nat. Haw./
Other Pac. Isl.
Am. Ind./Al. Nat.
Two orMore Races
ItalianAmerican
Higher Education Assistant (HEa)
2017 2018 2019
73
.3
32
.4
28
.0
13
.1
0.3 1.5 2.8
73
.9
31
.9
29
.1
13
.8
0.4 1.4 3.0
73
.8
31
.4
29
.2
14
.6
0.4 1.7 2.9
Female Black Hispanic Asian/Nat. Haw./
Other Pac. Isl.
Am. Ind./Al. Nat.
Two orMore Races
ItalianAmerican
Assistant to Higher Education Officer (aHEO)
2017 2018 2019
Page 9 of 46

CHART 32
CHART 33 CHART 34
CHART 35 CHART 36
NOTE: This report excludes the following types of leaves - Authorized/Unauthorized without pay; Disability no pay; Total Disability; Terminal; and Travia.
Part A - Figure 6The City University of New York
OTHER INSTRUCTIONAL STAFF SERIES (includes substitutes) - University-Wide 2017 through 2019 Percentage RepresentationNOTE: Other Instructional Staff Series includes: Registrar, College Laboratory Technician, Research, and Hunter High School/Elementary School Titles.
40.8
14.818.3 17.0
0.3 0.35.2
42.6
15.218.0 17.1
0.1 0.34.9
42.7
14.618.6 18.0
0.3 0.44.1
Female Black Hispanic Asian/Nat. Haw./
Other Pac. Isl.
Am. Ind./Al. Nat.
Two orMore Races
ItalianAmerican
OTHER INSTRUCTIONAL STAFF SERIESIncludes: Research Faculty Series, Registrar, College Laboratory Technician, Research ,and Hunter HS/ES Titles
2017 2018 2019
10
0.0
0.0
0.0
0.0
0.0
0.0
0.0
10
0.0
0.0
0.0
0.0
0.0
0.0
0.0
10
0.0
0.0
0.0
0.0
0.0
0.0
0.0
Female Black Hispanic Asian/Nat. Haw./
Other Pac. Isl.
Am. Ind./Al. Nat.
Two orMore Races
ItalianAmerican
Registrar Titles
2017 2018 2019
35
.2
19
.2
20
.3
17
.3
0.2 0.4 5
.8
35
.4
19
.5
20
.0
17
.0
0.2 0.4 5
.2
35
.6
19
.0
20
.5
17
.5
0.4
0.4 4
.3
Female Black Hispanic Asian/Nat. Haw./
Other Pac. Isl.
Am. Ind./Al. Nat.
Two orMore Races
ItalianAmerican
College Laboratory Technician Titles
2017 2018 2019
30
.6
5.6
16
.7 25
.0
1.4
0.0 2.8
44
.4
8.9
18
.9 24
.4
0.0
0.0 3
.3
42
.6
5.3
22
.3 28
.7
0.0
0.0 2.1
Female Black Hispanic Asian/Nat. Haw./
Other Pac. Isl.
Am. Ind./Al. Nat.
Two orMore Races
ItalianAmerican
Research Titles
2017 2018 2019
65
.7
3.5 1
1.9
11
.9
0.0
0.0 4
.2
67
.8
3.5 9
.8 12
.6
0.0
0.0 4
.9
68
.0
4.8 9
.5 12
.9
0.0 0.7 4.8
Female Black Hispanic Asian/Nat. Haw./
Other Pac. Isl.
Am. Ind./Al. Nat.
Two orMore Races
ItalianAmerican
Hunter High School/Elementary School Titles
2017 2018 2019
Page 10 of 46

Part A: Tables - UNIVERSITY-WIDE
Page 11 of 46

# % # % # % # % # % # %Female 3,744 48.9 3,767 49.4 3,725 49.5 (19) (0.5) Female 277 50.7 288 51.8 307 53.4 30 10.8Male 3,908 51.1 3,860 50.6 3,793 50.4 (115) (2.9) Male 269 49.3 268 48.2 266 46.3 (3) (1.1)Non-Binary/Not Specified 0 0.0 0 0.0 4 0.1 4 400.0 Non-Binary/Not Specified 0 0.0 0 0.0 2 0.3 2 200.0Total Minority # 2,746 35.9 2,834 37.2 2,828 37.6 82 3.0 Total Minority # 193 35.3 212 38.1 235 40.9 42 21.8
Am. Ind./Al. Nat. 12 0.2 15 0.2 12 0.2 0 0.0 Am. Ind./Al. Nat. 0 0.0 1 0.2 0 0.0 0 0.0
Asian/Nat.Haw./ Other Pac. Isl. 1,013 13.2 1,036 13.6 1,060 14.1 47 4.6 Asian/Nat.Haw./ Other Pac. Isl. 29 5.3 38 6.8 45 7.8 16 55.2 Black 944 12.3 933 12.2 915 12.2 (29) (3.1) Black 95 17.4 96 17.3 98 17.0 3 3.2
731 9.6 789 10.3 777 10.3 46 6.3 Hispanic 64 11.7 72 12.9 84 14.6 20 31.346 0.6 61 0.8 64 0.9 18 39.1 Two or More Races 5 0.9 5 0.9 8 1.4 3 60.0
# % # % # % 4,495 58.7 4,385 57.5 4,285 57.0 (210) (4.7) White ## 293 53.7 289 52.0 282 49.0 (11) (3.8)Female 7,918 55.9 8,141 56.5 8,215 56.9 297 3.8 411 5.4 408 5.3 403 5.4 (8) (1.9) Italian American 60 11.0 55 9.9 58 10.1 (2) (3.3)Male 6,248 44.1 6,262 43.5 6,212 43.0 (36) (0.6)
Hispanic
Two or More Races
White ##
Italian American
Blank/Not Specified 0 0.0 0 0.0 6 0.1 6 600.0 Blank/Not Specified 0 0.0 0 0.0 0 0.0 0 0.0Non-Binary/Not Specified 0 0.0 0 0.0 10 0.1 10 1000.0 7,652 100.0 7,627 100.0 7,522 100.0 ##### -1.70 546 100.0 556 100.0 575 100.0 29 5.3Total Minority # 6,608 46.6 6,943 48.2 7,094 49.1 486 7.4 TOTAL 7,652 100.0 7,627 100.0 7,522 100.0 (130) (1.7) TOTAL 546 100.0 556 100.0 575 100.0 29 5.3 Am. Ind./Al. Nat. 24 0.2 29 0.2 27 0.2 3 12.5 7,652 100.0 7,627 100.0 7,522 100.0 546 100.0 556 100.0 575 100.0
Asian/Nat.Haw./Other Pac. Isl. 1,711 12.1 1,799 12.5 1,883 13.0 172 10.1 Black 2,650 18.7 2,707 18.8 2,710 18.8 60 2.3 Hispanic 2,110 14.9 2,273 15.8 2,315 16.0 205 9.7
Two or More Races 113 0.8 135 0.9 159 1.1 46 40.7White## 6,752 47.7 6,657 46.2 6,525 45.2 (227) (3.4) # % # % # % # % # % # %Italian American 806 5.7 803 5.6 797 5.5 (9) (1.1) Female 3,592 68.8 3,759 68.9 3,853 69.2 261 7.3 Female 305 40.8 327 42.6 330 42.7 25 8.2Blank/Not Specified 0 0.0 0 0.0 21 0.1 21 2100.0 Male 1,628 31.2 1,693 31.1 1,711 30.7 83 5.1 Male 443 59.2 441 57.4 442 57.2 (1) (0.2)
14,166 100.0 14,403 100.0 14,437 100.0 271 1.9 Non-Binary/Not Specified 0 0.0 0 0.0 3 0.1 3 300.0 Non-Binary/Not Specified 0 0.0 0 0.0 1 0.1 1 100.0TOTAL 14,166 100.0 14,403 100.0 14,437 100.0 271 1.9 Total Minority # 3,290 63.0 3,508 64.3 3,630 65.2 340 10.3 Total Minority # 379 50.7 389 50.7 401 51.9 22 5.8
14,166 100.0 14,403 100.0 14,437 100.0 Am. Ind./Al. Nat. 10 0.2 12 0.2 13 0.2 3 30.0 Am. Ind./Al. Nat. 2 0.3 1 0.1 2 0.3 0 0.00 0 0 Asian/Nat.Haw./ Other Pac. Isl. 542 10.4 594 10.9 639 11.5 97 17.9 Asian/Nat.Haw./ Other Pac. Isl. 127 17.0 131 17.1 139 18.0 12 9.4
Black 1,500 28.7 1,561 28.6 1,584 28.5 84 5.6 Black 111 14.8 117 15.2 113 14.6 2 1.8 Hispanic 1,178 22.6 1,274 23.4 1,310 23.5 132 11.2 Hispanic 137 18.3 138 18.0 144 18.6 7 5.1 Two or More Races** 60 1.1 67 1.2 84 1.5 24 40.0 Two or More Races 2 0.3 2 0.3 3 0.4 1 50.0White ## 1,634 31.3 1,642 30.1 1,621 29.1 (13) (0.8) White ## 330 44.1 341 44.4 337 43.6 7 2.1Italian American 296 5.7 302 5.5 304 5.5 8 2.7 Italian American 39 5.2 38 4.9 32 4.1 (7) (17.9)Blank/Not Specified 0 0.0 0 0.0 12 0.2 12 1200.0 Blank/Not Specified 0 0.0 0 0.0 3 0.4 3 300.0
5,220 100.0 5,452 100.0 5,567 100.0 347 6.6 748 100.0 768 100.0 773 100.0 25 3.3TOTAL 5,220 100.0 5,452 100.0 5,567 100.0 347 6.6 TOTAL 748 100.0 768 100.0 773 100.0 25 3.3
5,220 100.0 5,452 100.0 5,567 100.0 748 100.0 768 100.0 773 100.0
# Includes American Indian/Alaska Native, Asian/Native Hawaiian/Other Pacific Islander, Black, Hispanic, and Two or More Races. ## Does not include Italian American.Source: CUNY Workforce Demographics by College, Ethnicity, and Gender 2017, 2018 and 2019. NOTE: This report excludes the following types of leaves - Authorized/Unauthorized without pay; Disability no pay; Total Disability; Terminal; and Travia.
INSTRUCTIONAL STAFF (Full-Time)
2017
# and % Change between
2017 & 2019
2019
# and % Change between
2017 & 2019
2017
2018
2018 20182019
2019
OTHER INSTRUCTIONAL STAFF (Full-Time) Includes: Registrar, College Laboratory Technicians, Research, and Hunter HS/ES Series Titles.
HIGHER EDUCATION OFFICER (HEO) SERIES
2019
20192017
Part A - TABLE 1The City University of New York
UNIVERSITY - WIDE2017 through 2019 Three Year Comparison - INSTRUCTIONAL STAFF (includes substitutes, visitings and acting appointments)
FACULTY (Full-Time) EXECUTIVE COMPENSATION PLAN TITLES
2017
# and % Change between
2017 & 2019
# and % Change between
2017 & 2019
2018
2018 # and % Change between
2017 & 2019
2017
Page 12 of 46

WHITE COLLAR ^ SKILLED TRADES ^^
# % # % # % # % # % # %Female 1,913 60.6 1,875 60.0 1,816 59.6 (97) (5.1) Female 11 1.4 13 1.7 13 1.7 2 18.2Male 1,245 39.4 1,251 40.0 1,231 40.4 (14) (1.1) Male 756 98.6 757 98.3 732 98.3 (24) (3.2)Non-Binary/Not Specified 0 0.0 0 0.0 1 0.0 1 100.0 Non-Binary/Not Specified 0 0.0 0 0.0 0 0.0 0 0.0Total Minority # 2,265 71.7 2,257 72.2 2,235 73.3 (30) (1.3) Total Minority # 315 41.1 321 41.7 311 41.7 (4) (1.3) Am. Ind./Al. Nat. 8 0.3 7 0.2 7 0.2 (1) (12.5) Am. Ind./Al. Nat. 6 0.8 6 0.8 5 0.7 (1) (16.7) Asian/Nat.Haw./ Other Pac.Isl. 441 14.0 445 14.2 469 15.4 28 6.3 Asian/Nat.Haw./ Other Pac.Isl. 29 3.8 32 4.2 34 4.6 5 17.2 Black 959 30.4 936 29.9 911 29.9 (48) (5.0) Black 138 18.0 137 17.8 128 17.2 (10) (7.2) Hispanic 824 26.1 832 26.6 811 26.6 (13) (1.6) Hispanic 142 18.5 145 18.8 144 19.3 2 1.4
# % # % # % Two or More Races** 33 1.0 37 1.2 37 1.2 4 12.1 Two or More Races** 0 0.0 1 0.1 0 0.0 0 0.0Female 2,549 41.9 2,545 42.1 2,465 41.9 (84) (3.3) White## 737 23.3 710 22.7 657 21.6 (80) (10.9) White## 391 51.0 385 50.0 372 49.9 (19) (4.9)Male 3,536 58.1 3,501 57.9 3,411 58.0 (125) (3.5) Italian American 156 4.9 159 5.1 154 5.1 (2) (1.3) Italian American 61 8.0 64 8.3 62 8.3 1 1.6Non-Binary/Not Specified 0 0.0 0 0.0 3 0.1 3 100.0 Blank/Not Specified 0 0.0 0 0.0 2 0.1 2 100.0 Blank/Not Specified 0 0.0 0 0.0 0 0.0 0 0.0Total Minority # 4,526 74.4 4,527 74.9 4,431 75.4 (95) (2.1) 3,158 100.0 3,126 100.0 3,048 100.0 767 100.0 770 100.0 745 100.0 Am. Ind./Al. Nat. 19 0.3 18 0.3 17 0.3 (2) (10.5) TOTAL 3,158 100.0 3,126 100.0 3,048 100.0 (110) (3.5) TOTAL 767 100.0 770 100.0 745 100.0 (22) (2.9) Asian/Nat.Haw./ Other Pac.Isl. 628 10.3 641 10.6 670 11.4 42 6.7 3,158 100.0 3,126 100.0 3,048 100.0 767 100.0 770 100.0 745 100.0
Black 2,146 35.3 2,117 35.0 2,053 34.9 (93) (4.3) Hispanic 1,689 27.8 1,700 28.1 1,638 27.9 (51) (3.0) Two or More Races** 44 0.7 51 0.8 53 0.9 9 20.5White## 1,313 21.6 1,265 20.9 1,199 20.4 (114) (8.7)Italian American 246 4.0 254 4.2 246 4.2 0 0.0Blank/Not Specified 0 0.0 0 0.0 3 0.1 3 100.0
6,085 100.0 6,046 100.0 5,879 100.0TOTAL 6,085 100.0 6,046 100.0 5,879 100.0 (206) (3.4) # % # % # % # % # % # %
Female 624 28.9 657 30.6 635 30.5 11 1.8 Female 1 25.0 0 0.0 1 33.3 0 0.0Male 1,532 71.1 1,492 69.4 1,446 69.4 (86) (5.6) Male 3 75.0 1 100.0 2 66.7 (1) (33.3)Non-Binary/Not Specified 0 0.0 0 0.0 2 0.1 2 100.0 Non-Binary/Not Specified 0 0.0 0 0.0 0 0.0 0 0.0
6,085 100.0 6,046 100.0 5,879 100.0 Total Minority # 1,945 90.2 1,949 90.7 1,885 90.5 (60) (3.1) Total Minority # 1 25.0 0 0.0 0 0.0 (1) (100.0) Am. Ind./Al. Nat. 5 0.2 5 0.2 5 0.2 0 0.0 Am. Ind./Al. Nat. 0 0.0 0 0.0 0 0.0 0 0.0 Asian/Nat.Haw./ Other Pac.Isl. 158 7.3 164 7.6 167 8.0 9 5.7 Asian/Nat.Haw./ Other Pac.Isl. 0 0.0 0 0.0 0 0.0 0 0.0 Black 1,049 48.7 1,044 48.6 1,014 48.7 (35) (3.3) Black 0 0.0 0 0.0 0 0.0 0 0.0 Hispanic 722 33.5 723 33.6 683 32.8 (39) (5.4) Hispanic 1 25.0 0 0.0 0 0.0 (1) (100.0) Two or More Races** 11 0.5 13 0.6 16 0.8 5 45.5 Two or More Races** 0 0.0 0 0.0 0 0.0 0 0.0White## 182 8.4 169 7.9 167 8.0 (15) (8.2) White## 3 75.0 1 100.0 3 100.0 0 0.0Italian American 29 1.3 31 1.4 30 1.4 1 3.4 Italian American 0 0.0 0 0.0 0 0.0 0 0.0Blank/Not Specified 0 0.0 0 0.0 1 0.0 1 100.0 Blank/Not Specified 0 0.0 0 0.0 0 0.0 0 0.0
2,156 100.0 2,149 100.0 2,083 100.0 4 100.0 1 100.0 3 100.0TOTAL 2,156 100.0 2,149 100.0 2,083 100.0 (73) (3.4) TOTAL 4 100.0 1 100.0 3 100.0 (1) (25.0)
2,156 100.0 2,149 100.0 2,083 100.0 4 100.0 1 100.0 3 100.0
# Includes American Indian/Alaska Native, Asian/Native Hawaiin/Other Pacific Islander, Black, Hispanic, and Two or More Races. ## Does not include Italian American.Source: CUNY Workforce Demographics by College, Ethnicity, and Gender 2017, 2018 and 2019. NOTE: This report excludes the following types of leaves - Authorized/Unauthorized without pay; Disability no pay; Total Disability; Terminal; and Travia.
^Includes the following categories: Accountants; Architects and Engineers; Audio Visual Group; Mail/Message Service Group; Generic White Collar; Gittleson Titles; Information Systems Titles; The Managerial Titles; Print Shop; Public Relations/ Community Service Staff; Purchasing Agents; Radio and Television; and Staff Nurse Groups.
^^Includes the following categories: The Carpenter Series; Cement Masons; Electrician Series; High Pressure Plant Tenders; Laborers; Locksmiths; Maintenance Worker; Mechanic Series; Painter Series; Plasterer Series; Plumber Series; Roofers; and Stationery Engineer Series.
20192019
2019
2018
Part A - TABLE 2The City University of New York
UNIVERSITY - WIDE2017 through 2019 Three Year Comparison - CLASSIFIED STAFF by bargaining unit
# and % Change between
2017 & 2019
2017 2018# and % Change between 2017 & 2019
2017
UNIVERSITY -WIDE CLASSIFIED STAFF (Full-Time)2018 # and %
Change between 2017 & 2019
2017
2017 2018 2019 # and % Change between
2017 & 2019
# and % Change between
2017 & 2019
^^^Includes the following categories: Custodial Series; Security Series; Stock Workers; Supervisors; Exterminators; Elevator Starters; Motor Vehicle Operators; and Gardeners.
BLUE COLLAR ^^^ STAGE AND THEATRE GROUP
2017 2018 2019
Page 13 of 46

BLACK HISPANIC ASIAN/ NAT. HAW./ OTHER PAC. ISL.
AM. IND./ALSK. NAT.
TWO ORMORE RACES
TOTALMINORITY #
BLANK/NOT SPECIFIED
ITALIANAMERICAN WHITE##
NON-BINARY/ NOT SPECIFIED MALE FEMALE
# % # % # % # % # % # % # % # % # % # % # % # % # %
2017 4 3.1 4 3.1 8 6.3 0 0.0 0 0.0 16 12.5 0.0 5 3.9 107 83.6 0.0 94 73.4 34 26.6 128 2018 4 3.1 5 3.9 8 6.3 0 0.0 0 0.0 17 13.3 0.0 5 3.9 106 82.8 0.0 93 72.7 35 27.3 128 2019 6 4.6 3 2.3 7 5.4 0 0.0 0 0.0 16 12.3 0 0.0 5 3.8 109 83.8 0 0.0 96 73.8 34 26.2 1302017 & 2019 # and % change 2 50.0 (1) (25.0) (1) (12.5) 0 0.0 0 0.0 0 0.0 0 0.0 0 0.0 2 1.9 0 0.0 2 2.1 0 0.0 2 1.6Professor 2017 168 8.1 150 7.2 224 10.8 3 0.1 5 0.2 550 26.6 0.0 154 7.4 1,365 66.0 0.0 1,237 59.8 832 40.2 2,069 2018 172 8.3 163 7.8 245 11.8 3 0.1 10 0.5 593 28.5 0.0 147 7.1 1,339 64.4 0.0 1,236 59.5 843 40.5 2,079 2019 162 7.8 167 8.0 261 12.5 2 0.1 12 0.6 604 28.9 1 0.0 145 6.9 1,339 64.1 0 0.0 1,238 59.3 851 40.7 2,0892017 & 2019 # and % change (6) (3.6) 17 11.3 37 16.5 (1) (33.3) 7 140.0 54 9.8 1 100.0 (9) (5.8) (26) (1.9) 0 0.0 1 0.1 19 2.3 20 1.0Associate Professor 2017 238 11.0 211 9.8 324 15.0 4 0.2 11 0.5 788 36.4 0.0 117 5.4 1,257 58.1 0.0 1,058 48.9 1,104 51.1 2,162 2018 223 10.4 213 10.0 323 15.1 3 0.1 15 0.7 777 36.3 0.0 116 5.4 1,245 58.2 0.0 1,023 47.8 1,115 52.2 2,138 2019 227 10.4 230 10.6 334 15.4 3 0.1 12 0.6 806 37.1 2 0.1 121 5.6 1,245 57.3 1 0.0 1,029 47.3 1,144 52.6 2,1742017 & 2019 # and % change (11) (4.6) 19 9.0 10 3.1 (1) (25.0) 1 9.1 18 2.3 2 200.0 4 3.4 (12) (1.0) 1 100.0 (29) (2.7) 40 3.6 12 0.6Assistant Professor 2017 272 13.8 223 11.3 341 17.3 2 0.1 20 1.0 858 43.6 0.0 65 3.3 1,043 53.1 0.0 912 46.4 1,054 53.6 1,966 2018 274 14.3 243 12.7 340 17.8 5 0.3 23 1.2 885 46.3 0.0 68 3.6 959 50.2 0.0 865 45.2 1,047 54.8 1,912 2019 257 14.6 218 12.4 331 18.8 5 0.3 25 1.4 836 47.4 1 0.1 54 3.1 871 49.4 3 0.2 803 45.6 956 54.3 1,7622017 & 2019 # and % change (15) (5.5) (5) (2.2) (10) (2.9) 3 150.0 5 25.0 (22) (2.6) 1 100.0 (11) (16.9) (172) (16.5) 3 300.0 (109) (12.0) (98) (9.3) (204) (10.4)TOTAL PROFESSORIATE 2017 682 10.8 588 9.3 897 14.2 9 0.1 36 0.6 2,212 35.0 0 0.0 341 5.4 3,772 59.6 0 0.0 3,301 52.2 3,024 47.8 6,325 2018 673 10.8 624 10.0 916 14.6 11 0.2 48 0.8 2,272 36.3 0 0.0 336 5.4 3,649 58.3 0 0.0 3,217 51.4 3,040 48.6 6,257 2018 652 10.6 618 10.0 933 15.2 10 0.2 49 0.8 2,262 36.8 4 0.1 325 5.3 3,564 57.9 4 0.1 3,166 51.4 2,985 48.5 6,1552017 & 2019 # and % change (30) (4.4) 30 5.1 36 4.0 1 11.1 13 36.1 50 2.3 4 400.0 (16) (4.7) (208) (5.5) 4 400.0 (135) (4.1) (39) (1.3) (170) (2.7)Instructor 2017 17 22.1 9 11.7 9 11.7 1 1.3 0 0.0 36 46.8 0.0 4 5.2 37 48.1 0.0 36 46.8 41 53.2 77 2018 16 21.6 11 14.9 9 12.2 1 1.4 1 1.4 38 51.4 0.0 4 5.4 32 43.2 0.0 35 47.3 39 52.7 74 2019 13 25.5 8 15.7 4 7.8 1 2.0 0 0.0 26 51.0 0 0.0 4 7.8 21 41.2 0 0.0 22 43.1 29 56.9 512017 & 2019 # and % change (4) (23.5) (1) (11.1) (5) (55.6) 0 0.0 0 0.0 (10) (27.8) 0 0.0 0 0.0 (16) (43.2) 0 0.0 (14) (38.9) (12) (29.3) (26) (33.8)CLIP/CUNY Start Instructor* 2017 26 18.1 16 11.1 17 11.8 0 0.0 2 1.4 61 42.4 0.0 6 4.2 77 53.5 0.0 48 33.3 96 66.7 144 2018 22 15.3 19 13.2 14 9.7 0 0.0 3 2.1 58 40.3 0.0 7 4.9 79 54.9 0.0 49 34.0 95 66.0 144 2019 21 15.4 17 12.5 13 9.6 0 0.0 3 2.2 54 39.7 0 0.0 8 5.9 74 54.4 0 0.0 48 35.3 88 64.7 1362017 & 2019 # and % change (5) (19.2) 1 6.3 (4) (23.5) 0 0.0 1 50.0 (7) (11.5) 0 0.0 2 33.3 (3) (3.9) 0 0.0 0 0.0 (8) (8.3) (8) (5.6)Distinguished Lecturer 2017 7 8.1 8 9.3 4 4.7 0 0.0 0 0.0 19 22.1 0.0 2 2.3 65 75.6 0.0 43 50.0 43 50.0 86 2018 10 10.6 7 7.4 2 2.1 0 0.0 0 0.0 19 20.2 0.0 3 3.2 72 76.6 0.0 54 57.4 40 42.6 94 2019 7 7.7 8 8.8 3 3.3 0 0.0 0 0.0 18 19.8 0 0.0 4 4.4 69 75.8 0 0.0 50 54.9 41 45.1 912017 & 2019 # and % change 0 0.0 0 0.0 (1) (25.0) 0 0.0 0 0.0 (1) (5.3) 0 0.0 2 100.0 4 6.2 0 0.0 7 16.3 (2) (4.7) 5 5.8Lecturer (incl. Clinical Prof. and all Research Faculty Titles) 2017 212 20.8 110 10.8 86 8.4 2 0.2 8 0.8 418 41.0 0.0 58 5.7 544 53.3 0.0 480 47.1 540 52.9 1,020 2018 212 20.0 128 12.1 95 9.0 3 0.3 9 0.9 447 42.2 0.0 58 5.5 553 52.3 0.0 505 47.7 553 52.3 1,058 2019 222 20.4 126 11.6 107 9.8 1 0.1 12 1.1 468 43.0 2 0.2 62 5.7 557 51.1 0 0.0 507 46.6 582 53.4 1,0892017 & 2019 # and % change 10 4.7 16 14.5 21 24.4 (1) (50.0) 4 50.0 50 12.0 2 200.0 4 6.9 13 2.4 0 0.0 27 5.6 42 7.8 69 6.8TOTAL NON-PROFESSORIATE 2017 262 19.7 143 10.8 116 8.7 3 0.2 10 0.8 534 40.2 0 0.0 70 5.3 723 54.5 0 0.0 607 45.7 720 54.3 1,327 2018 260 19.0 165 12.0 120 8.8 4 0.3 13 0.9 562 41.0 0 0.0 72 5.3 736 53.7 0 0.0 643 46.9 727 53.1 1,370 2019 263 19.2 159 11.6 127 9.3 2 0.1 15 1.1 566 41.4 2 0.1 78 5.7 721 52.7 0 0.0 627 45.9 740 54.1 1,3672017 & 2019 # and % change 1 0.4 16 11.2 11 9.5 (1) (33.3) 5 50.0 32 6.0 2 200.0 8 11.4 (2) (0.3) 0 0.0 20 3.3 20 2.8 40 3.0TOTAL PROFESSORIATE and NON-PROFESSORIATE 2017 944 12.3 731 9.6 1,013 13.2 12 0.2 46 0.6 2,746 35.9 0 0.0 411 5.4 4,495 58.7 0 0.0 3,908 51.1 3,744 48.9 7,652 2018 933 12.2 789 10.3 1,036 13.6 15 0.2 61 0.8 2,834 37.2 0 0.0 408 5.3 4,385 57.5 0 0.0 3,860 50.6 3,767 49.4 7,627 2019 915 12.2 777 10.3 1,060 14.1 12 0.2 64 0.9 2,828 37.6 6 0.1 403 5.4 4,285 57.0 4 0.1 3,793 50.4 3,725 49.5 7,5222017 & 2019 # and % change (29) (3.1) 46 6.3 47 4.6 0 0.0 18 39.1 82 3.0 6 600.0 (8) (1.9) (210) (4.7) 4 400.0 (115) (2.9) (19) (0.5) (130) (1.7)
Part A - TABLE 3The City University of New York
FULL-TIME FACULTY by RANK (including substitutes, visiting and research faculty titles) - University-wide
TOTAL
Einstein & Distinguished Professor
* Appointments to the CLIP/CUNY Start Instructor titles commenced in 2017. # Includes American Indian/Alaska Native, Asian/Native Hawaiian/Other Pacific Islander, Black, Hispanic, and Two or More Races.## Does not include Italian American.
Source: CUNY Workforce Demographics by College, Ethnicity, and Gender 2017, 2018 and 2019. NOTE: This report excludes the following types of leaves - Authorized/Unauthorized without pay; Disability no pay; Total Disability; Terminal; and Travia.
Page 14 of 46

BLACKASIAN/ NAT. HAW./ OTHER PAC. ISL.
AM. IND./ALSK. NAT.
TWO ORMORE RACES
TOTALMINORITY #
BLANK/NOT SPECIFIED
ITALIANAMERICAN WHITE##
NON-BINARY/NOT SPECIFIED MALE FEMALE TOTAL
# % # % # % # % # % # % # % # % # % # % # % # % # %Executive Officer* 2017 4 11.4 5 14.3 0 0.0 0 0.0 0 0.0 9 25.7 0.0 9 25.7 17 48.6 0.0 20 57.1 15 42.9 35 2018 5 12.8 5 12.8 0 0.0 0 0.0 0 0.0 10 25.6 0.0 10 25.6 19 48.7 0.0 19 48.7 20 51.3 39 2019 7 17.1 8 19.5 1 2.4 0 0.0 0 0.0 16 39.0 0 0.0 8 19.5 17 41.5 0 0.0 22 53.7 19 46.3 412017 & 2019 # and % change 3 75.0 3 60.0 1 100.0 0 0.0 0 0.0 7 77.8 0 0.0 (1) (11.1) 0 0.0 0 0.0 2 10.0 4 26.7 6 17.1
2017 58 17.8 37 11.3 18 5.5 0 0.0 5 1.5 118 36.2 0.0 30 9.2 178 54.6 0.0 172 52.8 154 47.2 326 2018 54 17.0 35 11.0 26 8.2 1 0.3 5 1.6 121 38.2 0.0 32 10.1 164 51.7 0.0 169 53.3 148 46.7 317 2019 51 16.6 36 11.7 26 8.5 0 0.0 6 2.0 119 38.8 0 0.0 32 10.4 156 50.8 0 0.0 161 52.4 146 47.6 3072017 & 2019 # and % change (7) (12.1) (1) (2.7) 8 44.4 0 0.0 1 20.0 1 0.8 0 0.0 2 6.7 (22) (12.4) 0 0.0 (11) (6.4) (8) (5.2) (19) (5.8)
2017 17 15.7 12 11.1 5 4.6 0 0.0 0 0.0 34 31.5 0.0 13 12.0 61 56.5 0.0 45 41.7 63 58.3 108 2018 18 17.1 15 14.3 5 4.8 0 0.0 0 0.0 38 36.2 0.0 7 6.7 60 57.1 0.0 43 41.0 62 59.0 105 2019 19 16.8 18 15.9 6 5.3 0 0.0 0 0.0 43 38.1 0 0.0 9 8.0 61 54.0 1 0.9 44 38.9 68 60.2 1132017 & 2019 # and % change 2 11.8 6 50.0 1 20.0 0 0.0 0 0.0 9 26.5 0 0.0 (4) (30.8) 0 0.0 1 100.0 (1) (2.2) 5 7.9 5 4.6
2017 16 20.8 10 13.0 6 7.8 0 0.0 0 0.0 32 41.6 0.0 8 10.4 37 48.1 0.0 32 41.6 45 58.4 77 2018 19 20.0 17 17.9 7 7.4 0 0.0 0 0.0 43 45.3 0.0 6 6.3 46 48.4 0.0 37 38.9 58 61.1 95 2019 21 18.4 22 19.3 12 10.5 0 0.0 2 1.8 57 50.0 0 0.0 9 7.9 48 42.1 1 0.9 39 34.2 74 64.9 1142017 & 2019 # and % change 5 31.3 12 120.0 6 100.0 0 0.0 2 200.0 25 78.1 0 0.0 1 12.5 11 29.7 1 100.0 7 21.9 29 64.4 37 48.1
TOTAL 2017 95 17.4 64 11.7 29 5.3 0 0.0 5 0.9 193 35.3 0 0.0 60 11.0 293 53.7 0 0.0 269 49.3 277 50.7 546 2018 96 17.3 72 12.9 38 6.8 1 0.2 5 0.9 212 38.1 0 0.0 55 9.9 289 52.0 0 0.0 268 48.2 288 51.8 556 2019 98 17.0 84 14.6 45 7.8 0 0.0 8 1.4 235 40.9 0 0.0 58 10.1 282 49.0 2 0.3 266 46.3 307 53.4 5752017 & 2019 # and % change 3 3.2 20 31.3 16 55.2 0 0.0 3 60.0 42 21.8 0 0.0 (2) (3.3) (11) (3.8) 2 200.0 (3) (1.1) 30 10.8 29 5.3
Part A - TABLE 4
Deans/Administrators/ VicePres./Assistant Vice Pres.
Associate Deans/ Associate Administrators
Assistant Deans/ Assistant Administrators
* Includes Chancellory, College Presidents, Dean of The Medical School, Dean of The School of Law at Queens College, and Dean of School of Journalism. # Includes American Indian/Alaska Native, Asian/Native Hawaiian/Other Pacific Islander, Black, Hispanic, and Two or More Races.## Does not include Italian American.Source: CUNY Workforce Demographics by College, Ethnicity, and Gender 2017, 2018 and 2019.NOTE: This report excludes the following types of leaves - Authorized/Unauthorized without pay; Disability no pay; Total Disability; Terminal; and Travia.
EXECUTIVE COMPENSATION PLAN TITLES (includes acting appointments) - University-wide The City University of New York
HISPANIC
Page 15 of 46

# % # % # % # % # % # % # % # % # % # % # % # % # %
2017 215 22.2 154 15.9 90 9.3 0 0.0 3 0.3 462 47.7 0.0 87 9.0 419 43.3 0.0 379 39.2 589 60.8 968 2018 220 22.6 149 15.3 93 9.5 0 0.0 3 0.3 465 47.7 0.0 91 9.3 419 43.0 0.0 381 39.1 594 60.9 975 2019 216 21.6 157 15.7 103 10.3 0 0.0 9 0.9 485 48.6 1 0.1 90 9.0 422 42.3 1 0.1 385 38.6 612 61.3 9982017 & 2019 # and % change 1 0.5 3 1.9 13 14.4 0 0.0 6 200.0 23 5.0 1 100.0 3 3.4 3 0.7 1 100.0 6 1.6 23 3.9 30 3.1
2017 323 25.5 247 19.5 139 11.0 1 0.1 15 1.2 725 57.3 0.0 89 7.0 452 35.7 0.0 407 32.1 859 67.9 1,266 2018 330 24.5 289 21.4 144 10.7 2 0.1 18 1.3 783 58.1 0.0 90 6.7 475 35.2 0.0 426 31.6 922 68.4 1,348 2019 342 25.3 282 20.9 149 11.0 2 0.1 23 1.7 798 59.1 0 0.0 95 7.0 458 33.9 1 0.1 425 31.5 925 68.5 1,3512017 & 2019 # and % change 19 5.9 35 14.2 10 7.2 1 100.0 8 53.3 73 10.1 0 0.0 6 6.7 6 1.3 1 100.0 18 4.4 66 7.7 85 6.7
2017 560 32.1 429 24.6 151 8.7 5 0.3 23 1.3 1,168 66.9 0.0 85 4.9 492 28.2 0.0 511 29.3 1,234 70.7 1,745 2018 591 32.6 453 25.0 175 9.7 5 0.3 27 1.5 1,251 69.0 0.0 82 4.5 480 26.5 0.0 543 30.0 1,270 70.0 1,813 2019 594 32.2 470 25.5 187 10.1 5 0.3 29 1.6 1,285 69.7 4 0.2 79 4.3 476 25.8 1 0.1 541 29.3 1,302 70.6 1,8442017 & 2019 # and % change 34 6.1 41 9.6 36 23.8 0 0.0 6 26.1 117 10.0 4 400.0 (6) (7.1) (16) (3.3) 1 100.0 30 5.9 68 5.5 99 5.7
2017 402 32.4 348 28.0 162 13.1 4 0.3 19 1.5 935 75.3 0.0 35 2.8 271 21.8 0.0 331 26.7 910 73.3 1,241 2018 420 31.9 383 29.1 182 13.8 5 0.4 19 1.4 1,009 76.7 0.0 39 3.0 268 20.4 0.0 343 26.1 973 73.9 1,316 2019 432 31.4 401 29.2 200 14.6 6 0.4 23 1.7 1,062 77.3 7 0.5 40 2.9 265 19.3 0 0.0 360 26.2 1,014 73.8 1,3742017 & 2019 # and % change 30 7.5 53 15.2 38 23.5 2 50.0 4 21.1 127 13.6 7 700.0 5 14.3 (6) (2.2) 0 0.0 29 8.8 104 11.4 133 10.7
TOTAL 2017 1,500 28.7 1,178 22.6 542 10.4 10 0.2 60 1.1 3,290 63.0 0 0.0 296 5.7 1,634 31.3 0 0.0 1,628 31.2 3,592 68.8 5,220 2018 1,561 28.6 1,274 23.4 594 10.9 12 0.2 67 1.2 3,508 64.3 0 0.0 302 5.5 1,642 30.1 0 0.0 1,693 31.1 3,759 68.9 5,452 2019 1,584 28.5 1,310 23.5 639 11.5 13 0.2 84 1.5 3,630 65.2 12 0.2 304 5.5 1,621 29.1 3 0.1 1,711 30.7 3,853 69.2 5,5672017 & 2019 # and % change 84 5.6 132 11.2 97 17.9 3 30.0 24 40.0 340 10.3 12 1200.0 8 2.7 (13) (0.8) 3 300.0 83 5.1 261 7.3 347 6.6 # Includes American Indian/Alaska Native, Asian/Native Hawaiian/Other Pacific Islander, Black, Hispanic, and Two or More Races. ## Does not include Italian American.Source: CUNY Workforce Demographics by College, Ethnicity, and Gender 2017, 2018 and 2019. NOTE: This report excludes the following types of leaves - Authorized/Unauthorized without pay; Disability no pay; Total Disability; Terminal; and Travia.
ITALIANAMERICAN
ASIAN/ NAT. HAW./ OTHER PAC. ISL.
Assistant to Higher Education Officer (aHEO)
Higher Education Assistant (HEa)
Higher Education Associate (HEA)
Higher Education Officer (HEO)
TOTALWHITE##BLANK/NOT SPECIFIED
NON-BINARY/ NOT SPECIFIED
Part A - TABLE 5The City University of New York
HIGHER EDUCATION OFFICERS (HEO) SERIES (includes substitutes) - University-wide
BLACKTOTAL
MINORITY #AM. IND./
ALSK. NAT. MALE FEMALEHISPANICTWO OR
MORE RACES
Page 16 of 46

BLACK FEMALE TOTAL# % # % # % # % # % # % # % # % # % # % # % # % # %
2017 0 0.0 0 0.0 0 0.0 0 0.0 0 0.0 0 0.0 0.0 0 0.0 2 100.0 0.0 0 0.0 2 100.0 2 2018 0 0.0 0 0.0 0 0.0 0 0.0 0 0.0 0 0.0 0.0 0 0.0 1 100.0 0.0 0 0.0 1 100.0 1 2019 0 0.0 0 0.0 0 0.0 0 0.0 0 0.0 0 0.0 0 0.0 0 0.0 1 100.0 0 0.0 0 0.0 1 100.0 1
0 0.0 0 0.0 0 0.0 0 0.0 0 0.0 0 0.0 0 0.0 0 0.0 (1) (50.0) 0 0.0 0 0.0 (1) (50.0) (1) (50.0)
2017 102 19.2 108 20.3 92 17.3 1 0.2 2 0.4 305 57.4 0.0 31 5.8 195 36.7 0.0 344 64.8 187 35.2 531 2018 104 19.5 107 20.0 91 17.0 1 0.2 2 0.4 305 57.1 0.0 28 5.2 201 37.6 0.0 345 64.6 189 35.4 534 2019 101 19.0 109 20.5 93 17.5 2 0.4 2 0.4 307 57.8 1 0.2 23 4.3 200 37.7 0 0.0 342 64.4 189 35.6 531
(1) (1.0) 1 0.9 1 1.1 1 100.0 0 0.0 2 0.7 1 100.0 (8) (25.8) 5 2.6 0 0.0 (2) (0.6) 2 1.1 0 0.0
2017 4 5.6 12 16.7 18 25.0 1 1.4 0 0.0 35 48.6 0.0 2 2.8 35 48.6 0.0 50 69.4 22 30.6 72 2018 8 8.9 17 18.9 22 24.4 0 0.0 0 0.0 47 52.2 0.0 3 3.3 40 44.4 0.0 50 55.6 40 44.4 90 2019 5 5.3 21 22.3 27 28.7 0 0.0 0 0.0 53 56.4 0 0.0 2 2.1 39 41.5 0 0.0 54 57.4 40 42.6 94
1 25.0 9 75.0 9 50.0 (1) (100.0) 0 0.0 18 51.4 0 0.0 0 0.0 4 11.4 0 0.0 4 8.0 18 81.8 22 30.6
2017 5 3.5 17 11.9 17 11.9 0 0.0 0 0.0 39 27.3 0.0 6 4.2 98 68.5 0.0 49 34.3 94 65.7 143 2018 5 3.5 14 9.8 18 12.6 0 0.0 0 0.0 37 25.9 0.0 7 4.9 99 69.2 0.0 46 32.2 97 67.8 143 2019 7 4.8 14 9.5 19 12.9 0 0.0 1 0.7 41 27.9 2 1.4 7 4.8 97 66.0 1 0.7 46 31.3 100 68.0 147
2 40.0 (3) (17.6) 2 11.8 0 0.0 1 100.0 2 5.1 2 200.0 1 16.7 (1) (1.0) 1 100.0 (3) (6.1) 6 6.4 4 2.8
TOTAL 2017 111 14.8 137 18.3 127 17.0 2 0.3 2 0.3 379 50.7 0 0.0 39 5.2 330 44.1 0 0.0 443 59.2 305 40.8 748 2018 117 15.2 138 18.0 131 17.1 1 0.1 2 0.3 389 50.7 0 0.0 38 4.9 341 44.4 0 0.0 441 57.4 327 42.6 768 2019 113 14.6 144 18.6 139 18.0 2 0.3 3 0.4 401 51.9 3 0.4 32 4.1 337 43.6 1 0.1 442 57.2 330 42.7 773
2 1.8 7 5.1 12 9.4 0 0.0 1 50.0 22 5.8 3 300.0 (7) (17.9) 7 2.1 1 100.0 (1) (0.2) 25 8.2 25 3.3
BLANK/NOT SPECIFIED
NON-BINARY/ NOT SPECIFIED
# Includes American Indian/Alaska Native, Asian/Native Hawaiian/Other Pacific Islander, Black, Hispanic, and Two or More Races. ## Does not include Italian American.Source: CUNY Workforce Demographics by College, Ethnicity, and Gender 2017, 2018 and 2019. NOTE: This report excludes the following types of leaves - Authorized/Unauthorized without pay; Disability no pay; Total Disability; Terminal; and Travia.
Hunter College H.S./E.S. Titles
Research Series
Registrar Series
2017 & 2019 # and % change
2017 & 2019 # and % change
2017 & 2019 # and % change
2017 & 2019 # and % change
Part A - TABLE 6The City University of New York
OTHER INSTRUCTIONAL STAFF TITLES (includes substitutes) - University-wide
2017 & 2019 # and % change
College Laboratory Technician Series
TOTALMINORITY #
ITALIANAMERICAN WHITE##
AM. IND./ALSK. NAT.
ASIAN/ NAT. HAW./ OTHER PAC. ISL. MALEHISPANIC
TWO ORMORE RACES
Page 17 of 46
Part B: COLLEGE TABLES
Page 18 of 46

FACULTY (Full-Time) EXECUTIVE COMPENSATION PLAN TITLES2017 2018 2019 2017 2018 2019# % # % # % # % # % # %
Female 200 39.8 202 39.2 199 39.3 (1) (0.5) Female 17 53.1 17 51.5 18 54.5 1 5.9
Male 302 60.2 313 60.8 308 60.7 6 2.0 Male 15 46.9 16 48.5 15 45.5 0 0.0
Non-Binary/Not Specified 0 0.0 0 0.0 0 0.0 0 0.0 Non-Binary/Not Specified 0 0.0 0 0.0 0 0.0 0 0.0Total Minority # 144 28.7 156 30.3 159 31.4 15 10.4 Total Minority # 8 25.0 9 27.3 11 33.3 3 37.5
Am. Ind./Al. Nat. 0 0.0 1 0.2 1 0.2 1 100.0 Am. Ind./Al. Nat. 0 0.0 0 0.0 0 0.0 0 0.0
Asian/Nat.Haw./ Other Pac. Isl. 91 18.1 92 17.9 96 18.9 5 5.5 Asian/Nat.Haw./ Other Pac. Isl. 3 9.4 3 9.1 3 9.1 0 0.0
INSTRUCTIONAL STAFF (Full-Time) Black 25 5.0 30 5.8 27 5.3 2 8.0 Black 4 12.5 4 12.1 5 15.2 1 25.0
Hispanic 26 5.2 32 6.2 34 6.7 8 30.8 Hispanic 1 3.1 2 6.1 3 9.1 2 200.0 Two or More Races 2 0.4 1 0.2 1 0.2 (1) (50.0) Two or More Races 0 0.0 0 0.0 0 0.0 0 0.0
# % # % # % White## 333 66.3 334 64.9 323 63.7 (10) (3.0) White## 22 68.8 23 69.7 21 63.6 (1) (4.5)
Female 449 51.4 471 52.0 480 53.2 31 6.9 Italian American 25 5.0 25 4.9 24 4.7 (1) (4.0) Italian American 2 6.3 1 3.0 1 3.0 (1) (50.0)
Male 425 48.6 434 48.0 422 46.8 (3) (0.7) Blank/Not Specified 0 0.0 0 0.0 1 0.2 1 100.0 Blank/Not Specified 0 0.0 0 0.0 0 0.0 0 0.0
Non-Binary/Not Specified 0 0.0 0 0.0 0 0.0 0 0.0 0 100.0 0 100.0 0 100.0 0 100.0 0 100.0 0 100.0Total Minority # 344 39.4 371 41.0 383 42.5 39 11.3 TOTAL 502 100.0 515 100.0 507 100.0 5 1.0 TOTAL 32 100.0 33 100.0 33 100.0 1 3.1
Am. Ind./Al. Nat. 0 0.0 1 0.1 1 0.1 1 100.0 0 0.0 0 0.0 0 0.0 0 0.0 0 0.0 0 0.0
Asian/Nat.Haw./Other Pac. Isl. 144 16.5 153 16.9 159 17.6 15 10.4 0 0.0 0 0.0 0 0.0 0 0.0 0 0.0 0 0.0
Black 102 11.7 108 11.9 109 12.1 7 6.9
Hispanic 95 10.9 107 11.8 112 12.4 17 17.9 Two or More Races 3 0.3 2 0.2 2 0.2 (1) (33.3)
White## 488 55.8 493 54.5 478 53.0 (10) (2.0) # % # % # % # % # % # %
Italian American 42 4.8 41 4.5 40 4.4 (2) (4.8) Female 229 69.0 248 71.1 258 72.9 29 12.7 Female 3 37.5 4 50.0 5 62.5 2 66.7
Blank/Not Specified 0 0.0 0 0.0 1 0.1 1 100.0 Male 103 31.0 101 28.9 96 27.1 (7) (6.8) Male 5 62.5 4 50.0 3 37.5 (2) (40.0)
0 0.0 0 0.0 0 0.0 Non-Binary/Not Specified 0 0.0 0 0.0 0 0.0 0 0.0 Non-Binary/Not Specified 0 0.0 0 0.0 0 0.0 0 0.0
TOTAL 874 100.0 905 100.0 902 100.0 28 3.2 Total Minority # 187 56.3 202 57.9 209 59.0 22 11.8 Total Minority # 5 62.5 4 50.0 4 50.0 (1) (20.0)
0 0.0 0 0.0 0 0.0 Am. Ind./Al. Nat. 0 0.0 0 0.0 0 0.0 0 0.0 Am. Ind./Al. Nat. 0 0.0 0 0.0 0 0.0 0 0.0
0 0.0 0 0.0 0 0.0 Asian/Nat.Haw./ Other Pac. Isl. 47 14.2 55 15.8 57 16.1 10 21.3 Asian/Nat.Haw./ Other Pac. Isl. 3 37.5 3 37.5 3 37.5 0 0.0
425 434 422 Black 71 21.4 73 20.9 76 21.5 5 7.0 Black 2 25.0 1 12.5 1 12.5 (1) (50.0)
102 108 109 Hispanic 68 20.5 73 20.9 75 21.2 7 10.3 Hispanic 0 0.0 0 0.0 0 0.0 0 0.0
25 25 29 Two or More Races 1 0.3 1 0.3 1 0.3 0 0.0 Two or More Races 0 0.0 0 0.0 0 0.0 0 0.0
70 82 83 White## 130 39.2 132 37.8 130 36.7 0 0.0 White## 3 37.5 4 50.0 4 50.0 1 33.3
Italian American 15 4.5 15 4.3 15 4.2 0 0.0 Italian American 0 0.0 0 0.0 0 0.0 0 0.0
95 107 112 Blank/Not Specified 0 0.0 0 0.0 0 0.0 0 0.0 Blank/Not Specified 0 0.0 0 0.0 0 0.0 0 0.0
3 2 2 0 100.0 0 100.0 0 100.0 0 100.0 0 100.0 0 100.0
488 493 478 TOTAL 332 100.0 349 100.0 354 100.0 22 6.6 TOTAL 8 100.0 8 100.0 8 100.0 0 0.00 0.0 0 0.0 0 0.0 0 0.0 0 0.0 0 0.0
2017
OTHER INSTRUCTIONAL STAFF (Full-Time) Includes: Registrar, College Laboratory Technicians, Research, and Hunter HS/ES Series Titles.
HIGHER EDUCATION OFFICER (HEO) SERIES
2019
2017 2018
# Includes American Indian/Alaska Native, Asian/Native Hawaiian/Other Pacific Islander, Black, Hispanic, and Two or More Races. ## Does not include Italian American.Source: CUNY Workforce Demographics by College, Ethnicity, and Gender 2017, 2018 and 2019. NOTE: This report excludes the following types of leaves - Authorized/Unauthorized without pay; Disability no pay; Total Disability; Terminal; and Travia.
2019 # and % Change between
2017 & 2019
2017 2018 2019 # and % Change between
2017 & 2019
Part B - TABLE VII - AThe City University of New York
BARUCH COLLEGE
# and % Change between
2017 & 2019
2017 through 2019 Three Year Comparison - INSTRUCTIONAL STAFF (includes substitutes, visitings and acting appointments)
# and % Change between
2017 & 2019
# and % Change between
2017 & 2019
2018
Page 19 of 46

2017 2018 2019 2017 2018 2019# % # % # % # % # % # %
Female 252 46.8 248 46.7 242 46.6 (10) (4.0) Female 12 40.0 16 51.6 18 58.1 6 50.0
Male 286 53.2 283 53.3 277 53.4 (9) (3.1) Male 18 60.0 15 48.4 13 41.9 (5) (27.8)
Non-Binary/Not Specified 0 0.0 0 0.0 0 0.0 0 0.0 Non-Binary/Not Specified 0 0.0 0 0.0 0 0.0 0 0.0Total Minority # 146 27.1 154 29.0 158 30.4 12 8.2 Total Minority # 9 30.0 12 38.7 11 35.5 2 22.2
Am. Ind./Al. Nat. 1 0.2 1 0.2 0 0.0 (1) (100.0) Am. Ind./Al. Nat. 0 0.0 0 0.0 0 0.0 0 0.0
Asian/Nat.Haw./ Other Pac. Isl. 68 12.6 72 13.6 75 14.5 7 10.3 Asian/Nat.Haw./ Other Pac. Isl. 1 3.3 1 3.2 1 3.2 0 0.0
INSTRUCTIONAL STAFF (Full-Time) Black 36 6.7 37 7.0 38 7.3 2 5.6 Black 7 23.3 10 32.3 8 25.8 1 14.3
Hispanic 38 7.1 41 7.7 41 7.9 3 7.9 Hispanic 1 3.3 1 3.2 2 6.5 1 100.0 Two or More Races 3 0.6 3 0.6 4 0.8 1 33.3 Two or More Races 0 0.0 0 0.0 0 0.0 0 0.0
# % # % # % White## 368 68.4 350 65.9 336 64.7 (32) (8.7) White## 16 53.3 15 48.4 16 51.6 0 0.0
Female 443 51.0 442 51.2 439 51.5 (4) (0.9) Italian American 24 4.5 27 5.1 24 4.6 0 0.0 Italian American 5 16.7 4 12.9 4 12.9 (1) (20.0)
Male 425 49.0 421 48.8 413 48.5 (12) (2.8) Blank/Not Specified 0 0.0 0 0.0 1 0.2 1 100.0 Blank/Not Specified 0 0.0 0 0.0 0 0.0 0 0.0
Non-Binary/Not Specified 0 0.0 0 0.0 0 0.0 0 0.0 0 100.0 0 100.0 0 100.0 0 100.0 0 100.0 0 100.0Total Minority # 314 36.2 329 38.1 336 39.4 22 7.0 TOTAL 538 100.0 531 100.0 519 100.0 (19) (3.5) TOTAL 30 100.0 31 100.0 31 100.0 1 3.3
Am. Ind./Al. Nat. 1 0.1 1 0.1 0 0.0 (1) (100.0) 0 0.0 0 0.0 0 0.0 0 0.0 0 0.0 0 0.0
Asian/Nat.Haw./Other Pac. Isl. 96 11.1 102 11.8 108 12.7 12 12.5 0 0.0 0 0.0 0 0.0 0 0.0 0 0.0 0 0.0
Black 128 14.7 130 15.1 131 15.4 3 2.3
Hispanic 84 9.7 91 10.5 90 10.6 6 7.1 Two or More Races 5 0.6 5 0.6 7 0.8 2 40.0
White## 489 56.3 468 54.2 455 53.4 (34) (7.0) # % # % # % # % # % # %
Italian American 65 7.5 66 7.6 59 6.9 (6) (9.2) Female 165 65.5 165 64.7 167 65.0 2 1.2 Female 14 29.2 13 28.3 12 26.7 (2) (14.3)
Blank/Not Specified 0 0.0 0 0.0 2 0.2 2 100.0 Male 87 34.5 90 35.3 90 35.0 3 3.4 Male 34 70.8 33 71.7 33 73.3 (1) (2.9)
0 0.0 0 0.0 0 0.0 Non-Binary/Not Specified 0 0.0 0 0.0 0 0.0 0 0.0 Non-Binary/Not Specified 0 0.0 0 0.0 0 0.0 0 0.0
TOTAL 868 100.0 863 100.0 852 100.0 (16) (1.8) Total Minority # 142 56.3 147 57.6 150 58.4 8 5.6 Total Minority # 17 35.4 16 34.8 17 37.8 0 0.0
0 0.0 0 0.0 0 0.0 Am. Ind./Al. Nat. 0 0.0 0 0.0 0 0.0 0 0.0 Am. Ind./Al. Nat. 0 0.0 0 0.0 0 0.0 0 0.0
0 0.0 0 0.0 0 0.0 Asian/Nat.Haw./ Other Pac. Isl. 23 9.1 25 9.8 28 10.9 5 21.7 Asian/Nat.Haw./ Other Pac. Isl. 4 8.3 4 8.7 4 8.9 0 0.0
425 421 413 Black 78 31.0 76 29.8 78 30.4 0 0.0 Black 7 14.6 7 15.2 7 15.6 0 0.0
128 130 131 Hispanic 39 15.5 44 17.3 41 16.0 2 5.1 Hispanic 6 12.5 5 10.9 6 13.3 0 0.0
21 24 25 Two or More Races 2 0.8 2 0.8 3 1.2 1 50.0 Two or More Races 0 0.0 0 0.0 0 0.0 0 0.0
63 67 65 White## 81 32.1 80 31.4 79 30.7 (2) (2.5) White## 24 50.0 23 50.0 24 53.3 0 0.0
Italian American 29 11.5 28 11.0 27 10.5 (2) (6.9) Italian American 7 14.6 7 15.2 4 8.9 (3) (42.9)
84 91 90 Blank/Not Specified 0 0.0 0 0.0 1 0.4 1 100.0 Blank/Not Specified 0 0.0 0 0.0 0 0.0 0 0.0
5 5 7 0 100.0 0 100.0 0 100.0 0 100.0 0 100.0 0 100.0
489 468 455 TOTAL 252 100.0 255 100.0 257 100.0 5 2.0 TOTAL 48 100.0 46 100.0 45 100.0 (3) (6.3)0 0.0 0 0.0 0 0.0 0 0.0 0 0.0 0 0.0
# Includes American Indian/Alaska Native, Asian/Native Hawaiian/Other Pacific Islander, Black, Hispanic, and Two or More Races. ## Does not include Italian American.Source: CUNY Workforce Demographics by College, Ethnicity, and Gender 2017, 2018 and 2019. NOTE: This report excludes the following types of leaves - Authorized/Unauthorized without pay; Disability no pay; Total Disability; Terminal; and Travia.
2017
OTHER INSTRUCTIONAL STAFF (Full-Time) Includes: Registrar, College Laboratory Technicians, Research, and Hunter HS/ES Series Titles.
HIGHER EDUCATION OFFICER (HEO) SERIES
2017 2018
Part B - TABLE VII - B
# and % Change between
2017 & 2019
The City University of New York
# and % Change between
2017 & 2019
2017 through 2019 Three Year Comparison - INSTRUCTIONAL STAFF (includes substitutes, visitings and acting appointments)BROOKLYN COLLEGE
EXECUTIVE COMPENSATION PLAN TITLESFACULTY (Full-Time)# and %
Change between 2017 & 2019
2019
2018 2019
# and % Change between
2017 & 2019
2017 2018 2019 # and % Change between
2017 & 2019
Page 20 of 46

2017 2018 2019 2017 2018 2019# % # % # % # % # % # %
Female 209 36.8 204 36.9 198 36.9 (11) (5.3) Female 10 38.5 8 36.4 9 39.1 (1) (10.0)
Male 359 63.2 349 63.1 337 62.9 (22) (6.1) Male 16 61.5 14 63.6 14 60.9 (2) (12.5)
Non-Binary/Not Specified 0 0.0 0 0.0 1 0.2 1 100.0 Non-Binary/Not Specified 0 0.0 0 0.0 0 0.0 0 0.0Total Minority # 189 33.3 187 33.8 183 34.1 (6) (3.2) Total Minority # 10 38.5 8 36.4 8 34.8 (2) (20.0)
Am. Ind./Al. Nat. 0 0.0 0 0.0 0 0.0 0 0.0 Am. Ind./Al. Nat. 0 0.0 0 0.0 0 0.0 0 0.0
Asian/Nat.Haw./ Other Pac. Isl. 90 15.8 88 15.9 86 16.0 (4) (4.4) Asian/Nat.Haw./ Other Pac. Isl. 0 0.0 0 0.0 0 0.0 0 0.0
INSTRUCTIONAL STAFF (Full-Time) Black 49 8.6 47 8.5 47 8.8 (2) (4.1) Black 7 26.9 5 22.7 5 21.7 (2) (28.6)
Hispanic 50 8.8 52 9.4 50 9.3 0 0.0 Hispanic 3 11.5 3 13.6 3 13.0 0 0.0 Two or More Races 0 0.0 0 0.0 0 0.0 0 0.0 Two or More Races 0 0.0 0 0.0 0 0.0 0 0.0
# % # % # % White## 360 63.4 348 62.9 334 62.3 (26) (7.2) White## 12 46.2 11 50.0 12 52.2 0 0.0
Female 404 43.1 398 43.3 389 43.6 (15) (3.7) Italian American 19 3.3 18 3.3 19 3.5 0 0.0 Italian American 4 15.4 3 13.6 3 13.0 (1) (25.0)
Male 533 56.9 521 56.7 503 56.3 (30) (5.6) Blank/Not Specified 0 0.0 0 0.0 0 0.0 0 0.0 Blank/Not Specified 0 0.0 0 0.0 0 0.0 0 0.0
Non-Binary/Not Specified 0 0.0 0 0.0 1 0.1 0 0.0 0 100.0 0 100.0 0 100.0 0 100.0 0 100.0 0 100.0Total Minority # 425 45.4 420 45.7 415 46.5 (10) (2.4) TOTAL 568 100.0 553 100.0 536 100.0 (32) (5.6) TOTAL 26 100.0 22 100.0 23 100.0 (3) (11.5)
Am. Ind./Al. Nat. 0 0.0 0 0.0 0 0.0 0 0.0 0 0.0 0 0.0 0 0.0 0 0.0 0 0.0 0 0.0
Asian/Nat.Haw./Other Pac. Isl. 144 15.4 142 15.5 142 15.9 (2) (1.4) 0 0.0 0 0.0 0 0.0 0 0.0 0 0.0 0 0.0
Black 141 15.0 138 15.0 138 15.5 (3) (2.1)
Hispanic 139 14.8 140 15.2 132 14.8 (7) (5.0) Two or More Races 1 0.1 0 0.0 3 0.3 2 200.0
White## 477 50.9 465 50.6 445 49.8 (32) (6.7) # % # % # % # % # % # %
Italian American 35 3.7 34 3.7 33 3.7 (2) (5.7) Female 166 60.1 167 59.6 164 60.5 (2) (1.2) Female 19 28.4 19 29.7 18 28.6 (1) (5.3)
Blank/Not Specified 0 0.0 0 0.0 0 0.0 0 0.0 Male 110 39.9 113 40.4 107 39.5 (3) (2.7) Male 48 71.6 45 70.3 45 71.4 (3) (6.3)
0 0.0 0 0.0 0 0.0 Non-Binary/Not Specified 0 0.0 0 0.0 0 0.0 0 0.0 Non-Binary/Not Specified 0 0.0 0 0.0 0 0.0 0 0.0
TOTAL 937 100.0 919 100.0 893 100.0 (44) (4.7) Total Minority # 194 70.3 194 69.3 193 71.2 (1) (0.5) Total Minority # 32 47.8 31 48.4 31 49.2 (1) (3.1)
0 0.0 0 0.0 0 0.0 Am. Ind./Al. Nat. 0 0.0 0 0.0 0 0.0 0 0.0 Am. Ind./Al. Nat. 0 0.0 0 0.0 0 0.0 0 0.0
0 0.0 0 0.0 0 0.0 Asian/Nat.Haw./ Other Pac. Isl. 33 12.0 34 12.1 36 13.3 3 9.1 Asian/Nat.Haw./ Other Pac. Isl. 21 31.3 20 31.3 20 31.7 (1) (4.8)
533 521 503 Black 81 29.3 82 29.3 82 30.3 1 1.2 Black 4 6.0 4 6.3 4 6.3 0 0.0
141 138 138 Hispanic 79 28.6 78 27.9 72 26.6 (7) (8.9) Hispanic 7 10.4 7 10.9 7 11.1 0 0.0
17 16 16 Two or More Races 1 0.4 0 0.0 3 1.1 2 200.0 Two or More Races 0 0.0 0 0.0 0 0.0 0 0.0
122 124 116 White## 72 26.1 76 27.1 70 25.8 (2) (2.8) White## 33 49.3 30 46.9 29 46.0 (4) (12.1)
Italian American 10 3.6 10 3.6 8 3.0 (2) (20.0) Italian American 2 3.0 3 4.7 3 4.8 1 50.0
139 140 132 Blank/Not Specified 0 0.0 0 0.0 0 0.0 0 0.0 Blank/Not Specified 0 0.0 0 0.0 0 0.0 0 0.0
1 0 3 0 100.0 0 100.0 0 100.0 0 100.0 0 100.0 0 100.0
477 465 445 TOTAL 276 100.0 280 100.0 271 100.0 (5) (1.8) TOTAL 67 100.0 64 100.0 63 100.0 (4) (6.0)0 0.0 0 0.0 0 0.0 0 0.0 0 0.0 0 0.0
# Includes American Indian/Alaska Native, Asian/Native Hawaiian/Other Pacific Islander, Black, Hispanic, and Two or More Races. ## Does not include Italian American.Source: CUNY Workforce Demographics by College, Ethnicity, and Gender 2017, 2018 and 2019. NOTE: This report excludes the following types of leaves - Authorized/Unauthorized without pay; Disability no pay; Total Disability; Terminal; and Travia.
2017
OTHER INSTRUCTIONAL STAFF (Full-Time) Includes: Registrar, College Laboratory Technicians, Research, and Hunter HS/ES Series Titles.
HIGHER EDUCATION OFFICER (HEO) SERIES
2017 2018
Part B - TABLE VII - C
# and % Change between
2017 & 2019
The City University of New York
# and % Change between
2017 & 2019
2017 through 2019 Three Year Comparison - INSTRUCTIONAL STAFF (includes substitutes, visitings and acting appointments)CITY COLLEGE
EXECUTIVE COMPENSATION PLAN TITLESFACULTY (Full-Time)# and %
Change between 2017 & 2019
2019
2018 2019
# and % Change between
2017 & 2019
2017 2018 2019 # and % Change between
2017 & 2019
Page 21 of 46

2017 2018 2019 2017 2018 2019# % # % # % # % # % # %
Female 84 45.4 82 48.2 80 47.3 (4) (4.8) Female 9 52.9 11 55.0 10 52.6 1 11.1
Male 101 54.6 88 51.8 89 52.7 (12) (11.9) Male 8 47.1 9 45.0 9 47.4 1 12.5
Non-Binary/Not Specified 0 0.0 0 0.0 0 0.0 0 0.0 Non-Binary/Not Specified 0 0.0 0 0.0 0 0.0 0 0.0Total Minority # 156 84.3 141 82.9 140 82.8 (16) (10.3) Total Minority # 14 82.4 17 85.0 17 89.5 3 21.4
Am. Ind./Al. Nat. 0 0.0 0 0.0 0 0.0 0 0.0 Am. Ind./Al. Nat. 0 0.0 0 0.0 0 0.0 0 0.0
Asian/Nat.Haw./ Other Pac. Isl. 20 10.8 15 8.8 14 8.3 (6) (30.0) Asian/Nat.Haw./ Other Pac. Isl. 0 0.0 1 5.0 2 10.5 2 100.0
INSTRUCTIONAL STAFF (Full-Time) Black 122 65.9 109 64.1 110 65.1 (12) (9.8) Black 11 64.7 14 70.0 13 68.4 2 18.2
Hispanic 10 5.4 12 7.1 11 6.5 1 10.0 Hispanic 3 17.6 2 10 2 10.5 (1) (33.3) Two or More Races 4 2.2 5 2.9 5 3.0 1 25.0 Two or More Races 0 0.0 0 0.0 0 0.0 0 0.0
# % # % # % White## 28 15.1 27 15.9 27 16.0 (1) (3.6) White## 3 17.6 3 15.0 2 10.5 (1) (33.3)
Female 229 55.4 231 56.3 232 57.1 3 1.3 Italian American 1 0.5 2 1.2 2 1.2 1 100.0 Italian American 0 0.0 0 0.0 0 0.0 0 0.0
Male 184 44.6 179 43.7 174 42.9 (10) (5.4) Blank/Not Specified 0 0.0 0 0.0 0 0.0 0 0.0 Blank/Not Specified 0 0.0 0 0.0 0 0.0 0 0.0
Non-Binary/Not Specified 0 0.0 0 0.0 0 0.0 0 0.0 0 100.0 0 100.0 0 100.0 0 100.0 0 100.0 0 100.0Total Minority # 370 89.6 363 88.5 362 89.2 (8) (2.2) TOTAL 185 100.0 170 100.0 169 100.0 (16) (8.6) TOTAL 17 100.0 20 100.0 19 100.0 2 11.8
Am. Ind./Al. Nat. 0 0.0 0 0.0 0 0.0 0 0.0 0 0.0 0 0.0 0 0.0 0 0.0 0 0.0 0 0.0
Asian/Nat.Haw./Other Pac. Isl. 29 7.0 26 6.3 26 6.4 (3) (10.3) 0 0.0 0 0.0 0 0.0 0 0.0 0 0.0 0 0.0
Black 301 72.9 294 71.7 295 72.7 (6) (2.0)
Hispanic 32 7.7 33 8.0 32 7.9 0 0.0 Two or More Races 8 1.9 10 2.4 9 2.2 1 12.5
White## 41 9.9 44 10.7 41 10.1 0 0.0 # % # % # % # % # % # %
Italian American 2 0.5 3 0.7 3 0.7 1 50.0 Female 128 68.4 129 66.8 133 69.3 5 3.9 Female 8 33.3 9 33.3 9 34.6 1 12.5
Blank/Not Specified 0 0.0 0 0.0 0 0.0 0 0.0 Male 59 31.6 64 33.2 59 30.7 0 0.0 Male 16 66.7 18 66.7 17 65.4 1 6.3
0 0.0 0 0.0 0 0.0 Non-Binary/Not Specified 0 0.0 0 0.0 0 0.0 0 0.0 Non-Binary/Not Specified 0 0.0 0 0.0 0 0.0 0 0.0
TOTAL 413 100.0 410 100.0 406 100.0 (7) (1.7) Total Minority # 178 95.2 181 93.8 182 94.8 4 2.2 Total Minority # 22 91.7 24 88.9 23 88.5 1 4.5
0 0.0 0 0.0 0 0.0 Am. Ind./Al. Nat. 0 0.0 0 0.0 0 0.0 0 0.0 Am. Ind./Al. Nat. 0 0.0 0 0.0 0 0.0 0 0.0
0 0.0 0 0.0 0 0.0 Asian/Nat.Haw./ Other Pac. Isl. 4 2.1 5 2.6 5 2.6 1 25.0 Asian/Nat.Haw./ Other Pac. Isl. 5 20.8 5 18.5 5 19.2 0 0.0
184 179 174 Black 152 81.3 153 79.3 155 80.7 3 2.0 Black 16 66.7 18 66.7 17 65.4 1 6.3
301 294 295 Hispanic 18 9.6 18 9.3 18 9.4 0 0.0 Hispanic 1 4.2 1 3.7 1 3.8 0 0.0
7 6 5 Two or More Races 4 2.1 5 2.6 4 2.1 0 0.0 Two or More Races 0 0.0 0 0.0 0 0.0 0 0.0
25 27 27 White## 8 4.3 11 5.7 9 4.7 1 12.5 White## 2 8.3 3 11.1 3 11.5 1 50.0
Italian American 1 0.5 1 0.5 1 0.5 0 0.0 Italian American 0 0.0 0 0.0 0 0.0 0 0.0
32 33 32 Blank/Not Specified 0 0.0 0 0.0 0 0.0 0 0.0 Blank/Not Specified 0 0.0 0 0.0 0 0.0 0 0.0
8 10 9 0 100.0 0 100.0 0 100.0 0 100.0 0 100.0 0 100.0
41 44 41 TOTAL 187 100.0 193 100.0 192 100.0 5 2.7 TOTAL 24 100.0 27 100.0 26 100.0 2 8.30 0.0 0 0.0 0 0.0 0 0.0 0 0.0 0 0.0
# Includes American Indian/Alaska Native, Asian/Native Hawaiian/Other Pacific Islander, Black, Hispanic, and Two or More Races. ## Does not include Italian American.Source: CUNY Workforce Demographics by College, Ethnicity, and Gender 2017, 2018 and 2019. NOTE: This report excludes the following types of leaves - Authorized/Unauthorized without pay; Disability no pay; Total Disability; Terminal; and Travia.
2017
OTHER INSTRUCTIONAL STAFF (Full-Time) Includes: Registrar, College Laboratory Technicians, Research, and Hunter HS/ES Series Titles.
HIGHER EDUCATION OFFICER (HEO) SERIES
2017 2018
Part B - TABLE VII - D
# and % Change between
2017 & 2019
The City University of New York
# and % Change between
2017 & 2019
2017 through 2019 Three Year Comparison - INSTRUCTIONAL STAFF (includes substitutes, visitings and acting appointments)MEDGAR EVERS COLLEGE
EXECUTIVE COMPENSATION PLAN TITLESFACULTY (Full-Time)# and %
Change between 2017 & 2019
2019
2018 2019
# and % Change between
2017 & 2019
2017 2018 2019 # and % Change between
2017 & 2019
Page 22 of 46

2017 2018 2019# % # % # % # % # % # %
Female 72 39.6 68 39.8 69 38.3 (3) (4.2) Female 12 52.2 11 47.8 12 50.0 0 0.0
Male 110 60.4 103 60.2 111 61.7 1 0.9 Male 11 47.8 12 52.2 12 50.0 1 9.1
Non-Binary/Not Specified 0 0.0 0 0.0 0 0.0 0 0.0 Non-Binary/Not Specified 0 0.0 0 0.0 0 0.0 0 0.0Total Minority # 39 21.4 34 19.9 35 19.4 (4) (10.3) Total Minority # 3 13.0 5 21.7 6 25.0 3 100.0
Am. Ind./Al. Nat. 0 0.0 0 0.0 0 0.0 0 0.0 Am. Ind./Al. Nat. 0 0.0 0 0.0 0 0.0 0 0.0
Asian/Nat.Haw./ Other Pac. Isl. 15 8.2 12 7.0 13 7.2 (2) (13.3) Asian/Nat.Haw./ Other Pac. Isl. 0 0.0 2 8.7 2 8.3 2 100.0
INSTRUCTIONAL STAFF (Full-Time) Black 15 8.2 8 4.7 10 5.6 (5) (33.3) Black 1 4.3 1 4.3 1 4.2 0 0.0
Hispanic 9 4.9 14 8.2 12 6.7 3 33.3 Hispanic 2 8.7 2 8.7 2 8.3 0 0.0 Two or More Races** 0 0.0 0 0.0 0 0.0 0 0.0 Two or More Races** 0 0.0 0 0.0 1 4.2 1 100.0
# % # % # % White## 136 74.7 131 76.6 138 76.7 2 1.5 White## 18 78.3 17 73.9 16 66.7 (2) (11.1)
Female 227 55.8 248 57.3 265 56.6 38 16.7 Italian American 7 3.8 6 3.5 7 3.9 0 0.0 Italian American 2 8.7 1 4.3 2 8.3 0 0.0
Male 180 44.2 185 42.7 203 43.4 23 12.8 Blank/Not Specified 0 0.0 0 0.0 0 0.0 0 0.0 Blank/Not Specified 0 0.0 0 0.0 0 0.0 0 0.0
Non-Binary/Not Specified 0 0.0 0 0.0 0 0.0 0 0.0 0 100.0 0 100.0 0 100.0 0 100.0 0 100.0 0 100.0Total Minority # 144 35.4 165 38.1 181 38.7 37 25.7 TOTAL 182 100.0 171 100.0 180 100.0 (2) (1.1) TOTAL 23 100.0 23 100.0 24 100.0 1 4.3
Am. Ind./Al. Nat. 1 0.2 1 0.2 1 0.2 0 0.0 0 0.0 0 0.0 0 0.0 0 0.0 0 0.0 0 0.0
Asian/Nat.Haw./Other Pac. Isl. 43 10.6 45 10.4 57 12.2 14 32.6 0 0.0 0 0.0 0 0.0 0 0.0 0 0.0 0 0.0
Black 57 14.0 60 13.9 63 13.5 6 10.5
Hispanic 41 10.1 57 13.2 56 12.0 15 36.6 Two or More Races** 2 0.5 2 0.5 4 0.9 2 100.0
White## 245 60.2 250 57.7 266 56.8 21 8.6 # % # % # % # % # % # %
Italian American 18 4.4 18 4.2 21 4.5 3 16.7 Female 138 74.6 149 73.8 163 73.8 25 18.1 Female 5 29.4 20 54.1 21 48.8 16 320.0
Blank/Not Specified 0 0.0 0 0.0 0 0.0 0 0.0 Male 47 25.4 53 26.2 58 26.2 11 23.4 Male 12 70.6 17 45.9 22 51.2 10 83.3
0 0.0 0 0.0 0 0.0 Non-Binary/Not Specified 0 0.0 0 0.0 0 0.0 0 0.0 Non-Binary/Not Specified 0 0.0 0 0.0 0 0.0 0 0.0
TOTAL 407 100.0 433 100.0 468 100.0 61 15.0 Total Minority # 97 52.4 109 54.0 118 53.4 21 21.6 Total Minority # 5 29.4 17 45.9 22 51.2 17 340.0
0 0.0 0 0.0 0 0.0 Am. Ind./Al. Nat. 1 0.5 1 0.5 1 0.5 0 0.0 Am. Ind./Al. Nat. 0 0.0 0 0.0 0 0.0 0 0.0
0 0.0 0 0.0 0 0.0 Asian/Nat.Haw./ Other Pac. Isl. 26 14.1 26 12.9 32 14.5 6 23.1 Asian/Nat.Haw./ Other Pac. Isl. 2 11.8 5 13.5 10 23.3 8 400.0
180 0 0 Black 39 21.1 45 22.3 48 21.7 9 23.1 Black 2 11.8 6 16.2 4 9.3 2 100.0
57 60 63 Hispanic 29 15.7 35 17.3 34 15.4 5 17.2 Hispanic 1 5.9 6 16.2 8 18.6 7 700.0
6 10 12 Two or More Races** 2 1.1 2 1.0 3 1.4 1 50.0 Two or More Races** 0 0.0 0 0.0 0 0.0 0 0.0
35 47 44 White## 81 43.8 84 41.6 93 42.1 12 14.8 White## 10 58.8 18 48.6 19 44.2 9 90.0
Italian American 7 3.8 9 4.5 10 4.5 3 42.9 Italian American 2 11.8 2 5.4 2 4.7 0 0.0
41 57 56 Blank/Not Specified 0 0.0 0 0.0 0 0.0 0 0.0 Blank/Not Specified 0 0.0 0 0.0 0 0.0 0 0.0
2 2 4 0 100.0 0 100.0 0 100.0 0 100.0 0 100.0 0 100.0
245 250 266 TOTAL 185 100.0 202 100.0 221 100.0 36 19.5 TOTAL 17 100.0 37 100.0 43 100.0 26 152.9
OTHER INSTRUCTIONAL STAFF (Full-Time) Includes: Registrar, College Laboratory Technicians, Research, and Hunter HS/ES Series Titles.
2017 2018 2019 # and % Change between
2017 & 2019
2017 2018
# and % Change between
2017 & 2019
HIGHER EDUCATION OFFICER (HEO) SERIES
2019 # and % Change between
2017 & 2019
# Includes American Indian/Alaska Native, Asian/Native Hawaiian/Other Pacific Islander, Black, Hispanic, and Two or More Races. ## Does not include Italian American.Source: CUNY Workforce Demographics by College, Ethnicity, and Gender 2017, 2018 and 2019. NOTE: This report excludes the following types of leaves - Authorized/Unauthorized without pay; Disability no pay; Total Disability; Terminal; and Travia.
# and % Change between
2017 & 2019
2017 2018 2019
2019
Part B - TABLE VII - EThe City University of New York
GRADUATE CENTER - Excludes William E. Macaulay Honors College as of 20172017 to 2019 Three Year Comparison - INSTRUCTIONAL STAFF (includes substitutes, visitings and acting appointments)
FACULTY (Full-Time) EXECUTIVE COMPENSATION PLAN TITLES2017 2018 # and %
Change between 2017 & 2019
Page 23 of 46
2017 2018 2019 2017 2018 2019# % # % # % # % # % # %
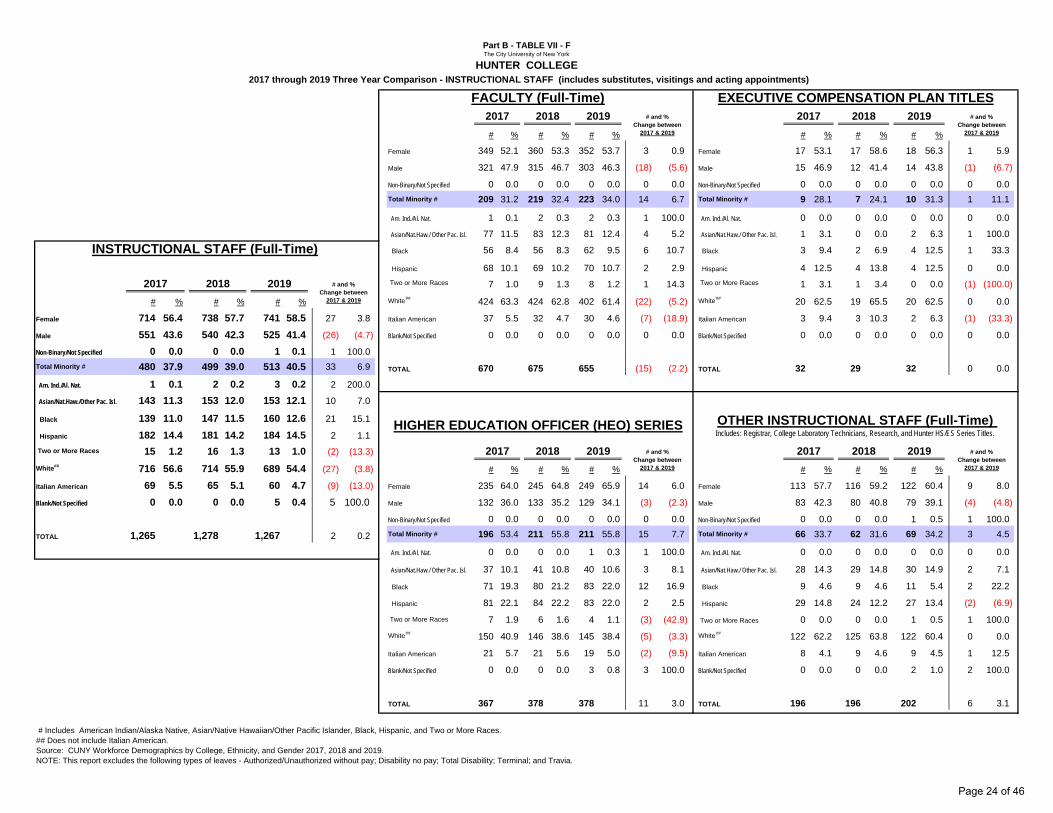
Female 349 52.1 360 53.3 352 53.7 3 0.9 Female 17 53.1 17 58.6 18 56.3 1 5.9
Male 321 47.9 315 46.7 303 46.3 (18) (5.6) Male 15 46.9 12 41.4 14 43.8 (1) (6.7)
Non-Binary/Not Specified 0 0.0 0 0.0 0 0.0 0 0.0 Non-Binary/Not Specified 0 0.0 0 0.0 0 0.0 0 0.0Total Minority # 209 31.2 219 32.4 223 34.0 14 6.7 Total Minority # 9 28.1 7 24.1 10 31.3 1 11.1
Am. Ind./Al. Nat. 1 0.1 2 0.3 2 0.3 1 100.0 Am. Ind./Al. Nat. 0 0.0 0 0.0 0 0.0 0 0.0
Asian/Nat.Haw./ Other Pac. Isl. 77 11.5 83 12.3 81 12.4 4 5.2 Asian/Nat.Haw./ Other Pac. Isl. 1 3.1 0 0.0 2 6.3 1 100.0
INSTRUCTIONAL STAFF (Full-Time) Black 56 8.4 56 8.3 62 9.5 6 10.7 Black 3 9.4 2 6.9 4 12.5 1 33.3
Hispanic 68 10.1 69 10.2 70 10.7 2 2.9 Hispanic 4 12.5 4 13.8 4 12.5 0 0.0 Two or More Races 7 1.0 9 1.3 8 1.2 1 14.3 Two or More Races 1 3.1 1 3.4 0 0.0 (1) (100.0)
# % # % # % White## 424 63.3 424 62.8 402 61.4 (22) (5.2) White## 20 62.5 19 65.5 20 62.5 0 0.0
Female 714 56.4 738 57.7 741 58.5 27 3.8 Italian American 37 5.5 32 4.7 30 4.6 (7) (18.9) Italian American 3 9.4 3 10.3 2 6.3 (1) (33.3)
Male 551 43.6 540 42.3 525 41.4 (26) (4.7) Blank/Not Specified 0 0.0 0 0.0 0 0.0 0 0.0 Blank/Not Specified 0 0.0 0 0.0 0 0.0 0 0.0
Non-Binary/Not Specified 0 0.0 0 0.0 1 0.1 1 100.0 0 100.0 0 100.0 0 100.0 0 100.0 0 100.0 0 100.0Total Minority # 480 37.9 499 39.0 513 40.5 33 6.9 TOTAL 670 100.0 675 100.0 655 100.0 (15) (2.2) TOTAL 32 100.0 29 100.0 32 100.0 0 0.0
Am. Ind./Al. Nat. 1 0.1 2 0.2 3 0.2 2 200.0 0 0.0 0 0.0 0 0.0 0 0.0 0 0.0 0 0.0
Asian/Nat.Haw./Other Pac. Isl. 143 11.3 153 12.0 153 12.1 10 7.0 0 0.0 0 0.0 0 0.0 0 0.0 0 0.0 0 0.0
Black 139 11.0 147 11.5 160 12.6 21 15.1
Hispanic 182 14.4 181 14.2 184 14.5 2 1.1 Two or More Races 15 1.2 16 1.3 13 1.0 (2) (13.3)
White## 716 56.6 714 55.9 689 54.4 (27) (3.8) # % # % # % # % # % # %
Italian American 69 5.5 65 5.1 60 4.7 (9) (13.0) Female 235 64.0 245 64.8 249 65.9 14 6.0 Female 113 57.7 116 59.2 122 60.4 9 8.0
Blank/Not Specified 0 0.0 0 0.0 5 0.4 5 100.0 Male 132 36.0 133 35.2 129 34.1 (3) (2.3) Male 83 42.3 80 40.8 79 39.1 (4) (4.8)
0 0.0 0 0.0 0 0.0 Non-Binary/Not Specified 0 0.0 0 0.0 0 0.0 0 0.0 Non-Binary/Not Specified 0 0.0 0 0.0 1 0.5 1 100.0
TOTAL 1,265 100.0 1,278 100.0 1,267 100.0 2 0.2 Total Minority # 196 53.4 211 55.8 211 55.8 15 7.7 Total Minority # 66 33.7 62 31.6 69 34.2 3 4.5
0 0.0 0 0.0 0 0.0 Am. Ind./Al. Nat. 0 0.0 0 0.0 1 0.3 1 100.0 Am. Ind./Al. Nat. 0 0.0 0 0.0 0 0.0 0 0.0
0 0.0 0 0.0 0 0.0 Asian/Nat.Haw./ Other Pac. Isl. 37 10.1 41 10.8 40 10.6 3 8.1 Asian/Nat.Haw./ Other Pac. Isl. 28 14.3 29 14.8 30 14.9 2 7.1
551 540 525 Black 71 19.3 80 21.2 83 22.0 12 16.9 Black 9 4.6 9 4.6 11 5.4 2 22.2
139 147 160 Hispanic 81 22.1 84 22.2 83 22.0 2 2.5 Hispanic 29 14.8 24 12.2 27 13.4 (2) (6.9)
52 52 57 Two or More Races 7 1.9 6 1.6 4 1.1 (3) (42.9) Two or More Races 0 0.0 0 0.0 1 0.5 1 100.0
130 129 127 White## 150 40.9 146 38.6 145 38.4 (5) (3.3) White## 122 62.2 125 63.8 122 60.4 0 0.0
Italian American 21 5.7 21 5.6 19 5.0 (2) (9.5) Italian American 8 4.1 9 4.6 9 4.5 1 12.5
182 181 184 Blank/Not Specified 0 0.0 0 0.0 3 0.8 3 100.0 Blank/Not Specified 0 0.0 0 0.0 2 1.0 2 100.0
15 16 13 0 100.0 0 100.0 0 100.0 0 100.0 0 100.0 0 100.0
716 714 689 TOTAL 367 100.0 378 100.0 378 100.0 11 3.0 TOTAL 196 100.0 196 100.0 202 100.0 6 3.10 0.0 0 0.0 0 0.0 0 0.0 0 0.0 0 0.0
# Includes American Indian/Alaska Native, Asian/Native Hawaiian/Other Pacific Islander, Black, Hispanic, and Two or More Races. ## Does not include Italian American.Source: CUNY Workforce Demographics by College, Ethnicity, and Gender 2017, 2018 and 2019. NOTE: This report excludes the following types of leaves - Authorized/Unauthorized without pay; Disability no pay; Total Disability; Terminal; and Travia.
2017
OTHER INSTRUCTIONAL STAFF (Full-Time) Includes: Registrar, College Laboratory Technicians, Research, and Hunter HS/ES Series Titles.
HIGHER EDUCATION OFFICER (HEO) SERIES
2017 2018
Part B - TABLE VII - F
# and % Change between
2017 & 2019
The City University of New York
# and % Change between
2017 & 2019
2017 through 2019 Three Year Comparison - INSTRUCTIONAL STAFF (includes substitutes, visitings and acting appointments)HUNTER COLLEGE
EXECUTIVE COMPENSATION PLAN TITLESFACULTY (Full-Time)# and %
Change between 2017 & 2019
2019
2018 2019
# and % Change between
2017 & 2019
2017 2018 2019 # and % Change between
2017 & 2019
Page 24 of 46

2017 2018 2019 2017 2018 2019# % # % # % # % # % # %
Female 197 47.8 203 48.9 202 49.0 5 2.5 Female 14 58.3 12 48.0 14 56.0 0 0.0
Male 215 52.2 212 51.1 210 51.0 (5) (2.3) Male 10 41.7 13 52.0 11 44.0 1 10.0
Non-Binary/Not Specified 0 0.0 0 0.0 0 0.0 0 0.0 Non-Binary/Not Specified 0 0.0 0 0.0 0 0.0 0 0.0Total Minority # 126 30.6 137 33.0 144 35.0 18 14.3 Total Minority # 6 25.0 8 32.0 9 36.0 3 50.0
Am. Ind./Al. Nat. 0 0.0 0 0.0 0 0.0 0 0.0 Am. Ind./Al. Nat. 0 0.0 0 0.0 0 0.0 0 0.0
Asian/Nat.Haw./ Other Pac. Isl. 34 8.3 38 9.2 45 10.9 11 32.4 Asian/Nat.Haw./ Other Pac. Isl. 1 4.2 2 8.0 3 12.0 2 200.0
INSTRUCTIONAL STAFF (Full-Time) Black 44 10.7 46 11.1 43 10.4 (1) (2.3) Black 3 12.5 4 16.0 3 12.0 0 0.0
Hispanic 45 10.9 49 11.8 52 12.6 7 15.6 Hispanic 2 8.3 2 8.0 3 12.0 1 50.0 Two or More Races 3 0.7 4 1.0 4 1.0 1 33.3 Two or More Races 0 0.0 0 0.0 0 0.0 0 0.0
# % # % # % White## 265 64.3 258 62.2 251 60.9 (14) (5.3) White## 15 62.5 16 64.0 15 60.0 0 0.0
Female 451 58.6 455 58.4 478 59.7 27 6.0 Italian American 21 5.1 20 4.8 17 4.1 (4) (19.0) Italian American 3 12.5 1 4.0 1 4.0 (2) (66.7)
Male 318 41.4 324 41.6 323 40.3 5 1.6 Blank/Not Specified 0 0.0 0 0.0 0 0.0 0 0.0 Blank/Not Specified 0 0.0 0 0.0 0 0.0 0 0.0
Non-Binary/Not Specified 0 0.0 0 0.0 0 0.0 0 0.0 0 100.0 0 100.0 0 100.0 0 100.0 0 100.0 0 100.0Total Minority # 334 43.4 362 46.5 390 48.7 56 16.8 TOTAL 412 100.0 415 100.0 412 100.0 0 0.0 TOTAL 24 100.0 25 100.0 25 100.0 1 4.2
Am. Ind./Al. Nat. 2 0.3 1 0.1 1 0.1 (1) (50.0) 0 0.0 0 0.0 0 0.0 0 0.0 0 0.0 0 0.0
Asian/Nat.Haw./Other Pac. Isl. 57 7.4 67 8.6 78 9.7 21 36.8 0 0.0 0 0.0 0 0.0 0 0.0 0 0.0 0 0.0
Black 133 17.3 142 18.2 146 18.2 13 9.8
Hispanic 135 17.6 144 18.5 156 19.5 21 15.6 Two or More Races 7 0.9 8 1.0 9 1.1 2 28.6
White## 395 51.4 379 48.7 374 46.7 (21) (5.3) # % # % # % # % # % # %
Italian American 40 5.2 38 4.9 35 4.4 (5) (12.5) Female 230 71.9 232 70.7 253 71.9 23 10.0 Female 10 76.9 8 72.7 9 75.0 (1) (10.0)
Blank/Not Specified 0 0.0 0 0.0 2 0.2 2 100.0 Male 90 28.1 96 29.3 99 28.1 9 10.0 Male 3 23.1 3 27.3 3 25.0 0 0.0
0 0.0 0 0.0 0 0.0 Non-Binary/Not Specified 0 0.0 0 0.0 0 0.0 0 0.0 Non-Binary/Not Specified 0 0.0 0 0.0 0 0.0 0 0.0
TOTAL 769 100.0 779 100.0 801 100.0 32 4.2 Total Minority # 195 60.9 211 64.3 230 65.3 35 17.9 Total Minority # 7 53.8 6 54.5 7 58.3 0 0.0
0 0.0 0 0.0 0 0.0 Am. Ind./Al. Nat. 1 0.3 1 0.3 1 0.3 0 0.0 Am. Ind./Al. Nat. 1 7.7 0 0.0 0 0.0 (1) (100.0)
0 0.0 0 0.0 0 0.0 Asian/Nat.Haw./ Other Pac. Isl. 20 6.3 25 7.6 27 7.7 7 35.0 Asian/Nat.Haw./ Other Pac. Isl. 2 15.4 2 18.2 3 25.0 1 50.0
318 324 323 Black 86 26.9 92 28.0 100 28.4 14 16.3 Black 0 0.0 0 0.0 0 0.0 0 0.0
133 142 146 Hispanic 84 26.3 89 27.1 97 27.6 13 15.5 Hispanic 4 30.8 4 36.4 4 33.3 0 0.0
47 46 49 Two or More Races 4 1.3 4 1.2 5 1.4 1 25.0 Two or More Races 0 0.0 0 0.0 0 0.0 0 0.0
88 98 107 White## 109 34.1 100 30.5 103 29.3 (6) (5.5) White## 6 46.2 5 45.5 5 41.7 (1) (16.7)
Italian American 16 5.0 17 5.2 17 4.8 1 6.3 Italian American 0 0.0 0 0.0 0 0.0 0 0.0
135 144 156 Blank/Not Specified 0 0.0 0 0.0 2 0.6 2 100.0 Blank/Not Specified 0 0.0 0 0.0 0 0.0 0 0.0
7 8 9 0 100.0 0 100.0 0 100.0 0 100.0 0 100.0 0 100.0
395 379 374 TOTAL 320 100.0 328 100.0 352 100.0 32 10.0 TOTAL 13 100.0 11 100.0 12 100.0 (1) (7.7)0 0.0 0 0.0 0 0.0 0 0.0 0 0.0 0 0.0
# Includes American Indian/Alaska Native, Asian/Native Hawaiian/Other Pacific Islander, Black, Hispanic, and Two or More Races. ## Does not include Italian American.Source: CUNY Workforce Demographics by College, Ethnicity, and Gender 2017, 2018 and 2019. NOTE: This report excludes the following types of leaves - Authorized/Unauthorized without pay; Disability no pay; Total Disability; Terminal; and Travia.
2017
OTHER INSTRUCTIONAL STAFF (Full-Time) Includes: Registrar, College Laboratory Technicians, Research, and Hunter HS/ES Series Titles.
HIGHER EDUCATION OFFICER (HEO) SERIES
2017 2018
Part B - TABLE VII - G
# and % Change between
2017 & 2019
The City University of New York
# and % Change between
2017 & 2019
2017 through 2019 Three Year Comparison - INSTRUCTIONAL STAFF (includes substitutes, visitings and acting appointments)JOHN JAY COLLEGE
EXECUTIVE COMPENSATION PLAN TITLESFACULTY (Full-Time)# and %
Change between 2017 & 2019
2019
2018 2019
# and % Change between
2017 & 2019
2017 2018 2019 # and % Change between
2017 & 2019
Page 25 of 46

2017 2018 2019 2017 2018 2019# % # % # % # % # % # %
Female 199 53.5 210 55.1 222 56.8 23 11.6 Female 13 52.0 14 53.8 14 51.9 1 7.7
Male 173 46.5 171 44.9 169 43.2 (4) (2.3) Male 12 48.0 12 46.2 13 48.1 1 8.3
Non-Binary/Not Specified 0 0.0 0 0.0 0 0.0 0 0.0 Non-Binary/Not Specified 0 0.0 0 0.0 0 0.0 0 0.0Total Minority # 125 33.6 140 36.7 139 35.5 14 11.2 Total Minority # 11 44.0 12 46.2 12 44.4 1 9.1
Am. Ind./Al. Nat. 2 0.5 2 0.5 2 0.5 0 0.0 Am. Ind./Al. Nat. 0 0.0 0 0.0 0 0.0 0 0.0
Asian/Nat.Haw./ Other Pac. Isl. 32 8.6 34 8.9 32 8.2 0 0.0 Asian/Nat.Haw./ Other Pac. Isl. 3 12.0 2 7.7 2 7.4 (1) (33.3)
INSTRUCTIONAL STAFF (Full-Time) Black 39 10.5 44 11.5 45 11.5 6 15.4 Black 4 16.0 4 15.4 5 18.5 1 25.0
Hispanic 51 13.7 59 15.5 57 14.6 6 11.8 Hispanic 4 16.0 6 23.1 5 18.5 1 25.0 Two or More Races 1 0.3 1 0.3 3 0.8 2 200.0 Two or More Races 0 0.0 0 0.0 0 0.0 0 0.0
# % # % # % White## 223 59.9 220 57.7 231 59.1 8 3.6 White## 13 52.0 11 42.3 12 44.4 (1) (7.7)
Female 370 56.5 391 57.3 405 58.5 35 9.5 Italian American 24 6.5 21 5.5 21 5.4 (3) (12.5) Italian American 1 4.0 3 11.5 3 11.1 2 200.0
Male 285 43.5 291 42.7 287 41.5 2 0.7 Blank/Not Specified 0 0.0 0 0.0 0 0.0 0 0.0 Blank/Not Specified 0 0.0 0 0.0 0 0.0 0 0.0
Non-Binary/Not Specified 0 0.0 0 0.0 0 0.0 0 0.0 0 100.0 0 100.0 0 100.0 0 100.0 0 100.0 0 100.0Total Minority # 303 46.3 338 49.6 340 49.1 37 12.2 TOTAL 372 100.0 381 100.0 391 100.0 19 5.1 TOTAL 25 100.0 26 100.0 27 100.0 2 8.0
Am. Ind./Al. Nat. 2 0.3 2 0.3 2 0.3 0 0.0 0 0.0 0 0.0 0 0.0 0 0.0 0 0.0 0 0.0
Asian/Nat.Haw./Other Pac. Isl. 52 7.9 57 8.4 55 7.9 3 5.8 0 0.0 0 0.0 0 0.0 0 0.0 0 0.0 0 0.0
Black 102 15.6 108 15.8 109 15.8 7 6.9
Hispanic 146 22.3 170 24.9 169 24.4 23 15.8 Two or More Races 1 0.2 1 0.1 5 0.7 4 400.0
White## 315 48.1 307 45.0 316 45.7 1 0.3 # % # % # % # % # % # %
Italian American 37 5.6 37 5.4 36 5.2 (1) (2.7) Female 148 63.0 159 62.8 161 63.6 13 8.8 Female 10 43.5 8 36.4 8 38.1 (2) (20.0)
Blank/Not Specified 0 0.0 0 0.0 0 0.0 0 0.0 Male 87 37.0 94 37.2 92 36.4 5 5.7 Male 13 56.5 14 63.6 13 61.9 0 0.0
0 0.0 0 0.0 0 0.0 Non-Binary/Not Specified 0 0.0 0 0.0 0 0.0 0 0.0 Non-Binary/Not Specified 0 0.0 0 0.0 0 0.0 0 0.0
TOTAL 655 100.0 682 100.0 692 100.0 37 5.6 Total Minority # 159 67.7 176 69.6 179 70.8 20 12.6 Total Minority # 8 34.8 10 45.5 10 47.6 2 25.0
0 0.0 0 0.0 0 0.0 Am. Ind./Al. Nat. 0 0.0 0 0.0 0 0.0 0 0.0 Am. Ind./Al. Nat. 0 0.0 0 0.0 0 0.0 0 0.0
0 0.0 0 0.0 0 0.0 Asian/Nat.Haw./ Other Pac. Isl. 15 6.4 19 7.5 19 7.5 4 26.7 Asian/Nat.Haw./ Other Pac. Isl. 2 8.7 2 9.1 2 9.5 0 0.0
285 291 287 Black 56 23.8 57 22.5 56 22.1 0 0.0 Black 3 13.0 3 13.6 3 14.3 0 0.0
102 108 109 Hispanic 88 37.4 100 39.5 102 40.3 14 15.9 Hispanic 3 13.0 5 22.7 5 23.8 2 66.7
41 52 52 Two or More Races 0 0.0 0 0.0 2 0.8 2 100.0 Two or More Races 0 0.0 0 0.0 0 0.0 0 0.0
105 118 117 White## 66 28.1 65 25.7 63 24.9 (3) (4.5) White## 13 56.5 11 50.0 10 47.6 (3) (23.1)
Italian American 10 4.3 12 4.7 11 4.3 1 10.0 Italian American 2 8.7 1 4.5 1 4.8 (1) (50.0)
146 170 169 Blank/Not Specified 0 0.0 0 0.0 0 0.0 0 0.0 Blank/Not Specified 0 0.0 0 0.0 0 0.0 0 0.0
1 1 5 0 100.0 0 100.0 0 100.0 0 100.0 0 100.0 0 100.0
315 307 316 TOTAL 235 100.0 253 100.0 253 100.0 18 7.7 TOTAL 23 100.0 22 100.0 21 100.0 (2) (8.7)0 0.0 0 0.0 0 0.0 0 0.0 0 0.0 0 0.0
# Includes American Indian/Alaska Native, Asian/Native Hawaiian/Other Pacific Islander, Black, Hispanic, and Two or More Races. ## Does not include Italian American.Source: CUNY Workforce Demographics by College, Ethnicity, and Gender 2017, 2018 and 2019. NOTE: This report excludes the following types of leaves - Authorized/Unauthorized without pay; Disability no pay; Total Disability; Terminal; and Travia.
2017
OTHER INSTRUCTIONAL STAFF (Full-Time) Includes: Registrar, College Laboratory Technicians, Research, and Hunter HS/ES Series Titles.
HIGHER EDUCATION OFFICER (HEO) SERIES
2017 2018
Part B - TABLE VII - H
# and % Change between
2017 & 2019
The City University of New York
# and % Change between
2017 & 2019
2017 through 2019 Three Year Comparison - INSTRUCTIONAL STAFF (includes substitutes, visitings and acting appointments)LEHMAN COLLEGE
EXECUTIVE COMPENSATION PLAN TITLESFACULTY (Full-Time)# and %
Change between 2017 & 2019
2019
2018 2019
# and % Change between
2017 & 2019
2017 2018 2019 # and % Change between
2017 & 2019
Page 26 of 46

2017 2018 2019# % # % # % # % # % # %
Female 1 100.0 2 66.7 3 75.0 2 200.0 Female 1 33.3 2 40.0 2 40.0 1 100.0
Male 0 0.0 1 33.3 1 25.0 1 100.0 Male 2 66.7 3 60.0 3 60.0 1 50.0
Non-Binary/Not Specified 0 0.0 0 0.0 0 0.0 0 0.0 Non-Binary/Not Specified 0 0.0 0 0.0 0 0.0 0 0.0Total Minority # 0 0.0 1 33.3 1 25.0 1 100.0 Total Minority # 0 0.0 1 20.0 1 20.0 1 100.0
Am. Ind./Al. Nat. 0 0.0 0 0.0 0 0.0 0 0.0 Am. Ind./Al. Nat. 0 0.0 0 0.0 0 0.0 0 0.0
Asian/Nat.Haw./ Other Pac. Isl. 0 0.0 0 0.0 0 0.0 0 0.0 Asian/Nat.Haw./ Other Pac. Isl. 0 0.0 0 0.0 0 0.0 0 0.0
INSTRUCTIONAL STAFF (Full-Time) Black 0 0.0 0 0.0 0 0.0 0 0.0 Black 0 0.0 0 0.0 0 0.0 0 0.0
Hispanic 0 0.0 1 33.3 1 25.0 1 100.0 Hispanic 0 0.0 1 20.0 1 20.0 1 100.0 Two or More Races** 0 0.0 0 0.0 0 0.0 0 0.0 Two or More Races** 0 0.0 0 0.0 0 0.0 0 0.0
# % # % # % White## 1 100.0 2 66.7 3 75.0 2 200.0 White## 3 100.0 4 80.0 4 80.0 1 33.3
Female 37 80.4 36 73.5 36 70.6 (1) (2.7) Italian American 0 0.0 0 0.0 0 0.0 0 0.0 Italian American 0 0.0 0 0.0 0 0.0 0 0.0
Male 9 19.6 13 26.5 15 29.4 6 66.7 Blank/Not Specified 0 0.0 0 0.0 0 0.0 0 0.0 Blank/Not Specified 0 0.0 0 0.0 0 0.0 0 0.0
Non-Binary/Not Specified 0 0.0 0 0.0 0 0.0 0 0.0 0 100.0 0 100.0 0 100.0 0 100.0 0 100.0 0 100.0Total Minority # 19 41.3 20 40.8 17 33.3 (2) (10.5) TOTAL 1 100.0 3 100.0 4 100.0 3 300.0 TOTAL 3 100.0 5 100.0 5 100.0 2 66.7
Am. Ind./Al. Nat. 0 0.0 0 0.0 0 0.0 0 0.0 0 0.0 0 0.0 0 0.0 0 0.0 0 0.0 0 0.0
Asian/Nat.Haw./Other Pac. Isl. 5 10.9 6 12.2 4 7.8 (1) (20.0) 0 0.0 0 0.0 0 0.0 0 0.0 0 0.0 0 0.0
Black 8 17.4 7 14.3 6 11.8 (2) (25.0)
Hispanic 5 10.9 6 12.2 5 9.8 0 0.0 Two or More Races** 1 2.2 1 2.0 2 3.9 1 100.0
White## 25 54.3 25 51.0 29 56.9 4 16.0 # % # % # % # % # % # %
Italian American 2 4.3 4 8.2 5 9.8 3 150.0 Female 35 83.3 32 78.0 31 73.8 (4) (11.4) Female 0 0.0 0 0.0 0 0.0 0 0.0
Blank/Not Specified 0 0.0 0 0.0 0 0.0 0 0.0 Male 7 16.7 9 22.0 11 26.2 4 57.1 Male 0 0.0 0 0.0 0 0.0 0 0.0
0 0.0 0 0.0 0 0.0 Non-Binary/Not Specified 0 0.0 0 0.0 0 0.0 0 0.0 Non-Binary/Not Specified 0 0.0 0 0.0 0 0.0 0 0.0
TOTAL 46 100.0 49 100.0 51 100.0 5 10.9 Total Minority # 19 45.2 18 43.9 15 35.7 (4) (21.1) Total Minority # 0 0.0 0 0.0 0 0.0 0 0.0
0 0.0 0 0.0 0 0.0 Am. Ind./Al. Nat. 0 0.0 0 0.0 0 0.0 0 0.0 Am. Ind./Al. Nat. 0 0.0 0 0.0 0 0.0 0 0.0
0 0.0 0 0.0 0 0.0 Asian/Nat.Haw./ Other Pac. Isl. 5 11.9 6 14.6 4 9.5 (1) (20.0) Asian/Nat.Haw./ Other Pac. Isl. 0 0.0 0 0.0 0 0.0 0 0.0
9 0 0 Black 8 19.0 7 17.1 6 14.3 (2) (25.0) Black 0 0.0 0 0.0 0 0.0 0 0.0
8 7 6 Hispanic 5 11.9 4 9.8 3 7.1 (2) (40.0) Hispanic 0 0.0 0 0.0 0 0.0 0 0.0
1 2 1 Two or More Races** 1 2.4 1 2.4 2 4.8 1 100.0 Two or More Races** 0 0.0 0 0.0 0 0.0 0 0.0
4 4 4 White## 21 50.0 19 46.3 22 52.4 1 4.8 White## 0 0.0 0 0.0 0 0.0 0 0.0
Italian American 2 4.8 4 9.8 5 11.9 3 150.0 Italian American 0 0.0 0 0.0 0 0.0 0 0.0
5 6 5 Blank/Not Specified 0 0.0 0 0.0 0 0.0 0 0.0 Blank/Not Specified 0 0.0 0 0.0 0 0.0 0 0.0
1 1 2 0 100.0 0 100.0 0 100.0 0 0.0 0 0.0 0 0.0
25 25 29 TOTAL 42 100.0 41 100.0 42 100.0 0 0.0 TOTAL 0 0.0 0 0.0 0 0.0 0 0.0
OTHER INSTRUCTIONAL STAFF (Full-Time) Includes: Registrar, College Laboratory Technicians, Research, and Hunter HS/ES Series Titles.
2017 2018 2019 # and % Change between
2017 & 2019
2017 2018
# and % Change between
2017 & 2019
HIGHER EDUCATION OFFICER (HEO) SERIES
2019 # and % Change between
2017 & 2019
# Includes American Indian/Alaska Native, Asian/Native Hawaiian/Other Pacific Islander, Black, Hispanic, and Two or More Races. ## Does not include Italian American.Source: CUNY Workforce Demographics by College, Ethnicity, and Gender 2017, 2018 and 2019. NOTE: This report excludes the following types of leaves - Authorized/Unauthorized without pay; Disability no pay; Total Disability; Terminal; and Travia.
# and % Change between
2017 & 2019
2017 2018 2019
2019
Part B - TABLE VII - IThe City University of New York
MACAULAY HONORS COLLEGE - Data prior to 2017 is incorporated with the Graduate Center2017 to 2019 Three Year Comparison - INSTRUCTIONAL STAFF (includes substitutes, visitings and acting appointments)
FACULTY (Full-Time) EXECUTIVE COMPENSATION PLAN TITLES2017 2018 # and %
Change between 2017 & 2019
Page 27 of 46

2017 2018 2019 2017 2018 2019# % # % # % # % # % # %
Female 216 49.9 215 50.5 207 50.1 (9) (4.2) Female 10 55.6 9 47.4 9 50.0 (1) (10.0)
Male 217 50.1 211 49.5 206 49.9 (11) (5.1) Male 8 44.4 10 52.6 9 50.0 1 12.5
Non-Binary/Not Specified 0 0.0 0 0.0 0 0.0 0 0.0 Non-Binary/Not Specified 0 0.0 0 0.0 0 0.0 0 0.0Total Minority # 168 38.8 171 40.1 171 41.4 3 1.8 Total Minority # 9 50.0 11 57.9 9 50.0 0 0.0
Am. Ind./Al. Nat. 2 0.5 2 0.5 2 0.5 0 0.0 Am. Ind./Al. Nat. 0 0.0 0 0.0 0 0.0 0 0.0
Asian/Nat.Haw./ Other Pac. Isl. 75 17.3 73 17.1 79 19.1 4 5.3 Asian/Nat.Haw./ Other Pac. Isl. 2 11.1 3 15.8 2 11.1 0 0.0
INSTRUCTIONAL STAFF (Full-Time) Black 59 13.6 62 14.6 56 13.6 (3) (5.1) Black 4 22.2 4 21.1 4 22.2 0 0.0
Hispanic 31 7.2 33 7.7 33 8.0 2 6.5 Hispanic 3 16.7 4 21.1 3 16.7 0 0.0 Two or More Races 1 0.2 1 0.2 1 0.2 0 0.0 Two or More Races 0 0.0 0 0.0 0 0.0 0 0.0
# % # % # % White## 235 54.3 224 52.6 216 52.3 (19) (8.1) White## 8 44.4 7 36.8 8 44.4 0 0.0
Female 363 54.8 360 55.0 353 54.8 (10) (2.8) Italian American 30 6.9 31 7.3 26 6.3 (4) (13.3) Italian American 1 5.6 1 5.3 1 5.6 0 0.0
Male 300 45.2 295 45.0 291 45.2 (9) (3.0) Blank/Not Specified 0 0.0 0 0.0 0 0.0 0 0.0 Blank/Not Specified 0 0.0 0 0.0 0 0.0 0 0.0
Non-Binary/Not Specified 0 0.0 0 0.0 0 0.0 0 0.0 0 100.0 0 100.0 0 100.0 0 100.0 0 100.0 0 100.0Total Minority # 326 49.2 327 49.9 331 51.4 5 1.5 TOTAL 433 100.0 426 100.0 413 100.0 (20) (4.6) TOTAL 18 100.0 19 100.0 18 100.0 0 0.0
Am. Ind./Al. Nat. 2 0.3 2 0.3 2 0.3 0 0.0 0 0.0 0 0.0 0 0.0 0 0.0 0 0.0 0 0.0
Asian/Nat.Haw./Other Pac. Isl. 98 14.8 98 15.0 106 16.5 8 8.2 0 0.0 0 0.0 0 0.0 0 0.0 0 0.0 0 0.0
Black 147 22.2 142 21.7 136 21.1 (11) (7.5)
Hispanic 76 11.5 81 12.4 84 13.0 8 10.5 Two or More Races 3 0.5 4 0.6 3 0.5 0 0.0
White## 298 44.9 289 44.1 279 43.3 (19) (6.4) # % # % # % # % # % # %
Italian American 39 5.9 39 6.0 34 5.3 (5) (12.8) Female 124 70.9 122 70.5 123 69.9 (1) (0.8) Female 13 35.1 14 37.8 14 37.8 1 7.7
Blank/Not Specified 0 0.0 0 0.0 0 0.0 0 0.0 Male 51 29.1 51 29.5 53 30.1 2 3.9 Male 24 64.9 23 62.2 23 62.2 (1) (4.2)
0 0.0 0 0.0 0 0.0 Non-Binary/Not Specified 0 0.0 0 0.0 0 0.0 0 0.0 Non-Binary/Not Specified 0 0.0 0 0.0 0 0.0 0 0.0
TOTAL 663 100.0 655 100.0 644 100.0 (19) (2.9) Total Minority # 125 71.4 122 70.5 127 72.2 2 1.6 Total Minority # 24 64.9 23 62.2 24 64.9 0 0.0
0 0.0 0 0.0 0 0.0 Am. Ind./Al. Nat. 0 0.0 0 0.0 0 0.0 0 0.0 Am. Ind./Al. Nat. 0 0.0 0 0.0 0 0.0 0 0.0
0 0.0 0 0.0 0 0.0 Asian/Nat.Haw./ Other Pac. Isl. 14 8.0 15 8.7 17 9.7 3 21.4 Asian/Nat.Haw./ Other Pac. Isl. 7 18.9 7 18.9 8 21.6 1 14.3
300 295 291 Black 74 42.3 67 38.7 67 38.1 (7) (9.5) Black 10 27.0 9 24.3 9 24.3 (1) (10.0)
147 142 136 Hispanic 35 20.0 37 21.4 41 23.3 6 17.1 Hispanic 7 18.9 7 18.9 7 18.9 0 0.0
23 23 23 Two or More Races 2 1.1 3 1.7 2 1.1 0 0.0 Two or More Races 0 0.0 0 0.0 0 0.0 0 0.0
53 58 61 White## 43 24.6 45 26.0 43 24.4 0 0.0 White## 12 32.4 13 35.1 12 32.4 0 0.0
Italian American 7 4.0 6 3.5 6 3.4 (1) (14.3) Italian American 1 2.7 1 2.7 1 2.7 0 0.0
76 81 84 Blank/Not Specified 0 0.0 0 0.0 0 0.0 0 0.0 Blank/Not Specified 0 0.0 0 0.0 0 0.0 0 0.0
3 4 3 0 100.0 0 100.0 0 100.0 0 100.0 0 100.0 0 100.0
298 289 279 TOTAL 175 100.0 173 100.0 176 100.0 1 0.6 TOTAL 37 100.0 37 100.0 37 100.0 0 0.00 0.0 0 0.0 0 0.0 0 0.0 0 0.0 0 0.0
# Includes American Indian/Alaska Native, Asian/Native Hawaiian/Other Pacific Islander, Black, Hispanic, and Two or More Races. ## Does not include Italian American.Source: CUNY Workforce Demographics by College, Ethnicity, and Gender 2017, 2018 and 2019. NOTE: This report excludes the following types of leaves - Authorized/Unauthorized without pay; Disability no pay; Total Disability; Terminal; and Travia.
2017
OTHER INSTRUCTIONAL STAFF (Full-Time) Includes: Registrar, College Laboratory Technicians, Research, and Hunter HS/ES Series Titles.
HIGHER EDUCATION OFFICER (HEO) SERIES
2017 2018
Part B - TABLE VII - I
# and % Change between
2017 & 2019
The City University of New York
# and % Change between
2017 & 2019
2017 through 2019 Three Year Comparison - INSTRUCTIONAL STAFF (includes substitutes, visitings and acting appointments)NEW YORK CITY COLLEGE OF TECHNOLOGY
EXECUTIVE COMPENSATION PLAN TITLESFACULTY (Full-Time)# and %
Change between 2017 & 2019
2019
2018 2019
# and % Change between
2017 & 2019
2017 2018 2019 # and % Change between
2017 & 2019
Page 28 of 46

2017 2018 2019 2017 2018 2019# % # % # % # % # % # %
Female 272 45.7 281 46.4 280 46.8 8 2.9 Female 15 55.6 13 48.1 12 41.4 (3) (20.0)
Male 323 54.3 325 53.6 318 53.2 (5) (1.5) Male 12 44.4 14 51.9 17 58.6 5 41.7
Non-Binary/Not Specified 0 0.0 0 0.0 0 0.0 0 0.0 Non-Binary/Not Specified 0 0.0 0 0.0 0 0.0 0 0.0Total Minority # 165 27.7 190 31.4 187 31.3 22 13.3 Total Minority # 10 37.0 9 33.3 7 24.1 (3) (30.0)
Am. Ind./Al. Nat. 0 0.0 0 0.0 0 0.0 0 0.0 Am. Ind./Al. Nat. 0 0.0 1 3.7 0 0.0 0 0.0
Asian/Nat.Haw./ Other Pac. Isl. 77 12.9 84 13.9 88 14.7 11 14.3 Asian/Nat.Haw./ Other Pac. Isl. 0 0.0 0 0.0 0 0.0 0 0.0
INSTRUCTIONAL STAFF (Full-Time) Black 38 6.4 43 7.1 40 6.7 2 5.3 Black 5 18.5 3 11.1 2 6.9 (3) (60.0)
Hispanic 45 7.6 53 8.7 50 8.4 5 11.1 Hispanic 4 14.8 4 14.8 3 10.3 (1) (25.0) Two or More Races 5 0.8 10 1.7 9 1.5 4 80.0 Two or More Races 1 3.7 1 3.7 2 6.9 1 100.0
# % # % # % White## 399 67.1 378 62.4 371 62.0 (28) (7.0) White## 15 55.6 16 59.3 18 62.1 3 20.0
Female 455 50.7 465 50.8 470 50.8 15 3.3 Italian American 31 5.2 38 6.3 40 6.7 9 29.0 Italian American 2 7.4 2 7.4 4 13.8 2 100.0
Male 443 49.3 451 49.2 455 49.2 12 2.7 Blank/Not Specified 0 0.0 0 0.0 0 0.0 0 0.0 Blank/Not Specified 0 0.0 0 0.0 0 0.0 0 0.0
Non-Binary/Not Specified 0 0.0 0 0.0 0 0.0 0 0.0 0 100.0 0 100.0 0 100.0 0 100.0 0 100.0 0 100.0Total Minority # 319 35.5 354 38.6 364 39.4 45 14.1 TOTAL 595 100.0 606 100.0 598 100.0 3 0.5 TOTAL 27 100.0 27 100.0 29 100.0 2 7.4
Am. Ind./Al. Nat. 1 0.1 2 0.2 1 0.1 0 0.0 0 0.0 0 0.0 0 0.0 0 0.0 0 0.0 0 0.0
Asian/Nat.Haw./Other Pac. Isl. 122 13.6 136 14.8 148 16.0 26 21.3 0 0.0 0 0.0 0 0.0 0 0.0 0 0.0 0 0.0
Black 94 10.5 100 10.9 98 10.6 4 4.3
Hispanic 91 10.1 100 10.9 102 11.0 11 12.1 Two or More Races 11 1.2 16 1.7 15 1.6 4 36.4
White## 512 57.0 491 53.6 487 52.6 (25) (4.9) # % # % # % # % # % # %
Italian American 67 7.5 71 7.8 74 8.0 7 10.4 Female 160 67.5 164 67.5 170 66.7 10 6.3 Female 8 20.5 7 17.5 8 18.6 0 0.0
Blank/Not Specified 0 0.0 0 0.0 0 0.0 0 0.0 Male 77 32.5 79 32.5 85 33.3 8 10.4 Male 31 79.5 33 82.5 35 81.4 4 12.9
0 0.0 0 0.0 0 0.0 Non-Binary/Not Specified 0 0.0 0 0.0 0 0.0 0 0.0 Non-Binary/Not Specified 0 0.0 0 0.0 0 0.0 0 0.0
TOTAL 898 100.0 916 100.0 925 100.0 27 3.0 Total Minority # 125 52.7 136 56.0 150 58.8 25 20.0 Total Minority # 19 48.7 19 47.5 20 46.5 1 5.3
0 0.0 0 0.0 0 0.0 Am. Ind./Al. Nat. 1 0.4 1 0.4 1 0.4 0 0.0 Am. Ind./Al. Nat. 0 0.0 0 0.0 0 0.0 0 0.0
0 0.0 0 0.0 0 0.0 Asian/Nat.Haw./ Other Pac. Isl. 39 16.5 46 18.9 53 20.8 14 35.9 Asian/Nat.Haw./ Other Pac. Isl. 6 15.4 6 15.0 7 16.3 1 16.7
443 451 455 Black 44 18.6 46 18.9 49 19.2 5 11.4 Black 7 17.9 8 20.0 7 16.3 0 0.0
94 100 98 Hispanic 36 15.2 38 15.6 43 16.9 7 19.4 Hispanic 6 15.4 5 12.5 6 14.0 0 0.0
18 18 18 Two or More Races 5 2.1 5 2.1 4 1.6 (1) (20.0) Two or More Races 0 0.0 0 0.0 0 0.0 0 0.0
73 82 84 White## 83 35.0 79 32.5 77 30.2 (6) (7.2) White## 15 38.5 18 45.0 21 48.8 6 40.0
Italian American 29 12.2 28 11.5 28 11.0 (1) (3.4) Italian American 5 12.8 3 7.5 2 4.7 (3) (60.0)
91 100 102 Blank/Not Specified 0 0.0 0 0.0 0 0.0 0 0.0 Blank/Not Specified 0 0.0 0 0.0 0 0.0 0 0.0
11 16 15 0 100.0 0 100.0 0 100.0 0 100.0 0 100.0 0 100.0
512 491 487 TOTAL 237 100.0 243 100.0 255 100.0 18 7.6 TOTAL 39 100.0 40 100.0 43 100.0 4 10.30 0.0 0 0.0 0 0.0 0 0.0 0 0.0 0 0.0
# Includes American Indian/Alaska Native, Asian/Native Hawaiian/Other Pacific Islander, Black, Hispanic, and Two or More Races. ## Does not include Italian American.Source: CUNY Workforce Demographics by College, Ethnicity, and Gender 2017, 2018 and 2019. NOTE: This report excludes the following types of leaves - Authorized/Unauthorized without pay; Disability no pay; Total Disability; Terminal; and Travia.
2017
OTHER INSTRUCTIONAL STAFF (Full-Time) Includes: Registrar, College Laboratory Technicians, Research, and Hunter HS/ES Series Titles.
HIGHER EDUCATION OFFICER (HEO) SERIES
2017 2018
Part B - TABLE VII - J
# and % Change between
2017 & 2019
The City University of New York
# and % Change between
2017 & 2019
2017 through 2019 Three Year Comparison - INSTRUCTIONAL STAFF (includes substitutes, visitings and acting appointments)QUEENS COLLEGE
EXECUTIVE COMPENSATION PLAN TITLESFACULTY (Full-Time)# and %
Change between 2017 & 2019
2019
2018 2019
# and % Change between
2017 & 2019
2017 2018 2019 # and % Change between
2017 & 2019
Page 29 of 46

2017 2018 2019 2017 2018 2019# % # % # % # % # % # %
Female 186 47.2 185 47.2 177 46.7 (9) (4.8) Female 8 38.1 11 55.0 10 52.6 2 25.0
Male 208 52.8 207 52.8 202 53.3 (6) (2.9) Male 13 61.9 9 45.0 9 47.4 (4) (30.8)
Non-Binary/Not Specified 0 0.0 0 0.0 0 0.0 0 0.0 Non-Binary/Not Specified 0 0.0 0 0.0 0 0.0 0 0.0Total Minority # 119 30.2 116 29.6 111 29.3 (8) (6.7) Total Minority # 3 14.3 4 20.0 5 26.3 2 66.7
Am. Ind./Al. Nat. 1 0.3 0 0.0 0 0.0 (1) (100.0) Am. Ind./Al. Nat. 0 0.0 0 0.0 0 0.0 0 0.0
Asian/Nat.Haw./ Other Pac. Isl. 70 17.8 71 18.1 68 17.9 (2) (2.9) Asian/Nat.Haw./ Other Pac. Isl. 1 4.8 1 5.0 1 5.3 0 0.0
INSTRUCTIONAL STAFF (Full-Time) Black 15 3.8 13 3.3 13 3.4 (2) (13.3) Black 1 4.8 1 5.0 1 5.3 0 0.0
Hispanic 31 7.9 29 7.4 27 7.1 (4) (12.9) Hispanic 1 4.8 2 10.0 2 10.5 1 100.0 Two or More Races 2 0.5 3 0.8 3 0.8 1 50.0 Two or More Races 0 0.0 0 0.0 1 5.3 1 100.0
# % # % # % White## 249 63.2 249 63.5 239 63.1 (10) (4.0) White## 15 71.4 14 70.0 12 63.2 (3) (20.0)
Female 340 53.2 347 53.2 339 53.4 (1) (0.3) Italian American 26 6.6 27 6.9 29 7.7 3 11.5 Italian American 3 14.3 2 10.0 2 10.5 (1) (33.3)
Male 299 46.8 305 46.8 296 46.6 (3) (1.0) Blank/Not Specified 0 0.0 0 0.0 0 0.0 0 0.0 Blank/Not Specified 0 0.0 0 0.0 0 0.0 0 0.0
Non-Binary/Not Specified 0 0.0 0 0.0 0 0.0 0 0.0 0 #### 0 #### 0 #### 0 100.0 0 100.0 0 100.0Total Minority # 189 29.6 195 29.9 189 29.8 0 0.0 TOTAL 394 #### 392 #### 379 #### (15) (3.8) TOTAL 21 100.0 20 100.0 19 100.0 (2) (9.5)
Am. Ind./Al. Nat. 2 0.3 1 0.2 1 0.2 (1) (50.0) 0 0.0 0 0.0 0 0.0 0 0.0 0 0.0 0 0.0
Asian/Nat.Haw./Other Pac. Isl. 89 13.9 90 13.8 86 13.5 (3) (3.4) 0 0.0 0 0.0 0 0.0 0 0.0 0 0.0 0 0.0
Black 35 5.5 35 5.4 34 5.4 (1) (2.9)
Hispanic 59 9.2 65 10.0 62 9.8 3 5.1 Two or More Races 4 0.6 4 0.6 6 0.9 2 50.0
White## 382 59.8 386 59.2 371 58.4 (11) (2.9) # % # % # % # % # % # %
Italian American 68 10.6 71 10.9 75 11.8 7 10.3 Female 129 67.9 134 65.0 134 65.7 5 3.9 Female 17 50.0 17 50.0 18 54.5 1 5.9
Blank/Not Specified 0 0.0 0 0.0 0 0.0 0 0.0 Male 61 32.1 72 35.0 70 34.3 9 14.8 Male 17 50.0 17 50.0 15 45.5 (2) (11.8)
0 0.0 0 0.0 0 0.0 Non-Binary/Not Specified 0 0.0 0 0.0 0 0.0 0 0.0 Non-Binary/Not Specified 0 0.0 0 0.0 0 0.0 0 0.0
TOTAL 639 100.0 652 100.0 635 100.0 (4) (0.6) Total Minority # 53 27.9 61 29.6 58 28.4 5 9.4 Total Minority # 14 41.2 14 41.2 15 45.5 1 7.1
0 0.0 0 0.0 0 0.0 Am. Ind./Al. Nat. 1 0.5 1 0.5 1 0.5 0 0.0 Am. Ind./Al. Nat. 0 0.0 0 0.0 0 0.0 0 0.0
0 0.0 0 0.0 0 0.0 Asian/Nat.Haw./ Other Pac. Isl. 11 5.8 11 5.3 10 4.9 (1) (9.1) Asian/Nat.Haw./ Other Pac. Isl. 7 20.6 7 20.6 7 21.2 0 0.0
299 305 296 Black 17 8.9 19 9.2 17 8.3 0 0.0 Black 2 5.9 2 5.9 3 9.1 1 50.0
35 35 34 Hispanic 22 11.6 29 14.1 28 13.7 6 27.3 Hispanic 5 14.7 5 14.7 5 15.2 0 0.0
12 14 11 Two or More Races 2 1.1 1 0.5 2 1.0 0 0.0 Two or More Races 0 0.0 0 0.0 0 0.0 0 0.0
47 51 51 White## 100 52.6 105 51.0 103 50.5 3 3.0 White## 18 52.9 18 52.9 17 51.5 (1) (5.6)
Italian American 37 19.5 40 19.4 43 21.1 6 16.2 Italian American 2 5.9 2 5.9 1 3.0 (1) (50.0)
59 65 62 Blank/Not Specified 0 0.0 0 0.0 0 0.0 0 0.0 Blank/Not Specified 0 0.0 0 0.0 0 0.0 0 0.0
4 4 6 0 #### 0 #### 0 #### 0 100.0 0 100.0 0 100.0
382 386 371 TOTAL 190 #### 206 #### 204 #### 14 7.4 TOTAL 34 100.0 34 100.0 33 100.0 (1) (2.9)0 0.0 0 0.0 0 0.0 0 0.0 0 0.0 0 0.0
# Includes American Indian/Alaska Native, Asian/Native Hawaiian/Other Pacific Islander, Black, Hispanic, and Two or More Races. ## Does not include Italian American.Source: CUNY Workforce Demographics by College, Ethnicity, and Gender 2017, 2018 and 2019. NOTE: This report excludes the following types of leaves - Authorized/Unauthorized without pay; Disability no pay; Total Disability; Terminal; and Travia.
2017
OTHER INSTRUCTIONAL STAFF (Full-Time) Includes: Registrar, College Laboratory Technicians, Research, and Hunter HS/ES Series Titles.
HIGHER EDUCATION OFFICER (HEO) SERIES
2017 2018
Part B - TABLE VII - K
# and % Change between
2017 & 2019
The City University of New York
# and % Change between
2017 & 2019
2017 through 2019 Three Year Comparison - INSTRUCTIONAL STAFF (includes substitutes, visitings and acting appointments)COLLEGE OF STATEN ISLAND
EXECUTIVE COMPENSATION PLAN TITLESFACULTY (Full-Time)# and %
Change between 2017 & 2019
2019
2018 2019
# and % Change between
2017 & 2019
2017 2018 2019 # and % Change between
2017 & 2019
Page 30 of 46

2017 2018 2019 2017 2018 2019# % # % # % # % # % # %
Female 103 47.9 100 48.5 101 49.0 (2) (1.9) Female 6 35.3 7 41.2 9 56.3 3 50.0
Male 112 52.1 106 51.5 105 51.0 (7) (6.3) Male 11 64.7 10 58.8 7 43.8 (4) (36.4)
Non-Binary/Not Specified 0 0.0 0 0.0 0 0.0 0 0.0 Non-Binary/Not Specified 0 0.0 0 0.0 0 0.0 0 0.0Total Minority # 98 45.6 99 48.1 98 47.6 0 0.0 Total Minority # 12 70.6 12 70.6 10 62.5 (2) (16.7)
Am. Ind./Al. Nat. 1 0.5 1 0.5 0 0.0 (1) (100.0) Am. Ind./Al. Nat. 0 0.0 0 0.0 0 0.0 0 0.0
Asian/Nat.Haw./ Other Pac. Isl. 31 14.4 32 15.5 33 16.0 2 6.5 Asian/Nat.Haw./ Other Pac. Isl. 0 0.0 0 0.0 0 0.0 0 0.0
INSTRUCTIONAL STAFF (Full-Time) Black 49 22.8 48 23.3 45 21.8 (4) (8.2) Black 9 52.9 9 52.9 6 37.5 (3) (33.3)
Hispanic 17 7.9 18 8.7 20 9.7 3 17.6 Hispanic 3 17.6 3 17.6 4 25.0 1 33.3 Two or More Races 0 0.0 0 0.0 0 0.0 0 0.0 Two or More Races 0 0.0 0 0.0 0 0.0 0 0.0
# % # % # % White## 104 48.4 95 46.1 96 46.6 (8) (7.7) White## 4 23.5 3 17.6 3 18.8 (1) (25.0)
Female 215 54.4 211 55.1 200 54.1 (15) (7.0) Italian American 13 6.0 12 5.8 12 5.8 (1) (7.7) Italian American 1 5.9 2 11.8 3 18.8 2 200.0
Male 180 45.6 172 44.9 170 45.9 (10) (5.6) Blank/Not Specified 0 0.0 0 0.0 0 0.0 0 0.0 Blank/Not Specified 0 0.0 0 0.0 0 0.0 0 0.0
Non-Binary/Not Specified 0 0.0 0 0.0 0 0.0 0 0.0 0 100.0 0 100.0 0 100.0 0 100.0 0 100.0 0 100.0Total Minority # 245 62.0 243 63.4 230 62.2 (15) (6.1) TOTAL 215 100.0 206 100.0 206 100.0 (9) (4.2) TOTAL 17 100.0 17 100.0 16 100.0 (1) (5.9)
Am. Ind./Al. Nat. 1 0.3 1 0.3 0 0.0 (1) (100.0) 0 0.0 0 0.0 0 0.0 0 0.0 0 0.0 0 0.0
Asian/Nat.Haw./Other Pac. Isl. 58 14.7 59 15.4 61 16.5 3 5.2 0 0.0 0 0.0 0 0.0 0 0.0 0 0.0 0 0.0
Black 142 35.9 139 36.3 123 33.2 (19) (13.4)
Hispanic 41 10.4 41 10.7 43 11.6 2 4.9 Two or More Races 3 0.8 3 0.8 3 0.8 0 0.0
White## 135 34.2 125 32.6 124 33.5 (11) (8.1) # % # % # % # % # % # %
Italian American 15 3.8 15 3.9 16 4.3 1 6.7 Female 100 71.4 98 70.0 84 65.6 (16) (16.0) Female 6 26.1 6 30.0 6 30.0 0 0.0
Blank/Not Specified 0 0.0 0 0.0 0 0.0 0 0.0 Male 40 28.6 42 30.0 44 34.4 4 10.0 Male 17 73.9 14 70.0 14 70.0 (3) (17.6)
0 0.0 0 0.0 0 0.0 Non-Binary/Not Specified 0 0.0 0 0.0 0 0.0 0 0.0 Non-Binary/Not Specified 0 0.0 0 0.0 0 0.0 0 0.0
TOTAL 395 100.0 383 100.0 370 100.0 (25) (6.3) Total Minority # 117 83.6 117 83.6 107 83.6 (10) (8.5) Total Minority # 18 78.3 15 75.0 15 75.0 (3) (16.7)
0 0.0 0 0.0 0 0.0 Am. Ind./Al. Nat. 0 0.0 0 0.0 0 0.0 0 0.0 Am. Ind./Al. Nat. 0 0.0 0 0.0 0 0.0 0 0.0
0 0.0 0 0.0 0 0.0 Asian/Nat.Haw./ Other Pac. Isl. 20 14.3 20 14.3 21 16.4 1 5.0 Asian/Nat.Haw./ Other Pac. Isl. 7 30.4 7 35.0 7 35.0 0 0.0
180 172 170 Black 76 54.3 77 55.0 67 52.3 (9) (11.8) Black 8 34.8 5 25.0 5 25.0 (3) (37.5)
142 139 123 Hispanic 19 13.6 18 12.9 17 13.3 (2) (10.5) Hispanic 2 8.7 2 10.0 2 10.0 0 0.0
13 13 13 Two or More Races 2 1.4 2 1.4 2 1.6 0 0.0 Two or More Races 1 4.3 1 5.0 1 5.0 0 0.0
28 28 30 White## 22 15.7 22 15.7 20 15.6 (2) (9.1) White## 5 21.7 5 25.0 5 25.0 0 0.0
Italian American 1 0.7 1 0.7 1 0.8 0 0.0 Italian American 0 0.0 0 0.0 0 0.0 0 0.0
41 41 43 Blank/Not Specified 0 0.0 0 0.0 0 0.0 0 0.0 Blank/Not Specified 0 0.0 0 0.0 0 0.0 0 0.0
3 3 3 0 100.0 0 100.0 0 100.0 0 100.0 0 100.0 0 100.0
135 125 124 TOTAL 140 100.0 140 100.0 128 100.0 (12) (8.6) TOTAL 23 100.0 20 100.0 20 100.0 (3) (13.0)0 0.0 0 0.0 0 0.0 0 0.0 0 0.0 0 0.0
# Includes American Indian/Alaska Native, Asian/Native Hawaiian/Other Pacific Islander, Black, Hispanic, and Two or More Races. ## Does not include Italian American.Source: CUNY Workforce Demographics by College, Ethnicity, and Gender 2017, 2018 and 2019. NOTE: This report excludes the following types of leaves - Authorized/Unauthorized without pay; Disability no pay; Total Disability; Terminal; and Travia.
2017
OTHER INSTRUCTIONAL STAFF (Full-Time) Includes: Registrar, College Laboratory Technicians, Research, and Hunter HS/ES Series Titles.
HIGHER EDUCATION OFFICER (HEO) SERIES
2017 2018
Part B - TABLE VII - L
# and % Change between
2017 & 2019
The City University of New York
# and % Change between
2017 & 2019
2017 through 2019 Three Year Comparison - INSTRUCTIONAL STAFF (includes substitutes, visitings and acting appointments)YORK COLLEGE
EXECUTIVE COMPENSATION PLAN TITLESFACULTY (Full-Time)# and %
Change between 2017 & 2019
2019
2018 2019
# and % Change between
2017 & 2019
2017 2018 2019 # and % Change between
2017 & 2019
Page 31 of 46
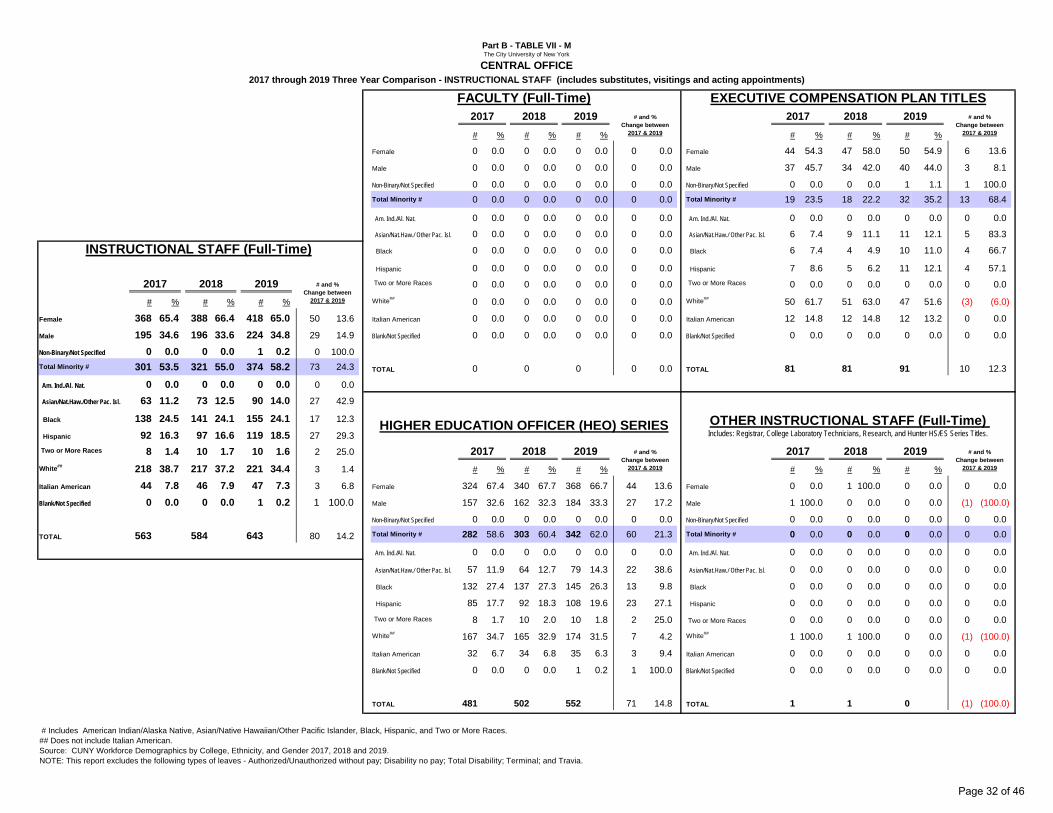
2017 2018 2019 2017 2018 2019# % # % # % # % # % # %
Female 0 0.0 0 0.0 0 0.0 0 0.0 Female 44 54.3 47 58.0 50 54.9 6 13.6
Male 0 0.0 0 0.0 0 0.0 0 0.0 Male 37 45.7 34 42.0 40 44.0 3 8.1
Non-Binary/Not Specified 0 0.0 0 0.0 0 0.0 0 0.0 Non-Binary/Not Specified 0 0.0 0 0.0 1 1.1 1 100.0Total Minority # 0 0.0 0 0.0 0 0.0 0 0.0 Total Minority # 19 23.5 18 22.2 32 35.2 13 68.4
Am. Ind./Al. Nat. 0 0.0 0 0.0 0 0.0 0 0.0 Am. Ind./Al. Nat. 0 0.0 0 0.0 0 0.0 0 0.0
Asian/Nat.Haw./ Other Pac. Isl. 0 0.0 0 0.0 0 0.0 0 0.0 Asian/Nat.Haw./ Other Pac. Isl. 6 7.4 9 11.1 11 12.1 5 83.3
INSTRUCTIONAL STAFF (Full-Time) Black 0 0.0 0 0.0 0 0.0 0 0.0 Black 6 7.4 4 4.9 10 11.0 4 66.7
Hispanic 0 0.0 0 0.0 0 0.0 0 0.0 Hispanic 7 8.6 5 6.2 11 12.1 4 57.1 Two or More Races 0 0.0 0 0.0 0 0.0 0 0.0 Two or More Races 0 0.0 0 0.0 0 0.0 0 0.0
# % # % # % White## 0 0.0 0 0.0 0 0.0 0 0.0 White## 50 61.7 51 63.0 47 51.6 (3) (6.0)
Female 368 65.4 388 66.4 418 65.0 50 13.6 Italian American 0 0.0 0 0.0 0 0.0 0 0.0 Italian American 12 14.8 12 14.8 12 13.2 0 0.0
Male 195 34.6 196 33.6 224 34.8 29 14.9 Blank/Not Specified 0 0.0 0 0.0 0 0.0 0 0.0 Blank/Not Specified 0 0.0 0 0.0 0 0.0 0 0.0
Non-Binary/Not Specified 0 0.0 0 0.0 1 0.2 0 100.0 0 0.0 0 0.0 0 0.0 0 100.0 0 100.0 0 100.0Total Minority # 301 53.5 321 55.0 374 58.2 73 24.3 TOTAL 0 0.0 0 0.0 0 0.0 0 0.0 TOTAL 81 100.0 81 100.0 91 100.0 10 12.3
Am. Ind./Al. Nat. 0 0.0 0 0.0 0 0.0 0 0.0 0 0.0 0 0.0 0 0.0 0 0.0 0 0.0 0 0.0
Asian/Nat.Haw./Other Pac. Isl. 63 11.2 73 12.5 90 14.0 27 42.9 0 0.0 0 0.0 0 0.0 0 0.0 0 0.0 0 0.0
Black 138 24.5 141 24.1 155 24.1 17 12.3
Hispanic 92 16.3 97 16.6 119 18.5 27 29.3 Two or More Races 8 1.4 10 1.7 10 1.6 2 25.0
White## 218 38.7 217 37.2 221 34.4 3 1.4 # % # % # % # % # % # %
Italian American 44 7.8 46 7.9 47 7.3 3 6.8 Female 324 67.4 340 67.7 368 66.7 44 13.6 Female 0 0.0 1 100.0 0 0.0 0 0.0
Blank/Not Specified 0 0.0 0 0.0 1 0.2 1 100.0 Male 157 32.6 162 32.3 184 33.3 27 17.2 Male 1 100.0 0 0.0 0 0.0 (1) (100.0)
0 0.0 0 0.0 0 0.0 Non-Binary/Not Specified 0 0.0 0 0.0 0 0.0 0 0.0 Non-Binary/Not Specified 0 0.0 0 0.0 0 0.0 0 0.0
TOTAL 563 100.0 584 100.0 643 100.0 80 14.2 Total Minority # 282 58.6 303 60.4 342 62.0 60 21.3 Total Minority # 0 0.0 0 0.0 0 0.0 0 0.0
0 0.0 0 0.0 0 0.0 Am. Ind./Al. Nat. 0 0.0 0 0.0 0 0.0 0 0.0 Am. Ind./Al. Nat. 0 0.0 0 0.0 0 0.0 0 0.0
0 0.0 0 0.0 0 0.0 Asian/Nat.Haw./ Other Pac. Isl. 57 11.9 64 12.7 79 14.3 22 38.6 Asian/Nat.Haw./ Other Pac. Isl. 0 0.0 0 0.0 0 0.0 0 0.0
195 196 224 Black 132 27.4 137 27.3 145 26.3 13 9.8 Black 0 0.0 0 0.0 0 0.0 0 0.0
138 141 155 Hispanic 85 17.7 92 18.3 108 19.6 23 27.1 Hispanic 0 0.0 0 0.0 0 0.0 0 0.0
28 26 32 Two or More Races 8 1.7 10 2.0 10 1.8 2 25.0 Two or More Races 0 0.0 0 0.0 0 0.0 0 0.0
64 71 87 White## 167 34.7 165 32.9 174 31.5 7 4.2 White## 1 100.0 1 100.0 0 0.0 (1) (100.0)
Italian American 32 6.7 34 6.8 35 6.3 3 9.4 Italian American 0 0.0 0 0.0 0 0.0 0 0.0
92 97 119 Blank/Not Specified 0 0.0 0 0.0 1 0.2 1 100.0 Blank/Not Specified 0 0.0 0 0.0 0 0.0 0 0.0
8 10 10 0 100.0 0 100.0 0 100.0 0 100.0 0 100.0 0 #DIV/0!
218 217 221 TOTAL 481 100.0 502 100.0 552 100.0 71 14.8 TOTAL 1 100.0 1 100.0 0 #DIV/0! (1) (100.0)0 0.0 0 0.0 0 0.0 0 0.0 0 0.0 0 #DIV/0!
# Includes American Indian/Alaska Native, Asian/Native Hawaiian/Other Pacific Islander, Black, Hispanic, and Two or More Races. ## Does not include Italian American.Source: CUNY Workforce Demographics by College, Ethnicity, and Gender 2017, 2018 and 2019. NOTE: This report excludes the following types of leaves - Authorized/Unauthorized without pay; Disability no pay; Total Disability; Terminal; and Travia.
2017
OTHER INSTRUCTIONAL STAFF (Full-Time) Includes: Registrar, College Laboratory Technicians, Research, and Hunter HS/ES Series Titles.
HIGHER EDUCATION OFFICER (HEO) SERIES
2017 2018
Part B - TABLE VII - M
# and % Change between
2017 & 2019
The City University of New York
# and % Change between
2017 & 2019
2017 through 2019 Three Year Comparison - INSTRUCTIONAL STAFF (includes substitutes, visitings and acting appointments)CENTRAL OFFICE
EXECUTIVE COMPENSATION PLAN TITLESFACULTY (Full-Time)# and %
Change between 2017 & 2019
2019
2018 2019
# and % Change between
2017 & 2019
2017 2018 2019 # and % Change between
2017 & 2019
Page 32 of 46

2017 2018 2019 2017 2018 2019# % # % # % # % # % # %
Female 32 66.7 36 65.5 40 64.5 8 25.0 Female 11 84.6 10 76.9 13 81.3 2 18.2
Male 16 33.3 19 34.5 22 35.5 6 37.5 Male 2 15.4 3 23.1 3 18.8 1 50.0
Non-Binary/Not Specified 0 0.0 0 0.0 0 0.0 0 0.0 Non-Binary/Not Specified 0 0.0 0 0.0 0 0.0 0 0.0Total Minority # 21 43.8 23 41.8 27 43.5 6 28.6 Total Minority # 4 30.8 4 30.8 4 25.0 0 0.0
Am. Ind./Al. Nat. 0 0.0 0 0.0 0 0.0 0 0.0 Am. Ind./Al. Nat. 0 0.0 0 0.0 0 0.0 0 0.0
Asian/Nat.Haw./ Other Pac. Isl. 10 20.8 12 21.8 15 24.2 5 50.0 Asian/Nat.Haw./ Other Pac. Isl. 1 7.7 1 7.7 1 6.3 0 0.0
INSTRUCTIONAL STAFF (Full-Time) Black 8 16.7 9 16.4 9 14.5 1 12.5 Black 3 23.1 3 23.1 3 18.8 0 0.0
Hispanic 3 6.3 2 3.6 3 4.8 0 0.0 Hispanic 0 0.0 0 0.0 0 0.0 0 0.0 Two or More Races 0 0.0 0 0.0 0 0.0 0 0.0 Two or More Races 0 0.0 0 0.0 0 0.0 0 0.0
# % # % # % White## 24 50.0 29 52.7 33 53.2 9 37.5 White## 7 53.8 7 53.8 9 56.3 2 28.6
Female 86 74.1 91 75.2 100 73.5 14 16.3 Italian American 3 6.3 3 5.5 2 3.2 (1) (33.3) Italian American 2 15.4 2 15.4 3 18.8 1 50.0
Male 30 25.9 30 24.8 35 25.7 5 16.7 Blank/Not Specified 0 0.0 0 0.0 0 0.0 0 0.0 Blank/Not Specified 0 0.0 0 0.0 0 0.0 0 0.0
Non-Binary/Not Specified 0 0.0 0 0.0 1 0.7 0 100.0 0 100.0 0 100.0 0 100.0 0 100.0 0 100.0 0 100.0Total Minority # 53 45.7 55 45.5 63 46.3 10 18.9 TOTAL 48 100.0 55 100.0 62 100.0 14 29.2 TOTAL 13 100.0 13 100.0 16 100.0 3 23.1
Am. Ind./Al. Nat. 0 0.0 0 0.0 0 0.0 0 0.0 0 0.0 0 0.0 0 0.0 0 0.0 0 0.0 0 0.0
Asian/Nat.Haw./Other Pac. Isl. 19 16.4 21 17.4 28 20.6 9 47.4 0 0.0 0 0.0 0 0.0 0 0.0 0 0.0 0 0.0
Black 22 19.0 22 18.2 21 15.4 (1) (4.5)
Hispanic 12 10.3 12 9.9 14 10.3 2 16.7 Two or More Races 0 0.0 0 0.0 0 0.0 0 0.0
White## 58 50.0 60 49.6 67 49.3 9 15.5 # % # % # % # % # % # %
Italian American 5 4.3 6 5.0 6 4.4 1 20.0 Female 43 78.2 45 84.9 47 81.0 4 9.3 Female 0 0.0 0 0.0 0 0.0 0 0.0
Blank/Not Specified 0 0.0 0 0.0 0 0.0 0 0.0 Male 12 21.8 8 15.1 10 17.2 (2) (16.7) Male 0 0.0 0 0.0 0 0.0 0 0.0
0 0.0 0 0.0 0 0.0 Non-Binary/Not Specified 0 0.0 0 0.0 1 1.7 1 100.0 Non-Binary/Not Specified 0 0.0 0 0.0 0 0.0 0 0.0
TOTAL 116 100.0 121 100.0 136 100.0 20 17.2 Total Minority # 28 50.9 28 52.8 32 55.2 4 14.3 Total Minority # 0 0.0 0 0.0 0 0.0 0 0.0
0 0.0 0 0.0 0 0.0 Am. Ind./Al. Nat. 0 0.0 0 0.0 0 0.0 0 0.0 Am. Ind./Al. Nat. 0 0.0 0 0.0 0 0.0 0 0.0
0 0.0 0 0.0 0 0.0 Asian/Nat.Haw./ Other Pac. Isl. 8 14.5 8 15.1 12 20.7 4 50.0 Asian/Nat.Haw./ Other Pac. Isl. 0 0.0 0 0.0 0 0.0 0 0.0
30 30 35 Black 11 20.0 10 18.9 9 15.5 (2) (18.2) Black 0 0.0 0 0.0 0 0.0 0 0.0
22 22 21 Hispanic 9 16.4 10 18.9 11 19.0 2 22.2 Hispanic 0 0.0 0 0.0 0 0.0 0 0.0
3 3 3 Two or More Races 0 0.0 0 0.0 0 0.0 0 0.0 Two or More Races 0 0.0 0 0.0 0 0.0 0 0.0
9 9 11 White## 27 49.1 24 45.3 25 43.1 (2) (7.4) White## 0 0.0 0 0.0 0 0.0 0 0.0
Italian American 0 0.0 1 1.9 1 1.7 1 100.0 Italian American 0 0.0 0 0.0 0 0.0 0 0.0
12 12 14 Blank/Not Specified 0 0.0 0 0.0 0 0.0 0 0.0 Blank/Not Specified 0 0.0 0 0.0 0 0.0 0 0.0
0 0 0 0 100.0 0 100.0 0 100.0 0 0.0 0 0.0 0 0.0
58 60 67 TOTAL 55 100.0 53 100.0 58 100.0 3 5.5 TOTAL 0 0.0 0 0.0 0 0.0 0 0.00 0.0 0 0.0 0 0.0 0 ##### 0 ##### 0 #####
# Includes American Indian/Alaska Native, Asian/Native Hawaiian/Other Pacific Islander, Black, Hispanic, and Two or More Races. ## Does not include Italian American.Source: CUNY Workforce Demographics by College, Ethnicity, and Gender 2017, 2018 and 2019. NOTE: This report excludes the following types of leaves - Authorized/Unauthorized without pay; Disability no pay; Total Disability; Terminal; and Travia.
2017
OTHER INSTRUCTIONAL STAFF (Full-Time) Includes: Registrar, College Laboratory Technicians, Research, and Hunter HS/ES Series Titles.
HIGHER EDUCATION OFFICER (HEO) SERIES
2017 2018
Part B - TABLE VII - N
# and % Change between
2017 & 2019
The City University of New York
# and % Change between
2017 & 2019
2017 through 2019 Three Year Comparison - INSTRUCTIONAL STAFF (includes substitutes, visitings and acting appointments)CUNY SCHOOL OF LAW AT QUEENS COLLEGE
EXECUTIVE COMPENSATION PLAN TITLESFACULTY (Full-Time)# and %
Change between 2017 & 2019
2019
2018 2019
# and % Change between
2017 & 2019
2017 2018 2019 # and % Change between
2017 & 2019
Page 33 of 46

2017 2018 2019 2017 2018 2019# % # % # % # % # % # %
Female 27 61.4 30 62.5 32 58.2 5 18.5 Female 6 66.7 8 72.7 10 76.9 4 66.7
Male 17 38.6 18 37.5 23 41.8 6 35.3 Male 3 33.3 3 27.3 3 23.1 0 0.0
Non-Binary/Not Specified 0 0.0 0 0.0 0 0.0 0 0.0 Non-Binary/Not Specified 0 0.0 0 0.0 0 0.0 0 0.0Total Minority # 14 31.8 17 35.4 21 38.2 7 50.0 Total Minority # 4 44.4 3 27.3 5 38.5 1 25.0
Am. Ind./Al. Nat. 0 0.0 0 0.0 0 0.0 0 0.0 Am. Ind./Al. Nat. 0 0.0 0 0.0 0 0.0 0 0.0
Asian/Nat.Haw./ Other Pac. Isl. 4 9.1 5 10.4 5 9.1 1 25.0 Asian/Nat.Haw./ Other Pac. Isl. 1 11.1 1 9.1 1 7.7 0 0.0
INSTRUCTIONAL STAFF (Full-Time) Black 3 6.8 6 12.5 8 14.5 5 166.7 Black 1 11.1 0 0.0 0 0.0 (1) (100.0)
Hispanic 7 15.9 6 12.5 8 14.5 1 14.3 Hispanic 2 22.2 2 18.2 4 30.8 2 100.0 Two or More Races 0 0.0 0 0.0 0 0.0 0 0.0 Two or More Races 0 0.0 0 0.0 0 0.0 0 0.0
# % # % # % White## 27 61.4 29 60.4 31 56.4 4 14.8 White## 4 44.4 7 63.6 7 53.8 3 75.0
Female 69 67.6 83 68.6 89 66.9 20 29.0 Italian American 3 6.8 2 4.2 3 5.5 0 0.0 Italian American 1 11.1 1 9.1 1 7.7 0 0.0
Male 33 32.4 38 31.4 44 33.1 11 33.3 Blank/Not Specified 0 0.0 0 0.0 0 0.0 0 0.0 Blank/Not Specified 0 0.0 0 0.0 0 0.0 0 0.0
Non-Binary/Not Specified 0 0.0 0 0.0 0 0.0 0 0.0 0 100.0 0 100.0 0 100.0 0 100.0 0 100.0 0 100.0Total Minority # 59 57.8 74 61.2 82 61.7 23 39.0 TOTAL 44 100.0 48 100.0 55 100.0 11 25.0 TOTAL 9 100.0 11 100.0 13 100.0 4 44.4
Am. Ind./Al. Nat. 0 0.0 0 0.0 0 0.0 0 0.0 0 0.0 0 0.0 0 0.0 0 0.0 0 0.0 0 0.0
Asian/Nat.Haw./Other Pac. Isl. 15 14.7 16 13.2 16 12.0 1 6.7 0 0.0 0 0.0 0 0.0 0 0.0 0 0.0 0 0.0
Black 25 24.5 36 29.8 37 27.8 12 48.0
Hispanic 18 17.6 21 17.4 27 20.3 9 50.0 Two or More Races 1 1.0 1 0.8 2 1.5 1 100.0
White## 38 37.3 44 36.4 46 34.6 8 21.1 # % # % # % # % # % # %
Italian American 5 4.9 3 2.5 5 3.8 0 0.0 Female 30 76.9 37 77.1 39 76.5 9 30.0 Female 6 60.0 8 57.1 8 57.1 2 33.3
Blank/Not Specified 0 0.0 0 0.0 0 0.0 0 0.0 Male 9 23.1 11 22.9 12 23.5 3 33.3 Male 4 40.0 6 42.9 6 42.9 2 50.0
0 0.0 0 0.0 0 0.0 Non-Binary/Not Specified 0 0.0 0 0.0 0 0.0 0 0.0 Non-Binary/Not Specified 0 0.0 0 0.0 0 0.0 0 0.0
TOTAL 102 100.0 121 100.0 133 100.0 31 30.4 Total Minority # 32 82.1 42 87.5 45 88.2 13 40.6 Total Minority # 9 90.0 12 85.7 11 78.6 2 22.2
0 0.0 0 0.0 0 0.0 Am. Ind./Al. Nat. 0 0.0 0 0.0 0 0.0 0 0.0 Am. Ind./Al. Nat. 0 0.0 0 0.0 0 0.0 0 0.0
0 0.0 0 0.0 0 0.0 Asian/Nat.Haw./ Other Pac. Isl. 5 12.8 3 6.3 4 7.8 (1) (20.0) Asian/Nat.Haw./ Other Pac. Isl. 5 50.0 7 50.0 6 42.9 1 20.0
33 38 44 Black 18 46.2 27 56.3 26 51.0 8 44.4 Black 3 30.0 3 21.4 3 21.4 0 0.0
25 36 37 Hispanic 8 20.5 11 22.9 13 25.5 5 62.5 Hispanic 1 10.0 2 14.3 2 14.3 1 100.0
3 4 6 Two or More Races 1 2.6 1 2.1 2 3.9 1 100.0 Two or More Races 0 0.0 0 0.0 0 0.0 0 0.0
15 17 21 White## 6 15.4 6 12.5 5 9.8 (1) (16.7) White## 1 10.0 2 14.3 3 21.4 2 200.0
Italian American 1 2.6 0 0.0 1 2.0 0 0.0 Italian American 0 0.0 0 0.0 0 0.0 0 0.0
18 21 27 Blank/Not Specified 0 0.0 0 0.0 0 0.0 0 0.0 Blank/Not Specified 0 0.0 0 0.0 0 0.0 0 0.0
1 1 2 0 100.0 0 100.0 0 100.0 0 100.0 0 100.0 0 100.0
38 44 46 TOTAL 39 100.0 48 100.0 51 100.0 12 30.8 TOTAL 10 100.0 14 100.0 14 100.0 4 40.00 0.0 0 0.0 0 0.0 0 0.0 0 0.0 0 0.0
# Includes American Indian/Alaska Native, Asian/Native Hawaiian/Other Pacific Islander, Black, Hispanic, and Two or More Races. ## Does not include Italian American.Source: CUNY Workforce Demographics by College, Ethnicity, and Gender 2017, 2018 and 2019. NOTE: This report excludes the following types of leaves - Authorized/Unauthorized without pay; Disability no pay; Total Disability; Terminal; and Travia.
2019
OTHER INSTRUCTIONAL STAFF (Full-Time) Includes: Registrar, College Laboratory Technicians, Research, and Hunter HS/ES Series Titles.
HIGHER EDUCATION OFFICER (HEO) SERIES
2018
# and % Change between
2017 & 2019
2017 2018 2019 # and % Change between
2017 & 2019
# and % Change between
2017 & 2019
# and % Change between
2017 & 2019
Part B - TABLE VII - OThe City University of New York
CUNY SCHOOL OF MEDICINE - Note: Data prior to 2016 is incorporated with City College2017 through 2019 Three Year Comparison - INSTRUCTIONAL STAFF (includes substitutes, visitings and acting appointments)
FACULTY (Full-Time) EXECUTIVE COMPENSATION PLAN TITLES
# and % Change between
2017 & 2019
2017
2017 2018 2019
Page 34 of 46

2017 2018 2019 2017 2018 2019# % # % # % # % # % # %
Female 14 70.0 14 82.4 17 77.3 3 21.4 Female 5 71.4 3 42.9 6 60.0 1 20.0
Male 6 30.0 3 17.6 5 22.7 (1) (16.7) Male 2 28.6 4 57.1 4 40.0 2 100.0
Non-Binary/Not Specified 0 0.0 0 0.0 0 0.0 0 0.0 Non-Binary/Not Specified 0 0.0 0 0.0 0 0.0 0 0.0Total Minority # 6 30.0 4 23.5 6 27.3 0 0.0 Total Minority # 0 0.0 1 14.3 1 10.0 1 100.0
Am. Ind./Al. Nat. 0 0.0 0 0.0 0 0.0 0 0.0 Am. Ind./Al. Nat. 0 0.0 0 0.0 0 0.0 0 0.0
Asian/Nat.Haw./ Other Pac. Isl. 0 0.0 1 5.9 1 4.5 1 100.0 Asian/Nat.Haw./ Other Pac. Isl. 0 0.0 0 0.0 0 0.0 0 0.0
INSTRUCTIONAL STAFF (Full-Time) Black 4 20.0 1 5.9 3 13.6 (1) (25.0) Black 0 0.0 0 0.0 0 0.0 0 0.0
Hispanic 2 10.0 2 11.8 2 9.1 0 0.0 Hispanic 0 0.0 1 14.3 1 10.0 1 100.0 Two or More Races 0 0.0 0 0.0 0 0.0 0 0.0 Two or More Races 0 0.0 0 0.0 0 0.0 0 0.0
# % # % # % White## 14 70.0 12 70.6 15 68.2 1 7.1 White## 7 100.0 5 71.4 8 80.0 1 14.3
Female 92 77.3 79 80.6 94 78.3 2 2.2 Italian American 0 0.0 1 5.9 1 4.5 1 100.0 Italian American 0 0.0 1 14.3 1 10.0 1 100.0
Male 27 22.7 19 19.4 26 21.7 (1) (3.7) Blank/Not Specified 0 0.0 0 0.0 0 0.0 0 0.0 Blank/Not Specified 0 0.0 0 0.0 0 0.0 0 0.0
Non-Binary/Not Specified 0 0.0 0 0.0 0 0.0 0 0.0 0 100.0 0 100.0 0 100.0 0 100.0 0 100.0 0 100.0Total Minority # 59 49.6 52 53.1 63 52.5 4 6.8 TOTAL 20 100.0 17 100.0 22 100.0 2 10.0 TOTAL 7 100.0 7 100.0 10 100.0 3 42.9
Am. Ind./Al. Nat. 0 0.0 0 0.0 0 0.0 0 0.0 0 0.0 0 0.0 0 0.0 0 0.0 0 0.0 0 0.0
Asian/Nat.Haw./Other Pac. Isl. 10 8.4 14 14.3 16 13.3 6 60.0 0 0.0 0 0.0 0 0.0 0 0.0 0 0.0 0 0.0
Black 17 14.3 13 13.3 18 15.0 1 5.9
Hispanic 31 26.1 23 23.5 27 22.5 (4) (12.9) Two or More Races 1 0.8 2 2.0 2 1.7 1 100.0
White## 54 45.4 39 39.8 49 40.8 (5) (9.3) # % # % # % # % # % # %
Italian American 6 5.0 7 7.1 8 6.7 2 33.3 Female 73 82.0 62 83.8 71 80.7 (2) (2.7) Female 0 0.0 0 0.0 0 0.0 0 0.0
Blank/Not Specified 0 0.0 0 0.0 0 0.0 0 0.0 Male 16 18.0 12 16.2 17 19.3 1 6.3 Male 3 100.0 0 0.0 0 0.0 (3) (100.0)
0 0.0 0 0.0 0 0.0 Non-Binary/Not Specified 0 0.0 0 0.0 0 0.0 0 0.0 Non-Binary/Not Specified 0 0.0 0 0.0 0 0.0 0 0.0
TOTAL 119 100.0 98 100.0 120 100.0 1 0.8 Total Minority # 53 59.6 47 63.5 56 63.6 3 5.7 Total Minority # 0 0.0 0 0.0 0 0.0 0 0.0
0 0.0 0 0.0 0 0.0 Am. Ind./Al. Nat. 0 0.0 0 0.0 0 0.0 0 0.0 Am. Ind./Al. Nat. 0 0.0 0 0.0 0 0.0 0 0.0
0 0.0 0 0.0 0 0.0 Asian/Nat.Haw./ Other Pac. Isl. 10 11.2 13 17.6 15 17.0 5 50.0 Asian/Nat.Haw./ Other Pac. Isl. 0 0.0 0 0.0 0 0.0 0 0.0
27 19 26 Black 13 14.6 12 16.2 15 17.0 2 15.4 Black 0 0.0 0 0.0 0 0.0 0 0.0
17 13 18 Hispanic 29 32.6 20 27.0 24 27.3 (5) (17.2) Hispanic 0 0.0 0 0.0 0 0.0 0 0.0
10 6 6 Two or More Races 1 1.1 2 2.7 2 2.3 1 100.0 Two or More Races 0 0.0 0 0.0 0 0.0 0 0.0
21 17 21 White## 30 33.7 22 29.7 26 29.5 (4) (13.3) White## 3 100.0 0 0.0 0 0.0 (3) (100.0)
Italian American 6 6.7 5 6.8 6 6.8 0 0.0 Italian American 0 0.0 0 0.0 0 0.0 0 0.0
31 23 27 Blank/Not Specified 0 0.0 0 0.0 0 0.0 0 0.0 Blank/Not Specified 0 0.0 0 0.0 0 0.0 0 0.0
1 2 2 0 100.0 0 100.0 0 100.0 0 100.0 0 0.0 0 0.0
54 39 49 TOTAL 89 100.0 74 100.0 88 100.0 (1) (1.1) TOTAL 3 100.0 0 0.0 0 0.0 (3) (100.0)0 0.0 0 0.0 0 0.0 0 0.0 0 0.0 0 0.0
# Includes American Indian/Alaska Native, Asian/Native Hawaiian/Other Pacific Islander, Black, Hispanic, and Two or More Races. ## Does not include Italian American.Source: CUNY Workforce Demographics by College, Ethnicity, and Gender 2017, 2018 and 2019. NOTE: This report excludes the following types of leaves - Authorized/Unauthorized without pay; Disability no pay; Total Disability; Terminal; and Travia.
2017 2018 2019 # and % Change between
2017 & 2019
2017 2018 2019 # and % Change between
2017 & 2019
EXECUTIVE COMPENSATION PLAN TITLESFACULTY (Full-Time)
Part B- TABLE VII - PThe City University of New York
SCHOOL OF PROFESSIONAL STUDIES2017 through 2019 Three Year Comparison - INSTRUCTIONAL STAFF (includes substitutes, visitings and acting appointments)
# and % Change between
2017 & 2019
2017 2018 2019
OTHER INSTRUCTIONAL STAFF (Full-Time) Includes: Registrar, College Laboratory Technicians, Research, and Hunter HS/ES Series Titles.
HIGHER EDUCATION OFFICER (HEO) SERIES
# and % Change between
2017 & 2019
# and % Change between
2017 & 2019
Page 35 of 46

2017 2018 2019 2017 2018 2019# % # % # % # % # % # %
Female 10 47.6 6 35.3 6 37.5 (4) (40.0) Female 2 50.0 3 75.0 4 66.7 2 100.0
Male 11 52.4 11 64.7 10 62.5 (1) (9.1) Male 2 50.0 1 25.0 1 16.7 (1) (50.0)
Non-Binary/Not Specified 0 0.0 0 0.0 0 0.0 0 0.0 Non-Binary/Not Specified 0 0.0 0 0.0 1 16.7 1 100.0Total Minority # 7 33.3 5 29.4 4 25.0 (3) (42.9) Total Minority # 0 0.0 0 0.0 2 33.3 2 100.0
Am. Ind./Al. Nat. 1 4.8 1 5.9 1 6.3 0 0.0 Am. Ind./Al. Nat. 0 0.0 0 0.0 0 0.0 0 0.0
Asian/Nat.Haw./ Other Pac. Isl. 2 9.5 1 5.9 1 6.3 (1) (50.0) Asian/Nat.Haw./ Other Pac. Isl. 0 0.0 0 0.0 0 0.0 0 0.0
INSTRUCTIONAL STAFF (Full-Time) Black 3 14.3 2 11.8 2 12.5 (1) (33.3) Black 0 0.0 0 0.0 0 0.0 0 0.0
Hispanic 1 4.8 1 5.9 0 0.0 (1) (100.0) Hispanic 0 0.0 0 0.0 1 16.7 1 100.0 Two or More Races** 0 0.0 0 0.0 0 0.0 0 0.0 Two or More Races** 0 0.0 0 0.0 1 16.7 1 100.0
# % # % # % White## 14 66.7 12 70.6 12 75.0 (2) (14.3) White## 4 100.0 4 100.0 4 66.7 0 0.0
Female 26 61.9 27 65.9 27 61.4 1 3.8 Italian American 0 0.0 0 0.0 0 0.0 0 0.0 Italian American 0 0.0 0 0.0 0 0.0 0 0.0
Male 16 38.1 14 34.1 15 34.1 (1) (6.3) Blank/Not Specified 0 0.0 0 0.0 0 0.0 0 0.0 Blank/Not Specified 0 0.0 0 0.0 0 0.0 0 0.0
Non-Binary/Not Specified 0 0.0 0 0.0 2 4.5 2 200.0 0 100.0 0 100.0 0 100.0 0 100.0 0 100.0 0 100.0Total Minority # 17 40.5 19 46.3 19 43.2 2 11.8 TOTAL 21 100.0 17 100.0 16 100.0 (5) (23.8) TOTAL 4 100.0 4 100.0 6 100.0 2 50.0
Am. Ind./Al. Nat. 1 2.4 1 2.4 1 2.3 0 0.0 0 0.0 0 0.0 0 0.0 0 0.0 0 0.0 0 0.0
Asian/Nat.Haw./Other Pac. Isl. 3 7.1 3 7.3 3 6.8 0 0.0 0 0.0 0 0.0 0 0.0 0 0.0 0 0.0 0 0.0
Black 4 9.5 3 7.3 4 9.1 0 0.0
Hispanic 8 19.0 11 26.8 9 20.5 1 12.5 Two or More Races** 1 2.4 1 2.4 2 4.5 1 100.0White## 23 54.8 21 51.2 22 50.0 (1) (4.3) # % # % # % # % # % # %
Italian American 2 4.8 1 2.4 1 2.3 (1) (50.0) Female 14 82.4 18 90.0 17 77.3 3 21.4 Female 0 0.0 0 0.0 0 0.0 0 0.0
Blank/Not Specified 0 0.0 0 0.0 2 4.5 2 100.0 Male 3 17.6 2 10.0 4 18.2 1 33.3 Male 0 0.0 0 0.0 0 0.0 0 0.0
0 0.0 0 0.0 0 0.0 Non-Binary/Not Specified 0 0.0 0 0.0 1 4.5 1 100.0 Non-Binary/Not Specified 0 0.0 0 0.0 0 0.0 0 0.0
TOTAL 42 100.0 41 100.0 44 100.0 2 4.8 Total Minority # 10 58.8 14 70.0 13 59.1 3 30.0 Total Minority # 0 0.0 0 0.0 0 0.0 0 0.0
0 0.0 0 0.0 0 0.0 Am. Ind./Al. Nat. 0 0.0 0 0.0 0 0.0 0 0.0 Am. Ind./Al. Nat. 0 0.0 0 0.0 0 0.0 0 0.0
0 0.0 0 0.0 0 0.0 Asian/Nat.Haw./ Other Pac. Isl. 1 5.9 2 10.0 2 9.1 1 100.0 Asian/Nat.Haw./ Other Pac. Isl. 0 0.0 0 0.0 0 0.0 0 0.0
16 14 15 Black 1 5.9 1 5.0 2 9.1 1 100.0 Black 0 0.0 0 0.0 0 0.0 0 0.0
4 3 4 Hispanic 7 41.2 10 50.0 8 36.4 1 14.3 Hispanic 0 0.0 0 0.0 0 0.0 0 0.0
2 3 2 Two or More Races** 1 5.9 1 5.0 1 4.5 0 0.0 Two or More Races** 0 0.0 0 0.0 0 0.0 0 0.0
6 8 7 White## 5 29.4 5 25.0 6 27.3 1 20.0 White## 0 0.0 0 0.0 0 0.0 0 0.0
Italian American 2 11.8 1 5.0 1 4.5 (1) (50.0) Italian American 0 0.0 0 0.0 0 0.0 0 0.0
8 11 9 Blank/Not Specified 0 0.0 0 0.0 2 9.1 2 100.0 Blank/Not Specified 0 0.0 0 0.0 0 0.0 0 0.0
1 1 2 0 100.0 0 100.0 0 100.0 0 0.0 0 0.0 0 0.0
23 21 22 TOTAL 17 100.0 20 100.0 22 100.0 5 29.4 TOTAL 0 0.0 0 0.0 0 0.0 0 0.00 0.0 0 0.0 0 0.0 0 0.0 0 0.0 0 0.0
# Includes American Indian/Alaska Native, Asian/Native Hawaiin/Other Pacific Islander, Black, Hispanic, and Two or More Races. ## Does not include Italian American.Source: CUNY Workforce Demographics by College, Ethnicity, and Gender 2017, 2018 and 2019. NOTE: This report excludes the following types of leaves - Authorized/Unauthorized without pay; Disability no pay; Total Disability; Terminal; and Travia.
2017 2018 2019 # and % Change between
2017 & 2019
2017 2018 2019 # and % Change between
2017 & 2019
EXECUTIVE COMPENSATION PLAN TITLESFACULTY (Full-Time)
Part B - TABLE VII - QThe City University of New York
SCHOOL OF JOURNALISM2017 through 2019 Three Year Comparison - INSTRUCTIONAL STAFF (includes substitutes, visitings and acting appointments)
# and % Change between
2017 & 2019
2017 2018 2019
OTHER INSTRUCTIONAL STAFF (Full-Time) Includes: Registrar, College Laboratory Technicians, Research, and Hunter HS/ES Series Titles.
HIGHER EDUCATION OFFICER (HEO) SERIES
# and % Change between
2017 & 2019
# and % Change between
2017 & 2019
Page 36 of 46

2017 2018 2019 2017 2018 2019# % # % # % # % # % # %
Female 2 33.3 4 66.7 4 100.0 Female 0 0.0 1 50.0 1 100.0
Male 4 66.7 2 33.3 2 100.0 Male 1 100.0 1 50.0 1 100.0
Non-Binary/Not Specified 0 0.0 0 0.0 0 0.0 Non-Binary/Not Specified 0 0.0 0 0.0 0 0.0Total Minority # 4 66.7 3 50.0 3 100.0 Total Minority # 1 100.0 2 100.0 2 100.0
Am. Ind./Al. Nat. 0 0.0 0 0.0 0 0.0 Am. Ind./Al. Nat. 0 0.0 0 0.0 0 0.0
Asian/Nat.Haw./ Other Pac. Isl. 0 0.0 1 16.7 1 100.0 Asian/Nat.Haw./ Other Pac. Isl. 0 0.0 0 0.0 0 0.0
INSTRUCTIONAL STAFF (Full-Time) Black 4 66.7 2 33.3 2 100.0 Black 0 0.0 0 0.0 0 0.0
Hispanic 0 0.0 0 0.0 0 0.0 Hispanic 1 100.0 2 100.0 2 100.0 Two or More Races 0 0.0 0 0.0 0 0.0 Two or More Races 0 0.0 0 0.0 0 0.0
# % # % # % White## 2 33.3 3 50.0 3 100.0 White## 0 0.0 0 0.0 0 0.0
Female 23 60.5 35 70.0 35 100.0 Italian American 0 0.0 0 0.0 0 0.0 Italian American 0 0.0 0 0.0 0 0.0
Male 15 39.5 15 30.0 15 100.0 Blank/Not Specified 0 0.0 0 0.0 0 0.0 Blank/Not Specified 0 0.0 0 0.0 0 0.0
Non-Binary/Not Specified 0 0.0 0 0.0 0 0.0 0 100.0 0 100.0 0 0.0 0 100.0 0 100.0Total Minority # 22 57.9 30 60.0 30 100.0 TOTAL 0.0 6 100.0 6 100.0 6 100.0 TOTAL 0.0 1 100.0 2 100.0 2 100.0
Am. Ind./Al. Nat. 0 0.0 0 0.0 0 0.0 0 0.0 0 0.0 0 0.0 0 0.0 0 0.0 0 0.0
Asian/Nat.Haw./Other Pac. Isl. 2 5.3 5 10.0 5 100.0 0 0.0 0 0.0 0 0.0 0 0.0 0 0.0 0 0.0
Black 10 26.3 11 22.0 11 100.0
Hispanic 10 26.3 11 22.0 11 100.0 Two or More Races 0 0.0 3 6.0 3 100.0
White## 14 36.8 18 36.0 18 100.0 # % # % # % # % # % # %
Italian American 2 5.3 2 4.0 2 100.0 Female 21 72.4 30 75.0 30 100.0 Female 0 0.0 0 0.0 0 0.0
Blank/Not Specified 0 0.0 0 0.0 0 0.0 Male 8 27.6 10 25.0 10 100.0 Male 2 0.0 2 0.0 2 100.0
0 0.0 0 0.0 0 0.0 Non-Binary/Not Specified 0 0.0 0 0.0 0 0.0 Non-Binary/Not Specified 0 0.0 0 0.0 0 0.0
TOTAL 0.0 38 100.0 50 100.0 50 100.0 Total Minority # 17 58.6 25 62.5 25 100.0 Total Minority # 0 0.0 0 0.0 0 0.0
0 0.0 0 0.0 0 0.0 Am. Ind./Al. Nat. 0 0.0 0 0.0 0 0.0 Am. Ind./Al. Nat. 0 0.0 0 0.0 0 0.0
0 0.0 0 0.0 0 0.0 Asian/Nat.Haw./ Other Pac. Isl. 2 6.9 4 10.0 4 100.0 Asian/Nat.Haw./ Other Pac. Isl. 0 0.0 0 0.0 0 0.0
0 15 15 Black 6 20.7 9 22.5 9 100.0 Black 0 0.0 0 0.0 0 0.0
0 10 11 Hispanic 9 31.0 9 22.5 9 100.0 Hispanic 0 0.0 0 0.0 0 0.0
0 4 4 Two or More Races 0 0.0 3 7.5 3 100.0 Two or More Races 0 0.0 0 0.0 0 0.0
0 6 7 White## 10 34.5 13 32.5 13 100.0 White## 2 0.0 2 0.0 2 100.0
Italian American 2 6.9 2 5.0 2 100.0 Italian American 0 0.0 0 0.0 0 0.0
0 10 11 Blank/Not Specified 0 0.0 0 0.0 0 0.0 Blank/Not Specified 0 0.0 0 0.0 0 0.0
0 0 3 0 0.0 0 100.0 0 100.0 0 0.0 2 0.0 2 0.0
0 14 18 TOTAL 0.0 29 100.0 40 100.0 40 100.0 TOTAL 0.0 0.0 0.0 0 0.00 0.0 0 0.0 0 0.0 0 0.0 0 0.0 0 0.0
# Includes American Indian/Alaska Native, Asian/Native Hawaiian/Other Pacific Islander, Black, Hispanic, and Two or More Races. ## Does not include Italian American.Source: CUNY Workforce Demographics by College, Ethnicity, and Gender 2017, 2018 and 2019. NOTE: This report excludes the following types of leaves - Authorized/Unauthorized without pay; Disability no pay; Total Disability; Terminal; and Travia.
Part B - TABLE VII - RThe City University of New York
SCHOOL OF LABOR AND URBAN STUDIES (Established 2018)2017 through 2019 Three Year Comparison - INSTRUCTIONAL STAFF (includes substitutes, visitings and acting appointments)
FACULTY (Full-Time) EXECUTIVE COMPENSATION PLAN TITLES# and %
Change between 2017 & 2019
# and % Change between
2017 & 2019
2018 # and % Change between
2017 & 2019
2017 2019
OTHER INSTRUCTIONAL STAFF (Full-Time) Includes: Registrar, College Laboratory Technicians, Research, and Hunter HS/ES Series Titles.
HIGHER EDUCATION OFFICER (HEO) SERIES
2017 2018 2019 # and % Change between
2017 & 2019
2017 2018 2019 # and % Change between
2017 & 2019
Page 37 of 46

2017 2018 2019 2017 2018 2019# % # % # % # % # % # %
Female 29 58.0 27 58.7 25 56.8 (4) (13.8) Female 3 50.0 7 77.8 8 80.0 5 166.7
Male 21 42.0 19 41.3 19 43.2 (2) (9.5) Male 3 50.0 2 22.2 2 20.0 (1) (33.3)
Non-Binary/Not Specified 0 0.0 0 0.0 0 0.0 0 0.0 Non-Binary/Not Specified 0 0.0 0 0.0 0 0.0 0 0.0Total Minority # 15 30.0 11 23.9 13 29.5 (2) (13.3) Total Minority # 1 16.7 3 33.3 4 40.0 3 300.0
Am. Ind./Al. Nat. 0 0.0 0 0.0 0 0.0 0 0.0 Am. Ind./Al. Nat. 0 0.0 0 0.0 0 0.0 0 0.0
Asian/Nat.Haw./ Other Pac. Isl. 7 14.0 7 15.2 8 18.2 1 14.3 Asian/Nat.Haw./ Other Pac. Isl. 1 16.7 1 11.1 2 20.0 1 100.0
INSTRUCTIONAL STAFF (Full-Time) Black 2 4.0 0 0.0 1 2.3 (1) (50.0) Black 0 0.0 1 11.1 1 10.0 1 100.0
Hispanic 6 12.0 4 8.7 4 9.1 (2) (33.3) Hispanic 0 0.0 1 11.1 1 10.0 1 100.0 Two or More Races 0 0.0 0 0.0 0 0.0 0 0.0 Two or More Races 0 0.0 0 0.0 0 0.0 0 0.0
# % # % # % White## 34 68.0 34 73.9 30 68.2 (4) (11.8) White## 5 83.3 6 66.7 6 60.0 1 20.0
Female 53 64.6 57 67.1 59 66.3 6 11.3 Italian American 1 2.0 1 2.2 1 2.3 0 0.0 Italian American 0 0.0 0 0.0 0 0.0 0 0.0
Male 29 35.4 28 32.9 29 32.6 0 0.0 Blank/Not Specified 0 0.0 0 0.0 0 0.0 0 0.0 Blank/Not Specified 0 0.0 0 0.0 0 0.0 0 0.0
Non-Binary/Not Specified 0 0.0 0 0.0 1 1.1 0 100.0 0 100.0 0 100.0 0 100.0 0 100.0 0 100.0 0 100.0Total Minority # 35 42.7 34 40.0 41 46.1 6 17.1 TOTAL 50 100.0 46 100.0 44 100.0 (6) (12.0) TOTAL 6 100.0 9 100.0 10 100.0 4 66.7
Am. Ind./Al. Nat. 0 0.0 0 0.0 0 0.0 0 0.0 0 0.0 0 0.0 0 0.0 0 0.0 0 0.0 0 0.0
Asian/Nat.Haw./Other Pac. Isl. 11 13.4 12 14.1 16 18.0 5 45.5 0 0.0 0 0.0 0 0.0 0 0.0 0 0.0 0 0.0
Black 12 14.6 9 10.6 12 13.5 0 0.0
Hispanic 12 14.6 13 15.3 13 14.6 1 8.3 Two or More Races 0 0.0 0 0.0 0 0.0 0 0.0
White## 46 56.1 50 58.8 47 52.8 1 2.2 # % # % # % # % # % # %
Italian American 1 1.2 1 1.2 1 1.1 0 0.0 Female 21 80.8 23 76.7 26 76.5 5 23.8 Female 0 0.0 0 0.0 0 0.0 0 0.0
Blank/Not Specified 0 0.0 0 0.0 0 0.0 0 0.0 Male 5 19.2 7 23.3 7 20.6 2 40.0 Male 0 0.0 0 0.0 1 0.0 1 100.0
0 0.0 0 0.0 0 0.0 Non-Binary/Not Specified 0 0.0 0 0.0 1 2.9 1 100.0 Non-Binary/Not Specified 0 0.0 0 0.0 0 0.0 0 0.0
TOTAL 82 100.0 85 100.0 89 100.0 7 8.5 Total Minority # 19 73.1 20 66.7 23 67.6 4 21.1 Total Minority # 0 0.0 0 0.0 1 0.0 1 100.0
0 0.0 0 0.0 0 0.0 Am. Ind./Al. Nat. 0 0.0 0 0.0 0 0.0 0 0.0 Am. Ind./Al. Nat. 0 0.0 0 0.0 0 0.0 0 0.0
0 0.0 0 0.0 0 0.0 Asian/Nat.Haw./ Other Pac. Isl. 3 11.5 4 13.3 5 14.7 2 66.7 Asian/Nat.Haw./ Other Pac. Isl. 0 0.0 0 0.0 1 0.0 1 100.0
29 28 29 Black 10 38.5 8 26.7 10 29.4 0 0.0 Black 0 0.0 0 0.0 0 0.0 0 0.0
12 9 12 Hispanic 6 23.1 8 26.7 8 23.5 2 33.3 Hispanic 0 0.0 0 0.0 0 0.0 0 0.0
4 6 5 Two or More Races 0 0.0 0 0.0 0 0.0 0 0.0 Two or More Races 0 0.0 0 0.0 0 0.0 0 0.0
8 7 8 White## 7 26.9 10 33.3 11 32.4 4 57.1 White## 0 0.0 0 0.0 0 0.0 0 0.0
Italian American 0 0.0 0 0.0 0 0.0 0 0.0 Italian American 0 0.0 0 0.0 0 0.0 0 0.0
12 13 13 Blank/Not Specified 0 0.0 0 0.0 0 0.0 0 0.0 Blank/Not Specified 0 0.0 0 0.0 0 0.0 0 0.0
0 0 0 0 100.0 0 100.0 0 100.0 0 0.0 0 0.0 0 0.0
46 50 47 TOTAL 26 100.0 30 100.0 34 100.0 8 30.8 TOTAL 0 0.0 0 0.0 1 0.0 1 100.00 0.0 0 0.0 0 0.0 0 0.0 0 0.0 0 0.0
# Includes American Indian/Alaska Native, Asian/Native Hawaiian/Other Pacific Islander, Black, Hispanic, and Two or More Races. ## Does not include Italian American.Source: CUNY Workforce Demographics by College, Ethnicity, and Gender 2017, 2018 and 2019. NOTE: This report excludes the following types of leaves - Authorized/Unauthorized without pay; Disability no pay; Total Disability; Terminal; and Travia.
2019
OTHER INSTRUCTIONAL STAFF (Full-Time) Includes: Registrar, College Laboratory Technicians, Research, and Hunter HS/ES Series Titles.
HIGHER EDUCATION OFFICER (HEO) SERIES
2018
# and % Change between
2017 & 2019
2017 2018 2019 # and % Change between
2017 & 2019
# and % Change between
2017 & 2019
# and % Change between
2017 & 2019
Part B - TABLE VII - SThe City University of New York
CUNY SCHOOL OF PUBLIC HEALTH - Note: Data prior to 2016 is incorporated with The Graduate School2017 through 2019 Three Year Comparison - INSTRUCTIONAL STAFF (includes substitutes, visitings and acting appointments)
FACULTY (Full-Time) EXECUTIVE COMPENSATION PLAN TITLES
# and % Change between
2017 & 2019
2017
2017 2018 2019
Page 38 of 46

2017 2018 2019 2017 2018 2019# % # % # % # % # % # %
Female 332 55.1 329 54.6 323 53.7 (9) (2.7) Female 9 42.9 9 45.0 8 42.1 (1) (11.1)
Male 270 44.9 274 45.4 276 45.9 6 2.2 Male 12 57.1 11 55.0 11 57.9 (1) (8.3)
Non-Binary/Not Specified 0 0.0 0 0.0 2 0.3 2 200.0 Non-Binary/Not Specified 0 0.0 0 0.0 0 0.0 0 0.0Total Minority # 272 45.2 278 46.1 276 45.9 4 1.5 Total Minority # 11 52.4 10 50.0 10 52.6 (1) (9.1)
Am. Ind./Al. Nat. 1 0.2 1 0.2 1 0.2 0 0.0 Am. Ind./Al. Nat. 0 0.0 0 0.0 0 0.0 0 0.0
Asian/Nat.Haw./ Other Pac. Isl. 80 13.3 81 13.4 83 13.8 3 3.8 Asian/Nat.Haw./ Other Pac. Isl. 2 9.5 2 10.0 2 10.5 0 0.0
INSTRUCTIONAL STAFF (Full-Time) Black 111 18.4 108 17.9 103 17.1 (8) (7.2) Black 4 19.0 4 20.0 4 21.1 0 0.0
Hispanic 75 12.5 81 13.4 82 13.6 7 9.3 Hispanic 4 19.0 3 15.0 4 21.1 0 0.0 Two or More Races 5 0.8 7 1.2 7 1.2 2 40.0 Two or More Races 1 4.8 1 5.0 0 0.0 (1) (100.0)
# % # % # % White## 301 50.0 297 49.3 297 49.4 (4) (1.3) White## 8 38.1 8 40.0 7 36.8 (1) (12.5)
Female 568 57.9 586 57.8 577 57.2 9 1.6 Italian American 29 4.8 28 4.6 27 4.5 (2) (6.9) Italian American 2 9.5 2 10.0 2 10.5 0 0.0
Male 413 42.1 427 42.2 430 42.6 17 4.1 Blank/Not Specified 0 0.0 0 0.0 1 0.2 1 100.0 Blank/Not Specified 0 0.0 0 0.0 0 0.0 0 0.0
Non-Binary/Not Specified 0 0.0 0 0.0 2 0.2 2 200.0 0 100.0 0 100.0 0 100.0 0 100.0 0 100.0 0 100.0Total Minority # 543 55.4 568 56.1 569 56.4 26 4.8 TOTAL 602 100.0 603 100.0 601 100.0 (1) (0.2) TOTAL 21 100.0 20 100.0 19 100.0 (2) (9.5)
Am. Ind./Al. Nat. 4 0.4 6 0.6 5 0.5 1 25.0 0 0.0 0 0.0 0 0.0 0 0.0 0 0.0 0 0.0
Asian/Nat.Haw./Other Pac. Isl. 127 12.9 131 12.9 133 13.2 6 4.7 0 0.0 0 0.0 0 0.0 0 0.0 0 0.0 0 0.0
Black 246 25.1 252 24.9 246 24.4 0 0.0
Hispanic 155 15.8 165 16.3 168 16.7 13 8.4 Two or More Races 11 1.1 14 1.4 17 1.7 6 54.5
White## 392 40.0 400 39.5 398 39.4 6 1.5 # % # % # % # % # % # %
Italian American 46 4.7 45 4.4 41 4.1 (5) (10.9) Female 214 67.1 234 66.7 233 65.8 19 8.9 Female 13 33.3 14 35.9 13 37.1 0 0.0
Blank/Not Specified 0 0.0 0 0.0 1 0.1 1 100.0 Male 105 32.9 117 33.3 121 34.2 16 15.2 Male 26 66.7 25 64.1 22 62.9 (4) (15.4)
0 0.0 0 0.0 0 0.0 Non-Binary/Not Specified 0 0.0 0 0.0 0 0.0 0 0.0 Non-Binary/Not Specified 0 0.0 0 0.0 0 0.0 0 0.0
TOTAL 981 100.0 1,013 100.0 1,009 100.0 28 2.9 Total Minority # 231 72.4 250 71.2 257 72.6 26 11.3 Total Minority # 29 74.4 30 76.9 26 74.3 (3) (10.3)
0 0.0 0 0.0 0 0.0 Am. Ind./Al. Nat. 3 0.9 5 1.4 4 1.1 1 33.3 Am. Ind./Al. Nat. 0 0.0 0 0.0 0 0.0 0 0.0
0 0.0 0 0.0 0 0.0 Asian/Nat.Haw./ Other Pac. Isl. 40 12.5 43 12.3 43 12.1 3 7.5 Asian/Nat.Haw./ Other Pac. Isl. 5 12.8 5 12.8 5 14.3 0 0.0
413 427 430 Black 118 37.0 128 36.5 128 36.2 10 8.5 Black 13 33.3 12 30.8 11 31.4 (2) (15.4)
246 252 246 Hispanic 65 20.4 68 19.4 72 20.3 7 10.8 Hispanic 11 28.2 13 33.3 10 28.6 (1) (9.1)
33 32 34 Two or More Races 5 1.6 6 1.7 10 2.8 5 100.0 Two or More Races 0 0.0 0 0.0 0 0.0 0 0.0
122 133 134 White## 74 23.2 87 24.8 86 24.3 12 16.2 White## 9 23.1 8 20.5 8 22.9 (1) (11.1)
Italian American 14 4.4 14 4.0 11 3.1 (3) (21.4) Italian American 1 2.6 1 2.6 1 2.9 0 0.0
155 165 168 Blank/Not Specified 0 0.0 0 0.0 0 0.0 0 0.0 Blank/Not Specified 0 0.0 0 0.0 0 0.0 0 0.0
11 14 17 0 100.0 0 100.0 0 100.0 0 100.0 0 100.0 0 100.0
392 400 398 TOTAL 319 100.0 351 100.0 354 100.0 35 11.0 TOTAL 39 100.0 39 100.0 35 100.0 (4) (10.3)0 0.0 0 0.0 0 0.0 0 0.0 0 0.0 0 0.0
# Includes American Indian/Alaska Native, Asian/Native Hawaiian/Other Pacific Islander, Black, Hispanic, and Two or More Races. ## Does not include Italian American.Source: CUNY Workforce Demographics by College, Ethnicity, and Gender 2017, 2018 and 2019. NOTE: This report excludes the following types of leaves - Authorized/Unauthorized without pay; Disability no pay; Total Disability; Terminal; and Travia.
2017
OTHER INSTRUCTIONAL STAFF (Full-Time) Includes: Registrar, College Laboratory Technicians, Research, and Hunter HS/ES Series Titles.
HIGHER EDUCATION OFFICER (HEO) SERIES
2017 2018
Part B - TABLE VII - T
# and % Change between
2017 & 2019
The City University of New York
# and % Change between
2017 & 2019
2017 through 2019 Three Year Comparison - INSTRUCTIONAL STAFF (includes substitutes, visitings and acting appointments)BOROUGH OF MANHATTAN COMMUNITY COLLEGE
EXECUTIVE COMPENSATION PLAN TITLESFACULTY (Full-Time)# and %
Change between 2017 & 2019
2019
2018 2019
# and % Change between
2017 & 2019
2017 2018 2019 # and % Change between
2017 & 2019
Page 39 of 46

2017 2018 2019 2017 2018 2019# % # % # % # % # % # %
Female 164 47.8 157 47.1 150 47.8 (14) (8.5) Female 10 47.6 9 42.9 8 40.0 (2) (20.0)
Male 179 52.2 176 52.9 164 52.2 (15) (8.4) Male 11 52.4 12 57.1 12 60.0 1 9.1
Non-Binary/Not Specified 0 0.0 0 0.0 0 0.0 0 0.0 Non-Binary/Not Specified 0 0.0 0 0.0 0 0.0 0 0.0Total Minority # 169 49.3 170 51.1 157 50.0 (12) (7.1) Total Minority # 15 71.4 14 66.7 13 65.0 (2) (13.3)
Am. Ind./Al. Nat. 0 0.0 1 0.3 0 0.0 0 0.0 Am. Ind./Al. Nat. 0 0.0 0 0.0 0 0.0 0 0.0
Asian/Nat.Haw./ Other Pac. Isl. 40 11.7 38 11.4 38 12.1 (2) (5.0) Asian/Nat.Haw./ Other Pac. Isl. 0 0.0 0 0.0 0 0.0 0 0.0
INSTRUCTIONAL STAFF (Full-Time) Black 75 21.9 69 20.7 64 20.4 (11) (14.7) Black 9 42.9 7 33.3 6 30.0 (3) (33.3)
Hispanic 52 15.2 57 17.1 50 15.9 (2) (3.8) Hispanic 5 23.8 6 28.6 6 30.0 1 20.0 Two or More Races** 2 0.6 5 1.5 5 1.6 3 150.0 Two or More Races** 1 4.8 1 4.8 1 5.0 0 0.0
# % # % # % White## 155 45.2 145 43.5 138 43.9 (17) (11.0) White## 6 28.6 7 33.3 7 35.0 1 16.7
Female 317 54.0 324 54.1 311 55.0 (6) (1.9) Italian American 19 5.5 18 5.4 18 5.7 (1) (5.3) Italian American 0 0.0 0 0.0 0 0.0 0 0.0
Male 270 46.0 275 45.9 254 45.0 (16) (5.9) Blank/Not Specified 0 0.0 0 0.0 1 0.3 1 100.0 Blank/Not Specified 0 0.0 0 0.0 0 0.0 0 0.0
Non-Binary/Not Specified 0 0.0 0 0.0 0 0.0 0 0.0 0 100.0 0 100.0 0 100.0 0 100.0 0 100.0 0 100.0Total Minority # 365 62.2 387 64.6 363 64.2 (2) (0.5) TOTAL 343 100.0 333 100.0 314 100.0 (29) (8.5) TOTAL 21 100.0 21 100.0 20 100.0 (1) (4.8)
Am. Ind./Al. Nat. 1 0.2 2 0.3 1 0.2 0 0.0 0 0.0 0 0.0 0 0.0 0 0.0 0 0.0 0 0.0
Asian/Nat.Haw./Other Pac. Isl. 50 8.5 47 7.8 46 8.1 (4) (8.0) 0 0.0 0 0.0 0 0.0 0 0.0 0 0.0 0 0.0
Black 163 27.8 175 29.2 159 28.1 (4) (2.5)
Hispanic 148 25.2 157 26.2 151 26.7 3 2.0 Two or More Races** 3 0.5 6 1.0 6 1.1 3 100.0White## 196 33.4 187 31.2 175 31.0 (21) (10.7) # % # % # % # % # % # %
Italian American 26 4.4 25 4.2 23 4.1 (3) (11.5) Female 132 68.8 145 68.4 142 71.7 10 7.6 Female 11 35.5 13 39.4 11 33.3 0 0.0
Blank/Not Specified 0 0.0 0 0.0 4 0.7 4 100.0 Male 60 31.3 67 31.6 56 28.3 (4) (6.7) Male 20 64.5 20 60.6 22 66.7 2 10.0
0 0.0 0 0.0 0 0.0 Non-Binary/Not Specified 0 0.0 0 0.0 0 0.0 0 0.0 Non-Binary/Not Specified 0 0.0 0 0.0 0 0.0 0 0.0
TOTAL 587 100.0 599 100.0 565 100.0 (22) (3.7) Total Minority # 154 80.2 174 82.1 164 82.8 10 6.5 Total Minority # 27 87.1 29 87.9 29 87.9 2 7.4
0 0.0 0 0.0 0 0.0 Am. Ind./Al. Nat. 0 0.0 0 0.0 0 0.0 0 0.0 Am. Ind./Al. Nat. 1 3.2 1 3.0 1 3.0 0 0.0
0 0.0 0 0.0 0 0.0 Asian/Nat.Haw./ Other Pac. Isl. 9 4.7 9 4.2 8 4.0 (1) (11.1) Asian/Nat.Haw./ Other Pac. Isl. 1 3.2 0 0.0 0 0.0 (1) (100.0)
270 275 254 Black 70 36.5 87 41.0 78 39.4 8 11.4 Black 9 29.0 12 36.4 11 33.3 2 22.2
163 175 159 Hispanic 75 39.1 78 36.8 78 39.4 3 4.0 Hispanic 16 51.6 16 48.5 17 51.5 1 6.3
44 45 40 Two or More Races** 0 0.0 0 0.0 0 0.0 0 0.0 Two or More Races** 0 0.0 0 0.0 0 0.0 0 0.0
104 112 111 White## 32 16.7 32 15.1 27 13.6 (5) (15.6) White## 3 9.7 3 9.1 3 9.1 0 0.0
Italian American 6 3.1 6 2.8 5 2.5 (1) (16.7) Italian American 1 3.2 1 3.0 0 0.0 (1) (100.0)
148 157 151 Blank/Not Specified 0 0.0 0 0.0 2 1.0 2 100.0 Blank/Not Specified 0 0.0 0 0.0 1 3.0 1 100.0
3 6 6 0 100.0 0 100.0 0 100.0 0 100.0 0 100.0 0 100.0
196 187 175 TOTAL 192 100.0 212 100.0 198 100.0 6 3.1 TOTAL 31 100.0 33 100.0 33 100.0 2 6.50 0.0 0 0.0 0 0.0 0 0.0 0 0.0 0 0.0
# Includes American Indian/Alaska Native, Asian/Native Hawaiin/Other Pacific Islander, Black, Hispanic, and Two or More Races. ## Does not include Italian American.Source: CUNY Workforce Demographics by College, Ethnicity, and Gender 2017, 2018 and 2019. NOTE: This report excludes the following types of leaves - Authorized/Unauthorized without pay; Disability no pay; Total Disability; Terminal; and Travia.
2017
OTHER INSTRUCTIONAL STAFF (Full-Time) Includes: Registrar, College Laboratory Technicians, Research, and Hunter HS/ES Series Titles.
HIGHER EDUCATION OFFICER (HEO) SERIES
2017 2018
Part B - TABLE VII - U
# and % Change between
2017 & 2019
The City University of New York
# and % Change between
2017 & 2019
2017 through 2019 Three Year Comparison - INSTRUCTIONAL STAFF (includes substitutes, visitings and acting appointments)BRONX COMMUNITY COLLEGE
EXECUTIVE COMPENSATION PLAN TITLESFACULTY (Full-Time)# and %
Change between 2017 & 2019
2019
2018 2019
# and % Change between
2017 & 2019
2017 2018 2019 # and % Change between
2017 & 2019
Page 40 of 46

2017 2018 2019 2017 2018 2019# % # % # % # % # % # %
Female 34 59.6 34 60.7 34 63.0 0 0.0 Female 4 44.4 5 45.5 4 40.0 0 0.0
Male 23 40.4 22 39.3 20 37.0 (3) (13.0) Male 5 55.6 6 54.5 6 60.0 1 20.0
Non-Binary/Not Specified 0 0.0 0 0.0 0 0.0 0 0.0 Non-Binary/Not Specified 0 0.0 0 0.0 0 0.0 0 0.0Total Minority # 25 43.9 23 41.1 25 46.3 0 0.0 Total Minority # 2 22.2 5 45.5 5 50.0 3 150.0
Am. Ind./Al. Nat. 0 0.0 0 0.0 0 0.0 0 0.0 Am. Ind./Al. Nat. 0 0.0 0 0.0 0 0.0 0 0.0
Asian/Nat.Haw./ Other Pac. Isl. 8 14.0 7 12.5 7 13.0 (1) (12.5) Asian/Nat.Haw./ Other Pac. Isl. 0 0.0 1 9.1 1 10.0 1 100.0
INSTRUCTIONAL STAFF (Full-Time) Black 10 17.5 9 16.1 10 18.5 0 0.0 Black 1 11.1 2 18.2 2 20.0 1 100.0
Hispanic 5 8.8 5 8.9 6 11.1 1 20.0 Hispanic 0 0.0 1 9.1 1 10.0 1 100.0 Two or More Races 2 3.5 2 3.6 2 3.7 0 0.0 Two or More Races 1 11.1 1 9.1 1 10.0 0 0.0
# % # % # % White## 31 54.4 32 57.1 28 51.9 (3) (9.7) White## 6 66.7 6 54.5 4 40.0 (2) (33.3)
Female 93 66.0 92 66.2 91 68.9 (2) (2.2) Italian American 1 1.8 1 1.8 1 1.9 0 0.0 Italian American 1 11.1 0 0.0 1 10.0 0 0.0
Male 48 34.0 47 33.8 41 31.1 (7) (14.6) Blank/Not Specified 0 0.0 0 0.0 0 0.0 0 0.0 Blank/Not Specified 0 0.0 0 0.0 0 0.0 0 0.0
Non-Binary/Not Specified 0 0.0 0 0.0 0 0.0 0 0.0 0 100.0 0 100.0 0 100.0 0 100.0 0 100.0 0 100.0Total Minority # 84 59.6 86 61.9 89 67.4 5 6.0 TOTAL 57 100.0 56 100.0 54 100.0 (3) (5.3) TOTAL 9 100.0 11 100.0 10 100.0 1 11.1
Am. Ind./Al. Nat. 0 0.0 0 0.0 0 0.0 0 0.0 0 0.0 0 0.0 0 0.0 0 0.0 0 0.0 0 0.0
Asian/Nat.Haw./Other Pac. Isl. 17 12.1 15 10.8 16 12.1 (1) (5.9) 0 0.0 0 0.0 0 0.0 0 0.0 0 0.0 0 0.0
Black 34 24.1 35 25.2 35 26.5 1 2.9
Hispanic 30 21.3 33 23.7 35 26.5 5 16.7 Two or More Races 3 2.1 3 2.2 3 2.3 0 0.0
White## 52 36.9 52 37.4 41 31.1 (11) (21.2) # % # % # % # % # % # %
Italian American 5 3.5 1 0.7 2 1.5 (3) (60.0) Female 54 73.0 53 73.6 52 77.6 (2) (3.7) Female 1 100.0 0 0.0 1 0.0 0 0.0
Blank/Not Specified 0 0.0 0 0.0 0 0.0 0 0.0 Male 20 27.0 19 26.4 15 22.4 (5) (25.0) Male 0 0.0 0 0.0 0 0.0 0 0.0
0 0.0 0 0.0 0 0.0 Non-Binary/Not Specified 0 0.0 0 0.0 0 0.0 0 0.0 Non-Binary/Not Specified 0 0.0 0 0.0 0 0.0 0 0.0
TOTAL 141 100.0 139 100.0 132 100.0 (9) (6.4) Total Minority # 56 75.7 58 80.6 58 86.6 2 3.6 Total Minority # 1 100.0 0 0.0 1 0.0 0 0.0
0 0.0 0 0.0 0 0.0 Am. Ind./Al. Nat. 0 0.0 0 0.0 0 0.0 0 0.0 Am. Ind./Al. Nat. 0 0.0 0 0.0 0 0.0 0 0.0
0 0.0 0 0.0 0 0.0 Asian/Nat.Haw./ Other Pac. Isl. 8 10.8 7 9.7 7 10.4 (1) (12.5) Asian/Nat.Haw./ Other Pac. Isl. 1 100.0 0 0.0 1 0.0 0 0.0
48 47 41 Black 23 31.1 24 33.3 23 34.3 0 0.0 Black 0 0.0 0 0.0 0 0.0 0 0.0
34 35 35 Hispanic 25 33.8 27 37.5 28 41.8 3 12.0 Hispanic 0 0.0 0 0.0 0 0.0 0 0.0
9 9 8 Two or More Races 0 0.0 0 0.0 0 0.0 0 0.0 Two or More Races 0 0.0 0 0.0 0 0.0 0 0.0
21 24 27 White## 15 20.3 14 19.4 9 13.4 (6) (40.0) White## 0 0.0 0 0.0 0 0.0 0 0.0
Italian American 3 4.1 0 0.0 0 0.0 (3) (100.0) Italian American 0 0.0 0 0.0 0 0.0 0 0.0
30 33 35 Blank/Not Specified 0 0.0 0 0.0 0 0.0 0 0.0 Blank/Not Specified 0 0.0 0 0.0 0 0.0 0 0.0
3 3 3 0 100.0 0 100.0 0 100.0 0 100.0 0 0.0 0 0.0
52 52 41 TOTAL 74 100.0 72 100.0 67 100.0 (7) (9.5) TOTAL 1 100.0 0 0.0 1 0.0 0 0.00 0.0 0 0.0 0 0.0 0 0.0 0 0.0 0 0.0
# Includes American Indian/Alaska Native, Asian/Native Hawaiian/Other Pacific Islander, Black, Hispanic, and Two or More Races. ## Does not include Italian American.Source: CUNY Workforce Demographics by College, Ethnicity, and Gender 2017, 2018 and 2019. NOTE: This report excludes the following types of leaves - Authorized/Unauthorized without pay; Disability no pay; Total Disability; Terminal; and Travia.
Part B - TABLE VII - VThe City University of New York
GUTTMAN COMMUNITY COLLEGE2017 through 2019 Three Year Comparison - INSTRUCTIONAL STAFF (includes substitutes, visitings and acting appointments)
# and % Change between
2017 & 2019
# and % Change between
2017 & 2019
EXECUTIVE COMPENSATION PLAN TITLESFACULTY (Full-Time)
2017 # and % Change between
2017 & 2019
2018 2019
OTHER INSTRUCTIONAL STAFF (Full-Time) Includes: Registrar, College Laboratory Technicians, Research, and Hunter HS/ES Series Titles.
HIGHER EDUCATION OFFICER (HEO) SERIES
2017 2018 2019 # and % Change between
2017 & 2019
2019 # and % Change between
2017 & 2019
2017 2018
Page 41 of 46

2017 2018 2019 2017 2018 2019# % # % # % # % # % # %
Female 107 51.9 114 54.8 117 56.3 10 9.3 Female 9 52.9 10 55.6 9 56.3 0 0.0
Male 99 48.1 94 45.2 91 43.8 (8) (8.1) Male 8 47.1 8 44.4 7 43.8 (1) (12.5)
Non-Binary/Not Specified 0 0.0 0 0.0 0 0.0 0 0.0 Non-Binary/Not Specified 0 0.0 0 0.0 0 0.0 0 0.0Total Minority # 113 54.9 117 56.3 117 56.3 4 3.5 Total Minority # 13 76.5 14 77.8 12 75.0 (1) (7.7)
Am. Ind./Al. Nat. 0 0.0 1 0.5 1 0.5 1 100.0 Am. Ind./Al. Nat. 0 0.0 0 0.0 0 0.0 0 0.0
Asian/Nat.Haw./ Other Pac. Isl. 19 9.2 18 8.7 20 9.6 1 5.3 Asian/Nat.Haw./ Other Pac. Isl. 2 11.8 2 11.1 3 18.8 1 50.0
INSTRUCTIONAL STAFF (Full-Time) Black 33 16.0 33 15.9 33 15.9 0 0.0 Black 1 5.9 1 5.6 1 6.3 0 0.0
Hispanic 59 28.6 63 30.3 61 29.3 2 3.4 Hispanic 10 58.8 11 61.1 8 50.0 (2) (20.0) Two or More Races 2 1.0 2 1.0 2 1.0 0 0.0 Two or More Races 0 0.0 0 0.0 0 0.0 0 0.0
# % # % # % White## 86 41.7 84 40.4 83 39.9 (3) (3.5) White## 2 11.8 2 11.1 2 12.5 0 0.0
Female 253 60.4 270 62.4 270 62.1 17 6.7 Italian American 7 3.4 7 3.4 7 3.4 0 0.0 Italian American 2 11.8 2 11.1 2 12.5 0 0.0
Male 166 39.6 163 37.6 165 37.9 (1) (0.6) Blank/Not Specified 0 0.0 0 0.0 1 0.5 1 100.0 Blank/Not Specified 0 0.0 0 0.0 0 0.0 0 0.0
Non-Binary/Not Specified 0 0.0 0 0.0 0 0.0 0 0.0 0 100.0 0 100.0 0 100.0 0 100.0 0 100.0 0 100.0Total Minority # 292 69.7 306 70.7 312 71.7 20 6.8 TOTAL 206 100.0 208 100.0 208 100.0 2 1.0 TOTAL 17 100.0 18 100.0 16 100.0 (1) (5.9)
Am. Ind./Al. Nat. 0 0.0 1 0.2 2 0.5 2 100.0 0 0.0 0 0.0 0 0.0 0 0.0 0 0.0 0 0.0
Asian/Nat.Haw./Other Pac. Isl. 31 7.4 30 6.9 32 7.4 1 3.2 0 0.0 0 0.0 0 0.0 0 0.0 0 0.0 0 0.0
Black 79 18.9 76 17.6 86 19.8 7 8.9
Hispanic 177 42.2 193 44.6 186 42.8 9 5.1 Two or More Races 5 1.2 6 1.4 6 1.4 1 20.0
White## 113 27.0 115 26.6 108 24.8 (5) (4.4) # % # % # % # % # % # %
Italian American 14 3.3 12 2.8 14 3.2 0 0.0 Female 132 72.1 141 72.7 139 70.2 7 5.3 Female 5 38.5 5 38.5 5 38.5 0 0.0
Blank/Not Specified 0 0.0 0 0.0 1 0.2 1 100.0 Male 51 27.9 53 27.3 59 29.8 8 15.7 Male 8 61.5 8 61.5 8 61.5 0 0.0
0 0.0 0 0.0 0 0.0 Non-Binary/Not Specified 0 0.0 0 0.0 0 0.0 0 0.0 Non-Binary/Not Specified 0 0.0 0 0.0 0 0.0 0 0.0
TOTAL 419 100.0 433 100.0 435 100.0 16 3.8 Total Minority # 155 84.7 164 84.5 172 86.9 17 11.0 Total Minority # 11 84.6 11 84.6 11 84.6 0 0.0
0 0.0 0 0.0 0 0.0 Am. Ind./Al. Nat. 0 0.0 0 0.0 0 0.0 0 0.0 Am. Ind./Al. Nat. 0 0.0 0 0.0 1 7.7 1 100.0
0 0.0 0 0.0 0 0.0 Asian/Nat.Haw./ Other Pac. Isl. 10 5.5 10 5.2 9 4.5 (1) (10.0) Asian/Nat.Haw./ Other Pac. Isl. 0 0.0 0 0.0 0 0.0 0 0.0
166 163 165 Black 42 23.0 39 20.1 50 25.3 8 19.0 Black 3 23.1 3 23.1 2 15.4 (1) (33.3)
79 76 86 Hispanic 100 54.6 111 57.2 109 55.1 9 9.0 Hispanic 8 61.5 8 61.5 8 61.5 0 0.0
64 65 65 Two or More Races 3 1.6 4 2.1 4 2.0 1 33.3 Two or More Races 0 0.0 0 0.0 0 0.0 0 0.0
113 128 121 White## 23 12.6 27 13.9 21 10.6 (2) (8.7) White## 2 15.4 2 15.4 2 15.4 0 0.0
Italian American 5 2.7 3 1.5 5 2.5 0 0.0 Italian American 0 0.0 0 0.0 0 0.0 0 0.0
177 193 186 Blank/Not Specified 0 0.0 0 0.0 0 0.0 0 0.0 Blank/Not Specified 0 0.0 0 0.0 0 0.0 0 0.0
5 6 6 0 100.0 0 100.0 0 100.0 0 100.0 0 100.0 0 100.0
113 115 108 TOTAL 183 100.0 194 100.0 198 100.0 15 8.2 TOTAL 13 100.0 13 100.0 13 100.0 0 0.00 0.0 0 0.0 0 0.0 0 0.0 0 0.0 0 0.0
# Includes American Indian/Alaska Native, Asian/Native Hawaiian/Other Pacific Islander, Black, Hispanic, and Two or More Races. ## Does not include Italian American.Source: CUNY Workforce Demographics by College, Ethnicity, and Gender 2017, 2018 and 2019. NOTE: This report excludes the following types of leaves - Authorized/Unauthorized without pay; Disability no pay; Total Disability; Terminal; and Travia.
2017
OTHER INSTRUCTIONAL STAFF (Full-Time) Includes: Registrar, College Laboratory Technicians, Research, and Hunter HS/ES Series Titles.
HIGHER EDUCATION OFFICER (HEO) SERIES
2017 2018
Part B - TABLE VII - W
# and % Change between
2017 & 2019
The City University of New York
# and % Change between
2017 & 2019
2017 through 2019 Three Year Comparison - INSTRUCTIONAL STAFF (includes substitutes, visitings and acting appointments)HOSTOS COMMUNITY COLLEGE
EXECUTIVE COMPENSATION PLAN TITLESFACULTY (Full-Time)# and %
Change between 2017 & 2019
2019
2018 2019
# and % Change between
2017 & 2019
2017 2018 2019 # and % Change between
2017 & 2019
Page 42 of 46

2017 2018 2019 2017 2018 2019# % # % # % # % # % # %
Female 196 54.9 196 54.9 194 54.8 (2) (1.0) Female 8 47.1 9 47.4 13 61.9 5 62.5
Male 161 45.1 161 45.1 160 45.2 (1) (0.6) Male 9 52.9 10 52.6 8 38.1 (1) (11.1)
Non-Binary/Not Specified 0 0.0 0 0.0 0 0.0 0 0.0 Non-Binary/Not Specified 0 0.0 0 0.0 0 0.0 0 0.0Total Minority # 101 28.3 105 29.4 107 30.2 6 5.9 Total Minority # 8 47.1 10 52.6 13 61.9 5 62.5
Am. Ind./Al. Nat. 1 0.3 1 0.3 1 0.3 0 0.0 Am. Ind./Al. Nat. 0 0.0 0 0.0 0 0.0 0 0.0
Asian/Nat.Haw./ Other Pac. Isl. 28 7.8 30 8.4 31 8.8 3 10.7 Asian/Nat.Haw./ Other Pac. Isl. 2 11.8 3 15.8 3 14.3 1 50.0
INSTRUCTIONAL STAFF (Full-Time) Black 44 12.3 45 12.6 44 12.4 0 0.0 Black 5 29.4 5 26.3 7 33.3 2 40.0
Hispanic 27 7.6 27 7.6 27 7.6 0 0.0 Hispanic 1 5.9 2 10.5 3 14.3 2 200.0 Two or More Races 1 0.3 2 0.6 4 1.1 3 300.0 Two or More Races 0 0.0 0 0.0 0 0.0 0 0.0
# % # % # % White## 213 59.7 210 58.8 204 57.6 (9) (4.2) White## 5 29.4 5 26.3 4 19.0 (1) (20.0)
Female 382 60.6 393 61.2 394 61.5 12 3.1 Italian American 43 12.0 42 11.8 43 12.1 0 0.0 Italian American 4 23.5 4 21.1 4 19.0 0 0.0
Male 248 39.4 249 38.8 247 38.5 (1) (0.4) Blank/Not Specified 0 0.0 0 0.0 0 0.0 0 0.0 Blank/Not Specified 0 0.0 0 0.0 0 0.0 0 0.0
Non-Binary/Not Specified 0 0.0 0 0.0 0 0.0 0 0.0 0 100.0 0 100.0 0 100.0 0 100.0 0 100.0 0 100.0Total Minority # 251 39.8 262 40.8 272 42.4 21 8.4 TOTAL 357 100.0 357 100.0 354 100.0 (3) (0.8) TOTAL 17 100.0 19 100.0 21 100.0 4 23.5
Am. Ind./Al. Nat. 4 0.6 4 0.6 4 0.6 0 0.0 0 0.0 0 0.0 0 0.0 0 0.0 0 0.0 0 0.0
Asian/Nat.Haw./Other Pac. Isl. 47 7.5 49 7.6 49 7.6 2 4.3 0 0.0 0 0.0 0 0.0 0 0.0 0 0.0 0 0.0
Black 122 19.4 126 19.6 132 20.6 10 8.2
Hispanic 73 11.6 76 11.8 78 12.2 5 6.8 Two or More Races 5 0.8 7 1.1 9 1.4 4 80.0
White## 319 50.6 320 49.8 306 47.7 (13) (4.1) # % # % # % # % # % # %
Italian American 60 9.5 60 9.3 62 9.7 2 3.3 Female 164 73.2 172 74.5 172 73.8 8 4.9 Female 14 43.8 16 45.7 15 45.5 1 7.1
Blank/Not Specified 0 0.0 0 0.0 1 0.2 1 100.0 Male 60 26.8 59 25.5 61 26.2 1 1.7 Male 18 56.3 19 54.3 18 54.5 0 0.0
0 0.0 0 0.0 0 0.0 Non-Binary/Not Specified 0 0.0 0 0.0 0 0.0 0 0.0 Non-Binary/Not Specified 0 0.0 0 0.0 0 0.0 0 0.0
TOTAL 630 100.0 642 100.0 641 100.0 11 1.7 Total Minority # 129 57.6 132 57.1 138 59.2 9 7.0 Total Minority # 13 40.6 15 42.9 14 42.4 1 7.7
0 0.0 0 0.0 0 0.0 Am. Ind./Al. Nat. 3 1.3 3 1.3 3 1.3 0 0.0 Am. Ind./Al. Nat. 0 0.0 0 0.0 0 0.0 0 0.0
0 0.0 0 0.0 0 0.0 Asian/Nat.Haw./ Other Pac. Isl. 14 6.3 13 5.6 13 5.6 (1) (7.1) Asian/Nat.Haw./ Other Pac. Isl. 3 9.4 3 8.6 2 6.1 (1) (33.3)
248 249 247 Black 69 30.8 70 30.3 75 32.2 6 8.7 Black 4 12.5 6 17.1 6 18.2 2 50.0
122 126 132 Hispanic 40 17.9 42 18.2 43 18.5 3 7.5 Hispanic 5 15.6 5 14.3 5 15.2 0 0.0
18 19 19 Two or More Races 3 1.3 4 1.7 4 1.7 1 33.3 Two or More Races 1 3.1 1 2.9 1 3.0 0 0.0
55 57 59 White## 85 37.9 88 38.1 82 35.2 (3) (3.5) White## 16 50.0 17 48.6 16 48.5 0 0.0
Italian American 10 4.5 11 4.8 12 5.2 2 20.0 Italian American 3 9.4 3 8.6 3 9.1 0 0.0
73 76 78 Blank/Not Specified 0 0.0 0 0.0 1 0.4 1 100.0 Blank/Not Specified 0 0.0 0 0.0 0 0.0 0 0.0
5 7 9 0 100.0 0 100.0 0 100.0 0 100.0 0 100.0 0 100.0
319 320 306 TOTAL 224 100.0 231 100.0 233 100.0 9 4.0 TOTAL 32 100.0 35 100.0 33 100.0 1 3.10 0.0 0 0.0 0 0.0 0 0.0 0 0.0 0 0.0
# Includes American Indian/Alaska Native, Asian/Native Hawaiian/Other Pacific Islander, Black, Hispanic, and Two or More Races. ## Does not include Italian American.Source: CUNY Workforce Demographics by College, Ethnicity, and Gender 2017, 2018 and 2019. NOTE: This report excludes the following types of leaves - Authorized/Unauthorized without pay; Disability no pay; Total Disability; Terminal; and Travia.
2017
OTHER INSTRUCTIONAL STAFF (Full-Time) Includes: Registrar, College Laboratory Technicians, Research, and Hunter HS/ES Series Titles.
HIGHER EDUCATION OFFICER (HEO) SERIES
2017 2018
Part B - TABLE VII - X
# and % Change between
2017 & 2019
The City University of New York
# and % Change between
2017 & 2019
2017 through 2019 Three Year Comparison - INSTRUCTIONAL STAFF (includes substitutes, visitings and acting appointments)KINGSBOROUGH COMMUNITY COLLEGE
EXECUTIVE COMPENSATION PLAN TITLESFACULTY (Full-Time)# and %
Change between 2017 & 2019
2019
2018 2019
# and % Change between
2017 & 2019
2017 2018 2019 # and % Change between
2017 & 2019
Page 43 of 46

2017 2018 2019 2017 2018 2019# % # % # % # % # % # %
Female 236 57.7 233 58.4 227 57.9 (9) (3.8) Female 11 45.8 10 43.5 6 31.6 (5) (45.5)
Male 173 42.3 166 41.6 165 42.1 (8) (4.6) Male 13 54.2 13 56.5 13 68.4 0 0.0
Non-Binary/Not Specified 0 0.0 0 0.0 0 0.0 0 0.0 Non-Binary/Not Specified 0 0.0 0 0.0 0 0.0 0 0.0Total Minority # 181 44.3 177 44.4 170 43.4 (11) (6.1) Total Minority # 8 33.3 9 39.1 10 52.6 2 25.0
Am. Ind./Al. Nat. 0 0.0 0 0.0 0 0.0 0 0.0 Am. Ind./Al. Nat. 0 0.0 0 0.0 0 0.0 0 0.0
Asian/Nat.Haw./ Other Pac. Isl. 73 17.8 73 18.3 71 18.1 (2) (2.7) Asian/Nat.Haw./ Other Pac. Isl. 1 4.2 1 4.3 1 5.3 0 0.0
INSTRUCTIONAL STAFF (Full-Time) Black 63 15.4 59 14.8 55 14.0 (8) (12.7) Black 5 20.8 6 26.1 6 31.6 1 20.0
Hispanic 43 10.5 43 10.8 42 10.7 (1) (2.3) Hispanic 2 8.3 2 8.7 3 15.8 1 50.0 Two or More Races 2 0.5 2 0.5 2 0.5 0 0.0 Two or More Races 0 0.0 0 0.0 0 0.0 0 0.0
# % # % # % White## 208 50.9 202 50.6 201 51.3 (7) (3.4) White## 13 54.2 11 47.8 7 36.8 (6) (46.2)
Female 512 61.9 509 62.5 504 62.9 (8) (1.6) Italian American 20 4.9 20 5.0 21 5.4 1 5.0 Italian American 3 12.5 3 13.0 2 10.5 (1) (33.3)
Male 315 38.1 305 37.5 297 37.1 (18) (5.7) Blank/Not Specified 0 0.0 0 0.0 0 0.0 0 0.0 Blank/Not Specified 0 0.0 0 0.0 0 0.0 0 0.0
Non-Binary/Not Specified 0 0.0 0 0.0 0 0.0 0 0.0 0 100.0 0 100.0 0 100.0 0 100.0 0 100.0 0 100.0Total Minority # 458 55.4 459 56.4 454 56.7 (4) (0.9) TOTAL 409 100.0 399 100.0 392 100.0 (17) (4.2) TOTAL 24 100.0 23 100.0 19 100.0 (5) (20.8)
Am. Ind./Al. Nat. 0 0.0 0 0.0 0 0.0 0 0.0 0 0.0 0 0.0 0 0.0 0 0.0 0 0.0 0 0.0
Asian/Nat.Haw./Other Pac. Isl. 131 15.8 135 16.6 133 16.6 2 1.5 0 0.0 0 0.0 0 0.0 0 0.0 0 0.0 0 0.0
Black 177 21.4 166 20.4 158 19.7 (19) (10.7)
Hispanic 146 17.7 154 18.9 158 19.7 12 8.2 Two or More Races 4 0.5 4 0.5 5 0.6 1 25.0
White## 329 39.8 316 38.8 308 38.5 (21) (6.4) # % # % # % # % # % # %
Italian American 40 4.8 39 4.8 39 4.9 (1) (2.5) Female 244 69.3 246 70.3 252 72.2 8 3.3 Female 21 50.0 20 47.6 19 46.3 (2) (9.5)
Blank/Not Specified 0 0.0 0 0.0 0 0.0 0 0.0 Male 108 30.7 104 29.7 97 27.8 (11) (10.2) Male 21 50.0 22 52.4 22 53.7 1 4.8
0 0.0 0 0.0 0 0.0 Non-Binary/Not Specified 0 0.0 0 0.0 0 0.0 0 0.0 Non-Binary/Not Specified 0 0.0 0 0.0 0 0.0 0 0.0
TOTAL 827 100.0 814 100.0 801 100.0 (26) (3.1) Total Minority # 242 68.8 247 70.6 248 71.1 6 2.5 Total Minority # 27 64.3 26 61.9 26 63.4 (1) (3.7)
0 0.0 0 0.0 0 0.0 Am. Ind./Al. Nat. 0 0.0 0 0.0 0 0.0 0 0.0 Am. Ind./Al. Nat. 0 0.0 0 0.0 0 0.0 0 0.0
0 0.0 0 0.0 0 0.0 Asian/Nat.Haw./ Other Pac. Isl. 49 13.9 52 14.9 52 14.9 3 6.1 Asian/Nat.Haw./ Other Pac. Isl. 8 19.0 9 21.4 9 22.0 1 12.5
315 305 297 Black 104 29.5 97 27.7 93 26.6 (11) (10.6) Black 5 11.9 4 9.5 4 9.8 (1) (20.0)
177 166 158 Hispanic 87 24.7 96 27.4 100 28.7 13 14.9 Hispanic 14 33.3 13 31.0 13 31.7 (1) (7.1)
30 33 30 Two or More Races 2 0.6 2 0.6 3 0.9 1 50.0 Two or More Races 0 0.0 0 0.0 0 0.0 0 0.0
116 121 128 White## 96 27.3 90 25.7 88 25.2 (8) (8.3) White## 12 28.6 13 31.0 12 29.3 0 0.0
Italian American 14 4.0 13 3.7 13 3.7 (1) (7.1) Italian American 3 7.1 3 7.1 3 7.3 0 0.0
146 154 158 Blank/Not Specified 0 0.0 0 0.0 0 0.0 0 0.0 Blank/Not Specified 0 0.0 0 0.0 0 0.0 0 0.0
4 4 5 0 100.0 0 100.0 0 100.0 0 100.0 0 100.0 0 100.0
329 316 308 TOTAL 352 100.0 350 100.0 349 100.0 (3) (0.9) TOTAL 42 100.0 42 100.0 41 100.0 (1) (2.4)0 0.0 0 0.0 0 0.0 0 0.0 0 0.0 0 0.0
# Includes American Indian/Alaska Native, Asian/Native Hawaiian/Other Pacific Islander, Black, Hispanic, and Two or More Races. ## Does not include Italian American.Source: CUNY Workforce Demographics by College, Ethnicity, and Gender 2017, 2018 and 2019. NOTE: This report excludes the following types of leaves - Authorized/Unauthorized without pay; Disability no pay; Total Disability; Terminal; and Travia.
2017
OTHER INSTRUCTIONAL STAFF (Full-Time) Includes: Registrar, College Laboratory Technicians, Research, and Hunter HS/ES Series Titles.
HIGHER EDUCATION OFFICER (HEO) SERIES
2017 2018
Part B - TABLE VII - Y
# and % Change between
2017 & 2019
The City University of New York
# and % Change between
2017 & 2019
2017 through 2019 Three Year Comparison - INSTRUCTIONAL STAFF (includes substitutes, visitings and acting appointments)LAGUARDIA COMMUNITY COLLEGE
EXECUTIVE COMPENSATION PLAN TITLESFACULTY (Full-Time)# and %
Change between 2017 & 2019
2019
2018 2019
# and % Change between
2017 & 2019
2017 2018 2019 # and % Change between
2017 & 2019
Page 44 of 46

2017 2018 2019 2017 2018 2019# % # % # % # % # % # %
Female 223 52.1 229 52.3 224 52.7 1 0.4 Female 11 50.0 10 47.6 12 57.1 1 9.1
Male 205 47.9 209 47.7 200 47.1 (5) (2.4) Male 11 50.0 11 52.4 9 42.9 (2) (18.2)
Non-Binary/Not Specified 0 0.0 0 0.0 1 0.2 1 100.0 Non-Binary/Not Specified 0 0.0 0 0.0 0 0.0 0 0.0Total Minority # 138 32.2 155 35.4 153 36.0 15 10.9 Total Minority # 4 18.2 5 23.8 6 28.6 2 50.0
Am. Ind./Al. Nat. 1 0.2 1 0.2 1 0.2 0 0.0 Am. Ind./Al. Nat. 0 0.0 0 0.0 0 0.0 0 0.0
Asian/Nat.Haw./ Other Pac. Isl. 62 14.5 69 15.8 69 16.2 7 11.3 Asian/Nat.Haw./ Other Pac. Isl. 1 4.5 2 9.5 2 9.5 1 100.0
INSTRUCTIONAL STAFF (Full-Time) Black 41 9.6 45 10.3 45 10.6 4 9.8 Black 1 4.5 2 9.5 1 4.8 0 0.0
Hispanic 30 7.0 36 8.2 34 8.0 4 13.3 Hispanic 2 9.1 1 4.8 2 9.5 0 0.0 Two or More Races 4 0.9 4 0.9 4 0.9 0 0.0 Two or More Races 0 0.0 0 0.0 1 4.8 1 100.0
# % # % # % White## 263 61.4 257 58.7 243 57.2 (20) (7.6) White## 12 54.5 11 52.4 11 52.4 (1) (8.3)
Female 402 55.2 426 56.7 419 57.2 17 4.2 Italian American 27 6.3 26 5.9 28 6.6 1 3.7 Italian American 6 27.3 5 23.8 4 19.0 (2) (33.3)
Male 326 44.8 325 43.3 313 42.7 (13) (4.0) Blank/Not Specified 0 0.0 0 0.0 1 0.2 1 100.0 Blank/Not Specified 0 0.0 0 0.0 0 0.0 0 0.0
Non-Binary/Not Specified 0 0.0 0 0.0 1 0.1 1 100.0 0 100.0 0 100.0 0 100.0 0 100.0 0 100.0 0 100.0Total Minority # 279 38.3 312 41.5 312 42.6 33 11.8 TOTAL 428 100.0 438 100.0 425 100.0 (3) (0.7) TOTAL 22 100.0 21 100.0 21 100.0 (1) (4.5)
Am. Ind./Al. Nat. 1 0.1 1 0.1 2 0.3 1 100.0 0 0.0 0 0.0 0 0.0 0 0.0 0 0.0 0 0.0
Asian/Nat.Haw./Other Pac. Isl. 107 14.7 117 15.6 117 16.0 10 9.3 0 0.0 0 0.0 0 0.0 0 0.0 0 0.0 0 0.0
Black 82 11.3 93 12.4 88 12.0 6 7.3
Hispanic 82 11.3 92 12.3 92 12.6 10 12.2 Two or More Races 7 1.0 9 1.2 13 1.8 6 85.7
White## 396 54.4 386 51.4 365 49.8 (31) (7.8) # % # % # % # % # % # %
Italian American 53 7.3 53 7.1 55 7.5 2 3.8 Female 160 69.3 178 72.7 175 72.9 15 9.4 Female 8 17.0 9 19.1 8 17.0 0 0.0
Blank/Not Specified 0 0.0 0 0.0 1 0.1 1 100.0 Male 71 30.7 67 27.3 65 27.1 (6) (8.5) Male 39 83.0 38 80.9 39 83.0 0 0.0
0 0.0 0 0.0 0 0.0 Non-Binary/Not Specified 0 0.0 0 0.0 0 0.0 0 0.0 Non-Binary/Not Specified 0 0.0 0 0.0 0 0.0 0 0.0
TOTAL 728 100.0 751 100.0 733 100.0 5 0.7 Total Minority # 112 48.5 127 51.8 128 53.3 16 14.3 Total Minority # 25 53.2 25 53.2 25 53.2 0 0.0
0 0.0 0 0.0 0 0.0 Am. Ind./Al. Nat. 0 0.0 0 0.0 1 0.4 1 100.0 Am. Ind./Al. Nat. 0 0.0 0 0.0 0 0.0 0 0.0
0 0.0 0 0.0 0 0.0 Asian/Nat.Haw./ Other Pac. Isl. 34 14.7 36 14.7 37 15.4 3 8.8 Asian/Nat.Haw./ Other Pac. Isl. 10 21.3 10 21.3 9 19.1 (1) (10.0)
326 325 313 Black 36 15.6 41 16.7 37 15.4 1 2.8 Black 4 8.5 5 10.6 5 10.6 1 25.0
82 93 88 Hispanic 39 16.9 45 18.4 45 18.8 6 15.4 Hispanic 11 23.4 10 21.3 11 23.4 0 0.0
7 11 12 Two or More Races 3 1.3 5 2.0 8 3.3 5 166.7 Two or More Races 0 0.0 0 0.0 0 0.0 0 0.0
75 81 80 White## 101 43.7 98 40.0 91 37.9 (10) (9.9) White## 20 42.6 20 42.6 20 42.6 0 0.0
Italian American 18 7.8 20 8.2 21 8.8 3 16.7 Italian American 2 4.3 2 4.3 2 4.3 0 0.0
82 92 92 Blank/Not Specified 0 0.0 0 0.0 0 0.0 0 0.0 Blank/Not Specified 0 0.0 0 0.0 0 0.0 0 0.0
7 9 13 0 100.0 0 100.0 0 100.0 0 100.0 0 100.0 0 100.0
396 386 365 TOTAL 231 100.0 245 100.0 240 100.0 9 3.9 TOTAL 47 100.0 47 100.0 47 100.0 0 0.00 0.0 0 0.0 0 0.0 0 0.0 0 0.0 0 0.0
# Includes American Indian/Alaska Native, Asian/Native Hawaiian/Other Pacific Islander, Black, Hispanic, and Two or More Races. ## Does not include Italian American.Source: CUNY Workforce Demographics by College, Ethnicity, and Gender 2017, 2018 and 2019. NOTE: This report excludes the following types of leaves - Authorized/Unauthorized without pay; Disability no pay; Total Disability; Terminal; and Travia.
2017
OTHER INSTRUCTIONAL STAFF (Full-Time) Includes: Registrar, College Laboratory Technicians, Research, and Hunter HS/ES Series Titles.
HIGHER EDUCATION OFFICER (HEO) SERIES
2017 2018
Part B - TABLE VII - Z
# and % Change between
2017 & 2019
The City University of New York
# and % Change between
2017 & 2019
2017 through 2019 Three Year Comparison - INSTRUCTIONAL STAFF (includes substitutes, visitings and acting appointments)QUEENSBOROUGH COMMUNITY COLLEGE
EXECUTIVE COMPENSATION PLAN TITLESFACULTY (Full-Time)# and %
Change between 2017 & 2019
2019
2018 2019
# and % Change between
2017 & 2019
2017 2018 2019 # and % Change between
2017 & 2019
Page 45 of 46

LAST PAGE (intentionally left blank)
Page 46 of 46