three-stage potassium turbine performance testsummary the three-stage turbine was tested in...
TRANSCRIPT

N A S A C O N T R A C T O R R E P O R T
THREE-STAGE POTASSIUM TURBINE PERFORMANCE TEST SUMMARY
by G. C. Wesling
Prepared by GENERAL ELECTRIC CO. Cincinnati, Ohio for Lewis Research Center
N A T I O N A L A E R O N A U T I C S A N D S P A C E A D M I N I S T R A T I O N W A S H I N G T O N , D . C. DECEMBER 1 9 6 9
https://ntrs.nasa.gov/search.jsp?R=19700003123 2020-04-22T08:49:27+00:00Z

NASA CR-1483 TECH LIBRARY KAFB, NY
THREE-STAGE POTASSIUM TURBME PERFORMANCE TEST SUMMARY
By G. C. Wesling
Distribution of this report is provided in the interest of information exchange. Responsibility for the contents resides in the author or organization that prepared it.
Issued by Originator as Report No. GESP-271
Prepared under Contract No. NAS 3-10606 by GENERAL ELECTFUC CO.
Cincinnati, Ohio
for Lewis Research Center
NATIONAL AERONAUTICS AND SPACE ADMINISTRATION
For sale by the Clearinghouse for Federal Scientific and Technical Information Springfield, Virginia 22151 - Price $3.00


FOREWORD
The research described herein was conducted at the General Electric Company under NASA Contract NAS 3-10606. The project was managed by Mr. Joseph P. Joyce, Space Power Systems Division, NASA Lewis Research Center, with Mr . George M. Kaplan, Space Power Systems Division, NASA Lewis Research Center, as technical advisor. The report was originally is- sued as General Electric report GESP-271.

. . . . . .. ~

CONTENTS
Page N u m b e r
I n t r o d u c t i o n . . . . . . . . . . . . . . . . . . . . . . . . . 1
Predicted Performance . . . . . . . . . . . . . . . . . . . . 3
Performance Test . . . . . . . . . . . . . . . . . . . . . . . 4
E v a l u a t i o n . . . . . . . . . . . . . . . . . . . . . . . . . . 8
C a l c u l a t i o n Model . . . . . . . . . . . . . . . . . . . . . . 9
Concluding Remarks . . . . . . . . . . . . . . . . . . . . . . 11
References . . . . . . . . . . . . . . . . . . . . . . . . . . . 12
L
V
" .

". . . . . . . . . . . . . -. -. ._ . . .... - . . "-

SUMMARY
T h e t h r e e - s t a g e t u r b i n e was t e s t e d i n p o t a s s i u m v a p o r a t r o t a t i v e
s p e e d s from 15,000 to 20,000 rpm, i n l e t v a p o r t e m p e r a t u r e s of 1450 and
1 5 5 0 ° F , a n d t u r b i n e p r e s s u r e ratios from 3 t o 10. The measured to ta l t o
t o t a l e f f i c i e n c y of 76 p e r c e n t a t t h e d e s i g n c o n d i t i o n s o f 1 8 , 2 5 0 rpm,
1550OF i n l e t temperature and a total p r e s s u r e ra t io o f 7.9 agreed w i t h
t h e p e r f o r m a n c e p r e d i c t i o n s . The p e r f o r m a n c e c a l c u l a t i o n m o d e l was
changed from assumed s u p e r s a t u r a t e d e x p a n s i o n t h r o u g h each s t age , w i t h
r e v e r s i o n t o e q u i l i b r i u m properties a t e a c h stage exi t , to e q u i l i b r i u m
p r o p e r t i e s a t each p o i n t i n the t u r b i n e e x p a n s i o n , based on t h e r e s u l t s
of these pe r fo rmance tests.
vi i


INTRODUCTI ON
L a t t e r s t a g e s of Rank ine Cyc le po ta s s ium tu rb ines will operate i n
t h e w e t v a p o r r e g i o n for t h e l i fe of the space power sys tem, e .g . , 3 t o
years . Based on steam t u r b i n e e x p e r i e n c e , i t is known t h a t t u r b i n e metal
co r ros ion and rotor blade impact damage could occur i n t h e s e l a t te r s t a g e s
w h e r e b l a d e t i p speeds are g r e a t e s t . A two-stage potassium vapor t u r -
was d e s i g n e d , b u i l t a n d tested under NASA C o n t r a c t NAS5-11.13.
T h i s t u r b i n e had about four p e r c e n t l i q u i d e n t e r i n g t h e s e c o n d s t a g e
which had a rotor t i p v e l o c i t y of 770 ft/sec a t the endurance test condi -
t i o n s . A f t e r 5000 h o u r s o f t e s t i n g a t t h e s e c o n d i t i o n s , t h e r e w a s no
ev idence o f impact damage on the tu rb ine rotor b l a d e s . (3)
Under NASA C o n t r a c t NAS3-8520 a t h r e e - s t a g e p o t a s s i u m v a p o r t u r b i n e
was des igned t o a c h i e v e h i g h e r l e v e l s of mob t u r e a n d t i p v e l o c i t y . A
vapor wetness of between 8 and 10 p e r c e n t w a s s p e c i f i e d a t t h e i n l e t of
t h e t h i r d s t a g e s i n c e it w a s :
1) Cons ide red ach ievab le by p r o p e r l o a d i n g o f t h e prior s t a g e s ,
2 ) R e p r e s e n t a t i v e of t h e q u a l i t y c o n s i d e r e d i n R a n k i n e C y c l e
s y s t e m s t u d i e s , a n d
3) Deep enough i n t h e w e t r e g i o n t o demons t r a t e poss ib l e p rob lems
of t u r b i n e m e t a l c o r r o s i o n a n d rotor b lade impac t damage.
Major p rogram objec t ives -re t o de te rmine whe the r impac t e ros ion would
be a problem for p o t a s s i u m v a p o r t u r b i n e s a n d t o refine t h e f l u i d d e s i g n
m e t h o d s f o r v a p o r t u r b i n e s o p e r a t i n g i n t h e m t r e g i o n .
* N u m b e r s i n p a r e n t h e s e s i n d i c a t e r e f e r e n c e s l i s t e d i n t h i s r e p o r t .

T h e t u r b i n e d e s i g n c a l c u l a t i o n s =re based on a c a l c u l a t i o n m o d e l
which assumed supersaturated vapor expansions i n e a c h t u r b i n e s t a g e w i t h
r e v e r s i o n t o e q u i l i b r i u m c o n d i t i o n s af ter e a c h rotor blade row. The
test results of t h e t w o - s t a g e t u r b i n e ( 2 ) s u p p o r t e d t h e s e l e c t i o n of this
model. For example , t he , s t anda rd dev ia t ion of a l l the expe r imen ta l power
o u t p u t data from t h e p r e d i c t e d v a l u e s was 5.8 KW. T h e s t a n d a r d d e v i a t i o n
o f a l l t h e e f f i c i e n c y data from t h e calculated v a l u e s was 4.4 p e r c e n t a g e
p o i n t s . The f l u i d d e s i g n of t h e t h r e e - s t a g e t u r b i n e was carried o u t by
add ing a t h i r d stage t o t h e two-stage t u r b i n e d e s i g n . (4 1
T h i s r e p o r t p r e s e n t s t h e r e s u l t s of t h e p e r f o r m a n c e t e s t i n g o f t h e
t h r e e - s t a g e p o t a s s i u m v a p o r t u r b i n e . T e s t r e s u l t s are p r e s e n t e d i n terms
of blading power ou tput , vapor f l o w rate, t u r b i n e e f f i c l e n c y a n d t u r b i n e
p r e s s u r e ra t io . Also p r e s e n t e d are t h e s t a t i c p r e s s u r e d i s t r i b u t i o n s
t h r o u g h t h e t u r b i n e . T h e p r e d i c t e d t u r b i n e p e r f o r m a n c e was c a l c u l a t e d
w i t h a n off design program and is shown fo r compar ison wi th t h e test
results .
2

PRgDICI'ED WRFORIIANa
The performance p r e d i c t i o n s for the t h r e e - s t a g e p o t a s s i u m t u r b i n e
were c a l c u l a t e d u s i n g a n o f f - d e s i g n c o m p u t e r p r o g r a m . I n t h i s p r o g r a m ,
the d e s i g n i n c i d e n c e total-pressure loss c o e f f i c i e n t for e a c h blade row
is i n p u t as a f u n c t i o n of t u r n i n g angle, maximum a n d t r a i l i n g e d g e
th i ckness , and degree of reac t ion . The to ta l p r e s s u r e loss c o e f f i c i e n t
for each blade row is v a r i e d i n t h e p r o g r a m a c c o r d i n g t o t h e i n c i d e n c e
a n g l e of t h e v a p o r f l o w r e l a t i v e t o t h e b l a d e , u s i n g t h e d e s i g n i n c i d e n c e
.value as a base. The i n i t i a l off d e s i m c a l c u l a t i o n s were based on t he
s u p e r s a t u r a t e d e x p a n s i o n model w i t h r e v e r s i o n t o e q u i l i b r i u m after e a c h
s t age . Va lues are i n p u t t o the program for t h e f o l l o w i n g :
F low pa th d imens ions and b lad ing angles .
Nozzle f l o w c o e f f i c i e n t s d e t e r m i n e d by a i r tests.
Rotor b l a d e c o e f f i c i e n t s , c a l c u l a t e d from drawings and inspec-
t i o n r e p o r t s .
T o t a l p r e s s u r e loss c o e f f i c i e n t s , c a l c u l a t e d f r o m e x p e r i m e n t a l
r e s u l t s . ( 5 )
T h e s e i n c l u d e t h e p r o f i l e losses, secondary f l o w and t i p c l e a r a n c e
losses. Mois tu re losses were h a n d l e d s e p a r a t e l y i n t w o ways; only t h e
vapor f l o w was assumea t o be w o r k i n g f l u i d ana t h e condensed l i qu id was
assumed t o absorb e n e r g y from t h e rotor by b e i n g accelerated t o rotor t i p
speed.
The c a l c u l a t e d f l o w rate, b l a d i n g pouer and turbine e f f i c i e n c y are
shown i n F i g u r e s 1 th rough 6, for 15,400, 18,250, and 20,000 rpm, and
i n l e t v a p o r t e m p e r a t u r e s of 1450 and 1550OF. Shown i n F i g u r e s 7 and 8
are t h e c a l c u l a t e d v a l u e s of v a p o r q u a l i t y a t t h e exit of e a c h rotor.

PERFORMANCE TEST
A performance test of t h e t h r e e - s t a g e p o t a s s i u m t u r b i n e was con-
d u c t e d w i t h i n l e t v a p o r t e m p e r a t u r e s of 1450 and 1550”F, s i x r o t a t i v e
speeds between 15,400 and 20,000 rpm, and s i x p r e s s u r e ra t ios between 3
and 10 . About ha l f o f the po in ts were t a k e n twice so t h a t t h e r e p e a t a -
b i l i t y c o u l d be e s t a b l i s h e d , a n d a t o t a l of 96 dat,a p o i n t s were t aken .
A d r a w i n g o f t h e p o t a s s i u m t u r b i n e i s shown i n F i g u r e 9. The vapor
e n t e r s t h e t u r b i n e f r o m t h e d u c t o n t h e l e f t s i d e a n d flows down o u t of
t h e sc ro l l i n t o a condenser . The tu rb ine power is abso rbed by a wa te r
brake which i s connected t o t h e t u r b i n e s h a f t o n t h e r i g h t s i d e .
Vapor p r e s s u r e s were measured a t 54 l oca t ions and vapor t empera tu res
were measured a t 28 l o c a t i o n s i n t h e t u r b i n e d u r i n g t h e p e r f o r m a n c e
t e s t i n g . An i n s t r u m e n t a t i o n l ist is shown i n T a b l e I and t h e measuring
s t a t i o n s are i d e n t i f i e d i n F i g u r e 10. The average p ressure and tempera-
t u r e a t e a c h s t a t i o n were used t o a n a l y z e t h e t u r b i n e p e r f o r m a n c e . O t h e r
performance test measurements were o u t p u t s h a f t t o r q u e , r o t a t i v e s p e e d ,
vapor f low rate a n d i n l e t v a p o r q u a l i t y . F o r e a c h d a t a p o i n t , t h e s e
measurements were reco rded on d ig i t a l r eadou t equ ipmen t and t hese da t a
were conver ted t o eng inee r ing pa rame te r s by means of a d a t a r e d u c t i o n
program.
An error a n a l y s i s made p r e v i o u s l y for t h e t e s t i n g of t he two-s t age
p o t a s s i u m t u r b i n e i n d i c a t e d t h a t t h e l a r g e s t s o u r c e o f u n c e r t a i n t y i n t h e
c a l c u l a t e d test e f f i c i e n c y was the measurement of t u r b i n e e x i t p r e s s u r e .
F o r t h i s r e a s o n , new t r a n s d u c e r s were o b t a i n e d f o r t h e t h r e e - s t a g e
t u r b i n e , w i t h s e v e r a l p r e s s u r e r a n g e s , t o a c h i e v e better accuracy a t t h e
l o w exit p r e s s u r e s . U s i n g t h e i n f l u e n c e c o e f f i c i e n t s f r o m t h e t w o - s t a g e
4
.

t u r b i n e ( 2 ) , a n d t h e m a n u f a c t u r e r ' s specifications for t h e t r a n s d u c e r s ,
t h e p r o b a b l e errors i n e f f i c i e n c y were c a l c u l a t e d t o be 2.66 percen t and
4 .21 pe rcen t for the 1550°F and 1450'F i n l e t t e m p e r a t u r e s , r e s p e c t i v e l y ,
a t a t u r b i n e p r e s s u r e ra t io of 8 .
The p r o b a b l e errors i n f l o w measurement were e s t i m a t e d to be 2.25
pe rcen t and 2 .95 pe rcen t for i n l e t t e m p e r a t u r e s of 1550°F and 1450°F,
r e s p e c t i v e l y . The p robab le errors i n power measurement were e s t i m a t e d
t o be 2 percen t and 3 p e r c e n t for i n l e t t e m p e r a t u r e s of 1550nF and 1450°F.
r e s p e c t i v e l y .
P r i o r t o t h e p e r f o r m a n c e t e s t i n g , t h e water b rake was d r i v e n by a
s t e a m t u r b i n e w i t h t h e p o t a s s i u m t u r b i n e d i s c o n n e c t e d t o c h e c k t h a t t h e
t w o t o r q u e meters i n d i c a t e d t h e same t o r q u e . T h i s w a s done t o i n s u r e
t h a t no t o r q u e i s t r a n s m i t t e d t h r o u g h t h e f l e x i b l e h o s e s t o t h e w a t e r
b rake and s t eam tu rb ine .
B e c a u s e o n e o b j e c t i v e o f t h e t e s t i n g i s to improve f lu id dynamic
des ign and per formance ca lcu la t ion methods , t h e power output of t h e
t u r b i n e b l a d i n g i s d e s i r e d . T h e r e f o r e , t h e p a r a s i t i c t o r q u e of t h e
tu rb ine bear ings and the hydrodynamic seal must be ob ta ined . Then t he
sum of measured sha f t o u t p u t t o r q u e a n d t h e p a r a s i t i c t o r q u e is t h e
t o r q u e o u t p u t of t h e t u r b i n e b l a d i n g . The paras i t ic t o r q u e i s de te rmined
by d r i v i n g t h e test t u r b i n e s h a f t , i n c l u d i n g t h e water b r a k e , w i t h t h e
steam t u r b i n e a t v a r i o u s speeds a n d a r g o n p r e s s u r e s i n t h e l o o p . The
r e s u l t s are shown i n F i g u r e 11 as a f u n c t i o n of a r g o n d e n s i t y a n d
r o t a t i v e s p e e d . The a rgon causes windage losses d u r i n g parasi t ic t e s t i n g
which are a f u n c t i o n o f a r g o n d e n s i t y i n t h e t u r b i n e . I f t h e test d n t a
are e x t r a p o l a t e d t o zero d e n s i t y , t h e w i n d a g e t o r q u e o n t h e t u r b i n e b l a d e s
5

i s z e r o a n d t h e r e m a i n i n g t o r q u e is t h e d e s i r e d b e a r i n g a n d seal p a r a s i t i c
t o rque a t t h e r o t a t i v e s p e e d s u s e d . T h e s e D e a r i n g a n d seal t o r q u e v a l u e s
are p l o t t e d i n F i g u r e 1 2 , f o r tests r u n o n t h r e e d a t e s . The middle l ine ,
d a t e d 5/13, was used for the per formance tests.
Comparison of t h e test r e s u l t s were made w i t h t h e p e r f o r m a n c e p r e d i c -
t i o n s , i n c l u d i n g t o t a l t o s ta t ic and to ta l t o to ta l e f f i c i e n c y , v a p o r f l o w
rate, b lad ing power ou tput and tu rb ine s t a t i c p r e s s u r e s . On e a c h f i g u r e
t h e test I'esults are shown by i n d i v i d u a l p o i n t s a n d t h e p r e d i c t i o n s are
shown by a s o l i d l i n e .
The t o t a l t o s t a t i c t u r b i n e e f f i c i e n c y is shown i n F i g u r e s 1 3 t h r o u g h
16 for 18,250 and 15,400 rpm and i n l e t vapor t empera tu res o f 1450 and
1550'F. The p r e d i c t i o n s are i n a g r e e m e n t w i t h t h e test d a t a a t 18,250 rpm,
b u t are about 4 p o i n t s h i g h e r t h a n t h e test d a t a a t 15,400 rpm. The s c a t t e r
i n t h e d a t a a t 1450'F i s d u e t o t h e scatter in f l ow measu remen t , as w i l l be
s e e n i n p l o t s o f power output and f low rate. The flow rate d a t a h a s more
scatter t h a n t h e power o u t p u t , a n d e f f i c i e n c y i s de termined from t h e r a t i o
of power output t o i d e a l power ou tpu t , wh ich i nc ludes t he f l ow rate.
The t o t a l t o t o t a l t u r b i n e e f f i c i e n c y i s shown i n F i g u r e s 1 7 t h r o u g h
20. Again the agreement be tween the p red ic t ions and t h e test d a t a is
e x c e l l e n t a t 18,250 rpm, but t h e p r e d i c t i o n s are about 4 p o i n t s h i g h e r
t h a n t h e test d a t a a t 15,400 rpm. The scatter due to f low rate measurement
is e v i d e n t i n t h e d a t a a t 1450OF.
The vapor f low rate is shown i n F i g u r e s 2 1 t h r o u g h 2 4 . The p r e d i c t e d
v a l u e s are abou t 2 p e r c e n t greater t h a n t h e test d a t a a t 18,250 rpm, b u t i n
ag reemen t w i th t he da t a a t 15,400 rpm.
The b l a d i n g power o u t p u t is shown i n F i g u r e s 2 5 t h r o u g h 2 8 . The
predic ted power is about 3 t o 4 p e r c e n t greater t h a n t h e test d a t a a t
6

I
18,250 rpm and 8 p e r c e n t greater t h a n t h e test data a t 15,400 rpm.
Al though t he data are lower t h a n t h e p r e d i c t i o n s , t h e y d o n o t h a v e t h e
scat ter t h a t was e v i d e n t i n t h e flow rate data.
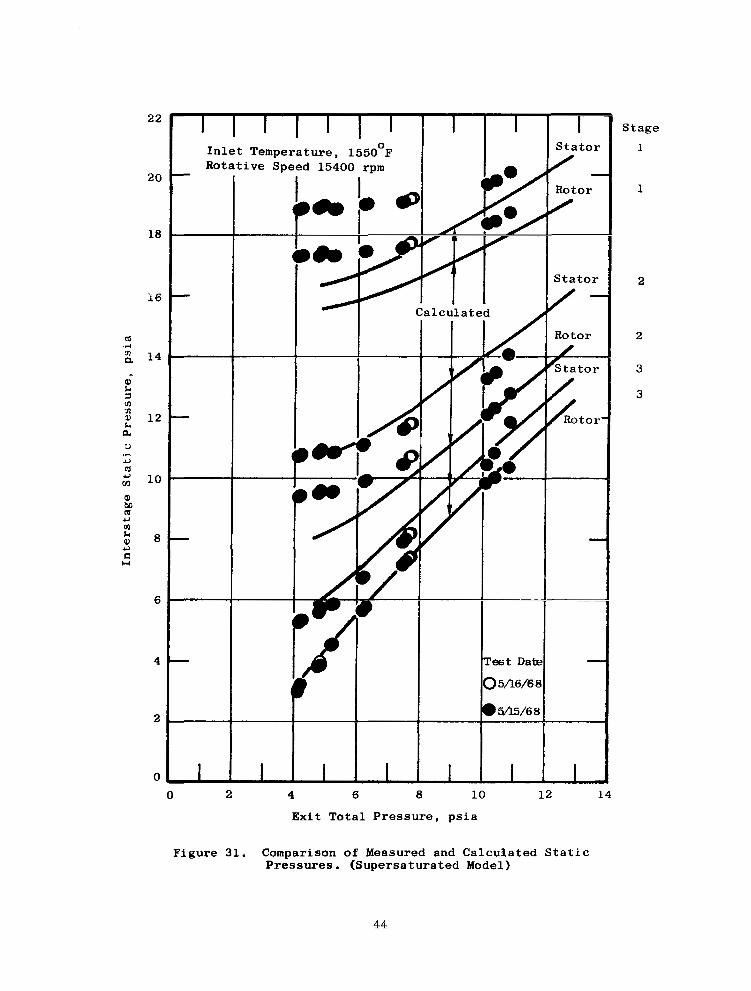
The t u r b i n e s t a t i c p r e s s u r e s are shown i n F i g u r e s 2 9 t h r o u g h 32. The
two t o p l i n e s for t h e first stage stator and rotor i n d i c a t e t h a t t h e test
data are s i g n i f i c a n t l y h i g h e r t h a n p r e d i c t e d . The next t w o l i n e s i n d i c a t e
better agreement for t h e s e c o n d stage, w i t h t h e rotor ex i t p r e s s u r e g r e a t e r
t h a n p r e d i c t i o n s a t h i g h t u r b i n e pressure ratios. The lower l i n e s f o r t h e
t h i r d s t a g e stator and rotor a g r e e w i t h t h e p r e d i c t e d v a l u e s .
I n g e n e r a l , t h e m e a s u r e d e f f i c i e n c y a g r e e s w i t h t h e p r e d i c t i o n s a t
the des ign speed , 18 ,250 rpm, b u t t h e f l o w and power levels are 2 t o 3
p e r c e n t lower t h a n t h e p r e d i c t e d v a l u e s . The s t a t i c p r e s s u r e s d i d not
agree w i t h t h e p r e d i c t i o n s , e s p e c i a l l y for t h e first s t a g e .
A v e r i f i c a t i o n of t h e r e q u i r e m e n t t o have a m o i s t u r e f r a c t i o n a t t h e
t h i r d stage i n l e t of a b o u t 8 t o 10 p e r c e n t is d e s i r a b l e . H o w e v e r , i t i s
p o s s i b l e t o measu re vapor qua l i t y on ly a t t h e t u r b i n e i n l e t where a th ro t -
t l i n g calorimeter is used. The ex i t v a p o r q u a l i t y can be c a l c u l a t e d ,
however , f rom the po tass iukn vapor p roper t ies (6) , the measured in le t condi -
t i o n s o f p r e s s u r e a n d v a p o r q u a l i t y , t h e m e a s u r e d s p e e d , w e i g h t - f l o w rate
and to rque , and the measured exi t s ta t ic and to ta l p r e s s u r e s . Shown i n
F i g u r e 33 i s t h e c o m p a r i s o n o f t h e t u r b i n e ex i t v a p o r q u a l i t y calculated
as ind ica t ed above from expe r imen ta l measu remen t s w i th t he va lues Ca lcu la t ed
from the tu rb ine o f f -des ign computer p rogram. The exper imenta l da ta agree
w i t h t h e p r e d i c t i o n s w i t h i n 0.33 p e r c e n t a g e p o i n t s , i n d i c a t i n g t h a t t h e
v a p o r q u a l i t y a t t h e t h i r d s t a g e i n l e t , i f i t could be measured, would
agree w i t h t h e v a l u e s p r e s e n t e d i n Figures 7 and 8.
7

EVALUATION
B a s e d o n t h e c a l c u l a t i o n model of s u p e r s a t u r a t e d v a p o r e x p a n s i o n s w i t h
r e v e r s i o n s t o e q u i l i b r i u m c o n d i t i o n s after e a c h rotor, i t was e x p e c t e d t h a t
s u p e r s a t u r a t i o n w o u l d be ev idenced by subcoo l ing b e l o w t h e s a t u r a t i o n t e m p e r a -
t u r e c o r r e s p o n d i n g t o t h e m e a s u r e d p r e s s u r e . The test r e s u l t s d i d n o t clearly
R u p p o r t t h i s m o d e l as shown i n FLKures 34 and 35. The o r d i n a t e of t hcse plots
is t h e r a t i o of measured s t a t i c p r e s s u r e to the vapor p re s su re co r rc spond i n~
t o the measured tempera ture . A t s t a t i o n s 4 , 6 and 8 which a r e stator b l a d e
exit l o c a t i o n s , t h e s u p e r s a t u r a t i o n i s neg l ig ib l e . On ly a t s t a t i o n 7 , a f t e r
t h e s e c o n d s t a g e rotor, was t h e r e a n y i n d i c a t e d s u p e r s a t u r a t i o n , a n d e v e n
t h e r e t h e s u b c o o l i n g of abou t 40°F i s r e l a t i v e l y small. Based on the conden-
s a t i o n c a l c u l a t i o n model(7), i t w a s p r e d i c t e d t h a t s u b c o o l i n g u p t o 140°F w o u l d
be e x p e r i e n c e d i n t h e t h r e e - s t a g e t u r b i n e . T h e a c t u a l m e a s u r e d s u b c o o l i n g was
a maximum of 40°F as shown i n F i g u r e 36. The small amounts of measured
subcool ing seemed to i n d i c a t e t h a t t h e t u r b i n e e x p a n s i o n s were close t o
e q u i l i b r i u m t h r o u g h o u t t h e t u r b i n e .
Because t he small amount of subcool ing seemed t o i n d i c a t e t h a t t h e t u r b i n e
vapor expans ions are closer t o e q u t l i b r i u m t h a n s u p e r s a t u r a t e d , t u r b i n e off
des ign pe r fo rmance was r e c a l c u l a t e d w i t h a c a l c u l a t i o n model based on
e q u i l i b r i u m e x p a n s i o n s . C o m p a r i s o n s w i t h t h e tes t r e s u l t s a re shown i n
F i g u r e s 37 and 38 for 18,250 rpm and 1550°F i n l e t v a p o r t e m p e r a t u r e , The f low
rate i n F i g u r e 37 for t h e e q u i l i b r i u m model agrees w i t h t h e test r e s u l t s , where
t h e flow c a l c u l a t e d w i t h t h e s u p e r s a t u r a t e d e x p a n s i o n m o d e l was abou t 2 p e r c e n t
h i g h e r t h a n t h e test r e s u l t s , as. s e e n i n F i g u r e 21. The s t a t i c p r e s s u r e d i s -
t r i b u t i o n i n F i g u r e 38 for t h e e q u i l i b r i u m m o d e l is i n better agreement wi th
t h e test r e s u l t s t h a n t h e s u p e r s a t u r a t e d model, shown i n F i g u r e 2 9 , e s p e c i a l l y
for t h e first s t a g e w h e r e t h e d i s c r e p a n c y was t h e greatest. The s t a t i c
p r e s s u r e v a r i a t i o n a n d t h e small amount of o b s e r v e d s u b c o o l i n g were major
factors i n t h e s e l e c t i o n of t h e e q u i l i b r i u m e x p a n s i o n c a l c u l a t i o n m o d e l .
8

CALCULATION MODEL
F o r t h e s u p e r s a t u r a t e d e x p a n s i o n c a l c u l a t i o n m o d e l i t w a s assumed t h a t
on ly t he vapor expanded t h rough t he t u rb ine and d id work ; t he condensed
l i q u i d was on ly u sed t o c a l c u l a t e a d r o p l e t d r a g b a s e d o n a c c e l e r a t i n g t h e
l i q u i d t o the whee l speed of t h e r e s p e c t i v e rotor stage. When t h e e q u i l i -
b r i u m e x p a n s i o n c a l c u l a t i o n m o d e l w a s first c o n s i d e r e d t h e r e w a s some
q u e s t i o n a b o u t how t o accoun t for moi s tu re losses. I f a l l t h e mass f l o w
was assumed t o be w o r k i n g f l u i d , t h e c a l c u l a t e d p o w e r a n d e f f i c i e n c y were
h i g h e r t h a n t h e test r e s u l t s . I f o n l y t h e v a p o r f r a c t i o n o f t h e mass flow
w a s assumed to be w o r k i n g f l u i d , t h e calculated power and e f f i c i e n c y were
i n good ag reemen t w i th t he test r e s u l t s .
Al though t h e e q u i l i b r i u m c a l c u l a t i o n s w e r e i n good agreement w i t h t h e
test r e s u l t s when o n l y t h e v a p o r f r a c t i o n was used as w o r k i n g f l u i d , i t w a s
t h o u g h t t h a t t h e m o i s t u r e losses w e r e n o t b e i n g h a n d l e d p r o p e r l y i n t h e
c a l c u l a t i o n m o d e l . S p e c i f i c a l l y , t h e d r o p l e t d r a g was b a s e d o n a c c e l e r a t i n g
a l l of t h e l i q u i d p r e s e n t up t o the wheel speed of t h e r e s p e c t i v e rotor
s t a g e . T h i s i s cons ide red un rea l i s t i c b e c a u s e o n l y p a r t of t h e l i q u i d , t h e
p a r t i n larger d r o p sizes, comes i n t o c o n t a c t w i t h t h e r o t a t i n g b l a d e s .
A l so , i t was f e l t t h a t a l l of the vapor shou ld be used as working f l u i d ,
a n d t h a t t h e m o i s t u r e losses are approx ima te ly one pe rcen t pe r pe rcen t of
m o i s t u r e p r e s e n t .
I n steam t u r b i n e p r a c t i c e , t h e m o i s t u r e losses are cons idered propor-
t i o n a l t o the average amount of c o n d e n s a t e t h a t is p r e s e n t i n a t u r b i n e
s t a g e or group of s t a g e s ( 8 ) . A moisture loss of t h i s k i n d w a s a p p l i e d t o
t h e e q u i l i b r i u m c a l c u l a t i o n m o d e l instead of u s i n g o n l y t h e v a p o r f r a c t i o n
L
a n d t h e n s u b t r a c t i n g d r o p l e t drag. The c a l c u l a t i o n of power and e f f ic iency
9

agreed w i t h t h e test r e s u l t s when it was a s s u m e d t h a t e a c h p e r c e n t of
l i q u i d p r e s e n t r e d u c e d t h e stage work by 1 .2 pe rcen t . A comparison of t e s t
r e s u l t s w i t h t h e c a l c u l a t i o n model is shown i n F i g u r e s 39 and 58 f o r the
two r o t a t i v e s p e e d s a n d two v a l u e s of i n l e t v a p o r t e m p e r a t u r e . T h e s e
f i g u r e s are comparable t o Figures 13 through 32 for t h e o r i g i n a l s u p e r s a t u -
r a t e d e x p a n s i o n c a l c u l a t i o n model.
Cornparing Figures 13-16 and 39-42, i t is s e e n t h a t e i t h e r model g i v e s
a n a d e q u a t e r e p r e s e n t a t i o n of t u r b i n e e r f i c i e n c y a t t h e d e s i g n s p e e d of
18,250 rpm a n d p r e s s u r e r a t i o o f 7.9, a n d n e i t h e r m o d e l is p r e f e r a b l e for
o f f - d e s i g n c o n d i t i o n s . T o t a l t o total e f f i c i e n c y c a l c u l a t i o n s are p r a c t i -
c a l l y S d e n t i c a 1 f o r t h e t w o models, as s e e n by comparing Figures 17-20 and
43-46. Comparing Figures 21-24 and 47-50 i t is s e e n t h a t t h e s u p e r s a t u r a t e d
expans ion model ca lcu la ted flow r a t e s 2 t o 3 p e r c e n t h i g h e r t h a n t h e test
results, and t he equ i l ib r ium expans ion mode l calculates f low rates w i t h i n
1 p e r c e n t of t h e test r e s u l t s , except for 15,400 rpm a t 1 5 5 0 ° F i n l e t v a p o r
temperature , which is n o t s i m u l a t e d well by e i t h e r c a l c u l a t i o n model.
Comparing t h e b l a d i n g power ou tpu t i n F igu res 25 -28 and 51-54, i t is
s e e n t h a t t h e e q u i l i b r i u m c a l c u l a t i o n model is c l o s e r t o t h e tes t resul ts
i n a l l cases. Where as t h e s u p e r s a t u r a t e d e x p a n s i o n c a l c u l a t i o n s were 3 t o
8 p e r c e n t g r e a t e r t h a n t h e m e a s u r e d results, t h e e q t l i l i b r i u m e x p a n s i o n model
agreed w i t h t h e test r e s u l t s a t t h e d e a i gn po in t and was a maximum of 4
p e r c e n t greater t h a n t h e test r e s u l t s a t o t h e r c o n d i t i o n s .
Comparing t h e s t a t i c p r e s s u r e d i s t r i b u t i o n s i n F i g u r e s 29-32 and 55-58,
i t i s s e e n t h a t t h e e q u i l i b r i u m model g i v e s better agreement wi th the
measured p r e s s u r e s , e s p e c i a l l y for t h e first stage, when t h e s u p e r s a t u r a t e d
model was a b o u t 8 p e r c e n t lower t h a n t h e test r e s u l t s a t t h e d e s i g n c o n d i -
10

t i o n . Nei ther c a l c u l a t i o n model gives a perfect s i m u l a t i o n o f p r e s s u r e
d i s t r i b u t i o n i n a l l stages, bu t it is fe l t that t h e e q u i l i b r i u m e s p a n s i o n
model is g e n e r a l l y a better r e p r e s e n t a t i o n of t h e actual t u r b i n e perfor-
mance.
CONCLUDING REMARKS
The p r i n c i p a l s u r p r i s e i n t h e test r e s u l t s of t h e t h r e e - s t a g e
p o t a s s i u m t u r b i n e is t h a t t h e e x p e c t e d s u b c o o l i n g d u e t o s u p e r s a t u r a t i o n
was not observed. When a c a l c u l a t i o n m o d e l b a s e d o n e q u i l i b r i u m f l u i d
expans ions was used t o c a l c u l a t e o f f d e s i g n p e r f o r m a n c e of t h e t u r b i n e ,
t h e results were i n greater agreement w i t h t h e test resul ts t h a n t h e
c a l c u l a t i o n s which had p rev ious ly been made w i t h a m o d e l based on super-
s a t u r a t e d e x p a n s i o n s w i t h r e v e r s i o n t o e q u i l i b r i u m c o n d i t i o n s af ter each
rotor b lade r o w . The va lue of 1.2 p e r c e n t loss per p e r c e n t l i qu id p r e s e n t
used i n t h e moi s tu re loss c a l c u l a t i o n is c o n s i s t e n t with Table I i n
r e f e r e n c e 8 , which l i e t s moisture loss factors for steam tu rb ines f rom
t e n s o u r c e s .
11

1.
2.
3.
4.
5.
6.
7.
8.
"Space Vehicle Rankine Cycle Power P lan t Potass ium Turb ine Lkvelop- ment". R . J. Rossbach, ASME 63-WA-326, November 1963.
I f Two-Stage Potassium Test Turbine, Volume I , F l u i d Dynamic Design and Performance. R. J . Rossbach and G. C. Wesl ing, NASA CR-922, February 1968.
11
"Two-Stage Po ta s s ium Tes t Turb ine , Volume I V , Materials Support of Performance and Endurance Tests." W. F. Zimmerman, R . €3. Hand, D. S. Engleby, J . W. Semmel, Jr., NASA CR-925, February 1968.
"Three-Stage Potass ium Tes t Turb ine , F ina l Des ign - Volume I - Fluid Des ign ." R. J. Rossbach, G. C. Wesling, W. F. Lemond, NASA CR-72249.
"A Method of Performance Estimation f o r A x i a l Flow Turb ines ." D. G. Ainley and G.C.R. Mathieson, A.R.C. ( B r i t i s h ) R. and M. No. 2074, December 1951.
"High-Temperature Properties of Potassium." C.T. Ewing, J.P. Stone , J. R . Spann, E. W. S t e i n k u l l e r , D. D. Williams and R. R. Miller, NRL Report 6233, September 24, 1965.
"Condensation of Wet Vapors i n T u r b i n e s . WANL-TME-1668, October 15, 1967.
12

TABLE I
TmE-STAGE TLTRBI NE INSTRUMENTATION " -
Station Total Static Thermocouple Taylor .. - - . Preesure Pressure Gage -
1 - I n l e t Duct
3 - Bulletnose
4 - F i r s t Nozzle Exit
5 - F i r s t Rotor E x i t
6 - Second Nozzle E x i t
7 - Second Rotor E x i t
8 - Third Nozzle E x i t
9 - Third Rotor Exit
9 .5 - Diffuser E x i t
9.6 - Scroll
10 - Exit Duct
4
2
2 2
4 4
5
3
5
3
5
4
4
4
2 1
4
4
2
2
2
2
2
2
2
2
4
1
1
1
Total 14 40 28 3

2.6 .. .
2.4
2.2 - -
2 .o
1.8
1.6
1.4
1.2
1 .o
.8 "
.6 I ~ ~-
Inlet Temperature, 1450°F .4 Rotative Speed, rpm _I
15,400 --- 18,250 .2
""" 20,000 -
0 1 0 2 4 6 8 10
Total-to-Static Pressure Ratio
12 14
Figure 1. Calculated Vapor Flow R a t e .
14

I
2.4
2.2
2 .o
1 . 8
1.6
1.4
1.2
1 .o
.8
.6
. 4
.2
0 0 2 4 6 8 10 12 14
Total-to-Static Pressure Ratio
Figure 2. Calculated Vapor Flow Rate.

2 69
240
2 20
2 00
5 180
& 160 3 3
a 3 3c 140 .- - =
2 120 c 1, G
100 h 7 H
80
60
4 0
15,400 18,250 "
20 ' "" 20,000
0 I I 0 2 4 6 8 10 12 14
Total-to-Static Pressure Ratio
Figure 3. Calculated Turbine Blading Power.
16

280
2 60
240
220
200
180
160
140
120
100
80
60
40
20
0
Inlet Temperature, 1550 F Rotative Speed, rpm
15,400 -- 18,250 0
-
"" -
20 ,000
0 2 4 6 a 10 12 14 Total-to-Static Pressure Ratio
Figure 4. Calculated Turbine Blading Power.
17

. 00
80
60
40
20
0,
Inlet Temperature, 1450°F Rotative Speed, rpm
15,400 18,250
- "
"" 20,000
0 2 4 6 8 10 12 14
Total-to-Static Pressure Ratio
Figure 5. Calculated Total-to-Static E f f i c i e n c y .
18

Inlet Temperature, 1550°F Rotative Speed, rpm -
15,400 " 18,250
20,000 ""
0 2 4 6 8 10 12 14
Total-to-Static Pressure Ratio
Figure 6. Calculated Total-to-Static Efficiency.
.

.99
.98
.97
.96
.95
. 9 4
.93
r, .92 A
.c A
2 e .91 & 0 P 2 .90
.89
.88
-87
.86
3 4 5 6 7 8 9 10
Total-to-St8tic Pressure Ratio
Figure 7. Calculated Vapor Quality.
20

.99
.98
.97
.96
.95
.94
.93
A
.rl rl m
+ .92
.91 k
a .90
.89
.88
.87
.86
Exit Condi ti
3 4 8 9 5 6 7 Total-to-Static Pressure Ratio
Figure 8. Calculated Vapor Quality.
21

3 STAGE POTASSIUM TURMNE LOAD TRAIN
I 88”
N N
Figure 9 . Three Stage Turbine and h a d Train.

I
!
m 39.35" .L
1 3 4 5 6 7 8 9 9.5 9.6 10
Figure 10. Instrumentation Stations.

130
120
110
100
90
80
70
60
0
19,000 rpm
, 17,000 rpm
% 0
1 2 3
Argon Density x 100, lb/ft 3
4
Figure 11. Parasitic Torque Variation with Speed and Density.
24

I
120
100
80
60
40
20
0 0 2 4 6 8 10 12 14 16 18 20
R o t a t i v e S p e e d , rpm -
6 i2H
5/13
6/24
Figure 1 2 . P a r a s i t i c T o r q u e V a r l a t i o n X I t h R o t a t i v e S p e e d .

100 I I
Inlet Temperature, 1550°F 90 ” Rotative Speed, 18250 rpm
80
70
60
50
4 0
30
20
10
0
Test Date 5/16/68
5/15/68
3 .O 4 .O 5.0 6.0 7 .O 8 .O 9 .o 10 .o Total-to-Static Pressure Ratio
Figure 13. Comparison of Measured and Calculated Efficiency. (Supersaturated Model)

I I
Inlet Temperature, 1450°F Rotative Speed, 18250 rpm
I I l -
3 4 5 6 7 8 9 10
Total-to-Static Pressure Ratio
Figure 14. Comparison of Measured and Calculated Efficiency. (Supersaturated Model)

LOO
90
80
70
60
50
4 0
30
20
10
0
1 I + In le t Temperature, 1550°F Rotative Speed, 15400 rpm - -
- I
I
-
-
-
- -
3 .O 4 .o 5 .O 6 .O 7 .o 8 .O 9 .o 10 .o Total-to-Static Pressure Ratio
Figure 15. Comparison of Measured and Calculated Efficiency . (Supersaturated Model)

c I Inlet Temperature, 1450°F 90 Rotative Speed, i5400 rpln
80
70
60
50
40
30
20
10
0
3 .O 4 .O 5 .O 6.0 7 .O 8 .O 9 .o 10.1
Total-to-Static Pressure Ratio
Figure 16. Comparison of Measured and Calculated Efficiency. (Supersaturated Model)

90
* 80 C
u al
k al a 70
h u 60
-..I
d 0
E 50 W rl
c, 40 a 0
'f 30 0 ? d a c,
8 20
10
0
Test Date - 0 5/16/68
5/15 68
3 .O 4 .O 5 . 0 6.0 7 .O 8 .O 9.0 10 .o T o t a l - t o - S t a t i c P r e s s u r e Rat io
Figure 17. Comparison of Measured and C a l c u l a t e d E f f i c i e n c y . ( S u p e r s a t u r a t e d Model)

3 4 5 6 7 8 9 10
Total-to-Statlc Pressure Ratio
FiKure 18. Comparison of Measurcd and Calculated Efficiency. (Supersaturated Model)

I I Inlet Temperature, 1550°F Rotative Speed, 15400,rpm
B I .. @b
Calculated I I
3 .o 4 .O 5.0 6 .0 7 .O 8 .O 9 . 0 10.0
T o L a l - t : > - S t a t i c Pressare R a t i o

100
90
80
70
60
50
40
30
20
10
0
I I I Inlet Temperature, 1450'F - Rotative Speed, 15400 rpm
I
I , Calculated
3 .O 4 . O 5 .O 6.0 7 .O 8 .o 9 .o 10 .o Total-to-Static Pressure Ratio

2.2
2.0 - 4
1.8 r
1.6 - 0
0 0,
P r 4
2 1.4
; 1.2
g 1;o
-
E:
:
a'
%8, -
0 .6 '1
0.4,-
0 . 2
IJ 0
! '
I
Inlet Temperature, 1550°F Rotative Speed, 18250 rpm I
3 .O 4 .O 5.0 6 .O
Total-to-Static Pressure Ratio

2.2
2 .o
1.8
1.6
u Q, < 1.4 m P rl
Q, - 1.2
42 a o: 1.0
rl Fr k 0.8 oa ’ 0 , 6
0.4
0.2
0
- I Inlet Temperature, 1450°F Rotative Speed, 18250 rpm
+ Test Date
0 5/14/68 I 3 4 5 6 7 8 9 10
Total-to-Static Pressure Ratio
Figure 22. Comparison of Measured and Calculated Vapor Flow Rate. (Supersaturated Model)
, ...

2.4
2 . 2
2 .o
1.8
1.6 m
f: 1.4
\ m
L
c, P)
2 1.2
; 1.0 3 0
k 0 a > a 0 . 8
0:6
0 . 4
0.2
a
Inlet Temperature, 1550°F Rotative Speed, 15400 rpm
3 .O 4 .O 5 .o 6.0 7 .O 8 .O 9.0 10 .o Total-to-Static Pressure Ratio
Figure 23. Comparison of Measured and Calculated Vapor Flow Rate, (Supersaturated Model)

2.2
2 .o
1.8
c) 0,
\
P
1 . 6
m rJl 1 . 4 .-I
$ 1.2 2 i: 1.0 4 zr k
0.8 m >
0.6
0 . 4
0.2
0
3 .O 4 .O 5 . 0 6 . 0 7 . O 8 .O 9.0 10 .o Total-to-Static Pressure Ratio
Figure 24. Compari.son of Measured and Calculated Vapor Flow Rate. (Supersaturated Model)

260.
240
a a0
2@0
180
E 160 .. k $ 140 0 a
.I4 E" 120 2
100
80
60
40
2 0
fJ

200
180
160
X 3 140
80
60
40
20
0
3 4 5 6 7 8 9 10
Totai to S t a t i c Pressure Ratio
Figure 26. Camparison of Measured and Calculated Power. (Supersaturated Model)

260
240
220
200
180
B 160
& 9) 140 3 0
120 4 U 6
100
80
60
40
20
0 3 .o 4 .o 5 . 0 6.0 7 .o 8 .O 9.0 10.0
Total-to-Static Pressbrr: Ratio
F i KlJrr: 27. Comparison of Measured and Calculated Power. (Supersaturated Model)

260
240
220
200
180
160 I
k $ 140 0 a bo
U m rl
2 120
100
80
60
40
20
0
I
i - I

L L
I
S t a t o r
I Rotor
0 2 4 6 8 10 12 14
E x i t Tota l Pressure , ps ia
Figure 29 . .Comparison of Measured and Calculated . Stat ic Pressures . (Supersaturated Model)
42

Inlet Temperature, 1450°F Rotative Speed, 18250 rpm I
Stator
I Rotor
1
1
-
0 2 a 0 8 10 12 14
Exit Total Pressure] psia
Figure 30. Comparison of Measured and Calculated Static Pressures. (Supersaturated Model)
43
22 Stage
1
1
2
2
3
3
0 2 4 6 8 10 12 14
Exit Total Pressure, psia
Figure 31. Comparison of Measured and Calcuaated Static Pressures. (Supersaturated Model)
44

Inlet Temperature, 1450°F Rotative Speed, 15400 rpm
0 2 4 6 8 10 12 14
Exit Total Pressure, psia
Figure 32. Comparison of Measured and Calculated Static Pressures. (Supersaturated Model)
45

P cn
.99
.98
.97
96
.95
.94
c, h
2 .93
8 i * .92
.91 8 &?
.90
.89
.88
.87
.86
.85
In le t Temperature, 1550°F Rotative Speed, 18250 rpm
4-
3 4 5 6 7 8 9 10
Total-to-Static Pressure Ratio
Figure 33. Comparison of Measured and Calculated Vapor Exit Quality. (Equilibrium Model)

.. .
Stat ion (F igure 10)
b4 06 0 8 1550°F Turbine Inlet Temperature
I I 1 I 1 1 I I 2 3 4 5 6 7 8 9 1
I n l e t T o t a l to Exit S t a t i c P r e s s u r e R a t i o
Figure 34. Supersaturation a t Stator Blade Exit S t a t i o n s .

1.3
al k
v ) k m 7 a l m kV1
a a al k k 7 0 m a ala
a a l
P4 1.2
2"' c 0 d c, a k
c, a v) k al a 7 m
7 1.1
1 .o
0
8
0
S t a t i o n ( F i g u r e 10)
A5 0 7 0 9
1550°F I n l e t Temperature
ra n
0
0
I 10 I I I I I U
2 3 4 5 6 7 8 9
I n l e t T o t a l to E x i t S t a t i c P r e s s u r e R a t i o
Figure 35. Supersa turat ion a t R o t o r E x i t S t a t i o n s .

150
140
0 r 4
- ll &
rn 3 C a .d
P,
3 &
130
120
110
100
90
80
70
60
50
4 0
30
20
10
0
S t a t o r Rotor S t a t o r Rotor S t a t o r Rotor 1 1 2 2 3 3
Exit S t a t i o n
Figure 36. Subcooling in Three-Stage Turbine.
49

cn 0
2 .o
1.8
1.6 0 Q m \ 1.4 m P l-l
(D’ 1.2
d 3 1.0
c,
I 4 0 r4 k 0.8 0 a > 0
0.6
0 . 4
0 . 2
0
Inlet Temperature, 1550°F Rotative Speed, 18250 rpm
Calculated I I
I I I I I I I 3 .O 4 . 0 5 . 0 6 .O 7 .O 8 .O 9.0
Total-to-Static Pressure Ratio
Figure 37. Comparison of Measured and Calculated Vapor Flow Rate. (Equilibrium Model)

22
20
18
16
4 crl
14
e, k f m m
12 a u .d 4.2 m ; 1 0 a M
4 B
Ll n a 8 c)
Y S
6
4
2
0
I Stator 2
Test Dat;
0 2 4 6 8 10 12 1 4
Exit T o t a l P r e s s u r e , p s i a
F i g u r e 38. Comparison of Measured and Ca lcu la ted S ta t i c P r e s s u r e s . ( E q u i l i b r i u m Model )
51

100
90
80
7 0
60
50
40 30k1 20
10
0
In le t Temperature , 1550°F Rotat ive Speed , 18250 rpm I
'05/16/68
'.5/15/68 I
1
!
3 .O 4 .O 5.0 6 .O 7 . O 8 .O 9 .o 10 .o Total-to-Static P r e s s u r e R a t i o
F igure 3 9 . Comparison of Measured and Calculated Efficiency. (Equi 1 ibri um Model)

R u 8 60
d w w 50
u
c, 30 0 I
10
3 4 5 6 7 8 9 10
Total-to-Static Pressure Ratio
Figure 40 . Comparison of Measured ana Calculated Efficiency, (Equi l i bri um Model)

3 4 5 6 7 8
Total-to-Static Pressur2 Ratio
9 10
F i g u r e 4 0 . Comparison of Measured and Calculated Efficiency. (Equilibrium Model)

100
90
2 80 Q) 0 k Q)
a 70 .)
R 0
Q, r(
4 0
In
w 0 "4 c, +J
CI] I
E 60
o( 50
a 40
$ 30 I d a c, M Q 20
10
0
I I I - Inlet Temperature , 1550°F
I Rotat ive Speed , 15400 rpm I I C a l c u l a t e d I
3 .O 4 .O 5.0 6.0 7 .O 8 .O 9.0 1 0 . 0
T o t a l - t o - S t a t i c P r e s s u r e R a t i o
!
Figure 4 1 . Comparison of Measured and Calculated Eff ic iency . (Equilibrium Model)

i
3 .O 4 .O 5 .O 6 .O 7 .O 8 .O 9 .c) 10 .o T o t a l - t o - S t a t i c P r e s s u r e R a t i o
F igure 42. Comparison of hleasured and C a l c u l a t e d E f f i c i e n c y . (Equilibrium hlodel)

Inlet Temperature, 1550°F Rotative Speed, 18250 rpm
3 .O 4 .O 5 .O 6 .O 7 .O 8 .O 9 .o 10 .o Total-to-Static Pressure Ratio
Figure 43. Comparison of Measured and Calculated Efficiency. (Equilibrium Model)

I
I
100
90
80
7 0
60
50
40
30
20
10
0 3 4 5 6 7 8 9 10
Total-to-Static Pressure Ratio I
Figure 44. Comparison of Measured and Calculated Efficiency. (Equilibrium Model)

I
I
100
90
80
70
60
50
40
30
20
10
0
Total-to-Static Pressure Ratio
Figure 45 . Comparison of Measured and Calculated Efficiency. (Equi 1 i bri urn Model)

100
90
80
70
60
50
40
30
20
10
0
I I I I I I 1 I I . I I I I I - I Inlet Temperature, 1450°F Rotative Speed, 15400 rpm I
0- 0
0 -
Calculated 0
3 .O 4.0 5.0 6 .O 7 .O 8 .O 9 .o 10.0
Total-to-Static Pressure Ratio
Figure 46. Comparison of Measured and Calculated Efficiency. (Equilibrium Model)

i
!
3 .O 4 .O 5 .O 6 .O 7 .O 8 .O 9 .o 10 .o Total-to-Static Pressure Ratio
Figure 47 . Comparison of hleasured and Calculated Vapor Flow Rate. (Equi 1 i b r i urn Model)

!
a .2
2 .o
1.8
1.6 0 a < 1.4 n In d
8 ) d.,
- 1.2
d 1 .o
d kl
g 0.8
s ge
0.6
0 .4
0.2
0
Inlet Temperature, 1450°F Rotative Speed, 18250 rpm
Calculated II
3 4 5 6 7 8 9 10
Total-to-Static Pressure Ratio
]Figure 48. Comparison of Measured and Calculated Vapor Flow Rate. (Equilibrium Model)

2 . 4
2.2
2 .o
1.8
1.6
1.4
1.2
1 .o
0 .8
0 . 6
0.4
0.2
0 I
i 3 .o 4 .O 5.0 6 .O 7 .[I 8 .O 9.0 10 .o
Total-to-Static Pressure Ratio
Figure 4 9 . Comparison of Measured and Calculated Vapor Flow R a t e . (Equll i br im Model)

cn w
i
2.2
2 .o
1.8
1.6
1.4
1.2
1.0
0.8
0 . 6
0.4
0.2
0
Total-to-Static Pressure Ratio
Figuro 50. Comparison o f Measured and Calculated Vapor Flow Rate. (Equilibrium Model)
. ..

2 60
240
220
200
180
160
k ai
PI 140
M .d E 120
-2 ;;1 100
80
60
40
20
0 3 .rj 4 .o 5 .O 6 .O 7 .o 8 .O 9.0 10.0
Total-to-Static Pressure Ratio
E'iKure 51. Comparison of hleasured and Calculated Power. (Equilibrium hlodel)

220
200
180
160
140
- k
a 0 $ 120
$ 100 a d
a d m 80
60
40
20
0 3 4 5 6 7 8 9 10
Total - to-Stat ic Pressure R a t i o

3.0 4 .o 5 .O 6.0 7 .o 8 .O 9 .o 10.0
Total-to-Static Pressure Ratlo

260 I I I I I I I 240
Rotative Speed, 15400 rpm Inlet Temperature, 1450°F -
i 3 .o 4 .O 5.0 6.0 7 .O 8 .O 9 .O 10 .o
Total-to-Static Pressure Ratio
Figure 54 . Comparison of Measured and Calculated Power. (Equl li hri unl Model)
" . .

22
20
18
16
.d a n a 14
0 Ll 3 V I
12 a 3 4 cl d
(I)
a ht Q c, rn
4 10
b 8 c,
Y E
6
4
2
0 0 2 4 6 8 10 12 14
Ex i t Tota l Pressure , ps ia
Figure 55. Comparison of Measured and C a l c u l a t e d S t a t i c Pressures. (Equilibrium Model)
68

22
20 c Inlet Temperature, 1450°F Rotative Speed, 18250 rpm
I I I
%J S t a t o r 2
@ Rotor 2
S t a t o r 3
"
0 2 4 6 8 10 12 14
Exit Tota l Pressure , ps ia
Figure 56. Comparison of Measured and Calcu la ted S ta t i c Pressures. (Equilibrium Model)
69

22
20
18
16
4 a
14
2 4
; 12 T.
.r( 'J
c) a ;; 10 0, M m c)
m 2 s J
Y G
6
4
2
0
0 2 4 6 8 10 12 14
Ex i t Tota l Pressure , ps ia
Figure 57. Comparison of'hleasured and Calcu la ted S ta t i c Pressures. (Equilibrium Model)
70
.."

22
20
18
16
14
12
10
8
6
4
2
0
- I n l e t Temperature, 1450°F Rotative Speed, 15400 rpm
Calculr
t
0 2 4 6 8 10 12 14
Exit Tota l Pressure , ps ia
Figure 58. Comparison of Measured and C a l c u l a t e d S t a t i c Pressures (Equilibrium Model)
NASA-Langley, 1969 - 3 E - 5290 71