three local surveys on households' economic conditions in an italian province massimo baldini...
TRANSCRIPT

Three local surveys on households' economicconditions in an Italian Province
Massimo Baldini University of Modena and Reggio EmiliaCapp – Centro per l’analisi delle politiche
pubbliche

• IcesMo: Indagine sulle condizioni economiche e sociali delle famiglie della provincia di Modena.
• Why a survey at the local level?• Beginning of 2000s: tendency towards greater political autonomy of Regions and
Municipalities• Need to know:• who are the groups at risk of social exclusion in the area, also to define a map of
the potential extension of the «area of social need», otherwise risk for social policies to focus only on emergencies or explicit demands
• which characteristics have the poor • how the local labour market is changing • how local policies affect the distribution of income and who is affected• simulations to evaluate (ex ante) the distributive effects of local policies • (housing taxation, personal income tax surcharge, tariffs for child care services
differentiated by income levels…)• the interaction between wealth, well-being, health, social participation, time
use…• «objective» parameters for the discussion and planning of policies, so as to
make more transparent and less sector-based the area of social interventions

• Alternatives: national surveys like Eu-Silc or Shiw• But we knew that the socio-economic conditions of
households living in the province of Modena were (and still partly are) different from those of the whole of Italy
• need to select only a subsample of the national datasets
• low number of observations• Better to try to build a completely new dataset, if
funds available…• Possibility to build city-level maps of income
distribution using the survey and Census data.

4
Structure of the questionnaire• Household composition• Education• Labour conditions• Individual incomes from all sources• House of residence • Other real estates• Household wealth
• Services for elderly and disabled• Services for children• Unpaid work (care and housework)• Mobility, immigrants, youth• Leisure activities, social participation• Health • Subjective well being
• SF12 questions on overall quality of life and health

• Many questions of our survey are taken from the Shiw questionnaire possibility of making comparisons
• 3 waves: 2002, 2006, 2012• Repeated surveys allow to study
improvements and worsenings in socio-economic conditions among groups
• Before and after the crisis: changes by sectors, type of occupation, type of household

2002 survey• Used for performing simulations• Main results:• A book entitled «La ricchezza dell’equità», The richness
of equity: • High levels of economic welfare• Low levels of poverty and inequality• Significant share oh households reached by public
services• a slice of Sweden in the middle of the Po Valley• Indicators of multidimensional distribution of living
standards

2006 survey
• Second book: «Le città incartate», The wrapped cities
• First signs of the weakening of the «Emilian model»: increase in inequality and income poverty, effects of immigration, very low dynamics of real disposable incomes, only incomes from real estate on the rise.

• The results anticipated some tendencies that were not so clear from national surveys
• Strong opening of the local economy and society to exchanges with the rest of the world (of goods, services, people)
• Significant differences in the levels of poverty and inequality within the province (thanks to representative subsamples for some local districts), a piece of information available only through a local survey

2012 survey
• Bad times: economic crisis and earthquake• Sections devoted to the earthquake• Clear reduction in real incomes, strong increase in
poverty and inequality• Fall in disposable incomes above all for households with
children and of workers, much less for households of pensioners and public sector employees.
• Reduction in life satisfaction, but not for the better-off.• Still greater divide between immigrants and the rest of
the population

1010tab cl anno [aw=we], col nofreq
Distribution of real disposable income among persons

1111tab cl anno [aw=we], col nofreq
Distribution of real disposable income among persons

1212tab cl anno [aw=we], col nofreq
Distribution of real disposable income among persons

1313
Gini of disposable income
Cash income + imputed rents
Cash income
2002 0.255 0.263
2006 0.282 0.285
2012 0.296 0.302

1414
% change of average disposable income by ventiles
-60.0%
-50.0%
-40.0%
-30.0%
-20.0%
-10.0%
0.0%
10.0%
20.0%
1 2 3 4 5 6 7 8 9 10 11 12 13 14 15 16 17 18 19 20
from 2002 to 2006
from 2006 to 2012
from 2002 to 2012

1515
1 2 3 4 5 6 7 8 9 100%
10%20%30%40%50%60%70%80%90%
100%
Extra-UeUEItaliana
tab dec cittad if anno==2012 [aw=we], row nofreq
Deciles composition in 2012 by nationality of the head

16
Disposable eq. income by age

1717
13.6%15.6%
17.8%
3.3%5.0%
8.2%
0%2%4%6%8%
10%12%14%16%18%20%
2002 2006 2011
linea 40%
linea 60%
poverty headcount rate among persons – local variable line
Number of poor
40% 60% Total population
2002 20700 86100 634713
2006 33000 103600 665337
2011 57300 124500 700913

1818
Headcount ratio (60%) by age – local variable line

1919
In nine years, the number of severely poor children has increased by 5 times in the province: from 2000 to 10000
Headcount ratio (40%) by age – local variable line

2020
Condition of the head
Composition Incidence
Manual worker 53.7 35.7
White collar 4.1 3.3
Self-employed 9.2 10.5
Unemployed 15.3 72.9Pensioner 17.6 10.0
Total 100.0 17.8
Composition and incidence of poverty in 2012(60%, local variable line)

2121
N. earners or pensioners Composition Incidence
0 8.0 86.21 59.9 36.02 25.2 8.5>=3 6.8 7.6Total 100.0 17.8
Composition and incidence of poverty in 2012(60%, local variable line)

2222
N. earners Italian Not Italian Total
0 1 9 3
1 19 51 26
2 70 34 63
3 9 6 9
Total 100 100 100
Households with children by number of earners and nationality of the head 2012

2323
0 1 2 30%
10%
20%
30%
40%
50%
60%
70%
80%
20062012
Households with children by number of earners

2424
Could your family face an unexpected expense of 800 euro with your resources?
By nationality of the head
Not italian Italian Total
Yes 30 83 76
No 70 17 24
total 100 100 100

2525
Could your family allow a weekly holiday every year? By nationality of the head
Not italian
Italian Total
Yes 37 74 70
No 63 26 30
Total 100 100 100
Could your family allow to eat meat or fish at leat every two days? By nationality of the head
Not italian
Italian Total
Yes 76 93 91
No 24 7 9
Total 100 100 100

2626
From 2008 onwards, as a consequence of the crisis did tour family asked for a loan to relatives or friends?
Not italian Italian Total
Yes 33 8 11
No 67 92 89
Total 100 100 100

27
Greater equality of opportunity?
Headcount poverty rate among children (national poverty line, 60%)
Modena North Italy ItalyAll children 20.1% 18.8% 32.0%Children with Italian father
8.8% 9.9% 28.1%
Childrel with foreign father
62.5% 66.1% 67.3%
2828
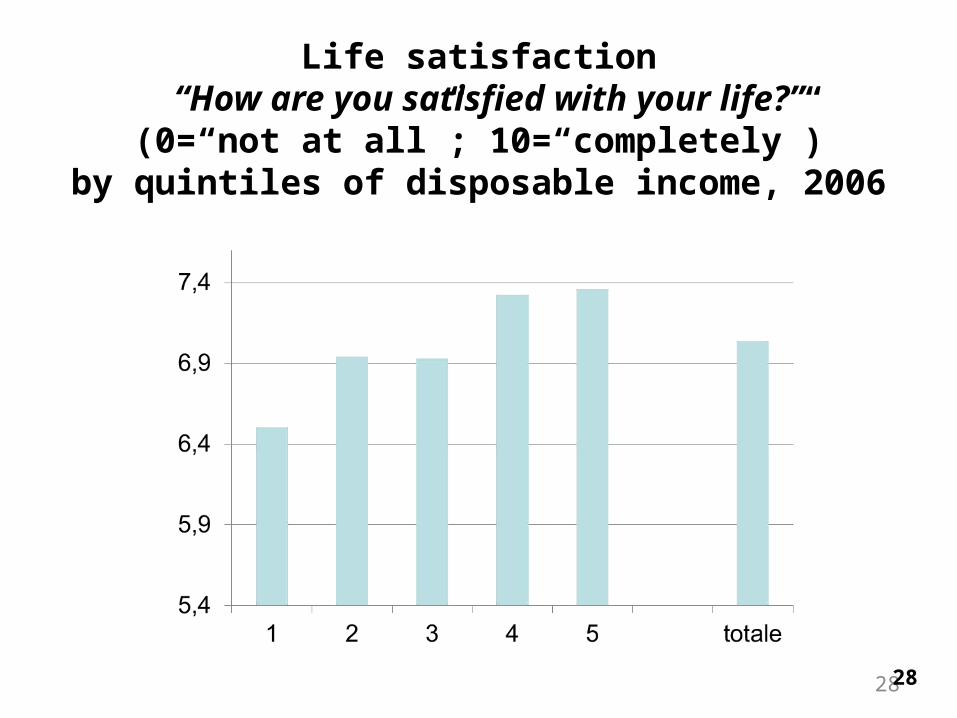
Life satisfaction “How are you satisfied with your life?”
(0=“not at all”; 10=“completely”)by quintiles of disposable income, 2006

2929
Life satisfaction “How are you satisfied with your life?”
(0=“not at all”; 10=“completely”)by quintiles of disposable income, 2006 and 2012

30
Perception of problems
How serious do you think these problems are in your town?0= not serious; 10=very serious
2006 2012 % change M F M F M F
Criminality 5,8 6,0 5,7 6,0 -2% 0% Traffic 7,0 7,1 6,0 6,3 -15% -12% Pollution 7,1 7,4 6,6 6,8 -6% -8% Integration of immigrants 6,0 5,7 5,5 5,6 -8% -3% Hospitals waiting times 6,5 6,9 6,1 6,8 -6% -1% Bad manners 5,6 5,8 5,9 6,3 5% 8% Finding or changing home 5,9 6,0 4,9 5,2 -18% -14% Finding or changing job 6,0 6,6 7,3 7,7 20% 18% General economic situation 5,8 6,0 7,3 7,7 27% 28%
30

• How the results of these surveys have been used:• 2 books, about 20 papers, several presentations
at the local level to politicians, public administrators, general interested public.
• The results have provided the basis for the elaboration of periodic programming plans for health and social policy.
• Contribution to a better knowledge of who we are and where we live.

• The datasets of the three surveys are freely available to researchers upon request.
• Soon they will be downloadable from the web, provided the resulting papers are published also in our working paper series.