three essays in behavioral management accounting
TRANSCRIPT

Dottorato di ricerca in Economia aziendale Scuola Superiore di Economia (SSE) Ciclo 24 (A.A. 2010 – 2011)
Three Essays in Behavioral Management Accounting
SETTORE SCIENTIFICO DISCIPLINARE DI AFFERENZA: SECS-P/07 Tesi di dottorato di Nicola Dalla Via, matricola 955549 Coordinatore del Dottorato Tutore del dottorando Prof. Massimo Warglien Prof. Marco Vedovato Co-tutore del dottorando Prof. Paolo Collini

-2-

-3-
The undersigned Nicola Dalla Via, in his quality of doctoral candidate for a
Ph.D. degree in Business granted by the University of Venice, attests that
the research exposed in this dissertation is original and that it has not been
and it will not be used to pursue or attain any other academic degree of any
level at any other academic institution, be it foreign or Italian.
Venice, June 25th
, 2012

-4-
-5-
Acknowledgments
I am grateful to my supervisors, Marco Vedovato and Paolo Collini for their
support during the preparation of this dissertation. After attending the
management accounting course taught by Marco, I was sure about the future
direction of my work. We have exchanged many opinions on the research
and in front of a coffee he has given me many hints about the academic
environment. Paolo stimulated my interest for the management accounting
field. He always believed in my possibilities and he agreed to be my
external supervisor. During the Ph.D. years we have had great discussions,
in several locations, and we have developed a bunch of ideas. Furthermore,
Paolo explained me the importance of networking and attending
conferences. In June 2009 he encouraged me during my first presentation in
a conference with an international audience. Since then I learned a lot about
the meaning of „doing research‟ and I am definitely in debt with him.
In Venice, I am also thankful to Massimo Warglien, the coordinator of the
Ph.D. program, and to Fabrizio Panozzo. Massimo introduced me to the
„behavioral economics‟ issues with a passion that sets him apart. This is one
of the reasons why the word „behavioral‟ appears in the title of my
dissertation. I thank Fabrizio because he gave me the opportunity to start
developing my teaching skills in his international class.
The dissertation greatly improved during my visiting research period at
Rotterdam School of Management. I have had the pleasure to work with
Frank Hartmann and to learn a lot from him. He believed in my project and
he has been so patient during the development phase. He has the ability to
spread his love for research around the department and he has a word of
encouragement for everyone. In Rotterdam, in addition to all the Accounting
& Control team, I have to thank Marcel van Rinsum and Frank Verbeeten
for the suggestions and for the relaxing lunch breaks. A special thank to

-6-
Paolo Perego, who has always been ready to help and to have a chat.
Finally, a big hug to my friends Khurram and Anant. They have had the
primary role of interrupting the long days of work.
Many thanks also to Martine Cools. She is a joyful person and her
comments are always well appreciated. We met during conferences and
summer schools and she accepted to be one of the referees of this
dissertation. Thanks Martine.
I have shared the Ph.D. journey with Anna, Ender, Giulia, and Marisa. We
have had terrible moments, especially during our courses, but we helped
each other in overcoming the difficulties. The energy of the DEA team has
had a key role in achieving our objective. Warm thanks also to all the others
friends/colleagues at SSE.
I dedicate a thought to my friends Lorenzo and Chiara. Thanks for listening
to my complaints and for your patience when I was too busy to go out.
Anyway, you have been and you are important.
Many people believe in me, but no one like my parents. The Ph.D. journey
has not always been easy and smooth, but your feelings transmitted me the
strength to succeed in my target. A target planned long time ago. Thanks for
the opportunity to go in this direction. Thanks for everything.
Finally, special thanks to Gianna. We combined two journeys: the Ph.D. and
„our‟ journey. Thanks for your patience when I was not present because of
this dissertation. I do not need many words for you, but you have all my
love.

-7-
Contents
Introduction .................................................................................................... 9
Chapter 1
Behavioral management accounting and control: The origins of a stream of
research ........................................................................................................ 11
1.1. The historic pathway ......................................................................... 11
1.2. The underlying social sciences.......................................................... 14
1.3. The research methods ........................................................................ 16
1.4. The main issues ................................................................................. 19
1.5. The managerial and practical implications ....................................... 24
References ................................................................................................ 26
Chapter 2
Long-term performance and supervisor evaluation biases........................... 35
2.1. Introduction ....................................................................................... 36
2.2. Research setting ................................................................................ 38
2.3. Theoretical background and hypotheses ........................................... 43
2.4. Research design ................................................................................. 49
2.5 Results ................................................................................................ 51
2.6. Discussion and conclusion ................................................................ 63
References ................................................................................................ 65
Chapter 3
The recognition of the asymmetry: Sticky costs and cognitive biases......... 69
3.1. Introduction ....................................................................................... 70
3.2. Literature review and hypotheses development ................................ 72
3.3. Experimental method ........................................................................ 75
3.4. Results ............................................................................................... 84

-8-
3.5. Discussion and conclusion ................................................................ 93
References ................................................................................................ 95
APPENDIX – Research instrument ............................................................. 98
A1 – Instructions ...................................................................................... 98
A2 – Comprehension check ................................................................... 101
A3 – Cognitive Reflection Test.............................................................. 101
A4 – Numeracy ...................................................................................... 101
A5 – Cognitive Style Index .................................................................... 103
A6 – Final questionnaire ........................................................................ 105
Chapter 4
The influence of accountability and scorecard framing on strategy
evaluation ................................................................................................... 107
4.1. Introduction ..................................................................................... 109
4.2. Literature review and hypotheses development .............................. 111
4.3. Experimental method ...................................................................... 119
4.4. Results ............................................................................................. 126
4.5. Discussion and conclusion .............................................................. 130
References .............................................................................................. 133
APPENDIX – Research instrument ........................................................... 138
A1 – Instructions. The business case ..................................................... 138
A2 – Individual evaluation ..................................................................... 139
A3 – Final questionnaire ........................................................................ 140

-9-
Introduction
The studies conducted in the management accounting field are often
informed by a variety of social sciences, such as economics, psychology,
and sociology. However, it is widely recognized that behavioral accounting
studies draw mainly from psychology theories. The role played by
individuals in processing accounting information and their attitude toward
managerial decision making are key aspects examined by behavioral
accounting.
The purpose of this dissertation is to investigate some specific issues
related to the behavior of individuals involved in management accounting
tasks such as performance evaluation, cost prediction and adjustment, and
decisions about strategic investments.
The first chapter provides a brief historical review of the origins of
the studies on behavioral management accounting and control. After the
exposition of the theoretical foundations, I dwell on the most important
disciplines that contributed to the development of the behavioral accounting
stream and on the most common research methods. Finally, I give an outline
of the three main topics that represent the pillars of the contemporaneous
studies. The first is budgeting process, the second is performance
management and rewards, and the last is information and decision making.
The three papers composing this dissertation are positioned within
two of the identified research areas. Chapter 2 deals with the introduction of
subjective performance measures and how they relate with evaluation
biases. Chapter 3 and 4 are focused on information and decision making. In
particular, Chapter 3 investigates the recognition of a specific cost behavior,
such as cost stickiness, under different presentation formats, and Chapter 4
examines how strategic decisions are influenced by the presentation of
information in a balanced scorecard and by the introduction of different
types of accountability.
-10-
To develop the empirical sections of the studies I adopt a variety of
research methodologies. In Chapter 2 I rely on proprietary archival data
gathered in a public administration and in Chapter 3 and 4 I employ data
collected by conducting two different laboratory experiments.
Overall, I contribute to the literature by extending the knowledge on
how individuals behave when facing management accounting issues. I
explore the cognitive processes adopted in decision making and the possible
biases. Finally, by highlighting the areas of criticality inside of an
organization, the results have also relevant managerial implications
suggesting how to improve the managerial processes and how to avoid, or at
least to reduce, detrimental behaviors.

-11-
Chapter 1
Behavioral management accounting and control:
The origins of a stream of research
“For as long as organizations comprise people,
their behaviors will influence organizational functioning”
(Dunk, 2001, p. 40)
1.1. The historic pathway
Almost 60 years have passed over since Argyris (1952) published
The impact of budgets on people. The study addresses the attitudes of the
individuals toward the budget and in particular the relationship between the
budget setting process and the human behavior. The focus on aspects such
as motivation, participation, and leadership is the first attempt to provide a
new direction of research that combines accounting information and people
(Lord, 1989).
Few years later, Stedry (1960) and Devine (1960) continued to
pursue accounting studies under the influence of psychology. The
psychological concept of aspiration level is applied to budgets to deepen the
understanding of the relationship between motivation, goal difficulty, and
performance (Stedry, 1960). Moreover, at a more theoretical level, a method
of inquiry is suggested by Devine (1960) who considers the study of
behavioral relations as a feasible area for accounting investigation. He
highlights in particular the psychological reactions of the accounting
information users and the importance of recognizing the behavioral
assumptions in the accounting theory.
The 1960s represent what Dyckman and Zeff (1984) define as the
Decade of Awakening in the accounting literature and the appellation is

-12-
extensible also for what it concerns the behavioral issues. During these
years the first experiments have been conducted and the seminal work of
Caplan (1966) was published. In his paper Behavioral assumptions of
management accounting, Caplan compares the behavioral assumption of the
traditional management accounting theory with those of the modern
organizational theory, with the purpose to demonstrate that “an
understanding of behavioral theory is relevant to the development of
management accounting theory and practice” (Caplan, 1966, p. 496).
However, it was not before the 1967 that the term “behavioral
accounting” appeared in the literature. Discussing Cook‟s (1967) paper in
the Journal of Accounting Research, the psychologist Selwyn Becker (1967)
criticizes the emerging stream of research stating that “It is my opinion that
most, if not all, the experiments performed by accountants, or by semi-
accountants, for dissemination to accountants, add nothing to knowledge in
behavioral science” (Becker, 1967, p. 227) and ironically calling Cook as
“the new Behavioral Accounting Scientists”. In order to achieve optimal
progresses and profitable synergies in solving the behavioral issues related
to the accounting field, Hofstedt and Kinard (1970) call for an overall
strategy, a guide for the research, that they see as missing.
In 1972 Anthony Hopwood contributed to the field with his analysis
on the use of accounting data and measures in performance evaluation and
with Jake Birnberg, at the Empirical Research Conference in Chicago,
began to conceive what two years later has become the Behavioral
Accounting Newsletter. According to Hopwood and Birnberg “By that time
we were both conscious of the growing research interest in the behavioral,
organizational and social dimension of accounting on both sides of the
Atlantic and indeed elsewhere. But we also were very conscious that there
was little mutual awareness amongst many of the researchers” (Hopwood,
2009, p. 887).
Contrary to the initial expectations, soon it became clear that a new
specialist journal was carving out its own space in the editorial market. The

-13-
first issue of Accounting, Organizations and Society, edited by Anthony
Hopwood, was published in 1976.
Using as main reference the paper of Hopwood (1972), Otley (1978)
examined the evaluation of managerial performance depending on the
budgetary style reaching conflicting conclusions.
Further recognition of the emerging interest about behavioral
accounting research came from the establishment of the Accounting,
Behavior and Organizations Interest Section by the American Accounting
Association in 1981. Few years later, in 1989, the Section decided to publish
a new journal, Behavioral Research in Accounting, and named as first editor
Ken Euske.
In order to trace the growth of the behavioral paradigm in
accounting, Dyckman (1998) examined the published articles and the
number of accounting faculty who selected the behavioral approach as area
of interest. Looking to the measurable variables, the data confirms the
substantial contribution of the behavioral paradigm to the understanding of
accounting phenomena and the increasing trend.
During the 1998 the first volume of a new series of articles has been
published under the editorial supervision of James Hunton. Advances in
Accounting Behavioral Research publishes papers in all the accounting
areas subject to the influence of applied psychology, sociology,
management science, and economics.
A confirmation of the conclusions reached by Dyckman (1998)
comes from Dunk (2001) who reviews the progress made by behavioral
research in management accounting and the great expansion of the
addressed issues.
Among the statements of recognition of the growing interest about
the behavioral approach applied to the accounting area, a critical perspective
emerges with the paper published by Zimmerman (2001). He expressed
some concerns about the knowledge produced by the empirical managerial
accounting research in comparison to other areas of accounting research. In
particular he conjectures the focus on describing practice instead of testing

-14-
theories, the emphasis on decision making instead of control, and the use of
frameworks from social sciences other than economics. The reply to these
critiques gave origin to a powerful and polyphonic debate. For what it
concerns the purpose of this introduction, Lukka and Mouritsen (2002),
Hopwood (2002), Ittner and Larcker (2002), and Luft and Shields (2002),
argued that an heterogeneous research strategy that combines economics-
based and behavioral approaches produces more substantial managerial
accounting progresses than relying on a purely economic model. According
to Luft and Shields (2002), the variety of social sciences (i.e. economics,
psychology, and sociology) that informs the research in the management
accounting field and the underlying testable hypothesis, offers the
opportunity to explain important features such as the interaction with the
individuals and to provide more complete findings.
1.2. The underlying social sciences
Various disciplines have contributed, and still are contributing, to the
research performed in the behavioral accounting literature. The most
important fields are economics, political science, organization theory,
psychology, and sociology (Birnberg and Shields, 1989).
Interdisciplinary concepts like the behavioral theory of the firm,
which draws on economics, political science and organization theory, are
imported in management accounting works since the beginning of the
research stream (Caplan, 1966).
Among the diversity of disciplines, it is widely recognized that the
main role is played by psychology. The three subfields, not mutually
exclusive, which are primarily important in management accounting
research, are: cognitive, motivation, and social psychology. The first one,
cognitive psychology, is focused on human thinking and the most influential
psychological processes; the second one, motivation psychology, is focused
on behavior and the related psychological processes; the last one, social
psychology, is focused on the influence on individuals‟ minds and behavior
exerted by other people (Birnberg et al., 2007). Motivation and social

-15-
psychology theories are the theoretical frameworks underlying the first
works in the behavioral accounting research. The former is applied by
Stedry (1960) to relate budget goal difficulty and individual performance,
while the latter is adopted by Hopwood (1972) to study the influence
exerted by a superior on the evaluation of the subordinates and the related
consequences. The role played by the individual processing of accounting
information for decision making, that is the focus of the cognitive
psychology theory, is recognized some years later with the so called
“cognitive revolution”. Barefield (1972) examined in laboratory how the
effect of aggregation of cost-variances influences the success of the related
decisions, while Mock et al. (1972) studied the influence on decision
making of the interaction between accounting feedback and individuals‟
cognitive style.
The three psychological subfield presented above are just clusters
that contain several more specific theories that have contributed to the
development of management accounting research. According to the
comprehensive review provided by Birnberg et al. (2007) the theories are
the following:
- motivation psychology theories: level of aspiration theory, goal-
setting theory, cognitive dissonance theory, organizational justice
theory, expectancy theory, attribution theory, and person-environment fit
theory;
- social psychology theories: role theory, social comparison theory,
and social identity theory;
- cognitive psychology theories: behavioral decision theory
(probabilistic judgment, heuristic and biases, prospect theory and
framing, search heuristics, probabilistic functionalism), judgment and
decision performance (mental models, outcome effects).
Similarly to what happen with psychology, even the disciplines of
accounting and sociology began to develop combined research hypothesis
during the 1950s. In particular Argyris (1952), with his study focused on
budgets and people, drew from the sociological field the issue of groups

-16-
which remained one of the hottest topics for several years. Ten years later
Becker and Green (1962) enlarge the focus looking to the interaction
between budget realization and group dynamics followed by the analysis of
Hopwood (1974). During these years sociological matters at a higher level
of analysis were almost neglected in favor of the processes occurring within
organizations. For this reason Hopwood (1974) suggested the
reconsideration of the influence on accounting of the wider social and
economics environment. According to Miller (2007), since the 1980s the
sociological concepts used in accounting research were developed in
connection with the accounting discipline itself. In particular the main
stream of research is represented by the focus on the institutional
environments of accounting and in particular the analysis of the dynamic
links between an organization and its environment. Institutional theory is the
characterization of collective behavior as an aggregation of individual
actions (DiMaggio and Powell, 1991). Other theories applied to accounting
research and drawn from sociological studies are the structuration theory of
Giddens, the Foucauldian approach, the Latourian approach, the naturalistic
approach which tries to investigate the develop and use of management
accounting practices in localized everyday settings, and the radical
alternative which is based on the works of Marx and on the labor process
literature (Baxter and Chua, 2003).
1.3. The research methods
Nowadays, the presence of the term “behavioral” is commonly
linked to the use of laboratory experiments. Although they represent the
dominant research methods, they are not the only possibility pursued in the
behavioral accounting literature. There is also evidence of empirical
methods other than experiments such as surveys, field researches, and
archival studies.
The greatest benefits from the use of a laboratory experiment are the
possibility to distinguish specific cause-effect relationships from other
factors and the improved control by the researcher over the whole

-17-
procedure. It is possible to select randomly the participants, to design the
most adapt task and measures, and to manipulate the experimental
conditions according to the theoretical needs. These characteristics,
combined together, increase the internal validity of the research in
comparison to other empirical methods (Obermaier and Müller, 2008). The
participants involved into laboratory experiments are often students, even if
management accounting research introduced in few cases the use of
practitioners due do their broader knowledge and experience. For example
Morssinkhof et al. (2009) use students, but also practitioners contacted at a
trade fair, to study purchasing decisions and the use of total cost of
ownership, while Bol and Smith (2010) involve supervisors of a public
university, with high seniority, to investigate bias, fairness, and
controllability of subjective performance evaluations. However, professional
people do not necessarily behave like during their normal work raising
issues of reliability and problems of cognitive biases. Liyanarachchi (2007)
finds that accounting students are adequate surrogates for practitioner in
many decision-making studies and that realism and replication are much
important factors for the generalization of the results. Moreover, there can
emerge concerns about the generalization of experimental results to real life
settings, such as problems of external validity, requiring a careful theoretical
ground of the findings and an adequate design of the experiment.
The experiments conducted in accounting and, more generally, in the
broad area of economics, share many methodological issues with the
psychological field. However, the most important differences regard the
context, the use of incentives, and of deception (Croson, 2005). Differently
from the psychological experiments, in economics the context is less
important and it is often kept neutral in order to avoid specific biases, an
increase in variance, and to have a better generalization of the results.
Moreover, the need of realism and the involvement of compensation in most
of decision-making economic theories, imply the use of monetary incentives
which are not often used in psychology. Finally, psychology experiments
use to deceive participants, but this behavior is strongly criticized in

-18-
experimental economics and it is also seen as a serious threat against the
validity.
Even if the laboratory setting is the most common type of
experiment, there are also market experiments and field experiments which
are less diffused in the behavioral accounting literature. The firsts try to
recreate an artificial market with buyers and sellers and the possibility to
include multiple periods. Sprinkle (2000) adopted the experimental market
method to study the impact on learning and performance of an incentive-
based compensation rather than a flat-wage contract. Criticisms have been
raised about the high costs necessary to run these experiments and the lack
of realism. The seconds are more likely as laboratory experiments, but they
are conducted in more realistic settings, such as real companies, with more
external validity, but fewer possibilities of control and less freedom about
the design of the study and the manipulation of variables.
Another diffused empirical method to investigate behavior in the
management accounting field is the use of surveys. Drawing from
psychology and the other social sciences, it is possible to prepare specific
questions in order to identify and to measure abstract concepts like
motivation, satisfaction, attitude, effort, and trust which pertain to the
individual behavior. As an example Shields and Shields (1998) analyze 47
published articles on participative budgeting finding a prevalence of survey
over the laboratory experiment method. According to Hageman (2008),
surveys have greater realism and hence external validity rather than
experiments, they are also cheaper to conduct, and it is possible to obtain a
larger amount of information. The non-response bias and the social-
desirability bias are the most common threats.
Sometimes it is also possible to use archival data to investigate
behavioral issues. For example Ittner and Larcker (1998) study the relation
of customer satisfaction and behavior with financial performance, then Ittner
et al. (2003) collect documents in a bank to explore the influence of
subjectivity in weighting performance measures in a balanced scorecard
context, and Moers (2005) analyze discretion and bias in performance

-19-
evaluation using proprietary archival data of a private company. Normally,
if they are available, the data are seen as more objective and more adequate
to cover larger samples (Merchant and Otley, 2007). However, it can be
hard to clearly separate cause-effect relationships from other confounding
effects.
Behavioral constructs can be also analyzed using a field study
approach such as been done by Anderson et al. (2002) investigating the
factors influencing the performance of activity based costing teams. This
research method suffers partially of the same limitations of the archival data
since the studied effects may manifest in combination with other factors.
Anyway, laboratory experiments and surveys remain the dominant
research methods applied in behavioral management accounting research,
while the other possibilities are considered more as an exception. Looking
forward, to go more in depth in the decision processes and to understand
how and why the brain is activated, neuroscientists are making a bridge with
economics giving origin to the so called neuroeconomics. The potentialities
for the accounting field are proposed by Birnberg (2011, 2012), even if
problems of cost, diffusion of knowledge, and availability of machineries
are important obstacles to the diffusion of such research method in a future
perspective.
1.4. The main issues
Several topics have been analyzed during the years combining
management accounting notions and theories from other social sciences.
Without pretense of completeness, here are exposed three broad topics
which represent the pillars of the contemporaneous studies. The first one is
the budget with its related determinants and characteristics; the second one
is performance management and rewards; the last one is information and
decision making.

-20-
The budgeting process
The oldest and broadest issue studied in the management accounting
field with a behavioral approach is the budgeting process, which includes
budgetary participation, the effects of motivation, leadership style, and
budgetary slack. The first area regards the budgetary participation and the
effects on human behavior. According to Brownell (1982) the budget
emphasis may impact the performance depending on whether the
participation is high or low. A similar study was performed by Dunk (1989)
finding contradictory results. A possible explanation is traced to task
uncertainty as argued by Brownell and Hirst (1986) and Brownell and Dunk
(1991). The understanding of the importance of the specific circumstances
and contextual factors present inside or outside an organization contributed
to the affirmation of the contingency theory in the behavioral accounting
research (Otley, 1980). The issue of participation has been explored also in
relation with several aspects such as for example role ambiguity (Chenhall
and Brownell, 1988) and job-satisfaction (Leung and Dunk, 1992;
Lindquist, 1995).
According to Brownell and McInnes (1986) budgetary participation
increases the performance as a consequence of a positive effect on
motivation. Among the theories used to study the motivation in
organizations, the goal-setting theory, which is related to the level of
aspiration, is the most used. The relation between budget goal difficulty,
budget feedback and performance is a topic studied by Kenis (1979), and by
Hirst and Lowy (1990). Use of budgets and job-related tension is another
topic in the work of Kenis (1979) and Brownell and Hirst (1986). The topic
of the participation in the budget process and the relation with the
performance is addressed also from the point of view of the organizational
justice theory (Libby, 1999) and of the expectancy theory (Ronen and
Livingstone, 1975; Brownell and McInnes, 1986). Moreover, the difference
in the explanations given by managers to the variances between actual and
budgeted performance, may be understood using the attribution theory as
done by Shields et al. (1981). The explaining factors differ depending on the

-21-
assumed role in the participative setting, and on the achieved performance.
Another point of view is the one assumed by Shields et al. (2000), who
adopt the person-environment fit theory to analyze how the participative
budgeting affects performance with mediation of stress. Participative
budgeting is affected also by national culture through the behaviors of
individuals as investigated by Frucot and Shearon (1991) and Harrison
(1992).
The second area regards the budgeting process and leadership style.
This stream of research is opened by DeCoster and Fertakis (1968) who use
role theory to investigate the role of the budget pressure induced by the
supervisors. The studies in the area are pursued later also by Hopwood
(1972) who focused his work on the use of budget and performance
information by superior managers.
The third area, which can be considered within the issue of
participative budgeting, involves the creation of budgetary slack (Lowe and
Shaw, 1968; Schiff and Lewin, 1968; Onsi, 1973). The investigation of the
propensity to create budgetary slack depending on the budgeting system and
the technical context is pursued by Merchant (1985), while the study of the
determinants that link together participation and budgetary slack is proposed
by Dunk (1993).
Performance management and rewards
The second issue is represented by performance management and
assignment of rewards. Hayes (1977) explores the contingent factors,
internal or external to the organization, contributing to the explanation of the
performance assessments of the organizational departments. Another
contingent study in this area is the examination of the interaction between
environmental uncertainty and performance evaluation style conducted by
Govinadarajan (1984).
Generally, monetary incentives are used to motivate individuals and
to induce more effort. However, perceptual differentiation, which is the
ability to abstract familiar concepts from a complex setting, impacts on the

-22-
performance of the decision maker suggesting how important are the
cognitive characteristics for the performance evaluation and for the reward
system (Awasthi and Pratt, 1990). Incentive-based contracts are also
preferred to flat compensations in multiple-periods tasks, because they
increase the performance and motivation of the workers, and their learning
from feedback (Ashton, 1990). The way in which individuals choose
between incentive contracts has been another research topic. The prediction
of the prospect theory is confirmed when the choice is between two
contracts with the same expected pay, but different framing of payoffs (Luft,
1994).
The evaluation of the individual performance, when performed in
relation to others, impacts on the effort exerted on the assigned tasks
(Frederickson, 1992) as predicted by the social comparison theory.
When making comparative judgments common measures are
weighted more than unique measures, even in presence of incentives and
feedbacks (Slovic and MacPhillamy, 1974). According to these results,
when both common and unique measures are present in a balance scorecard
context, Lipe and Salterio (2000) state that performance evaluations are
affected only by common measures.
The effects of the evaluative style, also known as reliance on
accounting performance measures (RAPM), on the performance evaluation
of the subordinates is a well studied topic where, however, consistent
findings are still not present (Briers and Hirst, 1990; Lindsay and
Ehrenberg, 1993). Even Hartmann (2000) agrees that the RAPM literature is
not organized as a critical mass and that the effects of the interaction
between RAPM and budgetary participation are not well defined.
Finally, the use of subjective measures in the evaluation of
individual performance results in supervisors‟ biases and distortions (Moers,
2005).

-23-
Information and decision making
The third issue regards information and decision making and
includes data fixation, and matters of representation. Moreover, influence on
decision making of the management of costs and the emergence of
particular types such as sticky costs, sunk costs, and opportunity costs are
possible opportunities to apply behavioral concepts.
The topic of data fixation draws, with some differences, from the
psychological concept of functional fixation and it analyzes the conditions
under which a decision maker is no more able to adjust the decisional
process to a change in the accounting procedure (Riahi-Belkaoui, 2002).
The first recognition of functional fixation in the accounting field is carried
out by Ijiri et al. (1966). Following their indications Ashton (1976)
conducted an experiment to determine how the individual decision
processes are altered in case of an accounting change from full-cost to
variable-cost. However, Libby (1976) criticized the experimental design,
and stimulated the work of Swieringa et al. (1979) who found that the
significance of the adjustments differed depending on the way of
measurement. Further evidence of data fixity is provided by Chang and
Birnberg (1977) with their experiment involving a cost variance report and a
cost standard and by Bloom et al. (1984) who compared individual and
group decisions in response to a change in the depreciation method.
Moreover, Luft and Shields (2001) present a study of the different use of
information by individuals when intangible expenditures are capitalized
rather than expensed. Accounting fixation affects also pricing decisions
made in a contest of change in the cost accounting method as a result of
interaction between ability, motivation and knowledge (Dearman and
Shields, 2005).
The matters of data representation can assume different points of
view. The impact on the performance of the decisions about variance
investigation is different depending on ex ante or ex post information, due to
the so called outcome effect and to how the information is framed (Lipe,
1993). A different problem of data representation is examined by Shields
-24-
(1980, 1983) who considered how the complexity of a performance report
influences the search behavior of individuals and the utilization of the
search heuristics. Also the physical representation of the information, that is
in graphical or tabular format, impacts the decision making process of the
manager (Sullivan, 1988; So and Smith, 2002).
The process of decision making is influenced also by the accounting
knowledge of the involved individual. The relation between accounting
knowledge and resource-allocation decisions in a contest where opportunity
costs are present is investigated by Vera-Muñoz (1998). Furthermore, the
level of cost accounting knowledge influences the cost-based judgments
about the performance in a volume-based cost system context for products
with different consume of resources (Dearman and Shields, 2001).
Finally, the presentation format and the level of accounting
knowledge are also studied jointly in order to understand the influence in
cost-based decision making (Cardinaels, 2008).
1.5. The managerial and practical implications
The variety of issues that can be studied using a behavioral
perspective implies broad and different implications on practice. The
traditional empirical and theoretical managerial accounting articles have the
purpose to deepen the knowledge about a technique, its determinants and
the possibilities for improvement. The consideration of the “user” of such
technique opens a different stream of research with practical consequences
and implications. It is not more possible to abstract completely from the
cognitive processes applied by a subject during the operationalization of the
accounting and control procedures.
For example, the findings on the budgeting process and the
implication of participation, goal-difficulty, motivation, and role ambiguity,
should give important insights on how to design the best procedure
according both to the psychological needs of the individuals and to the best
fit to the organization. The reasoning could be extended also to the
performance measurement systems and to the incentive payment schemes,

-25-
which should be defined considering not only the theoretical optimum, but
also the perception of the individuals. An exemplar case could be the
presence in the balanced scorecard of both common and unique performance
measures with respect to specific organizational units. As investigated by
Lipe and Salterio (2000), the cognitive limitations of the managers act as a
constraint reducing the informational power of the management accounting
technique, in this case the balanced scorecard. Indeed, the decisions of the
unit‟s managers are more driven by common measures, while unique
measures tend to be neglected.
Finally, even topics not related to specific techniques, such as
information representation, reporting, decision-making, and data
interpretation are fruitful for practical implications. The knowledge of the
biases pertaining to individuals can be anticipated and corrected using for
example appropriate costing systems and reports organized in order to avoid
known psychological influences that can occur during the analysis process.
In conclusion, the traditional role of the management accountant and
the boundaries of the field are therefore progressively enlarging to
comprehend a greater amount of knowledge which cannot be further
ignored.

-26-
References
The historic pathway
Argyris, C., (1952). The impact of budgets on people. Controllership
Foundation, New York;
Becker, S. W., (1967). Discussion of The effect of frequency of feedback on
attitudes and performance. Journal of Accounting Research,
Supplement, 5, 225-228;
Caplan, E. H., (1966). Behavioral assumptions of management accounting.
The Accounting Review, 41(3), 496-509;
Cook, D. M., (1967). The effect of frequency of feedback on attitudes and
performance. Journal of Accounting Research, Supplement, 5, 213-
224;
Devine, C. T., (1960). Research methodology and accounting theory
formation. The Accounting Review, 35(3), 387-399;
Dyckman, T. R., (1998). The ascendancy of the behavioral paradigm in
accounting: The last 20 years. Behavioral Research in Accounting,
Supplement, 10, 1-10;
Dyckman, T. R., Zeff, T. A., (1984). Two decades of the Journal of
Accounting Research. Journal of Accounting Research, 22(1), 225-
297;
Dunk, A. S., (2001). Behavioral research in management accounting: The
past, present, and future. Advances in Accounting Behavioral
Research, 4, 25-45;
Hofstedt, T. R., Kinard, J. C., (1970). A strategy for behavioral accounting
research. The Accounting Review, 38-54;
Hopwood, A., (1972). An empirical study of the role of accounting data in
performance evaluation. Journal of Accounting Research,
Supplement, 10, 156-182;
Hopwood, A., (2002). „If only there were simple solutions, but there aren‟t‟:
some reflections on Zimmerman‟s critique of empirical management
accounting research. The European Accounting Review, 11(4), 777-
785;
Hopwood, A., (2009). Reflections and projections – and many, many
thanks. Accounting, Organizations and Society, 34, 887-894;
Ittner, C., Larcker, D., (2002). Empirical management accounting research:
are we just describing management consulting practice. The
European Accounting Review, 11(4), 787-794;
Lord, A. T., (1989). The development of behavioral thought in accounting,
1952-1981. Behavioral Research in Accounting, 1, 124-149;

-27-
Luft, J., Shields, M., (2002). Zimmerman‟s contentious conjectures:
describing the present and prescribing the future of empirical
management accounting research. The European Accounting
Review, 11(4), 795-803;
Lukka, K., Mouritsen, J., (2002). Homogeneity and heterogeneity of
research in management accounting. The European Accounting
Review, 11(4), 805-811;
Otley, D. T., (1978). Budget use and managerial performance. Journal of
Accounting Research, 122-149;
Stedry, A., (1960). Budget control and cost behavior. Prentice Hall,
Englewood Cliffs, NJ;
Zimmerman, J. L., (2001). Conjectures regarding empirical managerial
accounting research. Journal of Accounting and Economics, 32, 411-
427;
The underlying social sciences
Argyris, C., (1952). The impact of budgets on people. Controllership
Foundation, New York;
Barefield, R., (1972). The effect of aggregation on decision making success:
a laboratory study. Journal of Accounting Research, 10, 229-242;
Baxter, J., Chua, W. F., (2003). Alternative management accounting
research – Whence and whither. Accounting, Organizations and
Society, 28, 97-126;
Becker, S. W., Green, D., (1962). Budgeting and employee behavior. The
Journal of Business, 392-402;
Birnberg, J.G., Luft, J., Shields, M.D., (2007). Psychology theory in
management accounting research. In: Chapman, C. S., Hopwood, A.
G., Shields, M. D. (Eds.), Handbook of Management Accounting
Research, Vol. 1, Elsevier, Amsterdam, The Netherlands;
Birnberg, J. G., Shields, J. F., (1989). Three decades of behavioral
accounting research: A search for order. Behavioral Research in
Accounting, 1, 23-74;
Caplan, E. H., (1966). Behavioral assumptions of management accounting.
The Accounting Review, 41(3), 496-509;
DiMaggio, W., Powell, P., (1991). Introduction. In: DiMaggio, W., Powell,
P., (Eds.), The new institutionalism in organizational analysis. The
University of Chicago Press, Chicago;
Hopwood, A., (1972). An empirical study of the role of accounting data in
performance evaluation. Journal of Accounting Research,
Supplement, 10, 156-182;

-28-
Hopwood, A., (1974). Accounting and human behavior. Haymarket
Publishing, London;
Miller, P., (2007). Management accounting and sociology. In: Chapman, C.
S., Hopwood, A. G., Shields, M. D. (Eds.), Handbook of
Management Accounting Research, Vol. 1, Elsevier, Amsterdam,
The Netherlands;
Mock, T., Estrin, T., Vasarhelyi, M., (1972). Learning patterns, decision
approach, and value of information. Journal of Accounting Research,
10, 129-153;
Stedry, A., (1960). Budget control and cost behavior. Prentice Hall,
Englewood Cliffs, NJ;
The research methods
Anderson, S.W., Hesford, J.W., Young S.M., (2002). Factors influencing
the performance of activity based costing teams: A field study of
ABC model development time in the automobile industry.
Accounting, Organizations and Society, 27, 195-211;
Birnberg, J.C., (2011). A proposed framework for behavioral accounting
research. Behavioral Research in Accounting, 23(1), 1-43;
Birnberg, J.C., (2012). Is neuroaccounting waiting in the wings? An essay.
Accounting, Organizations and Society, 37(1), 1-13;
Bol, J.C., Smith, S.D., (2010). Spillover effects in subjective performance
evaluation: bias, fairness, and controllability. Working Paper,
University of Illinois at Urbana-Champaign;
Croson, R., (2005). The method of experimental economics. International
Negotiation, 10, 131-148;
Hageman, A.M., (2008). A review of the strengths and weaknesses of
archival, behavioral, and qualitative research methods: recognizing
the potential benefits of triangulation. Advances in Accounting
Behavioral Research, 11, 1-30;
Ittner, C.D., Larcker D.F., (1998). Are nonfinancial measures leading
indicators of financial performance? An analysis of customer
satisfaction. Journal of Accounting Research, 36, Supplement, 1-35;
Ittner, C.D., Larcker D.F., Meyer, M.W., (2003). Subjectivity and the
weighting of performance measures: Evidence from a balanced
scorecard. The Accounting Review, 78(3), 725-758;
Merchant, K.A., Otley, D.T., (2007). A review of the literature on control
and accountability, in Chapman, C.S., Hopwood, A.G., Shields,
M.D., (Eds.) Handbook of management accounting research, 2,
Elsevier, Oxford, UK;

-29-
Moers, F., (2005). Discretion and bias in performance evaluation: the
impact of diversity and subjectivity. Accounting, Organizations and
Society, 30, 67-80;
Morssinkhof, S., Wouters, M., Warlop, L., (2009). Effects of reflective
thinking and professional experience on purchasing decisions with
inaccurate cost information. Advances in Management Accounting,
17, 81-112;
Obermaier, R., Müller, F., (2008). Management accounting research in the
lab – method and applications. Zeitschrift für Planung &
Unternehmenssteuerung, 19, 325-351;
Liyanarachchi, G.A., (2007). Feasibility of using students subjects in
accounting experiments: a review. Pacific Accounting Review,
19(1), 47-67;
Shields, J.F., Shields, M.D., (1998). Antecedents of participative budgeting.
Accounting, Organizations, and Society, 23(1), 49-76;
Sprinkle, G.B., (2000). The effect of incentive contracts on learning and
performance. The Accounting Review, 67, 783-801.
The main issues
The budgeting process
Brownell, P., (1982). The role of accounting data in performance evaluation,
budgetary participation and organizational effectiveness. Journal of
Accounting Research, 20(1), 12-27;
Brownell, P., Dunk, A. S., (1991). Task uncertainty and its interaction with
budgetary participation and budget emphasis: Some methodological
issues and empirical investigation. Accounting, Organizations and
Society, 16(8), 693-703;
Brownell, P., Hirst, M. K., (1986). Reliance on accounting information,
budgetary participation, and task uncertainty: Tests of a three-way
interaction. Journal of Accounting Research, 24(2), 241-249;
Brownell, P., McInnes, M., (1986). Budgetary participation, motivation, and
managerial performance. The Accounting Review, 61, 587-600;
Chenhall, R. H., Brownell, P., (1988). The effect of participative budgeting
on job satisfaction and performance: Role ambiguity as an
intervening variable. Accounting, Organizations and Society, 13(3),
225-233;
DeCoster, D., Fertakis, J., (1968). Budget-induced pressure and its
relationship to supervisory behavior. Journal of Accounting
Research, 6, 237-246;
Dunk, A. S., (1989). Budget emphasis, budgetary participation and
managerial performance: A note. Accounting, Organizations and
Society, 4(4), 321-324;

-30-
Dunk, A. S., (1993). The effect of budget emphasis and information
asymmetry on the relation between budgetary participation and
slack. The Accounting Review, 68(2), 400-410;
Frucot, V., Shearon, W.T., (1991). Budgetary participation, locus of control,
and Mexican managerial performance and job satisfaction. The
Accounting Review, 66(1), 80-99;
Harrison, G. L., (1992). The cross-cultural generalizability on the relation
between participation, budget emphasis and job related attitudes.
Accounting, Organizations and Society, 17(1), 1-15;
Hirst, M., Lowy, S., (1990). The linear additive and interactive effects of
budgetary goal difficulty and feedback on performance. Accounting,
Organizations and Society, 15, 425-436;
Hopwood, A., (1972). An empirical study of the role of accounting data in
performance evaluation. Journal of Accounting Research,
Supplement, 10, 156-182;
Kenis, I., (1979). Effects of budgetary goal characteristics on managerial
attitudes and performance. The Accounting Review, 54, 707-721;
Leung, M., Dunk, A. S., (1992). The effects of managerial roles on the
relation between budgetary participation and job satisfaction.
Accounting and Finance, 1-14;
Libby, T., (1999). The influence of voice and explanation in a participative
budget setting. Accounting, Organizations and Society, 24, 125-137;
Lindquist, T. M., (1995). Fairness as an antecedent to participative
budgeting: Examining the effects of distributive justice, procedural
justice, and referent cognitions on satisfaction and performance.
Journal of Management Accounting Research, 7, 122-147;
Lowe, E. A., Shaw, R. W., (1968). An analysis of managerial biasing:
Evidence from a company‟s budgeting process. Journal of
Management Studies, 304-315;
Merchant, K. A., (1985). Budgeting and the propensity to create budgetary
slack. Accounting, Organizations and Society, 10(2), 201-210;
Onsi, M., (1973). Factor analysis of behavioral variables affecting budgetary
slack. The Accounting Review, 535-548;
Otley, D.T., (1980). The contingency theory of management accounting:
Achievement and prognosis. Accounting, Organizations and Society,
5(4), 413-428;
Ronen, J., Livingstone, J. L., (1975). An expectancy theory approach to the
motivational impacts of budgets, The Accounting Review, 50(4),
671-685;
Schiff, M., Lewin, A. Y., (1968). Where traditional budget fails. Financial
Executive, 50-62;

-31-
Shields, M., Deng, F. J., Kato, Y., (2000). The design and effects of control
systems: test of direct- and indirect-effects models. Accounting,
Organizations and Society, 25, 185-202;
Performance management and rewards
Ashton, R. H., (1990). Pressure and performance in effects of incentives,
feedback and justification. Journal of Accounting Research,
Supplement, 28, 148-180;
Awasthi, V., Pratt, J., (1990). The effects of monetary incentives on effort
and decision performance: The role of cognitive characteristics. The
Accounting Review, 65(4), 797-811;
Briers, M., Hirst, M., (1990). The role of budgetary information in
performance evaluation. Accounting, Organizations and Society,
15(4), 373-398;
Frederickson, J., (1992). Relative performance information: the effects of
common uncertainty and contract form on agent effort. The
Accounting Review, 67, 647-669;
Hayes, D. C., (1977). The contingency theory of managerial accounting.
The Accounting Review, 52(1), 22-39;
Hartmann, F. G. H., (2000). The appropriateness of RAPM: Toward the
future development of theory. Accounting, Organizations and
Society, 25(4/5), 451-482;
Govinadarajan, V., (1984). Appropriateness of accounting data in
performance evaluation: An empirical examination of environmental
uncertainty as an intervening variable. Accounting, Organizations
and Society, 9(2), 125-135;
Lipe, M., Salterio, S., (2000). The balanced scorecard: judgment effects of
common and unique performance measures. The Accounting
Review, 75, 283-298;
Lindsay, R.M., Ehrenberg, A. S. C., (1993). The design of replicated
studies. The American Statistician, 47, 217-228;
Luft, J., (1994). Bonus and penalty initiatives: contract choice by
employees. Journal of Accounting and Economics, 18, 181-206;
Moers, F., (2005). Discretion and bias in performance evaluation: The
impact of diversity and subjectivity. Accounting, Organizations and
Society, 30, 67-80;
Slovic, P., MacPhillamy, D., (1974). Dimensional commensurability and
cue utilization in comparative judgment. Organizational Behavior
and Human Performance, 11, 172-194;

-32-
Information and decision making
Ashton, R. H., (1976). Cognitive changes induced by accounting changes:
Experimental evidence on the functional fixation hypothesis. Journal
of Accounting Research, Supplement, 14, 1-17;
Bloom, R., Elgers, P. T., Murray, D., (1984). Functional fixation in product
pricing: A comparison of individuals and groups. Accounting,
Organizations and Society, 9(1), 1-11;
Cardinaels, E., (2008). The interplay between cost accounting knowledge
and presentation formats in cost-based decision making. Accounting,
Organizations and Society, 33, 582-602;
Chang, D. L., Birnberg, J. G., (1977). Functional fixity in accounting
research: Perspective and new data. Journal of Accounting Research,
15(2), 300-312;
Dearman, D., Shields, M., (2001). Cost knowledge and cost-based judgment
performance. Journal of Management Accounting Research, 13, 1-
18;
Dearman, D., Shields, M., (2005). Avoiding accounting fixation:
determinants of cognitive adaptation to differences in accounting
method. Contemporary Accounting Research, 22, 351-384;
Ijiri, Y., Jaedicke, R. K., Knight, K. E., (1966). The effects of accounting
alternatives on management decisions. In: Jaedicke, R. K., Ijiri, Y.,
Nielsen, O., (Eds.), Research in accounting measurement. American
Accounting Association, Sarasota, FL;
Libby, R., (1976). Discussion of Cognitive changes induced by accounting
changes: Experimental evidence on the functional fixation
hypothesis. Journal of Accounting Research, Supplement, 14, 18-24;
Lipe, M., (1993). Analyzing the variance investigation decision: the effects
of outcomes, mental accounting, and framing. The Accounting
Review, 68, 748-764;
Luft, J, Shields, M., (2001). Why does fixation persist? Experimental
evidence on the judgment performance effects of expensing
intangibles. The Accounting Review, 76, 561-587;
Riahi-Belkaoui, A., (2002). Behavioral management accounting. Quorum
Books, Westport, CT;
Shields, M., (1980). Some effects of information load on search patterns
used to analyze performance reports. Accounting, Organizations and
Society, 5, 429-442;
Shields, M., (1983). Effects of information supply and demand on judgment
accuracy: evidence from corporate managers. The Accounting
Review, 58, 284-303;

-33-
So, S., Smith, M., (2002). Colour graphics and task complexity in
multivariate decision-making. Accounting, Auditing and
Accountability Journal, 15(4), 565-592;
Sullivan, J. J., (1988). Financial presentation format and managerial
decision-making: Tables versus graphics. Management, 2(2), 194-
216;
Swieringa, R. J., Dyckman, T. R., Hoskin, R. E., (1979). Empirical evidence
about the effects of an accounting change on information processing.
In: Burns, T. J., (Ed.) Behavioral experiments in accounting II, Ohio
State University Press, Columbus;
Vera-Muñoz, S., (1998). The effects of accounting knowledge and context
on the omission of opportunity costs in resource-allocation decisions.
The Accounting Review, 73, 47-72;
The managerial and practical implications
Lipe, M., Salterio, S., (2000). The balanced scorecard: judgment effects of
common and unique performance measures. The Accounting
Review, 75, 283-298.

-34-

-35-
Chapter 2
Long-term performance and
supervisor evaluation biases
Abstract
This paper examines how the use of subjective performance evaluations and
the introduction of intermediate assessments to enhance managerial time
horizon relate with leniency bias and centrality bias. We investigate the
incidence of supervisors‟ evaluation biases in a biannual incentive system in
an Italian public administration. Using performance reports for 106
employees over three biannual evaluation periods (2001-2006), we analyze
supervisors‟ intertemporal evaluation biases. We find evidence for lenient
and compressed performance ratings especially in the second year of each
biannual evaluation period. We explain these biases, and their intertemporal
variation, by supervisors‟ relative emphasis on subjective and objective
performance metrics. We further analyze the effect of performance
categorization and find that leniency is enhanced for ratings closer to the
lower boundary of each performance category. The results have important
implications for understanding the trade-offs supervisors face when
enhancing their subordinates‟ long-term performance, and short-term
performance measure accuracy.
Key words: performance evaluation, leniency bias, centrality bias, long-term
performance
I am thankful to Frank Hartmann for the constant supervision of this chapter. I thank
Jasmijn Bol, Chris Chapman, Antonio Davila, Chris Ittner Mike Shields, and Alex Woods
and the seminar participants at the European Accounting Association Doctoral Colloquium
held in Siena in April 2011, at the Rotterdam School of Management, Erasmus University
in March 2011, at Tilburg University in July 2011, at the 6th Conference on Performance
Measurement and Management Control in September 2011, and at the 2012 AAA
Management Accounting Section Conference in January 2012 for their helpful comments.

-36-
2.1. Introduction
Performance-related pay (PRP) systems are typically accused of
emphasizing managerial short-term performance, at a cost to managers‟
attention to long-term objectives (Laverty, 1996, 2004; Marginson and
McAulay, 2008). One reason is that short-term performance is measurable
by objective and timely criteria. However, the introduction of subjective
assessments improves the informativeness of the objective measures
reducing the timeliness of the evaluation. In the longer term, when multiple
periods are involved, the disadvantage of the loss of timeliness is
compensated by the improvement in the feedback quality. By using
subjective estimations it is possible to catch long-term efforts and to direct
the future outcomes on a long-term path. Therefore, when supervisors
attempt to enhance their subordinates‟ focus on long term performance, they
face a trade-off between the potential positive effects of introducing
subjective criteria that enhance managerial time horizon (Baker et al., 1994;
Baiman and Rajan, 1995), and the risk of introducing evaluation biases such
as leniency and centrality (Prendergast and Topel, 1993, 1996; Rynes et al.,
2005).
In place of implementing a sophisticate bonus bank system (Van der
Stede, 2009), an organization may emphasize the focus on the long-term by
lengthening the time horizon through the introduction of intermediate
evaluations that concur to the final monetary incentive. In such case, the
type of evaluation and its perceived purpose, either administrative or
development, influences the potential bias of the subjective assessments
(Bernardin and Orban, 1990).
To document the effects of trade-off between the potential positive
effects of subjectivity and the risk of evaluation biases we study
performance reports collected over a six-year period (2001-2006) from a
sample of 106 managers in an Italian public administration (IPA). The PRP
system introduced in this IPA aimed to encourage managers‟ long-term
efforts and facilitate supervisors‟ evaluations of such efforts. Accordingly,
the system combines the use of various quantitative and qualitative

-37-
performance targets and biannual evaluation periods. The biannual period
with an intermediate evaluation and a final assessment allows the
investigation of the different impact of the subjective biases. We believe that
this combination provides an interesting field setting that complements
traditional experimental research designs, which may lack mundane validity
(Merchant et al. 2010).
This paper contributes to the literature on performance evaluation
systems by considering that the adoption of subjective measures introduces
the risk of evaluation biases, but also that such biases may differ according
to the timing of the evaluation and to its perceived purpose. In particular, we
attempt to answer the calls for time-series data that provide evidence about
the persistence of evaluation biases over longer periods and how their
effects change over time (Moers, 2005; Bol, 2011). To our knowledge, this
study is the first to employ data from multiple years of performance
evaluations in order to observe the behavioral changes of the evaluators in
their use of subjectivity. We extend the previous literature by analyzing the
extent of distortion variations according to the time horizon of the
evaluation. Our findings show lower leniency bias and lower centrality bias
in intermediate evaluations as compared with final evaluations. The results
indicate that the supervisors manage their dual roles as evaluators and
motivators, adjusting the ratings differently depending on the evaluation
year. There are advantages to having information about the ratings assigned
by evaluators who combine these two roles within the same time window
for the same organization. This information permits improvement over
previous work, which considered the two aspects of evaluators‟ roles by
analyzing different organizations simultaneously (Bernardin and Orban,
1990) or by inducing and forcing evaluations at a certain time (Greguras et
al., 2003).
The remainder of the paper is organized as follows. Section 2.2
presents our research setting and provides an overview of the design of the
biannual performance evaluation system. Section 2.3 reviews the literature
and develops specific hypotheses. Section 2.4 describes the methods of

-38-
analysis, and Section 2.5 discusses the results. Finally, Section 2.6
summarizes this paper, presents the conclusions from our study and
discusses its relative strengths and weaknesses.
2.2. Research setting
We analyze a PRP system in an Italian public administration (IPA)
that utilizes a biannual evaluation cycle. Some background on the
organization and the design and rationale of its biannual performance
evaluation system is provided below.
The IPA in this study provides governmental services in a region of
approximately 500,000 citizens. The services are heterogeneous, ranging
from street maintenance to healthcare.
Figure 1 – Hierarchical levels of the organization
Note: average figures refer to the 2001-2006 period.
It consists of a publicly elected board that supervises several
operational departments. These departments are headed by a general
17 Departments
67 Head offices
198 Offices
Financial affairs
Institutional relations
Agriculture and nutrition
Forests and mountains
Industry, craft, and mines
Education
Cultural heritage
Public transportation
Civil protection
Infrastructures
Human resources
Research and innovation
Labor and welfare
Healthcare
Tourism
Environment
City planning

-39-
manager who supervises the managers of the head offices. Our analysis
focuses on the relationship between supervisors and managers (Figure 1). In
turn, managers of the head offices supervise a series of directors who are in
charge of the functional offices. The number of departments, head offices
and functional offices is periodically subject to reorganization or to
modifications precipitated by political changes. During the period of
analysis (2001-2006), there were, on average, 17 general managers, 67
managers, and 198 directors. The IPA, as a whole, employs over 4,000
employees.
The introduction of a performance-related pay system was based on
formal, national legislation introduced in Italy in 1992 and 1993 that aimed
to shift attention from „actions‟ to „results‟ in the public sector and to
improve managerial responsibility. While the legislators‟ overall intention
was to improve efficacy, efficiency, quality, and transparency within the
public sector, the law introduced specific rules for human resources
management and performance-related pay. In particular, it mandated the
“separation between political and administrative tasks” at the managerial
level, the “evaluation of results performed by special committees composed
by experts and general managers”, and the adoption of incentives “related to
the individual and group productivity determined with appropriate
measurement and evaluation procedures” instead of the previous
„automatisms‟ used to assign financial rewards (1992 law).
In 1997, the IPA acknowledged the national legislation with a
specific local norm. In contrast to other public administrations, this IPA
included the following verbiage: “[T]he managerial evaluation is conducted
every two years […] with reference to the achieved results” (1997 law). The
motivation was twofold. First, the two-year period was believed to reduce
myopia because it would „consider the performance trend in a longer
perspective‟. Second, it intended to increase the quality of performance
evaluations because yearly performance was deemed subject to „erroneous
judgments due to unusual or temporary contingencies‟.

-40-
The IPA implemented the PRP system that we study in 2000, based
on the appointment of a specific evaluation committee that would develop
the performance evaluation procedure according to the legislative guidelines
and help supervisors in conducting individual evaluations. The outcome of
the evaluation is used to assign incentives and to confirm the assignment of
managerial positions. The PRP system works as described below, with some
differences depending on the year under assessment. A number of steps are
taken during the first year of the evaluation period. First, the political board
defines a strategic plan and, then, together with the general managers
prepares the objectives and targets to be achieved. Second, drawing from the
list of objectives, general managers create performance evaluation forms for
each manager, adding the appropriate weights. The evaluation forms are
then validated by the evaluation committee. Third, at the end of the year,
general managers evaluate the performance through the assignment of
appropriate ratings to the objectives (i.e., an intermediate evaluation), and
the forms are further validated. At this point, an advance on the incentive is
paid to the managers. The amount is equal for everybody and is linked to the
average performance level of all managers. The procedure for the second
year is somewhat different because it is considered a continuation of the
previous year. First, the year begins with the revision of evaluation forms by
the general managers, who are allowed to make minor changes, such as
substituting some indicators and adjusting the targets according to
contingencies. Next, at the end of the second year, the assessment is
conducted analogously to the previous year. Third, the intermediate and
final ratings for each manager are averaged and classified according to pre-
identified incentive categories. The incentive balance is paid to the
managers according to these categories. Deeper revisions of the strategic
plan, major redefinitions of the objectives, and changes of procedure are
possible between biannual periods, when the previous evaluation is finally
closed. Figure 2 shows the timeline of the entire performance evaluation
cycle.

-41-
Figure 2 – Timeline of the evaluation cycle
The incentive plan
At the IPA, in addition to a fixed salary, an incentive is paid to
managers on the basis of the outcome of the performance evaluation. The
evaluation concerns two dimensions: the results obtained during the period
and managerial behavior. The results are assessed by weighting three groups
of qualitative and quantitative targets. The performance indicators for each
manager are appointed jointly by the general managers and the political
board1. Despite the heterogeneous competencies of the organizations as a
whole, each head office is focused on a particular sector and a specific area
of responsibility2. Consequently, the measures and the targets involved in
the performance evaluation are customized for each manager.
The evaluator assigns scores between 1 and 5 to each performance
target, depending on the level of achievement, and then, the final rating is
classified within the appropriate incentive category among the six possible
choices. The structure of a performance evaluation form is reproduced in
Figure 3.
1 In the research setting, qualitative measures are subjectively assessed whereas quantitative
measures are objectively evaluated. In the study, following the literature, we use also the
terms „objective‟ and „subjective‟, but we prefer the terms „qualitative‟ and „quantitative‟
because they are more precise and more appropriate for our context. 2 The focus on specific tasks in each individual evaluation is a crucial element in permitting
reliable comparisons between the single performance ratings assigned to each manager.
Year X Year X+1
Intermediate
evaluation
Year X+2
Final evaluation
Choice of
performance
measures and
weights
Payment of the
anticipated incentive
equally among managers
Minor revision of
performance measures
and weights based on the
previous year
Computation of the
averages and payment
of the incentive balance
Choice of performance
measures and weights
for the next evaluation
period

-42-
Figure 3 – Performance evaluation form
PERFORMANCE EVALUATION FORM
SECTION 1: PERSONAL INFORMATION AND ORGANIZATIONAL POSITION
Name Department / Head office
Evaluation period: Year X / Year X+1
First or second year: First
SECTION 2: RESULTS’ EVALUATION
Objective Weight Indicator
and target
Reference
date
Rating Score
Strategic: Rating x
group weight
x obj. weight […]
[…]
Process:
[…]
[…]
Subsistence:
[…]
[…]
SECTION 3: ORGANIZATIONAL BEHAVIOR’ EVALUATION
Factors Weight Rating Score
Development of
human resources
Organizational
management
Interpersonal
relationships
Administrative
attitude
The entire process is synthesized as follows:
s
k
kkC
m
j
jjB
n
i
iiA ObjwwObjwwObjww111
results of Rating
ii Factorw
4
1i
behavior org. of Rating
behavior org. of Rat.results of Rat. rating Final 21 ww
In the first equation, n, m, and s are the number of performance
measures within groups A, B, and C, respectively; Aw , Bw , and Cw are the

-43-
weights associated with groups A, B, and C, respectively; and iObj , jObj ,
and kObj are the objectives included within groups A, B, and C,
respectively. In the second equation, iw is the weight applied to each
evaluated factor. In the third equation, 1w and 2w are the weights associated
with results and organizational behavior, respectively.
2.3. Theoretical background and hypotheses
Agency theory suggests that PRP systems are used in response to the
agency problem and that choosing informative and complete performance
measures enhances the performance of an organization through increased
managerial effort. Because the principles of informativeness and
completeness are not satisfied by the adoption of only quantitative (i.e.,
objective) measures in incentive contracts (Holmström, 1979), optimal
agency contracts also include qualitative (i.e., subjective) measures.
Subjectivity influences the assignment of incentives in at least four different
ways: subjective measures (Baker et al., 1994), subjective weights (Ittner et
al., 2003), subjective bonuses (Gibbs et al., 2004), and subjective
adjustments (Woods, 2009).
However, the introduction of subjectivity comes at the cost of
potentially unfair and biased judgments by evaluators who not only may
have incentives to exercise such judgments but also may be subject to
cognitive biases. Psychological motivations, such as the cost of
communicating poor evaluations, the tendency to favor specific employees
because of political considerations, and the preference for equality in
rewards among employees, distort the ratings of supervisors (Prendergast
and Topel, 1993). Thus, the literature on management accounting utilizes
psychological theories in studying the determinants and the effects of biased
judgments.
Moers (2005) finds that the adoption of multiple measures of
performance and the introduction of subjective judgments are significant
determinants of evaluation biases such as leniency and centrality. Bol

-44-
(2011) provides evidence of the positive relationship between supervisors‟
rating costs, such as information gathering and confrontation costs, and
biased judgments. Moreover, these biased judgments affect future employee
performance and incentives both positively and negatively. Contrary to a
majority of findings, neither the leniency bias nor the centrality bias of
subjective ratings emerges in the study of Merchant et al. (2010). However,
they find leniency in objective measures in times of economic stress.
The most common errors are leniency bias, centrality bias, and range
restrictions. Leniency bias is the tendency of evaluators to provide
performance ratings higher than those warranted by employee performance
whereas centrality bias and range restriction emerge from the tendency of
evaluators to provide compressed performance ratings that do not
discriminate among employees. These biases are called distributional errors
(Murphy and Cleveland, 1995) because they can be observed when the
actual rating distribution differs from the assumed distribution for job
performance. For instance, if we expect a normal distribution of ratings,
deviations from normality are evidence of bias. However, a comparison with
a hypothetical distribution is not fully reliable given that an organization
strives to have a majority of high performing employees, which, in turn,
creates an asymmetric distribution. Research shows that evaluators are more
likely to distort ratings when they have direct financial consequences for
their subordinates (Prendergast and Topel, 1993).
In this study, we provide some insight into how the design of a
performance evaluation system aimed to enhance the subordinates‟ focus on
long-term objectives leads to evaluation biases. In particular, the
introduction of subjective judgments and the time horizon of the evaluation
are important elements affecting the behavior of general managers who must
review the work of managers. We begin by examining whether subjective
judgments lead to performance evaluation bias as already proved in the
literature. Then, we contribute by studying how the time horizon of the
evaluation cycle has an effect on the behavior of the evaluators and on their
biased evaluations.
-45-
Subjectivity
According to the literature, compared with their use as performance
feedbacks, the use of performance ratings for incentive purposes and
promotion decisions leads to less reliable judgments. When monetary
implications or career promotions are involved, psychological factors
stimulate the implicit attitudes of supervisors to alter performance ratings.
The adoption of discretionary performance measures allows supervisors to
adjust assessments according to contingent, unexpected, or uncontrollable
factors. At the same time, subjective judgments are a way to bias the
evaluations to control goal achievement and differentiation among
employees. Accordingly, we expect to find evidence of biased ratings when
subjective judgments about qualitative performance measures are compared
with the ratings assigned objectively to quantitative performance measures.
Formally, we hypothesize the following:
HP 1A: Compared with objective evaluations, subjective judgments lead to
lenient performance ratings.
HP 1B: Compared with objective evaluations, subjective judgments lead to
compressed performance ratings.
Time horizon
The tendency toward leniency is a characteristic of the supervisor
that is normally observed within a single evaluation period; only a few
studies report evidence of this tendency across different evaluation periods.
Guilford (1954) hypothesized for the first time the stability of such
behavior, and Kane et al. (1995) confirmed such an effect in three different
samples and situations. On the basis of these findings, we expect biases to
persist over time; however, we do not expect the same levels of magnitude
across different evaluation periods. The time horizon of the evaluation and
the frequency of evaluations are two elements that influence supervisor
behavior. In multi-period evaluation settings, where the trade-off between

-46-
the positive effects of subjective measures on enhancing the managerial
focus on long-term performance and the risk of introducing evaluation
biases is emphasized, we expect positive evidence of leniency and centrality
but a different level of bias for each period within the same evaluation
round.
It can be argued that supervisors consider the dual nature of
evaluations. On the one hand, from the role of the evaluator, a certain level
of severity, fairness and objectivity is expected by employees (Kahn et al.,
1964; Katz and Kahn, 1978). On the other hand, a satisfactory amount of
incentive is expected by individuals to raise their goal levels and their
commitment to achieving goals, thus, increasing their performance (Locke
and Latham, 1990, 2002). These two expectations correspond to the
different purposes of the evaluation. The performance appraisal literature
has found that supervisors behave differently when the purpose of the
assessment is administrative rather than development related. Taylor and
Wherry (1951) conducted one of the first studies that investigated the
relationship between performance appraisal purpose and accuracy of
performance ratings. They provided evidence that the ratings assigned to
development purposes, such as feedback and research, are more accurate
and less lenient than the ratings assigned to administrative purposes, such as
pay increases, promotions, and bonuses. Research that is more recent has
confirmed the influence of the appraisal‟s purpose on the outcome of the
evaluation, in particular, the greater leniency of evaluations conducted for
incentives and promotions compared with evaluations conducted for
feedback (Bernardin and Orban, 1990; Harris et al., 1995). Greguras et al.
(2003) considered three main reasons that theoretically explain the influence
of the rating purpose on the accuracy of the evaluations. First, the
motivation of the supervisor is affected by the purpose of the appraisal;
second, a conflict can emerge between the role of the supervisor in the
organization and the purpose of the appraisal; and third, the capabilities and
cognitive processes of the supervisor change, depending on the purpose of
the appraisal. However, not all studies concur with previous conclusions; for

-47-
example, McIntyre et al. (1984) found no significant differences between
ratings assigned for different purposes. To clarify the reasons underlying the
inconsistencies in the literature, Jawahar and Williams (1997) provided an
extensive meta-analysis of the effects of performance appraisal purpose.
Examining 22 studies, they concluded that administrative ratings are more
lenient than feedback ratings when managers in real organizations evaluate
real subordinates. Inconsistencies emerge when students are involved in the
evaluations, when the setting is a laboratory, when paper or videotaped
people are the subject of the evaluation, and when superiors are evaluated
instead of subordinates.
According to the literature, the two purposes (feedback and incentive
assignment) lead to different evaluations, and the supervisor faces the
problem of counterbalancing the two forces. Normally, the trade-off must be
solved by the general manager at the time of the evaluation, but in the
context of an extended evaluation period, with an intermediate evaluation
after the first year, the evaluator is more likely to split the contrasting
behaviors between the two years. On the one hand, according to previous
literature (Taylor and Wherry, 1951), the ratings assigned at the end of the
final year have a direct impact on employees‟ payments. Supervisors‟
evaluations are indeed more likely to be inflated to motivate subjects and
enhance their bonuses. On the other hand, the ratings assigned in the
intermediate evaluations do not have an immediate and direct effect on
incentive payments; they are perceived as feedback highlighting the
effective contributions of employees to company performance. Therefore,
supervisors‟ awareness of the high probability of inflated ratings in the final
evaluation increases their tendency to provide severe feedback and to avoid
inflating intermediate assessments.
Finally, awareness of the potential for inflated ratings in different
years has an impact on supervisors‟ tendencies toward to centrality. In
particular, in the intermediate evaluation, supervisors are more likely to be
less central and to increase the differentiation among employees. In
addition, rating variation is higher because their values are more realistic;
-48-
they are not as subjectively inflated as in the final evaluation. On the
contrary, in the final evaluation, a more central distribution of ratings is
more likely to be verified because supervisors tend to reduce the range of
ratings to those values in the upper part of the evaluation scale aimed to
reward employees.
More specifically, in a two-year setting, we expect a lower level of
leniency bias among ratings and a lower compression of assessments,
namely a lower centrality bias, in the first year. Formally, we hypothesize
the following:
HP 2A: Performance ratings are less lenient in intermediate evaluations than
in final evaluations.
HP 2B: Performance ratings are less central in intermediate evaluations than
in final evaluations.
Another issue connected to the time horizon of evaluations concerns
the influence of performance categories on the assignment of ratings by
general managers. In particular, the boundary levels of each category
assume a significant role when leniency dominates, such as in the final
evaluations.
When the final ratings are computed, the amount of incentive is paid
either proportionally to the level of achievement or according to discrete
performance categories. However, the use of thresholds influences
supervisors to behave as if they are part of an earnings management system
(Degeorge et al., 1999). The boundary of the incentive categories are
considered pre-defined targets for selected individuals to reach.
Performance ratings that surpass the threshold of the incentive category by a
few scores are expected to be more lenient, and hence more biased, than
ratings that are closer to the upper threshold but do not reach it. According
to the previous discussion, we expect this behavior to be emphasized more

-49-
during final evaluations, when leniency bias is higher than in intermediate
evaluations. Formally, we hypothesize the following:
HP 3: Final performance ratings closer to the lower threshold of the
incentive category are more lenient than other performance ratings.
2.4. Research design
Sample
To study the impact of multi-year incentives on effort and evaluation
biases, we collected performance reports for 106 managers during three
complete periods that range from 2001 to 2006. The total number of
collected reports was 404, with an average of 67 managers‟ reports per year.
By gathering additional documents, such as resolutions and methodological
guidelines, and administering some informal interviews, we gained a deeper
understanding of the incentive plan adopted by the IPA. For instance, using
specific grids, biannual averages are computed and assigned to the
respective incentive categories.
As mentioned previously, a combination of qualitative and
quantitative objectives was used to assess the results. The presence of both
types of measures is essential for making comparisons between performance
ratings3. However, some managers involved in particular sectors and tasks
were evaluated only with qualitative measures and are thus excluded from
the sample. The person responsible for the evaluation procedure explained
that the quantitative measures are objectively assessed by each evaluator by
applying the mathematical rule of deviation from the target. Ideally, the
evaluator must follow the same rule for qualitative measures, but
realistically, subjectivity is strongly involved. Furthermore, she provided
several examples of both types of measures to facilitate a better
understanding of the distinction between them. Examples of quantitative
3 Even if both qualitative and quantitative measures are used to capture the results of
different tasks, the specialization of the manager and the narrow definition of the area of
responsibility allow us to assume that the skills and the effort exerted are the same across
tasks.

-50-
measures include “130,000 certificates issued”, “72 projects financed”, “2
percent increase from the level of the previous year” while qualitative
measures include “preparation of a proposal”, “to provide support to the
external consultant”, “to conduct a market analysis and final report”. Two
independent researchers proceeded with the classification of targets to
distinguish between qualitative and quantitative performance measures. At
the end of the process, a third researcher adjudicated a few cases of non-
agreement, providing evidence of robust classification. The outcome of the
selection procedure was a sample composed of 257 performance reports for
91 managers. Furthermore, to perform significant comparisons between
ratings, we conducted our analyses focusing on the section of the evaluation
forms dedicated to managerial results.
Variables
Dependent variables
The comparison between the average performance ratings assigned
to qualitative and quantitative performance measures for each manager is
the first step of an analysis that detects the presence of leniency bias. As
explained before, leniency bias is the tendency of evaluators to assign higher
ratings to employees than they deserve on the basis of their performance.
The variable RATING includes the two performance measures, qualitative
and quantitative, computed separately for each year and for each manager in
the sample.
To determine whether performance ratings are biased, we must
compare the average ratings assigned to qualitative performance measures
with the average ratings assigned to quantitative performance measures. If
subjectivity in the evaluation of qualitative measures leads to leniency bias
and centrality bias, we expect to find, on average, greater and less dispersed
qualitative ratings compared with quantitative ratings.
The differentiation among managers is measured in terms of
compression of performance ratings. Less dispersed qualitative ratings
compared with the distribution of quantitative ratings are evidence of
-51-
centrality bias. To create reference groups for comparing the compression of
ratings, we use both the total number of managers employed each year and
the total number of managers employed in each department each year. For
the two possible reference groups, we compute the ratio between individual
qualitative and quantitative ratings and the respective mean rating of the
reference group, and we obtain the dependent variables used to discover the
presence of centrality bias (RATIO_RAT and RATIO_RAT_BYDPT).
Independent and control variables
To examine the relationship between biases and subjectivity, a
dummy variable is used to codify whether the rating is related to qualitative
targets or to quantitative targets (D_SUB).
To control for alternative explanations of the differences between
qualitative and quantitative ratings (other than evaluation biases), we
include in the models both the number of performance measures used to
compute the average rating (N_PM) and the sum of the weights assigned to
that measure (W_SUM). Other characteristics of the worker and the
working environment that affect the ratings are considered in our controls:
the gender of the manager (GENDER), the presence of previous evaluations
in the managerial position (FIRST_EV), the number of colleagues in the
department (N_COLL), and the department itself (DEP). The influence of
the time horizon is controlled in terms of year of evaluation within the
period (FIRST_Y) and period of evaluation (PERIOD).
2.5 Results
Descriptive statistics
The primary statistics computed for the entire sample reveal a high
and compressed overall performance rating (mean of 3.99 and standard
deviation of 0.37). The distinction between qualitative ratings and
quantitative ratings points to a predominance of the former over the latter.
The ratings of qualitative targets are significantly higher (mean of 4.12 vs.
3.87) and more compressed (standard deviation of 0.37 vs. 0.60) than the
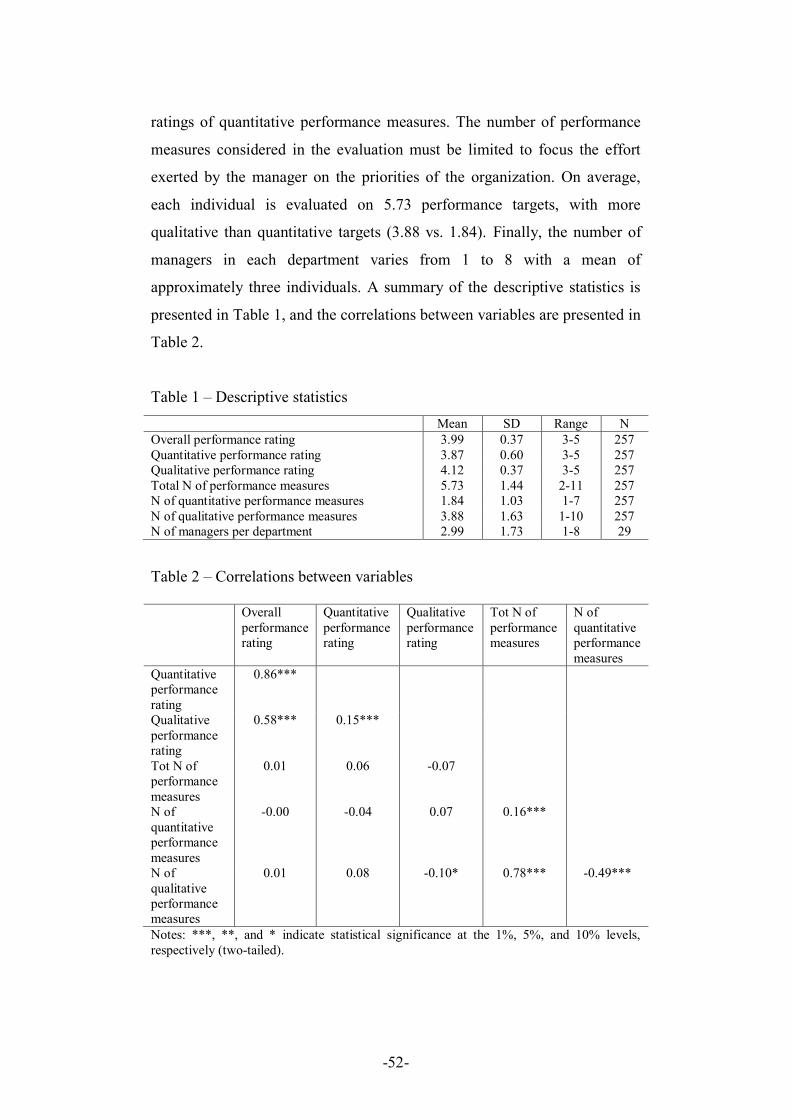
-52-
ratings of quantitative performance measures. The number of performance
measures considered in the evaluation must be limited to focus the effort
exerted by the manager on the priorities of the organization. On average,
each individual is evaluated on 5.73 performance targets, with more
qualitative than quantitative targets (3.88 vs. 1.84). Finally, the number of
managers in each department varies from 1 to 8 with a mean of
approximately three individuals. A summary of the descriptive statistics is
presented in Table 1, and the correlations between variables are presented in
Table 2.
Table 1 – Descriptive statistics
Mean SD Range N
Overall performance rating 3.99 0.37 3-5 257
Quantitative performance rating 3.87 0.60 3-5 257
Qualitative performance rating 4.12 0.37 3-5 257
Total N of performance measures 5.73 1.44 2-11 257
N of quantitative performance measures 1.84 1.03 1-7 257
N of qualitative performance measures 3.88 1.63 1-10 257
N of managers per department 2.99 1.73 1-8 29
Table 2 – Correlations between variables
Overall
performance
rating
Quantitative
performance
rating
Qualitative
performance
rating
Tot N of
performance
measures
N of
quantitative
performance
measures
Quantitative
performance
rating
0.86***
Qualitative
performance
rating
0.58*** 0.15***
Tot N of
performance
measures
0.01 0.06 -0.07
N of
quantitative
performance
measures
-0.00 -0.04 0.07 0.16***
N of
qualitative
performance
measures
0.01 0.08 -0.10* 0.78*** -0.49***
Notes: ***, **, and * indicate statistical significance at the 1%, 5%, and 10% levels,
respectively (two-tailed).

-53-
The descriptive statistics for each single year confirm the patterns of
the entire sample (Table 3). The overall performance rating is constant over
the years, and the qualitative ratings are persistently higher and more
compressed than the qualitative ratings. The only notable differences are a
progressive reduction in the number of performance measures, from more
than six in 2001 and 2002 to five in 2006, and a slight increase in the
number of quantitative targets over qualitative targets. For instance, during
the last five years, the ratio of quantitative to qualitative targets increased
from a proportion of 30 to 70 percent to a proportion of 37 to 63 percent.

-54-
Table 3 – Descriptive statistics (for single years)
2001 2002 2003
Mean SD Range N Mean SD Range N Mean SD Range N
Overall performance rating 3.96 0.35 3.25-4.63 43 3.94 0.35 3.17-4.67 47 3.99 0.34 3.25-4.67 42
Quantitative performance rating 3.83 0.60 3-5 43 3.83 0.61 3-5 47 3.88 0.58 3-5 42
Qualitative performance rating 4.08 0.38 3.5-5 43 4.05 0.34 3.33-4.5 47 4.10 0.27 3.5-4.75 42
Total N of performance measures 6.14 1.83 3-11 43 6.64 1.26 3-9 47 5.71 1.04 4-7 42
N of quantitative performance
measures
2.05 1.17 1-5 43 1.96 1.18 1-7 47 1.64 0.82 1-4 42
N of qualitative performance
measures
4.09 2.03 1-10 43 4.68 1.46 2-8 47 4.07 1.20 2-6 42
N of managers per department 3.07 1.94 1-6 14 3.13 1.81 1-7 15 3.00 1.88 1-8 14
2004 2005 2006
Mean SD Range N Mean SD Range N Mean SD Range N
Overall performance rating 4.01 0.36 3.25-4.75 40 4.06 0.46 3.25-5 44 3.99 0.32 3-4.67 41
Quantitative performance rating 3.86 0.58 3-5 40 3.95 0.63 3-5 44 3.85 0.59 3-5 41
Qualitative performance rating 4.16 0.31 3.5-4.75 40 4.18 0.44 3-5 44 4.13 0.45 3-5 41
Total N of performance measures 5.45 1.18 3-8 40 5.27 1.25 3-8 44 5.02 1.37 2-8 41
N of quantitative performance
measures
1.70 0.76 1-3 40 1.84 1.20 1-7 44 1.85 0.91 1-4 41
N of qualitative performance
measures
3.75 1.51 1-7 40 3.43 1.58 1-6 44 3.17 1.50 1-7 41
N of managers per department 2.67 1.29 1-5 15 2.93 1.91 1-7 15 3.15 1.72 1-7 13

-55-
Subjectivity
The presence of leniency and centrality bias is investigated by
examining the difference between the ratings assigned to qualitative targets
and those assigned to quantitative targets. Consistent with the literature, we
assume that the tasks assessed using the two typologies of targets are
comparable in terms of complexity and that the efforts exerted by managers
are not significantly different4. In the absence of biases, the ratings for
qualitative and quantitative measures are expected to have, on average, the
same values and distributions.
To test for the occurrence of leniency bias, we use the qualitative
and quantitative ratings assigned by evaluators as a dependent variable
(RATING), and we distinguish between the two typologies for this measure
using a dummy indicator as an independent variable (D_SUB). We also
include specific variables for the characteristics of the evaluation to control
for potential influences on the performance level and on the ratings. The
model is estimated using pooled OLS regression with robust standard errors
clustered by manager. The results are presented in Table 4. We find
evidence of leniency bias because the positive and significant coefficient of
D_SUB (p < 0.01) indicates that the ratings assigned to qualitative
performance measures are, on average, higher than the ratings assigned to
quantitative performance measures. Moreover, performance levels are
significantly (negatively) related to the number of performance measures
and the number of colleagues within the department. When performance is
measured using many targets, the level tends to be lower because the effort
of the worker is less focused and because it is more difficult to achieve all
the requested results. After controlling for these influential variables, our
data provide support for hypothesis 1A.
We use the same model with different dependent variables to
examine whether qualitative ratings are more compressed than quantitative
ratings. A significant difference provides evidence of centrality bias. We
obtain the estimations using pooled OLS regression and a reference group
4 As previously discussed, although qualitative and quantitative targets are used to measure
the performance of different tasks, they are comparable in terms of skill and effort.

-56-
containing the data for each single year for either all of the managers
(RATIO_RAT) or the managers of each department
(RATIO_RAT_BYDPT).
Table 4 – The influence of subjective judgments on performance measures
Indep. var. RATING
(1)
RATIO_RAT
(2)
RATIO_RAT_BYDP
T
(3)
D_SUB 0.31***
(5.69)
-0.03***
(-2.87)
-0.04***
(-5.45)
N_PM -0.04**
(-2.07)
-0.01**
(-2.22)
-0.00
(-1.25)
W_SUM 0.00
(0.58)
-0.00***
(-2.67)
0.00
(1.29)
GENDER -0.11
(-1.60)
-0.00
(-0.16)
0.02*
(1.88)
FIRST_EV -0.12
(-1.62)
0.01
(0.87)
-0.01
(-0.94)
N_COLL -0.07**
(-2.17)
0.00
(0.49)
-0.00
(-0.32)
FIRST_Y 0.07
(1.14)
-0.01
(-0.56)
-0.01
(-1.22)
R2 0.17 0.22 0.13
N of obs. 514 514 514
Notes: ***, **, and * indicate statistical significance at the 1%, 5%, and 10% levels,
respectively (two-tailed); t-statistics are in parentheses.
RATING Qualitative or quantitative performance rating
RATIO_RAT Ratio between individual quantitative (qualitative) rating and
mean rating of the managers‟ quantitative (qualitative) ratings for
each year: Max (rating/mean rating; mean rating/rating)
RATIO_RAT_BYDPT Ratio between individual quantitative (qualitative) rating and
mean rating of the managers‟ quantitative (qualitative) ratings for
each department and year: Max (rating/mean rating; mean
rating/rating)
D_SUB Dummy variable equal to 1 if the observation refers to a
qualitative target and equal to 0 otherwise
N_PM Number of qualitative (quantitative) performance measures
W_SUM Sum of weights assigned to qualitative (quantitative) performance
measures
GENDER Dummy variable equal to 1 if the manager is male and equal to 0
otherwise
FIRST_EV Dummy variable equal to 1 if the rating refers to the first
evaluation of the manager and equal to 0 otherwise
N_COLL Number of colleagues in the department
FIRST_Y Dummy variable equal to 1 if the rating refers to an intermediate
evaluation and equal to 0 otherwise
In the models, a constant term and the indicator variables of department and period of
evaluation are included but not reported.
-57-
In both cases, the results show a negative and significant coefficient
of D_SUB (p < 0.01), confirming that the ratings of qualitative targets are
closer to the mean and thus less dispersed than quantitative targets (Table
4). This finding confirms the tendency of evaluators to avoid differentiation
among managers through subjective judgments on qualitative performance
measures, with consistent behavior both at organizational level and at
departmental level. Therefore, hypothesis 1B is supported.
To answer the question raised by many existing studies concerning
whether evaluation biases are persistent across periods, we remove the
variables related to time from the models and conduct the same analyses for
single years (untabled). The tendency of evaluators to give lenient
performance ratings is strong and significant across years. Even if the yearly
standard deviation of qualitative performance ratings is always lower than
the standard deviation computed for quantitative ratings, regression analysis
does not provide clear evidence of the persistent compression of ratings. We
find significant evidence of centrality bias at the departmental level for four
out of the six years and at organizational level for one year; in all the other
cases, the sign is always negative but not significant.
Time horizon
The biannual evaluation period encourages supervisors to combine
the different purposes of the evaluation, such as administrative and
development, and to balance the fairness and objectivity expected from their
hierarchical positions with managers‟ needs to be stimulated, encouraged,
and rewarded. In order to test whether leniency bias and centrality bias
occur differently in the intermediate and final evaluations we add an
interaction term to the models employed for the tests on the influence of
subjectivity. In particular, we introduce an interaction between the dummy
variable indicating a qualitative or a quantitative target with the dummy
variable indicating whether the evaluation is intermediate or final (D_SUB x
FIRST_Y). Moreover, we restrict the sample by eliminating the subjects
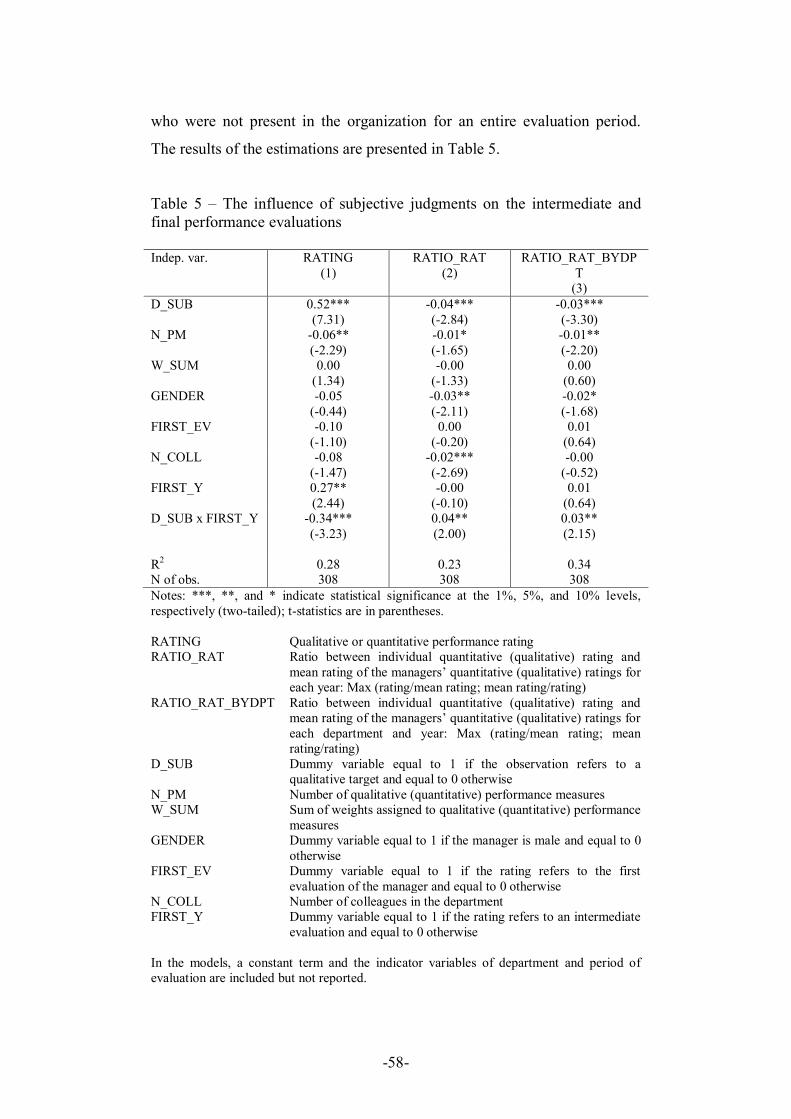
-58-
who were not present in the organization for an entire evaluation period.
The results of the estimations are presented in Table 5.
Table 5 – The influence of subjective judgments on the intermediate and
final performance evaluations
Indep. var. RATING
(1)
RATIO_RAT
(2)
RATIO_RAT_BYDP
T
(3)
D_SUB 0.52***
(7.31)
-0.04***
(-2.84)
-0.03***
(-3.30)
N_PM -0.06**
(-2.29)
-0.01*
(-1.65)
-0.01**
(-2.20)
W_SUM 0.00
(1.34)
-0.00
(-1.33)
0.00
(0.60)
GENDER -0.05
(-0.44)
-0.03**
(-2.11)
-0.02*
(-1.68)
FIRST_EV -0.10
(-1.10)
0.00
(-0.20)
0.01
(0.64)
N_COLL -0.08
(-1.47)
-0.02***
(-2.69)
-0.00
(-0.52)
FIRST_Y 0.27**
(2.44)
-0.00
(-0.10)
0.01
(0.64)
D_SUB x FIRST_Y -0.34***
(-3.23)
0.04**
(2.00)
0.03**
(2.15)
R2 0.28 0.23 0.34
N of obs. 308 308 308
Notes: ***, **, and * indicate statistical significance at the 1%, 5%, and 10% levels,
respectively (two-tailed); t-statistics are in parentheses.
RATING Qualitative or quantitative performance rating
RATIO_RAT Ratio between individual quantitative (qualitative) rating and
mean rating of the managers‟ quantitative (qualitative) ratings for
each year: Max (rating/mean rating; mean rating/rating)
RATIO_RAT_BYDPT Ratio between individual quantitative (qualitative) rating and
mean rating of the managers‟ quantitative (qualitative) ratings for
each department and year: Max (rating/mean rating; mean
rating/rating)
D_SUB Dummy variable equal to 1 if the observation refers to a
qualitative target and equal to 0 otherwise
N_PM Number of qualitative (quantitative) performance measures
W_SUM Sum of weights assigned to qualitative (quantitative) performance
measures
GENDER Dummy variable equal to 1 if the manager is male and equal to 0
otherwise
FIRST_EV Dummy variable equal to 1 if the rating refers to the first
evaluation of the manager and equal to 0 otherwise
N_COLL Number of colleagues in the department
FIRST_Y Dummy variable equal to 1 if the rating refers to an intermediate
evaluation and equal to 0 otherwise
In the models, a constant term and the indicator variables of department and period of
evaluation are included but not reported.

-59-
The coefficients of the first column provide evidence of higher
performance ratings of the qualitative measures compared to the ones of the
quantitative measures both in the intermediate and final evaluations.
The analysis of the interaction term (D_SUB x FIRST_Y, p < 0.01)
shows that the qualitative ratings are also higher in the final evaluations than
the intermediate evaluations denoting different degrees of leniency. The
second and the third column of Table 5 examine the compression of ratings
or more specifically the presence of centrality bias respectively by year
(RATIO_RAT) and by department and year (RATIO_RAT_BYDPT) as
explained in the previous section. The smaller is the ratio used as dependent
variable the closer is the rating to the mean and the higher is the centrality.
The positive and significant coefficient of the interaction term indicates that
the performance ratings are significantly more central in the final
evaluations than in the intermediate evaluations (p < 0.05). The findings of
the regression analyses focused on the intermediate and final evaluations
support the hypotheses 2A and 2B.
Further confirmations are provided with the comparison between
leniency values and the standard deviations of ratings presented in Table 6
and Figure 4. To measure the extent of leniency bias we subtract the
corresponding ratings assigned to qualitative measures from the ratings
assigned to quantitative measures. The average leniency among ratings is
significantly lower in the first year of each evaluation period compared with
the second year of the same period (0.08 vs. 0.45 in the first period, 0.11 vs.
0.40 in the second period, and 0.17 vs. 0.60 in the third period). With an
additional test, we rule out the possible alternative explanation that the trend
is caused by regression to the mean. Even if the value is always positive, the
ratings of the intermediate evaluations are less inflated than the closing
evaluations because intermediate evaluations are more intended to provide
performance feedback than to monetarily incentivize employees. However,
in the closing evaluations, evaluators tend to be more lenient because the
ratings are used to determine the final amount of incentive. According to the
results, hypothesis 2A is confirmed.

-60-
As verified in hypothesis 2A regarding leniency, evaluators‟
assessment behaviors in the first year are different from those in the second
year, when they must differentiate among managers. The ratio of the
standard deviations of qualitative ratings between the first and the second
year, (qual
qual
SD
SD
2
1 ), is always higher than the ratio of the standard deviations of
quantitative ratings, (quant
quant
SD
SD
2
1 ), in all the analyzed periods (1.49 vs. 1.09 in
the first period, 1.40 vs. 0.86 in the second period, 1.53 vs. 1.47 in the third
period). By applying these ratios, we disentangle the two main components
of the variation in managers‟ performances: the variation due to an effective
change in managers‟ performances (quantitative data) and the variation due
to evaluators‟ inflations (qualitative data). This distinction indicates that the
performance ratings of intermediate evaluations are less compressed than
final ratings. The ratios are statistically significant for all three periods.
Thus, hypothesis 2B is supported.

-61-
Table 6 – The effect of the biannual evaluation on leniency bias and centrality bias
Period 1 Period 2 Period 3
2001 2002 2003 2004 2005 2006
Leniency 0.08 0.45 0.11 0.40 0.17 0.60
Mean quantitative 4.00 3.80 4.00 3.82 4.09 3.72
SD quantitative 0.58 0.53 0.49 0.56 0.63 0.43
Mean qualitative 4.08 4.25 4.11 4.21 4.25 4.32
SD qualitative 0.47 0.32 0.34 0.25 0.44 0.29
N of obs. 31 31 21 21 25 25
Period 1 Period 2 Period 3
quant
quant
SD
SD
2
1 1.09 0.86 1.47
qual
qual
SD
SD
2
1 1.49 1.40 1.53
Figure 4 – Changes in leniency bias and centrality bias
0,00
0,10
0,20
0,30
0,40
0,50
0,60
0,70
1st year 2nd year
Len
ien
cy
Period 1 Period 2 Period 3
0,7
0,8
0,9
1
1,1
1,2
1,3
1,4
1,5
1,6
0 1 2 3 4SD
Rat
io
Period
Qualitative Quantitative

-62-
Another potential determinant of bias is the use of discrete
categories for the payment of incentives instead of a proportional payment
system based on achieved performance levels. The use of thresholds
encourages supervisors to select among managers and to control the
achievement of performance levels. In our organization, there are six
incentive categories equally distant from one another in terms of scores. The
lowest category and the highest category are broader because they are
residuals below and above, respectively, a certain level. To check whether
the use of categories influences leniency bias, we compute its average value
below and above a certain distance from the lower boundary. We drop the
observations in the first category because the lower boundary is zero and
because a computation of the distance is not reliable. If we use the median
distance as a cut-off, the mean leniency below this level is significantly
higher than the mean leniency above this level (0.34 vs. 0.18; cut point 14).
If we reduce the cut-off to five, the pattern is confirmed (0.46 vs. 0.19).
Furthermore, as shown in Figure 5, the comparison between intermediate
evaluations and final evaluations, considering the first quartile as a cut-off
point, reveals a nonsignificant difference in leniency in the first case (0.31
vs. 0.15; cut point 9) and a significant difference in the second case (0.46 vs.
0.21; cut point 9). Therefore, hypothesis 3 is supported.
Figure 5 – Levels of leniency within categories with cut-off point 9.
Note: the level of leniency is significantly different only in the final evaluation.
0 9 30 LEN
(final ev.)
LEN
(int. ev.)
0.46 0.21
0.31 0.15
Upper
category
Lower
category

-63-
2.6. Discussion and conclusion
The application of the behavioral perspective to management
accounting studies sheds new light on issues otherwise neglected by
traditional economics studies. A better understanding of the effects of the
choices made during evaluation procedures and the design of incentive
contracts allows better managerial control over performance and reduces the
unexpected and unintended consequences of an inefficient evaluation
system. The involvement of subjective judgments in evaluating long-term
performance has on the one hand a positive impact in focusing the effort of
the subordinates, but on the other hand introduces evaluation biases.
By analyzing six years of performance reports gathered from an
Italian public administration, we first examine how the assignment of
incentives to managers through performance evaluation procedures is
biased. When subjective evaluations are used for incentive purposes, we
confirm findings from the previous literature, which suggest that
performance ratings tend to be more lenient and less dispersed among
managers (Moers, 2005).
Second, the availability of data over a six-year period helps to
improve knowledge about the persistence of evaluation biases over time and
to verify how these biases are influenced by multi-year incentives. By
emphasizing the effect of the time horizon on individual behavior, our
estimations show that evaluators behave consistently across different
periods and maintain subjective ratings that are constantly inflated and more
compressed when compared to objective ratings. In addition, we verify that
evaluations are influenced by the duration of the evaluation period. When
the incentive amount is defined at the end of the second year, the
performance assessed at the intermediate evaluation is less lenient than the
final evaluation. Finally, the categorization of incentives (instead of
proportional payments) is another determinant of leniency. We show that
final performance ratings that surpass the threshold of a category minimally
are more lenient than ratings in the upper part of the category.

-64-
The results of our study have important managerial implications
because of their practical relevance. The time horizon of the evaluation and
the mechanism of incentive payment are key aspects to be considered, not
only in balancing the flexibility of evaluation and the desired performance
accuracy, but also in reducing managerial myopia that emphasizes short-
term performance. Future research can enhance the practical relevance of
studies in this area by focusing more specifically on managerial effort rather
than on evaluator behavior. In addition, the growing complexity of
evaluation systems increasingly requires the adoption of multisource
evaluation systems or 360-degree evaluation. Thus, research on the
combination of multisource systems with the proposed time-horizon
perspective may help improve the accuracy of evaluations and performance
ratings. Finally, future investigations that explore these phenomena beyond
Italian boundaries and that analyze national differences could be useful.
Finally, there are limitations to this work. First, as proposed in recent
literature, we assume that quantitative measures are objectively assessed
without mistakes and biases. Second, despite the advantages of having
complete information about a single organization, its specific operational
contingencies have an effect and direct impact on our results. Specifically,
we are not able to verify the impact of other factors that may influence the
results but that are not identified in this specific context. However, the
examined characteristics are general enough to avoid confounding effects
resulting from organizational peculiarities. Finally, we gathered data from
an organization in the public sector, in contrast to most studies in this area,
which focus on private organizations. In our opinion, as suggested by the
analyses and the relevant literature, the results are not exclusive to the
public sector since we are not using theories or assumptions belonging
specifically to such literature. Moreover, the non-profit objective of the
public administration does not represent a constraint to the generalization of
the proposed conclusions to other contexts and to the private sector.

-65-
References
Baiman, S., Rajan, M.V., (1995). The informational advantage of
discretionary bonus schemes, The Accounting Review, 70, 557-579;
Baker, G.P., Gibbons, R., Murphy, K.J., (1994). Subjective performance
measures in optimal incentive contracts, Quarterly Journal of
Economics, 109(4), 1125-1156;
Bernardin, H.J., Orban, J.A., (1990). Leniency effect as a function of rating
format, purpose for appraisal, and rater individual differences,
Journal of Business and Psychology, 5(2), 197-211;
Bol, J. C., (2011). The determinants and performance effects of managers‟
performance evaluation biases, The Accounting Review, Accepted
Manuscript, doi: 10.2308/accr-10099;
Bonner, S.E., Sprinkle, G.B., (2002). The effects of monetary incentives on
effort and task performance: theories, evidence, and a framework for
research, Accounting, Organizations and Society, 27, 303-345;
Degeorge, F., Patel, J., Zeckhauser, R., (1999). Earnings management to
exceed thresholds, Journal of Business, 72(1), 1-33;
Gibbs, M., Merchant, K. A., Van der Stede, W. A., Vargus, M. E., (2004).
Determinants and effects of subjectivity in incentives, The
Accounting Review, 79(2), 409-436;
Greguras, G.J., Robie, C., Schleicher, D.J., Goff III, M., (2003). A field
study of the effects of rating purpose on the quality of multisource
ratings, Personnel Psychology, 56(1), 1-21;
Guilford, J.P., (1954). Psychometric methods, McGraw-Hill, New York,
NY;
Harris, M.M., Smith, D.E., Champagne, D., (1995). A field study of
performance appraisal purpose: Research- versus administrative-
based ratings, Personnel Psychology, 48(1), 151-160;
Holmström, B. (1979). Moral hazard and observability, Bell Journal of
Economics, 10, 74-91;
Ittner, C. D., Larcker, D. F., Meyer, M. W., (2003). Subjectivity and the
weighting of performance measures: evidence from a balanced
scorecard, The Accounting Review, 78(3), 725-758;
Jawahar, I.M., Williams, C.R., (1997). Where all the children are above
average: The performance appraisal purpose effect, Personnel
Psychology, 50(4), 905- 925;
Kahn, R., Wolfe, D., Quinn, R., Snoek, J., (1964). Organizational stress:
studies in role conflict and ambiguity, John Wiley, New York, NY;

-66-
Kane, J.S., Bernardin, H.J., Villanova, P., Peyrefitte, J., (1995). Stability of
rater leniency: three studies, Academy of Management Journal,
38(4), 1036-1051;
Katz, D., Kahn, R., (1978). The social psychology of organizations (2nd
ed.),
John Wiley, New York, NY;
Laverty, K.J., (1996). Economic “short-termism”: The debate, the
unresolved issues, and the implications for management practice and
research, Academy of Management Review, 21(3), 825-860;
Laverty, K.J., (2004). Managerial myopia or systemic short-termism? The
importance of managerial systems in valuing the long term,
Management Decision, 42(8), 949-962;
Locke, E.A., Latham, G.P., (1990). A theory of goal setting and task
performance, Prentice-Hall, Englewood Cliffs, NJ;
Locke, E.A., Latham, G.P., (2002). Building a practically useful theory of
goal setting and task motivation: a 35-Year Odyssey, American
Psychologist, 57, 705-717;
Marginson, D., McAulay, L., (2008). Exploring the debate on short-
termism: A theoretical and empirical analysis, Strategic
Management Journal, 29(3), 273-292;
McIntyre, R.M., Smith, D.E., Hassett, C.E., (1984). Accuracy of
performance ratings as affected by rater training and perceived
purpose of rating, Journal of Applied Psychology, 69(1), 147-156;
Merchant, K.A., Stringer, C., Theivananthampillai, P., (2010). Relationships
between objective and subjective performance measures, Working
Paper, Department of Accountancy and Business Law, University of
Otago;
Moers, F., (2005). Discretion and bias in performance evaluation: the
impact of diversity and subjectivity, Accounting Organizations and
Society, 30, 67-80;
Murphy, K.R., Cleveland, J.N., (1995). Understanding performance
appraisal. Social, organizational and goal-based perspectives, Sage
Publications, Thousand Oaks, California;
Prendergast, C., Topel, R., (1993). Discretion and bias in performance
evaluation, European Economic Review, 37, 355-365;
Prendergast, C., Topel, R., (1996). Favoritism in organizations, Journal of
Political Economy, 104(5), 958-978;
Rynes, S.L., Gerhart, B., Parks, L., (2005). Personnel psychology:
performance evaluation and pay for performance, Annual Review of
Psychology, 56, 571-600;
Taylor, E.K., Wherry, R.J., (1951). A study of leniency in two rating
systems, Personnel Psychology, 4(1), 39-47;

-67-
Van der Stede, W., (2009). Designing effective reward systems, Finance &
Management, 170, 6-9;
Woods, A., (2009). Subjective adjustments to objective performance
measures, Working Paper, Mason School of Business.

-68-

-69-
Chapter 3
The recognition of the asymmetry:
Sticky costs and cognitive biases
Abstract
This paper investigates whether individuals are accurate in recognizing and
predicting cost stickiness under different presentation formats. In particular,
we conduct an experiment manipulating the degree of cost asymmetry (i.e.
non-sticky, semi-sticky, sticky), which is the cost behavior when revenues
increase or decrease, and the presentation of financial information (i.e.
monetary amounts vs. percentages). Contrary to the expectation, participants
are more likely to recognize and predict accurately sticky costs rather than
non-sticky costs (i.e. cost symmetry). They mentally apply a sticky model
also to predict changes of non-sticky costs. Moreover, the presentation of
variations expressed as percentages allows more accurate forecasts. Further,
a significant interaction effect between the two manipulations is found. The
cognitive ability and the cognitive style of the participants are measured in
order to disentangle possible confounding effects. The findings of this study
suggest that the mental models of the individuals and their cognitive biases
influence cost forecasts and adjustments decisions.
Key words: sticky costs, mental models, lens model, framing, linearity
I thank the seminar participants at the 11
th Manufacturing Accounting Research Conference
in June 2012.
-70-
3.1. Introduction
The diffusion of new management accounting techniques and the
spread of information technology systems like ERP systems increased the
availability of timely and accurate financial reports for managerial decision
making such as cost management choices. The adjustment of resources in
response to changes in sales volume is a primary issue managed in an
organization. Anderson et al. (2003) explicitly investigated the asymmetric
behavior of costs when volume increases or decreases. They call sticky this
kind of costs and propose an alternative model of cost behavior based on
deliberate adjustments by managers. However, several studies provide
evidence that managers prefer to use their subjectivity instead of statistical
computations when a fast and cheap decision process is required (Banker et
al., 2000; Ittner et al., 2003). In addition to the benefits of making
judgments using subjective analysis, issues of accuracy emerge when
individuals mentally represent the relationships among variables. The
cognitive modeling by managers is also influenced by the layout of financial
reports and by the framing of information which are different across
organization (Tversky and Kahneman, 1981; Harvey and Bolger, 1996; Lipe
and Salterio, 2002; Cardinaels and Van Veen-Dirks, 2010). The presentation
of reports with the same information content but different format results in
different decisions. Overall, psychological determinants influence the
cognition of the managers and hence the accuracy of their decision
outcomes.
In this study we examine how variations in the degree of cost
asymmetry (i.e. non-sticky, semi-sticky, sticky) and in the presentation
format of financial information (i.e. monetary amounts or percentages)
influence the accuracy of individual cost predictions. We expect that the
accuracy in recognizing and predicting changes in the level of costs is
higher when they are symmetric rather than sticky. Moreover, we expect
that, with the same information content, the prediction is more accurate
when percentages variations are provided compared to monetary amounts.
We further expect an interaction of the two variables such that an increase in
-71-
accuracy due to the symmetric behavior of costs is more pronounced when
financial information are exhibited as absolute amounts than percentages.
We conduct a laboratory experiment with a 3x2 design mixing a
within-subjects condition with a between-subjects condition. We manipulate
the degree of cost stickiness and the format of the financial information. The
experimental task required the participants to mentally identify the
relationship between revenues and costs and then to predict the trend of
costs accordingly.
This study contributes to the literature in several ways. First, we
extend the literature on cost stickiness by adopting both a different level of
analysis (i.e. individual) and a different methodology (i.e. laboratory
experiment) compared to the majority of the studies. To our knowledge,
only Banker et al. (2011a) considered determinants pertaining to individual
features of the managers such as optimism and pessimism. Second, we show
that the presentation of information with the same content, but presented in
different format, influences the outcome of the decision. These findings add
new knowledge to the literature in behavioral accounting that examines the
impact of information organization and presentation on decision making.
Third, we enlarge the small number of management accounting studies
focused on understanding the cognitive processes underlying judgments and
decision making (Luft and Shields, 2001; Farrell et al., 2007). Further, we
consider also the cognitive ability and the cognitive style of individuals in
order to understand whether specific cognitive features impact subjects‟
mental models.
The findings of this work have important managerial implications.
Companies should consider that an inappropriate preparation of financial
reports leads to biases and inaccurate judgments. Moreover, when timely
decisions are required, various aspects have to be considered both at a
cognitive and at analytical level
The remainder of the paper is organized as follows. Section 3.2
examines the relevant literature and the development of the hypotheses.

-72-
Section 3.3 provides a description of the experimental method and section
3.4 presents the results. Section 3.5 concludes.
3.2. Literature review and hypotheses development
Literature review
During the last decade the topic of cost stickiness gained importance
in the accounting literature. Anderson et al. (2003) proposed an alternative
model of cost behavior in which they contrast the deliberate adjustments of
resources by managers in response to changes in volume with the
mechanistic movement of costs. The earlier results of sticky behavior of
costs were confirmed and extended in the following years by several
studies. However, a recent debate about the appropriateness and
generalizability of the findings appeared in the literature with, on the one
hand, the critical works of Anderson and Lanen (2009) and Balakrishnan et
al. (2011), and on the other hand Banker et al. (2011b) defending the
position of Anderson et al. (2003) and their followers. The focus of the
empirical tests on cost stickiness has been conducted on firm-specific
determinants (Anderson et al., 2003) or on economy-wide forces (Banker
and Chen, 2006). Only recently Banker et al. (2011a) considered
determinants pertaining to individual features of the managers such as
optimism and pessimism. However, they measured the attitude using
financial data, and in particular according to prior period sales. A decline in
sales from the previous period, or the prior two periods, is a proxy for
pessimism, whereas an increasing trend is considered a proxy for optimism.
These findings suggest that the individual behavior and the subjective
judgments have a role in cost adjustments decisions.
More in general, in managerial decision making involving cost
accounting data, the manager has to draw inferences from the available data
in order to make judgments and take actions. Subjective analysis provides a
more timely decision process, but the accuracy of the judgment can differ
depending on the relation underlying the variables. This is due to variations
in the individual mental representation and it results in different outcomes

-73-
across subjects (Banker et al., 2000; Ittner et al., 2003). Studies about
multiple-cue probability learning showed that differences in the form of the
function have an impact upon the achievement by the subjects. In particular,
linear relations are learned better than nonlinear relations and faster when
they are positive compared to negative. The linear portion is also better
captured when the request is to learn an inverted U-shaped relation
compared to a U-shaped relation (Sheets and Miller, 1974; Brehmer et al.,
1974).
Further, the manager has to draw inferences about the relation
starting from accounting data which are normally provided as absolute
numbers. The ability to work with percentages and ratios is required to find
a percent increase or decrease of one number on another and then apply the
percentage to find the result of a percent increase or decrease on a given
number (Guiler, 1946; Parker and Leinhardt, 1995). The difficulties
encountered in computational task, such as processing percentage
information, are other important issues affecting the inference of the
appropriate accounting relation (Chatterjee et al., 2000; Chen and Rao,
2007). Mental techniques used to solve complex arithmetic and the use of
calculation anchors can lead to non-accurate predictions and to failures in
the recognition of the asymmetry between increasing and decreasing
percentages (Venezky and Bregar, 1988; Fuson and Abrahamson, 2005; Nys
and Content, 2010). The cognitive ability of the subjects has to be controlled
in order to disentangle the effects due to different skills from the cognitive
biases. In particular the ability to understand and use numeric information is
called numeracy and its measure has been used in different contexts
(Lusardi, 2008; Reina et al., 2009). Another interesting determinant used in
decision making but not in the accounting field is the decision style adopted
by the individual. A deeper understanding of the way of thinking and of
processing information provides useful indication about the inferences made
about the data. The distinction between individuals with a predominant
intuitive cognitive style, more prone to emphasize feelings and global
perspective, and individuals with a predominant analytical style, more

-74-
focused on mental reasoning and details, leads to different findings about
mental models and prediction accuracy. These two ways of processing
information correspond also to the distinction between System 1 and System
2 introduced by Stanovich and West (2000) and proposed by the dual-
process theory which argue the presence of “two minds in one brain”
(Evans, 2003:458).
Hypotheses development
All the studies on cost stickiness model the relation between
revenues, used as a proxy for the sales volume, and costs as a linear
function. In particular, the slope is higher when the sales volume registers
an increase rather than a decrease. The psychological literature on multiple-
cue probability learning showed that linear relations are learned better than
nonlinear relations (Sheets and Miller, 1974; Brehmer et al., 1974) and that
the estimations are more accurate when positive relations are involved
compared to negative relations (Brehmer, 1971; Slovic, 1974). In our
experiment the condition with symmetric changes in costs is referable to a
perfect linear relation. The exhibition of a degree of asymmetry, firstly low
and then more pronounced, introduces a noise in the linearity. We expect
that the change of slope in the negative domain is not noticed by the
majority of individuals because they derive inferences from the positive
side, which is cognitively more understandable, but constant across
conditions. According to these considerations, we predict that individuals
subjectively recognize and estimate more accurately symmetric changes in
costs rather than sticky variations. Therefore, our first hypothesis is:
HP1: Judgments are more accurate when costs change symmetrically in case
of increase or decrease rather than with a sticky behavior
In addition to the degree of asymmetry, we introduce a change in the
presentation format of the financial information. Financial reports are
expressed both using monetary amounts and percentages. The computation

-75-
of forecasts drawing from absolute monetary amounts requires certain
mental ability and effort. First, the individual has to derive the percentage
change and then apply the result to a given number. However, when
percentages are directly provided, the cognitive load is reduced and the
effort is limited to the understanding of the relation between variables.
According to the different cognitive load requested to individuals, we expect
more accurate judgments when data are showed as percentages rather than
absolute monetary amounts. Accordingly, we hypothesize:
HP2: Judgments are more accurate when data are presented in percentages
rather than monetary amounts
Finally, we expect an interaction between the degree of cost
asymmetry and the presentation format of the financial information. The
recognition of asymmetric changes in costs requires a more careful study of
the whole cues in order to understand the presence of a change of slope
between increases and decreases in revenues and as a consequence in costs,
but also the magnitude of such a change. It is in this condition that the
display of percentages instead of monetary amounts allows to derive more
accurate inferences from the data. However, the gain in accuracy across
different degrees of symmetry, from the lowest to the highest, is higher with
monetary amounts than percentages. These considerations are summarized
in the following hypothesis:
HP3: The presentation of data in percentages rather than monetary amounts
is more beneficial under cost stickiness compared to cost symmetry
3.3. Experimental method
Research design and participants
To test the hypotheses we conducted a laboratory experiment with a
3x2 design mixing a within-subjects treatment with a between-subjects
treatment. The first manipulation, conducted within-subjects, is the degree
of cost asymmetry (i.e. non-sticky, semi-sticky, sticky). The highest degree

-76-
of asymmetry corresponds to the sticky behavior of costs, whereas the non-
sticky case is the one involving symmetric changes. The second
manipulation, conducted between-subjects, is the presentation format (i.e.
monetary amounts vs. percentages).
The experiment was conducted at the Cognitive and Experimental
Economics Laboratory of the University of Trento using the software z-Tree
(Fischbacher, 2007). We ran four separate sessions, two for each between-
subjects treatment. The subjects are 78 undergraduate students who
participated in a voluntary way registering for the experiments in the
laboratory web-site after an e-mail announcement sent to the entire mailing-
list. Four sessions were run and 38 subjects were assigned to the absolute
values conditions (18 + 20) and 40 to the percentages condition (20 + 20).
The age of the participants ranges from 19 to 37, with a mean of 22.76
years. There are 43 males (55.1%) and 35 females (44.9%). Participants
received a show-up fee of 3 euro and a variable pay of maximum 10 euro
computed accordingly to the accuracy of their judgments as explained
below. The average earning is 10.50 Euro. The experiment took, on average,
about one hour and fifteen minutes to be completed.
Setting and task
In the experiment, participants assumed the role of CFO of an
important hotel chain owner of 20 hotels of different dimensions, but
common target of customers. They are instructed that all the hotels are
organized similarly, with the same control system and they strictly follow
the rules and the procedures imposed by the top management of the
controlling company. The story describes an acquisition from a competitor
of other 20 hotels. During 2011, the year of the acquisition, the control
system of the new hotels is replaced with the one adopted by the other
hotels of the group as well as the organizational procedures. At the
beginning of 2012 the whole chain, composed now by 40 hotels, adopts the
same system and the same rules.

-77-
Participants received data about revenues and selling, general and
administrative (SG&A) expenses5 registered in 2011 for the 20 „historical‟
hotels. In the same table figures for both variables are also presented as
forecasts for 2012. The entire table is called in our experiment the learning
dataset (Table 1 and 2). We keep the task as simple as possible explaining
that there is an underlying relationship between changes in revenues and
changes in SG&A costs.
Table 1 – Learning table in the monetary amounts condition with the
„SG&A 2012‟ column different among degrees of cost asymmetry
NONSTICKY SEMISTICKY STICKY
Revenues 2011 Revenues 2012 SG&A 2011 SG&A 2012 SG&A 2012 SG&A 2012
4,458,068 5,111,945 1,324,811 1,497,037 1,497,037 1,497,037
6,044,167 6,803,174 1,809,650 2,008,711 2,008,711 2,008,711
5,995,573 7,370,229 1,647,235 1,976,681 1,976,681 1,976,681
5,709,550 6,263,147 1,621,388 1,751,099 1,751,099 1,751,099
3,858,806 4,652,470 1,215,675 1,422,339 1,422,339 1,422,339
3,141,165 3,764,406 914,017 1,078,539 1,078,539 1,078,539
6,819,873 7,220,775 2,094,389 2,157,221 2,157,221 2,157,221
4,282,893 4,819,702 1,264,976 1,391,474 1,391,474 1,391,474
5,325,361 7,048,718 1,655,942 2,119,605 2,119,605 2,119,605
5,617,829 7,977,260 1,663,003 2,278,314 2,278,314 2,278,314
5,306,875 3,734,729 1,639,897 1,197,125 1,299,303 1,438,637
4,797,335 3,696,246 1,498,805 1,184,056 1,256,691 1,355,738
2,810,185 2,252,841 819,507 680,191 712,340 756,181
2,651,448 2,257,414 751,559 661,372 682,184 710,565
5,142,303 4,467,270 1,547,185 1,376,995 1,416,270 1,469,826
6,272,465 5,315,819 1,912,681 1,664,032 1,721,413 1,799,659
6,536,288 5,767,096 1,906,517 1,715,865 1,759,862 1,819,857
5,908,571 5,636,770 1,751,349 1,698,809 1,710,934 1,727,467
5,270,284 3,667,537 1,533,888 1,135,077 1,227,111 1,352,611
3,394,624 2,572,108 1,059,655 837,128 888,480 958,506
Note: the first ten rows exhibit increasing revenues, whereas the last ten rows exhibit
decreasing revenues.
5 We use SG&A costs to be consistent with the majority of the literature on cost stickiness
(i.e. Anderson et al., 2003).

-78-
Table 2 – Learning table in the percentage condition with the „Δ SG&A‟
column different among degrees of cost asymmetry
NONSTICKY SEMISTICKY STICKY
Δ Revenues Δ SG&A Δ SG&A Δ SG&A
14.7% 13.0% 13.0% 13.0%
12.6% 11.0% 11.0% 11.0%
22.9% 20.0% 20.0% 20.0%
9.7% 8.0% 8.0% 8.0%
20.6% 17.0% 17.0% 17.0%
19.8% 18.0% 18.0% 18.0%
5.9% 3.0% 3.0% 3.0%
12.5% 10.0% 10.0% 10.0%
32.4% 28.0% 28.0% 28.0%
42.0% 37.0% 37.0% 37.0%
-29.6% -27.0% -20.8% -12.3%
-23.0% -21.0% -16.2% -9.5%
-19.8% -17.0% -13.1% -7.7%
-14.9% -12.0% -9.2% -5.5%
-13.1% -11.0% -8.5% -5.0%
-15.3% -13.0% -10.0% -5.9%
-11.8% -10.0% -7.7% -4.5%
-4.6% -3.0% -2.3% -1.4%
-30.4% -26.0% -20.0% -11.8%
-24.2% -21.0% -16.2% -9.5%
After an accurate study of the learning dataset, the participants
received a similar table with financial data referred to the 20 new hotels
acquired. We call this table the judgment dataset (Table 3 and 4). The only
notable difference with the learning table is that the column containing the
costs forecasts for 2012 (or the expected percentage variation in the
percentage condition) is blank. The learning table is always present on the
screen together with the judgment table consistently with the availability of
past data in companies.

-79-
Table 3 – Judgment table in the monetary amounts condition
Revenues 2011 Revenues 2012 SG&A 2011 SG&A 2012
3,602,371 4,053,686 1,095,184
4,461,330 5,166,557 1,274,505
4,799,706 5,798,850 1,448,979
6,088,324 6,437,228 1,788,799
6,215,933 7,285,956 1,830,599
4,647,736 5,067,036 1,366,648
6,974,771 9,014,606 2,043,479
2,616,379 3,046,808 824,792
5,095,946 6,058,950 1,556,334
5,448,454 6,547,880 1,685,546
5,089,234 3,626,536 1,491,644
4,216,785 3,070,688 1,292,395
3,739,614 2,424,073 1,069,309
5,556,302 3,943,205 1,664,435
4,494,544 2,438,825 1,341,145
5,101,892 4,921,011 1,554,345
5,652,328 4,797,321 1,765,266
5,608,013 4,332,177 1,670,867
4,897,049 4,184,675 1,371,066
1,516,740 1,298,528 413,832
Table 4 – Judgment table in the percentage condition
Δ Revenues Δ SG&A
12.5%
15.8%
20.8%
5.7%
17.2%
9.0%
29.2%
16.5%
18.9%
20.2%
-28.7%
-27.2%
-35.2%
-29.0%
-45.7%
-3.5%
-15.1%
-22.8%
-14.5%
-14.4%

-80-
The data used in the learning dataset and in the judgment dataset
were drawn from a normal distribution with a given mean and standard
deviation. In particular, revenues for 2011 were drawn from a normal with
mean 5 millions and standard deviation 1,250,000. Then we generated a set
of percentages with mean 20 and standard deviation 10 to compute realistic
growth or declines for the revenues of 2012 starting from the amounts 2011.
We forced a positive sign on ten values and a negative sign on the other ten
in order to have a balanced dataset and to avoid possible biases. Finally, to
compute realistic costs for 2011 we generated another set of percentages
with mean 30 and standard deviation 1 to be applied to the revenues 2011.
The costs for 2012 in the learning dataset are manipulated manually in order
to obtain the three degrees of asymmetry. In particular the increasing cases
are the same across conditions, whereas the decreasing cases differ because
of a coefficient.
Independent variable
The independent variables in our experiment are the degree of cost
asymmetry and the presentation format. In the experiment the degree of cost
asymmetry is proposed within-subjects. The manipulation is applied
showing to each subject a sequence of three learning datasets followed by
judgment datasets. Each learning dataset differs by the 10 values of SG&A
costs for 2012 decreased from 2011. The story provided to the participants
explains that they have to analyze three different scenarios. The order of the
rows in the tables and the order of the conditions is completely randomized
in order to avoid confounding effects.
The presentation format is manipulated between-subjects. Half
participants receive the tables with monetary amounts for 2011 and 2012,
whereas the other half receives the same values computed as percentage
changes between 2011 and 2012. The information content is constant
because the underlying amounts are the same, but the presentation is
different.

-81-
Procedure
Upon arrival, participants were randomly seated in the laboratory,
each one in front of a computer. They were not able to communicate each
other or to see the screens of other participants. The instructions were
provided on paper and read aloud by one of the researchers present in the
room (see Appendix A1). Moreover, they were not allowed to use
calculators, computer programs, or to take notes during the experiment.
At the beginning participants received clear information about their
compensation. In addition to the show up fee they received a variable cash
payment of maximum 10 euro related to the accuracy of their judgments.
One of the three judgment tables completed by each participant is randomly
extracted for the payment. The computation is made using a quadratic loss
function in which the 20 predictive judgments are compared to the
estimations computed using the OLS model underlying the learning dataset.
The formula is the following:
20
1
2
i
prediction OLS - tparticipan the of prediction coreaccuracy s
The highest is the accuracy score the lowest is the accuracy. The
individual with the highest score receives a variable pay equal to zero and
the other participants receive a payment linearly and inversely related to the
score.
The first screen of the experiment shows a comprehension check
(see Appendix A2). The questions have the purpose to check the correct
comprehension of the instructions and of the task. The participants have to
answer all the questions correctly in order to be able to proceed with the
experiment.
In the central part of the experiment, participants examine the
learning table for few minutes. When they believe that they have mentally
identified the relation between revenues and costs they can move to the
judgment dataset in order to apply the model to the new data. They have to
repeat the same procedure for the three scenarios.

-82-
In the final part of the experiment participants have to answer to a
series of questions in order to capture their cognitive ability and style (see
Appendix A3, A4, and A5). All the participants are informed that the
questions do not count for the compensation. The mathematical ability of
the participants and their cognitive style are measured using instruments
available in the literature. The original scale used to assess numeracy is
composed by three items (Schwartz et al., 1997), but we apply an expanded
scale composed by 11 items (Lipkus et al., 2001). The cognitive style is
measured using an index (CSI) developed by Allinson and Hayes (1996)
and constructed using 38 propositions with three possible answers (true,
uncertain, false). The total rating of the individual identifies the intuitive
(i.e. „right brain‟ thinking) or analytical (i.e. „left brain‟ thinking)
orientation. The instrument has been used in several studies and its validity
has been confirmed (Sadler-Smith, 2000). The distinction between the two
types of cognitive processes is captured also with the last set of questions
based on the Cognitive Reflection Test (CRT) developed by Frederick
(2005).
The experiment is concluded with a demographic questionnaire and
the subsequent cash payment of the compensation (see Appendix A6).
Dependent variables
In this experiment we use a linear regression to model the cognitive
processes of the individuals. The most common model employed for this
purpose is the lens model (Brunswik, 1952). In the management accounting
field this approach has been used to study accounting fixation (Luft and
Shields, 2001), to examine the cognitive effects of the nonlinearities of cost
and profit drivers (Farrell et al., 2007), and also applied to archival data
about investors‟ sophistication (Bonner et al., 2003). The model provides
several statistics used to study how information is processed from cues to
predict outcomes. It is possible to compare the environmental model,
obtained by regressing the actual outcomes on the cues, with the estimations
obtained for the policy-capturing models of each participant, obtained by

-83-
regressing the individual‟s judgments on the information cues (see Figure
1). However, even if the model is widely used, some caution needs to be
used in the interpretation of the results (Castellan, 1992).
Figure 1 – Diagram of the lens model
Source: adapted from Karelaia and Hogarth, 2008, p. 405
The regression model is the one used by Anderson et al. (2003) and
by the majority of the following studies on cost stickiness. The model is the
following:
ti
i,2011
i,2012
i
i,2011
i,2012
i
i
Revenue
RevenueDummy
Revenue
Revenue
COST
COST,210
2011,
2012,logloglog
The stickiness behavior is isolated by the dummy variable, which
takes the value „1‟ when revenues of the current period are decreased from
the previous period and the value „0‟ in the opposite case. The measures

-84-
computed by the lens model are useful to estimate the accuracy of the
participants. The main statistics are: environmental predictability, matching
index, and response linearity. The first measure is not considered in our
setting given that cannot be influenced by the task. The matching index is
the correlation between the predictions obtained with the environmental
model and the participant‟s model. The response linearity (consistency) is a
measure of consistency and it is computed as the correlation between the
individual prediction and the estimation obtained using the policy-capturing
model. The two variables are the main dependent variables of the
experiment. A measure of judgment accuracy is also obtained with the
product of matching and response linearity. According to Farrell et al.
(2007) it is also possible to compute a measure of judgment accuracy at
multi-person level called consensus, which is the degree of similarity among
individual errors. The measure is computed as the correlation between a
participant‟s prediction and the prediction for each of the other participants.
In addition to the dependent variables provided by the lens model we
adopt another measure of judgment accuracy as in Luft and Shields (2001).
The variable, called accuracy, is computed for each participant as the mean
absolute error of the individual‟s predictions. The formula is the following:
20
20
1
i
eipi YY
where:
piY : individual cost prediction for the i hotel
eiY : actual cost for the i hotel
In the presentation format with absolute values the variable accuracy
is computed equivalently both in Euro and percentages in order to facilitate
the comparison with the percentages format.
3.4. Results
The analysis of the manipulation check questions reveals that the
participants in the absolute values condition perceive the task as more

-85-
difficult than the participants in the percentages condition (p-value < 0.05).
Moreover, the provided information is considered complete enough by the
participants in the percentages condition and less complete by the
participants in the absolute values condition (p-value < 0.05). Overall, the
manipulation check is considered satisfactory.
The main hypotheses test is performed using a repeated-measures
ANCOVA with the mean absolute error of the individual‟s predictions (i.e.
accuracy) as dependent variable. The two experimental conditions are the
factors of the model. In particular the presentation format is the between-
subjects factor and the degree of asymmetry is the within-subjects factor.
The interaction between the two conditions is also tested as within-subjects
factor. Four categorical variables are included in the model as covariates:
SEX, YDEGREE, NUMERACY, and CSI. SEX is a dummy variable
indicating the gender of the participant (1 = male; 2 = female), YDEGREE
indicates the academic year of enrolment (from 1 to 5), NUMERACY is the
measure of mathematical ability (1 = high skills, numeracy above 7; 2 = low
skills, numeracy below 7), and CSI is the indicator of cognitive style (1 =
reflective and analytical, CSI above 38; 2 = intuitive, CSI below 38).
Table 5 – Repeated measures ANCOVA with Accuracy as dependent
variable
Variable SS df MS F p-value
(two-tailed)
Covariates
Sex 0.0042 1 0.0042 0.91 0.34
Ydegree 0.0351 4 0.0088 1.88 0.12
Numeracy 0.0209 1 0.0209 4.48 0.04**
CSI 0.0025 1 0.0025 0.53 0.47
Between Subjects
Format 0.5369 1 0.5369 114.90 0.00***
Error 0.3224 69 0.0047
Within Subjects
Asymmetry 0.0415 2 0.0207 7.77 0.00***
Asymmetry x Format 0.0632 2 0.0316 11.84 0.00***
Error 0.4060 152 0.0027
Model: R2 = 0.72, Adjusted R
2 = 0.58
Notes: ***, **, and * indicate statistical significance at the 1%, 5%, and 10% levels,
respectively (two-tailed).

-86-
The results of the ANCOVA, exposed in Table 5, shows that the main
effects of presentation format and degree of asymmetry are significant (F =
114.90, p < 0.01, and F = 7.77, p < 0.01, respectively) as well as the
interaction between the two factors (F = 11.84, p < 0.01).
The comparison of the judgment accuracy in Table 6 specifies better
the findings. In the absolute values condition the accuracy is higher when
the data exhibit a semisticky or sticky behavior compared to the nonsticky
condition (p < 0.01). The difference in accuracy between semisticky and
sticky costs is not significant. In the percentages condition the level of
accuracy is not different across degrees of asymmetry. The result is the
opposite of the expectation of hypothesis 1. The participants denote a
tendency to constantly use a mental model closer to the sticky behavior
instead of a linear model with a constant slope in case of increasing or
decreasing amounts. Despite the contrast with the expectation, the result is
extremely interesting because it confirms the importance of the individual
level of analysis in the studies of cost stickiness.
The second part of Panel A in Table 6 compares the accuracy
measured in the absolute values format with the accuracy in the percentages
format. The mean absolute error is significantly lower in the percentages
format in all the three degrees of asymmetry (p < 0.01). The predictions are
more accurate when the data are presented in percentages rather than
absolute values. The result provides support for hypothesis 2. The largest
benefit of the percentages is in the nonsticky case because the increase of
accuracy is larger than the semisticky and the sticky conditions. The finding
is partially different from hypothesis 3, but it is coherent with the
contrasting results that we have on hypothesis 1. It is confirmed that the
presentation format with percentages, compared to the format with absolute
values, is more beneficial in the condition with the lowest accuracy.
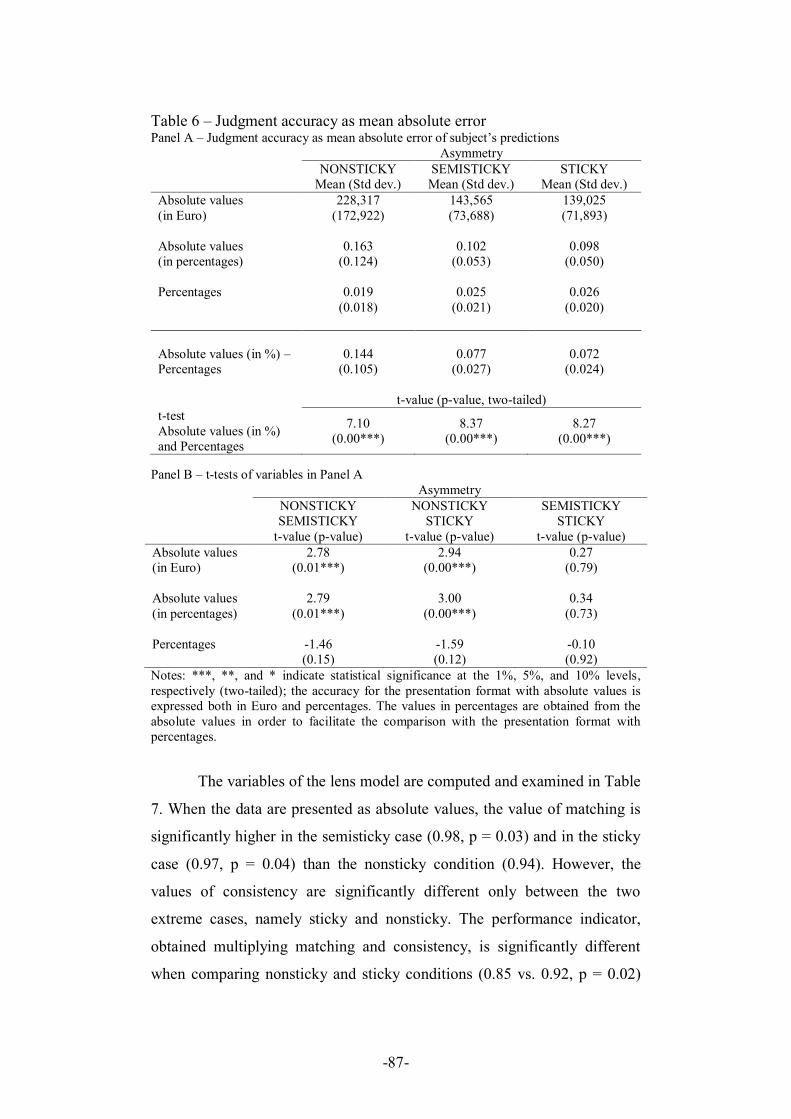
-87-
Table 6 – Judgment accuracy as mean absolute error Panel A – Judgment accuracy as mean absolute error of subject‟s predictions
Asymmetry
NONSTICKY
Mean (Std dev.)
SEMISTICKY
Mean (Std dev.)
STICKY
Mean (Std dev.)
Absolute values
(in Euro)
228,317
(172,922)
143,565
(73,688)
139,025
(71,893)
Absolute values
(in percentages)
0.163
(0.124)
0.102
(0.053)
0.098
(0.050)
Percentages 0.019
(0.018)
0.025
(0.021)
0.026
(0.020)
Absolute values (in %) –
Percentages
0.144
(0.105)
0.077
(0.027)
0.072
(0.024)
t-value (p-value, two-tailed)
t-test
Absolute values (in %)
and Percentages
7.10
(0.00***)
8.37
(0.00***)
8.27
(0.00***)
Panel B – t-tests of variables in Panel A Asymmetry
NONSTICKY
SEMISTICKY
t-value (p-value)
NONSTICKY
STICKY
t-value (p-value)
SEMISTICKY
STICKY
t-value (p-value)
Absolute values
(in Euro)
2.78
(0.01***)
2.94
(0.00***)
0.27
(0.79)
Absolute values
(in percentages)
2.79
(0.01***)
3.00
(0.00***)
0.34
(0.73)
Percentages -1.46
(0.15)
-1.59
(0.12)
-0.10
(0.92)
Notes: ***, **, and * indicate statistical significance at the 1%, 5%, and 10% levels,
respectively (two-tailed); the accuracy for the presentation format with absolute values is
expressed both in Euro and percentages. The values in percentages are obtained from the
absolute values in order to facilitate the comparison with the presentation format with
percentages.
The variables of the lens model are computed and examined in Table
7. When the data are presented as absolute values, the value of matching is
significantly higher in the semisticky case (0.98, p = 0.03) and in the sticky
case (0.97, p = 0.04) than the nonsticky condition (0.94). However, the
values of consistency are significantly different only between the two
extreme cases, namely sticky and nonsticky. The performance indicator,
obtained multiplying matching and consistency, is significantly different
when comparing nonsticky and sticky conditions (0.85 vs. 0.92, p = 0.02)

-88-
and nonsticky and semisticky conditions (0.85 vs. 0.92, p = 0.03). The last
variable, called consensus, compares the judgment errors across
participants. In the sticky condition the variable has the highest value (0.87),
followed by the semisticky condition (0.85), and finally by the nonsticky
condition (0.74). All the differences are significantly different (p < 0.01).
Overall, the results of Panel A and B of Table 7 confirms the previous
findings about judgment accuracy. The sticky behavior is more easily
replicated than the symmetric condition.
Panel C and D of the same table exhibit the same variables computed
in the percentages presentation format. Also in this case, coherently with the
previous findings, we do not find a significant difference of accuracy across
degrees of asymmetry. The value of matching is on average very high (0.99)
as well as the performance indicator (0.96). Significant differences are
registered only by the values of consensus with an average of 0.92. The
comparison between presentation formats confirms the higher accuracy of
percentages on absolute values and the support provided to hypothesis 2.
Moreover, as stated before, the largest improvement of matching and
performance is registered when percentages, compared to absolute values,
are introduced in the nonsticky condition.
Table 7 – Lens model
Panel A - Presentation format: absolute values
Asymmetry
NONSTICKY
Mean (Std dev.)
SEMISTICKY
Mean (Std dev.)
STICKY
Mean (Std dev.)
Total
Matching 0.94
(0.08)
0.98
(0.04)
0.97
(0.03)
0.97
(0.02)
Consistency 0.89
(0.16)
0.94
(0.06)
0.95
(0.08)
0.93
(0.03)
Performance 0.85
(0.18)
0.92
(0.08)
0.92
(0.10)
0.90
(0.04)
Consensus 0.74
(0.22)
0.85
(0.11)
0.87
(0.13)
0.82
(0.07)
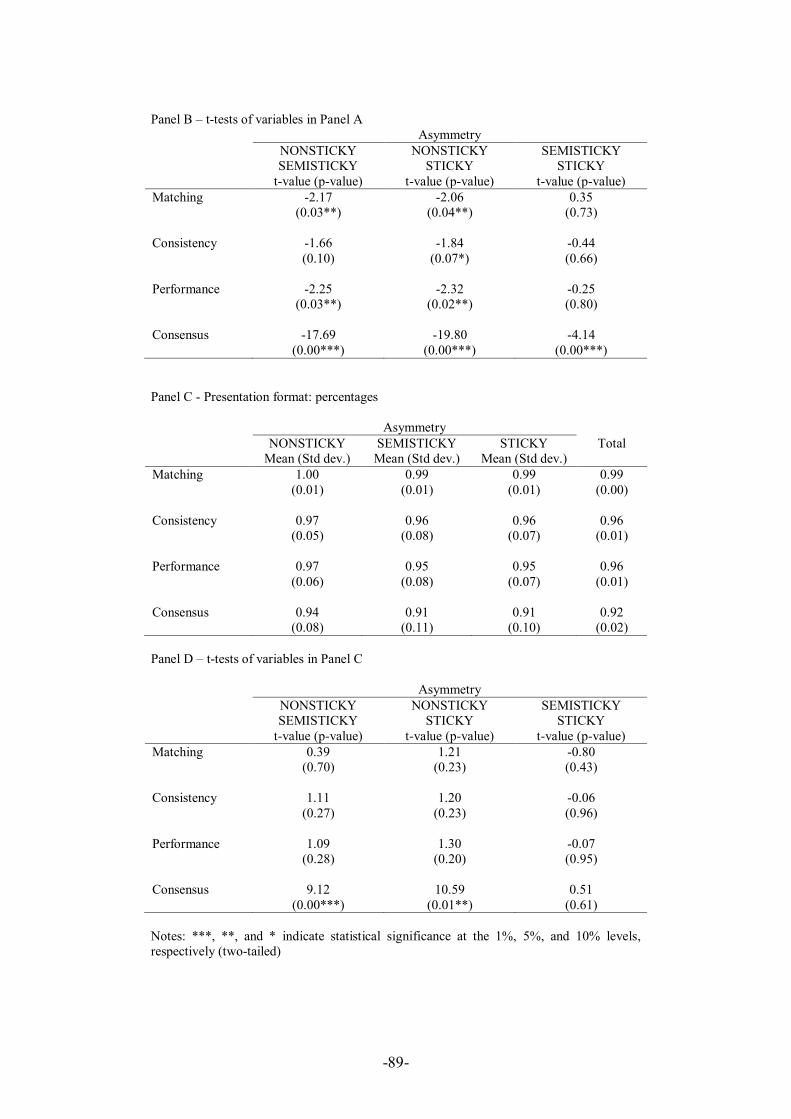
-89-
Panel B – t-tests of variables in Panel A
Asymmetry
NONSTICKY
SEMISTICKY
t-value (p-value)
NONSTICKY
STICKY
t-value (p-value)
SEMISTICKY
STICKY
t-value (p-value)
Matching -2.17
(0.03**)
-2.06
(0.04**)
0.35
(0.73)
Consistency -1.66
(0.10)
-1.84
(0.07*)
-0.44
(0.66)
Performance -2.25
(0.03**)
-2.32
(0.02**)
-0.25
(0.80)
Consensus -17.69
(0.00***)
-19.80
(0.00***)
-4.14
(0.00***)
Panel C - Presentation format: percentages
Asymmetry
NONSTICKY
Mean (Std dev.)
SEMISTICKY
Mean (Std dev.)
STICKY
Mean (Std dev.)
Total
Matching 1.00
(0.01)
0.99
(0.01)
0.99
(0.01)
0.99
(0.00)
Consistency 0.97
(0.05)
0.96
(0.08)
0.96
(0.07)
0.96
(0.01)
Performance 0.97
(0.06)
0.95
(0.08)
0.95
(0.07)
0.96
(0.01)
Consensus 0.94
(0.08)
0.91
(0.11)
0.91
(0.10)
0.92
(0.02)
Panel D – t-tests of variables in Panel C
Asymmetry
NONSTICKY
SEMISTICKY
t-value (p-value)
NONSTICKY
STICKY
t-value (p-value)
SEMISTICKY
STICKY
t-value (p-value)
Matching 0.39
(0.70)
1.21
(0.23)
-0.80
(0.43)
Consistency 1.11
(0.27)
1.20
(0.23)
-0.06
(0.96)
Performance 1.09
(0.28)
1.30
(0.20)
-0.07
(0.95)
Consensus 9.12
(0.00***)
10.59
(0.01**)
0.51
(0.61)
Notes: ***, **, and * indicate statistical significance at the 1%, 5%, and 10% levels,
respectively (two-tailed)

-90-
The lens model considers the cues as a set and it correlates the
overall predictions made by the individual with the theoretical predictions
provided by the environmental model. However, the lack of focus on the
specific weights assigned to the cues does not allow the understanding of
where the errors occur. Table 8 compares the coefficients in the individual
policy-capturing models with the corresponding coefficients in the
environmental model.
Table 8 – Comparison of coefficients between individuals‟ policy-capturing
models and environmental model
Presentation format
Absolute
values
Mean (Std
dev.)
Percentages
Mean (Std dev.)
t-value
(p-value)
NONSTICKY
ep 00 -0.08
(0.16)
0.00
(0.03)
-3.00
(0.00***)
ep 11 0.55
(1.42)
-0.04
(0.28)
2.50
(0.02**)
ep 22 -0.87
(1.68)
0.03
(0.35)
-3.21
(0.00***)
SEMISTICKY
ep 00 -0.05
(0.13)
0.01
(0.03)
-2.76
(0.01***)
ep 11 0.27
(0.87)
-0.10
(0.23)
2.56
(0.01**)
ep 22 -0.28
(1.05)
0.17
(0.32)
-2.50
(0.2**)
STICKY
ep 00 -0.07
(0.16)
0.00
(0.03)
-2.58
(0.01**)
ep 11 0.27
(0.88)
-0.08
(0.19)
2.41
(0.02**)
ep 22 -0.20
(1.22)
0.14
(0.34)
-1.69
(0.10*)
Notes: ***, **, and * indicate statistical significance at the 1%, 5%, and 10% levels,
respectively (two-tailed); ep 00 is the difference between the coefficients of the
individual policy-capturing models and the corresponding coefficient in the environmental
model (and similarly for ep 11 and ep 22 ).
Coefficients in the environmental models:
NONSTICKY: 0 = -0.00; 1 = 0.89; 2 = -0.04
SEMISTICKY: 0 = -0.00; 1 = 0.90; 2 = -0.28
STICKY: 0 = -0.01; 1 = 0.91; 2 = -0.57

-91-
Recall that in the model of cost behavior 0 is the intercept,
1 captures the increase of revenues, and 2 is the coefficient associated to
the dummy valorized with 1 when revenues decrease. Compared to
percentages, the error in the nonsticky condition when data are presented as
absolute values is significantly higher in all the coefficients. Although in the
semisticky and sticky conditions the largest deviations from the coefficients
of the environmental models are computed in the absolute values condition,
there is a tendency to overstate the values of 1 when absolute values are
provided and to understate the same coefficient in the case of percentages.
The accuracy of 2 is higher with percentages and in the absolute values
condition it emphasizes the level of cost stickiness both in the semisticky
and sticky degree of asymmetry.
A graphical comparison between individual models and
environmental models is provided in Figure 2. The graphs are plotted using
the average coefficients of the participants‟ mental models and are
compared with the theoretical model that the subjects should have learned
observing the learning dataset. In order to draw the graphs, the data of the
judgment dataset are applied to the models. The graphical comparison
confirms visually the statistical findings.

-92-
Figure 2 – Policy-capturing models and environmental model across degrees of asymmetry and
presentation formats
Policy-capturing model (average) Environmental model

-93-
3.5. Discussion and conclusion
The literature on cost stickiness rarely considered in the analyses the
individual level as possible source of determinants. However, the individual
decision making affects the prediction of costs and the adjustments choices.
For this reason, the behavioral features of the subjects and their
relationships with the cost decisions have to be investigated. The use of
subjectivity introduces cognitive biases that influence the accuracy of the
decision outcomes. Our experiment confirms that the presentation format of
the information influences decision making as proved by many studies in
the literature, but suggests also that the ability to predict the trend of costs is
different depending on the degree of asymmetry. More in detail, we prove
that cost predictions are more accurate when data are expressed in
percentages rather than absolute values. The provision of percentages,
compared to absolute values, is more beneficial when the cost behavior is
symmetric rather sticky. Moreover, when data are presented as absolute
values, the subjects mentally adopt a sticky model of cost prediction
independently on the learning dataset. The tendency to inflate the increases
of costs and to reduce the magnitude of the decreases in any condition is an
important behavioral feature and confirms the contribution of our study to
the literature on cost stickiness. The impact of the cognitive issues should be
analyzed further by future studies.
The adoption of an experimental methodology is subject to
limitations in the generalization of the findings. In addition, a certain level
of mathematical ability, such as working with percentages and proportions,
is required for our task. In order to isolate the cognitive biases, we attempted
to reduce the possible confounding effect of the different mathematical
preparation of the individuals controlling for this particular skill. Another
limitation is associated with the use of a within-subjects manipulation. To
reduce the potential issues for each participant we randomized the order of
the experimental conditions.
Future research should address further the issue of individual
decision making focusing on how individuals mentally model the

-94-
information presented in the reports and on how they draw their choices.
The increasing need of timely decisions does not guarantee the support of
complete and detailed reports, inducing the use of subjective analysis.
However, the biases associated to subjectivity lead to distorted and
inaccurate decisions. A deeper knowledge of these issues would help to
prevent and control their emergence.

-95-
References
Allinson, C.W., Hayes, J., (1996). The Cognitive Style Index: A measure of
intuition-analysis for organizational research, Journal of
Management Studies, 33(1), 119-135;
Anderson, M. C., Banker, R. D., Janakiraman, S. N., (2003). Are selling,
general, and administrative costs “sticky”?, Journal of Accounting
Research, 41(1), 47-63;
Anderson, S. W., Lanen, W. N., (2009). Understanding cost management:
What can we learn from the evidence on “sticky costs”?, Working
Paper, University of Michigan;
Balakrishnan, R., Labro, E., Soderstrom, N. S., (2011). Cost structure and
sticky costs, Working Paper, The University of Iowa;
Banker, R.D., Potter, G., Srinavasan, D., (2000). An empirical investigation
of an incentive plan that includes nonfinancial performance
measures, The Accounting Review, 75(1), 65-92;
Banker, R.D., Byzalov, D., Plehn-Dujowich, J.M., (2011b). Sticky cost
behavior: Theory and evidence, Working Paper, Temple University;
Banker, R. D., Chen, L., (2006a). Labor market characteristics and cross-
country differences in cost stickiness, Working Paper, Temple
University:
Banker, R. D., Ciftci, M., Mashruwala, R., (2011a). Managerial optimism,
prior period sales changes, and sticky cost behavior, Working Paper,
University of Illinois at Chicago;
Bonner, S.E., Walther, B.R., Young, S.M., (2003). Sophistication-related
differences in investors‟ models of the relative accuracy of analysts‟
forecast revisions, The Accounting Review, 78(3), 679-706;
Brehmer, B., (1971). Subjects‟ ability to use functional rules, Psychonomic
Science, 24(6), 259-260;
Brehmer, B., Kuylenstierna, J., Liljergren, J., (1974). Effects of function
form and cue validity on the subjects‟ hypotheses in probabilistic
inference tasks, Organizational Behavior and Human Performance,
11(3), 338-354;
Brunswik, E., (1952). The conceptual framework of psychology, The
University of Chicago Press, Chicago;
Cardinaels, E., Van Veen-Dirks, P.M.G., (2010). Financial versus non-
financial information: The impact of information organization and
presentation in a Balanced Scorecard, Accounting, Organizations
and Society, 35(6), 565-578;
Castellan, N.J., (1992). Relations between linear models: Implications for
the lens model, Organizational Behavior and Human Decision
Processes, 51, 364-381;

-96-
Chatterjee, S., Heath, T.B., Milberg, S.J., France, K.R., (2000). The
differential processing of price in gains and losses: The effects of
frame and need for cognition, Journal of Behavioral Decision
Making, 13, 61-75;
Chen, H.A., Rao, A.R., (2007). When two plus two is not equal to four:
Errors in processing multiple percentage changes, Journal of
Consumer Research, 34, 327-340;
Evans, J.S.B.T., (2003). In two minds: Dual-process accounts of reasoning,
Trends in Cognitive Sciences, 7(10), 454-459;
Farrell, A.M., Luft, J., Shields, M.D., (2007). Accuracy in judging the
nonlinear effects of cost and profit drivers, Contemporary
Accounting Research, 24(4), 1139-1169;
Fischbacher, U., (2007). z-Tree: Zurich Toolbox for Ready-made Economic
Experiments, Experimental Economics, 10(2), 171-178;
Frederick, S., (2005). Cognitive reflection and decision making, Journal of
Economic Perspectives, 19(4), 25-42;
Fuson, K.C., Abrahamson, D., (2005). Understanding ratio and proportion
as an example of the apprehending zone and conceptual-phase
problem-solving models, in J. Campbell (Ed.), Handbook of
Mathematical Cognition, 213-234, Psychology Press, New York;
Guiler, W.S., (1946). Difficulties encountered in percentage by college
freshmen, Journal of Educational Research, 40(2), 81-95;
Harvey, N., Bolger, F., (1996). Graphs versus tables: Effects of data
presentation format on judgemental forecasting, International Journal
of Forecasting, 12(1), 119-137;
Ittner, C., Larcker, D., Meyer, M., (2003). Subjectivity and the weighting of
performance measures: Evidence from a balanced scorecard, The
Accounting Review, 78(3), 725-758;
Karelaia, N., Hogarth, R.M., (2008). Determinants of linear judgment: A
meta analysis of lens model studies, Psychological Bulletin, 134(3),
404-426;
Lipe, M.G., Salterio, S., (2002). A note on the judgmental effects of the
Balanced Scorecard‟s information organization, Accounting,
Organizations and Society, 27(6), 531-540;
Lipkus, I.M., Samsa, G., Rimer, B.K., (2001). General performance on a
numeracy scale among highly educated samples, Medical Decision
Making, 21(1), 37-44;
Luft, J.L., Shields, M.D., (2001). Why does fixation persist? Experimental
evidence on the judgment performance effects of expensing
intangibles, The Accounting Review, 76(4), 561-587;
Lusardi, A., (2008). Financial literacy: An essential tool for informed
consumer choice?, Working Paper, Dartmouth College;

-97-
Nys, J., Content, A., (2010). Complex mental arithmetic: The contribution
of the number sense, Canandian Journal of Experimental
Psychology, 64(3), 215-220;
Parker, M., Leinhardt, G., (1995). Percent: A privileged proportion, Review
of Educational Research, 65(4), 421-481;
Reyna, V.F., Nelson, W., Han, P., Dieckmann, N.F., (2009). How numeracy
influences risk comprehension and medical decision making,
Psychological Bulletin, 135, 943-973;
Sadler-Smith, E., Spicer, D.P., Tsang, F., (2000). Validity of the Cognitive
Style Index: Replication and extension, British Journal of
Management, 11, 175-181;
Schwartz, L.M., Woloshin, S., Black, W.C., Welch, H.G., (1997). The role
of numeracy in understanding the benefit of screening
mammography, Annals of Internal Medicine, 127(11), 966-972;
Sheets, C.A., Miller, M.J., (1974). The effect of cue-criterion function form
on multiple-cue probability learning, The American Journal of
Psychology, 87(4), 629-641;
Slovic, P., (1974). Hypothesis testing in the learning of positive and
negative linear functions, Organizational Behavior and Human
Performance, 11(3), 368-376;
Stanovich, K.E., West, R.F., (2000). Individual differences in reasoning:
Implications for the rationality debate, Behavioral and Brain
Sciences, 23, 645-726;
Tversky, A., Kahneman, D., (1981). The framing of decisions and the
psychology of choice, Science, 211(4481), 453-458;
Venezky, R.L., Bregar, W.S., (1988). Different levels of ability in solving
mathematical word problems, Journal of Mathematical Behavior,
7(2), 11-34.

-98-
APPENDIX – Research instrument
A1 – Instructions
Note: { } indicates the absolute values condition; [ ] indicates the
percentages condition
Welcome, you are participating to an economic experiment during which
you will assume the role of Chief Financial Officer (CFO) of an important
hotel chain. Please, read carefully the following instructions. Thank you in
advance for you collaboration.
The business case
You company controls 20 hotels of different sizes but all oriented towards
medium-high level customers. All the hotels are organized similarly, they
share the same control system and they have to comply with the rules and
procedure indicated by the top management.
During 2011, after important decisions of geographical expansion, the
owner of the hotel chain decided to acquire 20 additional hotels belonging
to a competitor. During the same year the organizational and control system
is completely reviewed in order to align it with the system already
implemented by the other hotels of the chain. At the beginning of 2012 all
the 40 hotels of the chain adopt the same procedure and the same
management control system. Your task is to predict the {expenditure
levels} [percentage changes] with reference to the selling, general and
administrative (SG&A) expenses of the 20 new hotels based on the
predictions made for the 20 hotels already part of the chain and on the
expected trend of the revenues.
Procedure
Attention! Please, bear in mind that during the experiment you cannot go
back to the previous screens.
In each screen you will find on the upper-right part of the monitor the
maximum time allowed to fill the requested data. At the expiration of the
time a warning message will blink. If you are still filling the data, you have
to hurry up in order to finish the screen. At the end of each screen you can
proceed with the experiment by clicking the button “Next”. Anyway, you
will have to wait that all your colleagues have pressed “Next” to see the
next screen.
Initial part At the beginning of the experiment you will have to answer to a series of
questions with the purpose of verifying the correct comprehension of the
business case (time allowed 3 minutes). You cannot proceed to the next
phases before answering correctly to all the questions.
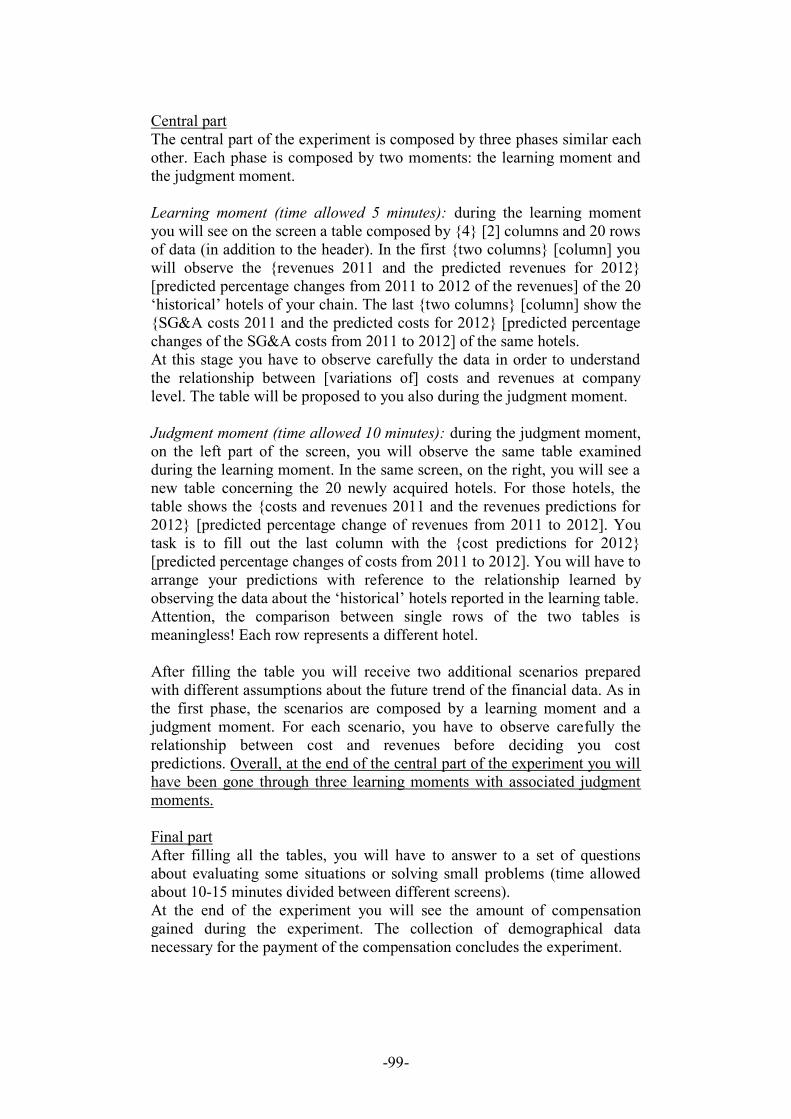
-99-
Central part
The central part of the experiment is composed by three phases similar each
other. Each phase is composed by two moments: the learning moment and
the judgment moment.
Learning moment (time allowed 5 minutes): during the learning moment
you will see on the screen a table composed by {4} [2] columns and 20 rows
of data (in addition to the header). In the first {two columns} [column] you
will observe the {revenues 2011 and the predicted revenues for 2012}
[predicted percentage changes from 2011 to 2012 of the revenues] of the 20
„historical‟ hotels of your chain. The last {two columns} [column] show the
{SG&A costs 2011 and the predicted costs for 2012} [predicted percentage
changes of the SG&A costs from 2011 to 2012] of the same hotels.
At this stage you have to observe carefully the data in order to understand
the relationship between [variations of] costs and revenues at company
level. The table will be proposed to you also during the judgment moment.
Judgment moment (time allowed 10 minutes): during the judgment moment,
on the left part of the screen, you will observe the same table examined
during the learning moment. In the same screen, on the right, you will see a
new table concerning the 20 newly acquired hotels. For those hotels, the
table shows the {costs and revenues 2011 and the revenues predictions for
2012} [predicted percentage change of revenues from 2011 to 2012]. You
task is to fill out the last column with the {cost predictions for 2012}
[predicted percentage changes of costs from 2011 to 2012]. You will have to
arrange your predictions with reference to the relationship learned by
observing the data about the „historical‟ hotels reported in the learning table.
Attention, the comparison between single rows of the two tables is
meaningless! Each row represents a different hotel.
After filling the table you will receive two additional scenarios prepared
with different assumptions about the future trend of the financial data. As in
the first phase, the scenarios are composed by a learning moment and a
judgment moment. For each scenario, you have to observe carefully the
relationship between cost and revenues before deciding you cost
predictions. Overall, at the end of the central part of the experiment you will
have been gone through three learning moments with associated judgment
moments.
Final part
After filling all the tables, you will have to answer to a set of questions
about evaluating some situations or solving small problems (time allowed
about 10-15 minutes divided between different screens).
At the end of the experiment you will see the amount of compensation
gained during the experiment. The collection of demographical data
necessary for the payment of the compensation concludes the experiment.

-100-
Compensation
You will receive 3.00 € as show-up fee. In addition, you will receive a
variable sum computed during the experiment on the basis of your inputs.
In particular, the computation will be executed by the software drawing
randomly one of the three tables that you filled out and then comparing your
inputs with the statistical values. The lower will be the difference between
your values and the statistical values, the higher will be your compensation.
The variable payment ranges from a minimum of 0 to a maximum of 10.00
€.
Please, consider that the answers to the questions proposed in the final part
of the experiment do not count for the compensation computation.

-101-
A2 – Comprehension check
Note: { } indicates the answer in the absolute values condition; [ ] indicates
the answer in the percentages condition
1. For how many hotels do you have to predict the level of expenses for the
year 2012? {[20]}
2. Is there a relationship between expected revenues and expected costs?
{[YES]}
3. What is the input requested by the case? Expenditure levels or changes
in expenditure levels? {Expenditure levels} [Changes in expenditure
levels]
4. Your task is to predict the revenues of 2012. {[NO]}
A3 – Cognitive Reflection Test (Frederick, 2005)
1. A bat and a ball cost 1.10 € in total. The bat costs 1.00 more than the
ball. How much does the ball cost? X cents
2. If it takes 5 machines 5 minutes to make 5 widgets, how long would it
take 100 machines to make 100 widgets? X minutes
3. In a lake there is a patch of lily pads. Every day, the patch doubles in
size. If it takes 48 days for the patch to cover the entire lake, how long
would it take for the patch to cover half of the lake? X days
A4 – Numeracy (Schwartz et al., 1997; Lipkus et al., 2001)
1. Imagine that we flip a fair coin 1,000 times. What is your best guess
about how many times do you think the coin would come up heads in
1,000 flips? X times out of 1,000
2. In the lottery WIN ALL, the chance of winning a 10 € prize is 1%. What
is your best guess about how many people would win a 10 € prize if
1,000 people each buy a single ticket to WIN ALL? X person(s) out of
1,000
3. In the contest AT FULL THROTTLE, the chance of winning a car is 1
in 1,000. What percent of tickets to AT FULL THROTTLE win a car? X
%
4. Which of the following numbers represents the biggest risk of getting a
disease? 1 in 100; 1 in 1,000; 1 in 10
5. Which of the following numbers represents the biggest risk of getting a
disease? 1%; 10%; 5%
6. If Person A‟s risk of getting a disease is 1% in ten years, and person B‟s
risk is double that of A‟s, what is B‟s risk? X %
7. If Person A‟s risk of getting a disease is 1 in 100 in ten years, and person B‟s risk is double that of A‟s, what is B‟s risk? X out of 100
8. If the chance of getting a disease is 10%, how many people would be
expected to get the disease? X out of 100
9. If the chance of getting a disease is 10%, how many people would be
expected to get the disease? X out of 1,000

-102-
10. If the chance of getting a disease is 10 out of 100, this would be the
same as having a X % chance of getting the disease. X %
11. The chance of getting a viral infection is 0.0005. Out of 10,000 people,
about how many of them are expected to get infected? X people

-103-
A5 – Cognitive Style Index (Allinson and Hayes, 1996)
True False Uncertain
1. In my experience, rational thought is
the only realistic basis for making
decisions
2 0 1
2. To solve a problem, I have to study
each part of it in detail 2 0 1
3. I am most effective when my work
involves a clear sequence of tasks to
be performed
2 0 1
4. I have difficulty working with people
who „dive in at the deep end‟ without
considering the finer aspects of the
problem
2 0 1
5. I am careful to follow rules and
regulations at work 2 0 1
6. I avoid taking a course of action if the
odds are against its success 2 0 1
7. I am inclined to scan through reports
rather than read them in detail 0 2 1
8. My understanding of a problem tends
to come more from through analysis
than flashes of insight
2 0 1
9. I try to keep to a regular routine in my
work 2 0 1
10. The kind of work I like best is that
which requires a logical, step-by-step
approach
2 0 1
11. I rarely make „off the top of the head‟
decisions 2 0 1
12. I prefer chaotic action to orderly
inaction
13. Given enough time, I would consider
every situation from all angles 2 0 1
14. To be successful in my work, I find
that it is important to avoid hurting
other people‟s feelings
2 0 1
15. The best way for me to understand a
problem is to break it down into its
constituent parts
2 0 1
16. I find that to adopt a careful, analytical
approach to making decisions takes
too long
0 2 1
17. I make most progress when I take 0 2 1

-104-
calculated risk
18. I find that it is possible to be
organized when performing certain
kinds of task
0 2 1
19. I always pay attention to detail before
I reach a conclusion 2 0 1
20. I make many of my decisions on the
basis of intuition 0 2 1
21. My philosophy is that it is better to be
safe than risk being sorry 2 0 1
22. When making a decision, I take my
time and thoroughly consider all the
relevant factors
2 0 1
23. I get on best with quiet, thoughtful
people 2 0 1
24. I would rather that my life was
unpredictable than that it followed a
regular pattern
0 2 1
25. Most people regard me as a logical
thinker 2 0 1
26. To fully understand the facts I need a
good theory 2 0 1
27. I work best with people who are
spontaneous 0 2 1
28. I find detailed, methodical work
satisfying 2 0 1
29. My approach to solving a problem is
to focus on one part at a time 2 0 1
30. I am constantly on the lookout for new
experiences 0 2 1
31. In meetings, I have more to say than
most 0 2 1
32. My „gut feeling‟ is just as good a basis
for decision making as careful analysis 0 2 1
33. I am the kind of person who casts
caution to the wind 0 2 1
34. I make decisions and get on with
things rather than analyze every last
detail
0 2 1
35. I am always prepared to take a gamble 0 2 1
36. Formal plans are more of a hindrance
than a help in my work 0 2 1
37. I am more at home with ideas rather
than facts and figures 0 2 1

-105-
38. I find that „too much analysis results
in paralysis 0 2 1
A6 – Final questionnaire
Have you ever attended one of the courses that deal with the behavior and types of costs (i.e. management accounting and control)?
Have you ever heard about sticky costs?
Did you notice a different behavior of costs in the three proposed
scenarios?
Please, indicate your level of agreement with the three following statements (1 = completely disagree, 5 = completely agree):
a) In cases of reduction and growth, costs would change with different
proportions
b) The exercise was difficult because of complex mathematical
computations
c) The provided data were sufficient to satisfy the requests. I would not
have need of other information (i.e. absolute values, percentages, …)
Gender (male/female)
Year of birth
Are you enrolled to a bachelor or to a master degree?
Year of degree program
Months of relevant working experience (internship included). Please indicate 0 in case of no working experience

-106-
-107-
Chapter 4
The influence of accountability and
scorecard framing on strategy evaluation
Abstract
This paper investigates how the representation of a balanced scorecard with
or without causal chain and the introduction of process or outcome
accountability influence the weights assigned to performance measures in
evaluating a strategic investment. We conduct an experiment where
participants have to choose how much they want to invest on a strategic
initiative by observing balanced scorecard data. In contrast with our
expectation, the results show that the causal chain representation is not
sufficient to divert the focus of the manager from the financial perspective.
A more balanced evaluation is obtained by holding managers process
accountable. Further, we provide evidence that framing a balanced
scorecard as a causal chain stimulates more analytical information
processing when managers are process accountable rather than outcome
accountable. In sum, we suggest that a company has to combine consistently
the format of the balanced scorecard and the type of accountability to avoid
biased evaluations.
Key words: balanced scorecard, causal chain, strategy evaluation, process
accountability, outcome accountability
I thank Paolo Perego and Marcel van Rinsum for the long discussions and for their helpful
comments.

-108-

-109-
4.1. Introduction
Strategic performance measurement systems are frequently adopted
by companies to align managerial actions with strategy (Atkinson et al.,
1997; Bento and Ferreira White, 2010). These systems include several tools
and models, but one of the most popular is the balanced scorecard
developed by Kaplan and Norton (1992). The introduction of strategy maps
and cause-and-effect relationships increased the emphasis on the strategy-
evaluation purpose of the balanced scorecard (Kaplan and Norton, 2001;
Webb, 2004; Atkinson, 2006; Campbell, 2008). Management accounting
studies started to focus on the behavioral issues associated to the individual
examination of the scorecard measures. The organization and presentation
of performance measures, the involvement in scorecard implementation and
the introduction of accountability are examples of factors that have an
impact on managerial judgment and decision making. In particular these
factors alter the cognitive processes of the managers and the emergence of
evaluation biases (Lipe and Salterio, 2002; Libby et al., 2004; Cardinaels
and Van Veen-Dirks, 2010; Tayler, 2010; Humphreys and Trotman, 2011).
In this study we improve the literature by investigating how the
adoption of a specific type of accountability and the representation of the
balanced scorecard with or without cause-and-effect relationships impact a
decision on a strategic investment. We conduct a laboratory experiment with
a 2x2 between-subjects design manipulating the balanced scorecard framing
and the type of accountability. According to both management accounting
and psychological literature, we predict that a balanced scorecard framed as
a causal chain leads to more balanced strategy evaluations than a similar
scorecard without strategic linkages. Improved evaluations are also obtained
by holding managers accountable for their decisions. In this experiment we
differentiate between process and outcome accountability and we expect
more analytical mental models and more balanced evaluations by process
accountable subjects. Finally, we argue that the optimal information
processing is the result of the combination of accountability for the decision

-110-
process together with the representation of the balanced scorecard measures
with causal links.
Our study makes the following contributions. First, prior studies on
the use of a balanced scorecard framed as a causal chain for strategy
evaluation purposes examined the validation of the linkages and the impact
of the cause-and-effect relationships on performance and strategy evaluation
(Ittner and Larcker, 2003; Cheng and Humphreys, 2012). Differently from
the approach followed by Tayler (2010) and by Cheng and Humphreys
(2010), we add further evidence about the contribution of the balanced
scorecard framing to the evaluation of a strategic investment. In particular,
by proposing a range of hypothesized capital investment levels with
different consequences on the set of performance measures, we draw
considerations about the assignment of weights to the scorecard indicators
and on how a strategy is evaluated. Second, to our knowledge, this is the
first study that investigates the effect of both process and outcome
accountability on decision making in a managerial accounting setting.
Although previous studies in the psychological field provided evidence that
judgment quality depends on the type of accountability (Siegel-Jacobs and
Yates, 1996), the management accounting literature examined the
influence of either process or outcome accountability without making a
direct comparison between the two (Libby et al., 2004; Chong et al., 2010).
In addition, despite the importance of accountability in companies and in
managerial settings, few studies consider accountability as an empirical
variable. Third, we extend the stream of management accounting studies
that examine the cognitive processes involved in decision making (Luft and
Shields, 2001; Farrell et al., 2007). The addition to the balanced scorecard
of a causal model and the accountability pressure are factors that induce an
alteration in the information processing. A modification of the individual
mental model leads to changes in how the analysis of the available cues is
performed and results in a different evaluation outcome.
The findings of our study have significant managerial implications.
The literature already proved the relevance of information framing, also

-111-
with reference to the balanced scorecard, for managerial decision making
(Schkade and Kleinmuntz, 1994; Lipe and Salterio, 2002; Cardinaels and
Van Veen-Dirks, 2010). With this investigation we suggest that companies,
in addition to the attention placed on how information is presented, have to
ask to managers to justify their decisions. Performance measures are more
carefully weighted and strategy decisions significantly debiased when the
performance reports are accurately prepared and an adequate emphasis is
placed on accountability. It is proved that a wrong approach in examining
the consequences of a strategy implementation leads to a biased behavior of
the manager and to detrimental effects for the company.
The paper is organized as follows. Section 4.2 reviews the relevant
literature and develops the hypotheses. Section 4.3 describes the design and
the procedure of the experimental task and Section 4.4 reports the results.
Section 4.5 concludes.
4.2. Literature review and hypotheses development
The balanced scorecard and the causal chain
The balanced scorecard is a diffused performance measurement tool
that links non-financial performance measures to the financial ones across
four dimensions: learning and growth, internal business processes,
customer, and finance (Kaplan and Norton, 1992). In particular, the
implementation of non-financial objectives leads to more informative
indications about the future financial performance compared to the only use
of financial measures (Banker et al, 2000). Kaplan and Norton (2000, 2004)
improved the balanced scorecard linking the strategic processes of the
organization to the drivers of firm performance through a cause-and-effect
chain (Malina and Selto, 2001). The development of strategy maps provides
a visual representation of the causal chain that connects the objectives of a
company‟s strategy after the formulation and before its execution (Kaplan
and Norton, 2004).
Several studies in the management accounting literature investigated
the balanced scorecard framed as a causal chain or as a strategy map.

-112-
Despite the benefits of measuring non-financial measures, a link with the
financial outcomes is still missing in many organizations. A validation of
the causal links has to follow the development of the linkages in order to
prove the influence of the non-financial indicators on the financial results
(Ittner and Larcker, 2003). However, a strong climate of control driven by
perceived legitimacy and fairness of the performance measurement models
overwhelms the validity of the cause-and-effect connections (Malina et al.,
2007). In addition, the results of Huelsbeck et al. (2011) provide evidence of
a weak support to the causal relationships underlying the hypothesized
business model of a successful company. As a consequence, even in absence
of validation, top management reacted maintaining a high confidence on
their business model.
In contrast to the studies providing evidence of scant translation of
strategies in strategy maps, a recent stream of literature focuses on the
improvements in strategy evaluation and managerial decision making when
a balanced scorecard framed as causal chain is adopted. An explicit
representation of the causal linkages among strategic objectives by using a
strategy map improves the managerial ability to recognize the strategic
relevance and the appropriateness of external information and overall the
strategy evaluation judgments provided by the managers (Cheng and
Humphreys, 2012). Moreover, the assessment of the strategic contribution
and the willingness to approve a capital investment is also different when
strategic objectives are presented with or without causal chain. In particular,
when the causal chain is not represented, the provision of proximally
inconsistent information about the investment proposal is more emphasized
than distally inconsistent information suggesting a different interpretation of
the data and a different perception of the strategic contribution of the
investment (Cheng and Humphreys, 2010). A supplement of information
displayed in the form of a strategy map in addition to a narrative strategy
description is also used by Banker et al. (2011) to prove that managers‟
improve their ability to effectively use the balanced scorecard. In particular,
due to the assignment of greater weights to measures linked to strategy, the

-113-
quality of performance evaluation decisions is higher when the cause-and-
effect relations are provided.
The assignment of different weights to performance measures related
to strategy is the result of different types of information processing by
individuals. The development of mental models, which are cognitive
representations used by individuals to support understanding, reasoning,
prediction, and decision making, is influenced by the way in which the
information is represented. Causal mental models are based on long-term
knowledge or theories (Markman and Gentner, 2001) and allow the
reduction of the cognitive complexity of the performance evaluation and of
the strategy. According to Ahn et al. (1995) individuals tend to search for
causal information and they infer causal relationships even when specific
links are not provided. An easier cognitive processing, obtained by
providing strategy information and the strategic links between performance
measures, contributes to the elimination of the common measure bias
(Humphreys and Trotman, 2011). The causal chain framing of the balanced
scorecard reduces also the psychological effect of motivated reasoning and
improve strategy evaluation, but only when managers are involved in the
selection of the performance measures (Tayler, 2010). A cognitive
demanding problem of budget allocation proposed to accountants by Vera-
Muñoz et al. (2007) is better interpreted when causal information is
provided. The causal linkages are used to assess the cause-and-effect
covariation information implied in the benchmark data. Further, when the
causal model does not support the underlying theory, the effect on the
accountants‟ judgments is not detrimental. The study of Vera-Muñoz et al.
(2007) is extended from a single-period setting to a managerial multiple-
period setting by Kelly (2010). The results suggest that the quality of the
decision is higher when relative weights on measures are provided
compared to a condition with no weights. The interesting finding is that
even the presence of inaccurate weights in the causal model is beneficial
compared to the absence of weights. Booker et al. (2011) tested how the
perceived usefulness of non-financial performance measures changes

-114-
depending on the strength of causal knowledge. A weak causal knowledge,
such as the direction of the relationship, increases the perceived predictive
content of the non-financial measure compared to providing no causal
knowledge. However, a strong causal knowledge, such as providing the full
causal story underlying the relationship, does not increase the benefit
compared to the condition with weak knowledge.
Drawing from the theories about causal linkages we explore the
accountability literature in order to understand how individuals react and
adapt their behavior when they are being accountable of their decisions.
Process and outcome accountability
Accountability is defined as “the implicit or explicit expectation than
one be called to justify one‟s beliefs, feelings, and actions to others”
(Tetlock, 1992:331). An explicit justification reduces the impact of
information-processing biases and improves the accuracy and the
consistency of judgments (Ashton, 1992). The selection of decision
strategies is also influenced by personal accountability. A more analytical
strategy, such as spending more time and effort to make a decision, is
adopted by individuals required to defend their choice in a group discussion
compared to non-accountable subjects (McAllister et al., 1979). Lerner and
Tetlock (1999) provide an extensive review of the impact of accountability
on social judgments and choices. In particular, they analyze the effects of
the various kinds of accountability and the conditions that have to exist in
order to influence the cognitive biases. Moreover, Lerner and Tetlock
(1999) suggest specific methodological strategies to understand whether
accountability actually alter cognitive processes, such as how people
perceive, encode, and retrieve information, or just the willingness to say
what the individual think. Accountability impacts how stimulus information
is encoded and processed by reducing primacy effect and eliminating
overattribution effect (Tetlock, 1983a; Tetlock, 1985) and in front of an
individual with unknown view leads to a more complex information
processing (Tetlock, 1983b). Further, accountability has a debiasing effect

-115-
reducing the susceptibility to decision errors, such as the sunk cost effect
(Simonson and Nye, 1992; Fennema and Perkins, 2008), and deterring self-
enhancement (Sedikides et al., 2002).
In this study we differentiate between two types of accountability:
process and outcome accountability. Process accountable individuals are
required to justify the process followed to take a decision and they are
evaluated, independently from the outcome, on the quality of the
explanation. Outcome accountable individuals are instead evaluated on the
quality of their decision (outcome) and not on the decision process (Lerner
and Tetlock, 1999). Few empirical works compared process and outcome
accountability in judgment and decision making settings. The effect of both
kinds of accountability on the selection and on the evaluation of the
available information is investigated by Siegel-Jacobs and Yates (1996).
Process accountability is found to have positive effects on judgment
consistency, decision quality, and it suggests more complex information
processing (Chaiken, 1980; McAllister et al., 1979; Siegel-Jacobs and
Yates, 1996). The commitment to a losing course of action is reduced by
being process accountable. More specifically, it is the kind of
accountability, more than its degree, that contributes to the de-escalation of
the commitment (Simonson and Staw, 1992). In addition to the type of
accountability, Zhank and Mittal (2005) examine also how a different
degree of accountability moderates the perceived decision difficulty
between alternative framed relative to a reference point. The results show
that the effect of process accountability varies with the degree and with the
attractiveness of the option. In contrast, the perceived decision difficulty is
always enhanced in the outcome accountability condition. De Dreu et al.
(2006) induce epistemic motivation by varying the presence or absence of
process accountability in order to test a model of information-processing in
negotiation. The willingness to achieve a richer understanding of the world
through a more systematic processing of information obtained by process
accountability is also examined in group settings (Scholten et al., 2007;
Bechtoldt et al., 2010).

-116-
Prior studies argued that process accountability positively influences
the decision making quality and the cognitive processes compared to
outcome accountability. However, this conclusion is questioned by De
Langhe et al. (2011) through three multiple-cue judgment studies. They
demonstrate that the improvement in judgment quality guaranteed by
process accountability is consistent only in simple elemental tasks and it is
not generalizable to more complex configural tasks. The explanation relies
on the different impact of process and outcome accountability on the
cognitive processes that are used to make judgments, such as cue abstraction
and exemplar-based processing.
In the management accounting literature the issue of accountability
is not largely studied. Libby et al. (2004) examine the effect of assurance
and process accountability on performance evaluation judgments. In their
experiment they present a balanced scorecard with common and unique
performance measures in order to prove that the required justification of the
evaluation increases the use of unique measure with a consequent reduction
of common measure bias. Another managerial bias such as the alteration of
the budgetary figures, the so called budgetary slack, is controlled and
mitigated introducing outcome accountability pressure (Chong et al., 2010).
Hypotheses development
Strategy evaluation and managerial decision making are issues that
are influenced by the adoption of balanced scorecards framed as causal
chains. As proved by several works in the literature, the cause-and-effect
linkages among performance measures enhance the interpretation of the
information provided by the balanced scorecard and have a significant
debiasing effect on the cognitive processes involved in decision making
leading to an improved assessment of the strategy (Tayler, 2010;
Humphreys and Trotman, 2011). Therefore, a reduced complexity in
evaluating the mental model implies a more focused selection and a
different weighting of the cues represented by the performance measures
(Markman and Gentner, 2001). According to the majority of the findings,

-117-
we expect that the explicitation of the causal linkages in a balanced
scorecard improves the quality of the strategy evaluation compared to the
absence of the causal chain. Thus, we formulate the following hypothesis:
H1: Managers receiving a balanced scorecard framed as a causal chain
provide a more balanced strategy evaluation than managers receiving the
same balanced scorecard without causal chain.
Many studies conducted mainly in the psychological field
investigated the effect of accountability on individual judgments. As
explored by the works on the causal chain, even the justification of the
choices requested to decision makers alters the cognitive processes of the
individuals (Libby et al., 2004). Accountability has a positive effect on
judgment and choices, but differences emerge by distinguishing between
kinds of accountability. In particular, process accountability, compared to
outcome accountability, enhances both judgment consistency and decision
quality. The more complex information processing stimulated by being
accountable for the process followed to take a decision results in a more
accurate analysis of the available cues and a debiased evaluation. However,
the adoption of a balanced scorecard with its four categories of measures
has an influence on how the information is mentally processed. Even if the
balanced scorecard is design to reduce the weights assigned to financial
measures and to increase the importance of non-financial measures, several
studies showed that there is a strong bias towards the financial indicators
(Frederickson et al., 1999; Ittner et al., 2003; DeBusk et al., 2003; Rich,
2007). The same tendency is also noted by Cardinaels and Van Veen-Dirks
(2010) when the performance measures are presented to the evaluators as a
balanced scorecard compared to an unformatted scorecard. According to
these considerations, when the evaluator is not required to justify the
process followed to reach a decision, as in the outcome accountability
condition, there is a tendency to simplify the mental process placing greater
weights on the financial outcomes and disregarding the non-financial cues.

-118-
In our experiment we argue that process accountability forces individuals to
consider the whole set of measures including the non-financial targets.
Thus, a more balanced evaluation is obtained when process accountability is
adopted instead of outcome accountability. Formally, we hypothesize the
following statement:
H2: Managers who are process accountable for their decision provide a
more balanced strategy evaluation than managers who are outcome
accountable for their decision.
In addition to the individual contribution of balanced scorecard
framing and type of accountability on the quality of the strategy decision
process, we extend the investigation to the interaction of the two variables.
The visual representation of the causal chain simplifies the cognitive
processes of the individuals reducing the analysis of the information to a
limited set of cause-and-effect linkages. However, the exclusion from the
mental model of the performance measures not affected by the strategy is
more beneficial when the subject is process accountable. A broad analysis
of the available cues is performed only when an analytical explanation of
the choice is required ex-post, whereas the simple justification of the
outcome emphasizes the financial perspective in any case, both with and
without chain. According to these considerations, we expect to find greater
improvement of the strategy decision when the causal chain is provided to
process accountable individuals compared to subjects in the outcome
accountability condition. Therefore, our hypothesis is the following:
H3: Managers receiving a balanced scorecard framed as a causal chain
provide a more balanced strategy evaluation if they are process accountable
rather than outcome accountable.

-119-
4.3. Experimental method
Research design and participants
To test the hypothesis we conducted a paper-and-pencil experiment
with a 2x2 between-subjects design. As independent variables we
manipulated the framing of the balanced scorecard and the type of
accountability. The balanced scorecard framing is manipulated at two levels,
either with or without causal chain. Participants in the traditional scorecard
framing condition (no chain - NC) received a description of the business
case and a visual representation of balanced scorecard with references to the
four categories of performance measures, and participants in the causal
chain framing condition (chain - CC) received a more extensive description
in which the cause-and-effect linkages between performance categories is
emphasized and a figure representing a balanced scorecard with arrows
connecting the four boxes6. The second independent variable, type of
accountability, is manipulated differentiating between process and outcome
accountability. All the participants were informed that they would be
evaluated after the experiment. For this purpose, in order to create an
accountability setting, they filled and signed an informed consent form. In
addition, outcome accountable (OA) participants received instructions
specifying that their evaluation would be based only on the closeness to the
optimal strategic investment and hence on the accuracy of their decision.
Participants in the process accountable (PA) condition were informed that
their evaluation would be based on the quality of the justification provided
to support their decision and not on the accuracy of the choice. The
instructions report that a descriptive explanation of the mental reasoning
followed by each individual is evaluated ex-post by a team of researchers
and that some participants would be randomly chosen for a brief interview
at the end of the experiment. A similar approach is adopted by De Langhe et
al. (2011). In order to avoid problems related to deception, we performed all
the tasks exposed in the instructions.
6 This approach of manipulating the balanced scorecard framing is also applied by Tayler
(2010) in his study about motivated reasoning.
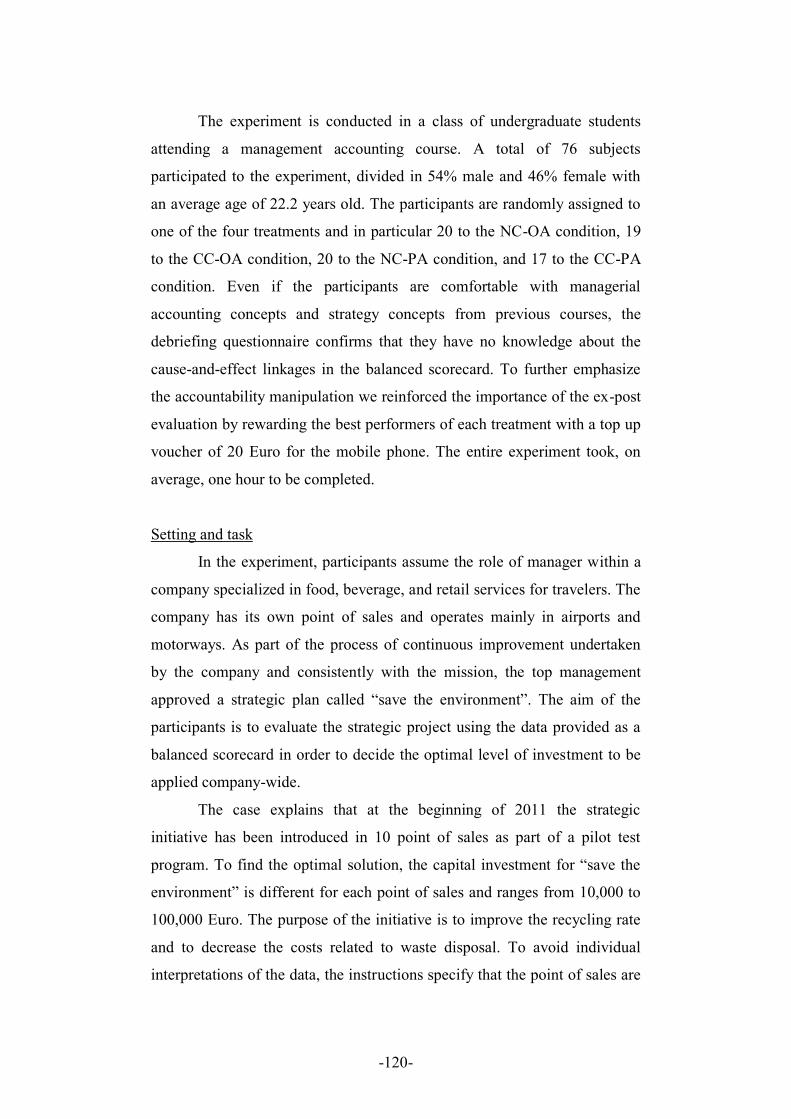
-120-
The experiment is conducted in a class of undergraduate students
attending a management accounting course. A total of 76 subjects
participated to the experiment, divided in 54% male and 46% female with
an average age of 22.2 years old. The participants are randomly assigned to
one of the four treatments and in particular 20 to the NC-OA condition, 19
to the CC-OA condition, 20 to the NC-PA condition, and 17 to the CC-PA
condition. Even if the participants are comfortable with managerial
accounting concepts and strategy concepts from previous courses, the
debriefing questionnaire confirms that they have no knowledge about the
cause-and-effect linkages in the balanced scorecard. To further emphasize
the accountability manipulation we reinforced the importance of the ex-post
evaluation by rewarding the best performers of each treatment with a top up
voucher of 20 Euro for the mobile phone. The entire experiment took, on
average, one hour to be completed.
Setting and task
In the experiment, participants assume the role of manager within a
company specialized in food, beverage, and retail services for travelers. The
company has its own point of sales and operates mainly in airports and
motorways. As part of the process of continuous improvement undertaken
by the company and consistently with the mission, the top management
approved a strategic plan called “save the environment”. The aim of the
participants is to evaluate the strategic project using the data provided as a
balanced scorecard in order to decide the optimal level of investment to be
applied company-wide.
The case explains that at the beginning of 2011 the strategic
initiative has been introduced in 10 point of sales as part of a pilot test
program. To find the optimal solution, the capital investment for “save the
environment” is different for each point of sales and ranges from 10,000 to
100,000 Euro. The purpose of the initiative is to improve the recycling rate
and to decrease the costs related to waste disposal. To avoid individual
interpretations of the data, the instructions specify that the point of sales are
-121-
similar and comparable each other and the results of the strategy would be
immediately noticeable by comparing the performance 2011 with the
performance registered in the previous year. Moreover, the proportion
between fixed and variable costs is constant.
The balanced scorecard provided to the participants contains data
about four performance indicators, one for each category. The data
presented for each point of sales include the performance values for the
years 2010 and 2011 together with the results 2011 expressed as percentage
of the results 2010. Coherently with the works of Tayler (2010) and Luft et
al. (2011), the number of performance measures is limited and the overall
design of the balanced scorecard is kept simple in order to avoid problems
of information overload and to reduce the cognitive complexity.
Procedure
After a brief introduction, each participant receives a big envelope
containing the experimental materials and an informed consent form to be
completed and signed before proceeding. The common instructions and the
background information about the case study are provided on paper and also
read aloud to the entire class (see Appendix A1). Then, the subjects are
instructed to open the first small envelope with the description of the
balanced scorecard, the graphical representation, and the explanation
regarding the performance evaluation and the reward (see Appendix A2).
Figure 1 shows the description and the figure of the balanced scorecard
provided to the participants in the no-chain condition (Panel A) or in the
causal chain condition (Panel B). The content of the first envelope is
different depending on the experimental condition. At this stage only a
careful analysis of the materials is requested to the participants.

-122-
Figure 1 – Balanced scorecard framing
Panel A – Traditional scorecard framing (no chain)
The balanced scorecard in HighwayGrill
HighwayGrill adopts a balanced scorecard to measure the performance of its point of sales.
The success of a company‟s strategy depends on multiple factors. The balanced scorecard
allows the examination of multiple financial and non-financial determinants related to four
categories: learning and growth, internal processes, customer, financial. The balanced
scorecard is not only a measurement tool, but it underlines also the criticalities where to
focus the attention in order to improve the success of the strategies.
Please, examine carefully the balanced scorecard representation shown in the figure below.
The balanced scorecard of HighwayGrill is composed by the four categories previously
mentioned, each one associated to a measure used to evaluate the performance. The
strategic initiative that you have to evaluate is indicated on a separate box.
Financial
perspective
Measure:
operating income
Customer
perspective
Measure:
customer
satisfaction score
Strategic
initiative
“Save the
environment”
Internal
processes
perspective
Measure:
recycling rate
Learning and
growth
perspective
Measure: training
rate
Description of the performance measures:
- operating income: difference between sales revenue and cost of sales
- customer satisfaction score: average score from the customer satisfaction survey
- recycling rate: percentage of packages made with recycled or recyclable materials
- training rate: percentage of employees who have attended a training course
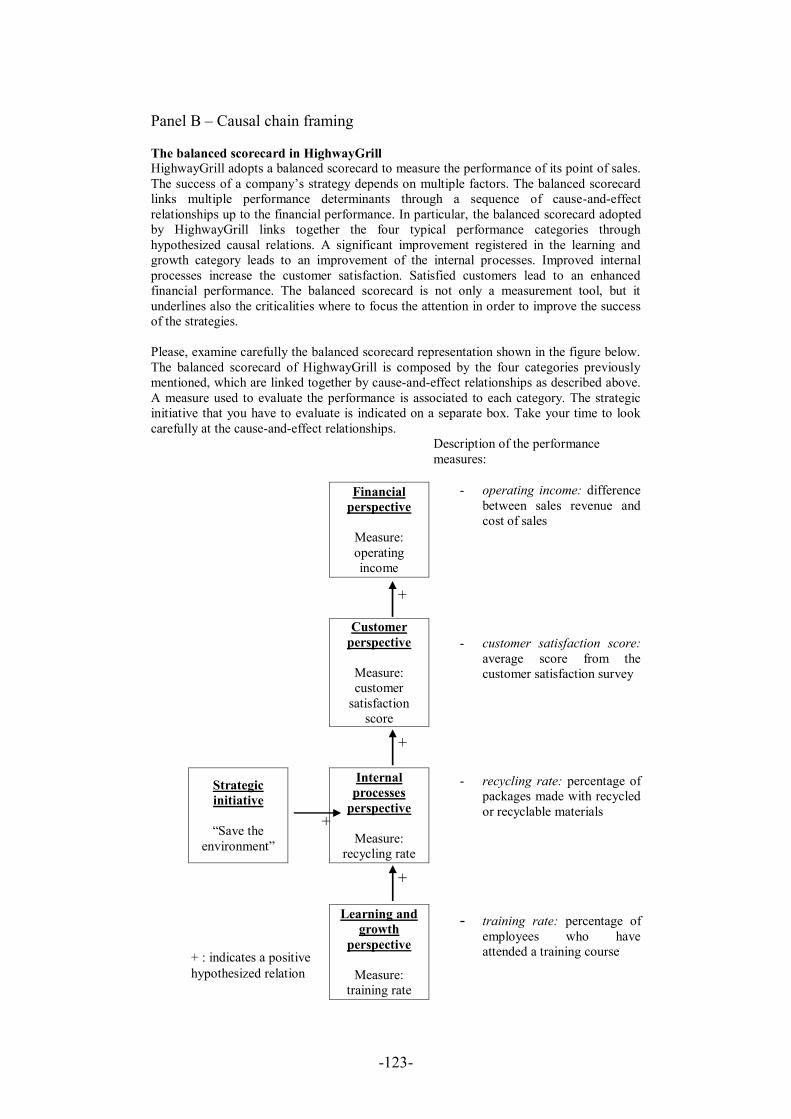
-123-
Panel B – Causal chain framing
The balanced scorecard in HighwayGrill
HighwayGrill adopts a balanced scorecard to measure the performance of its point of sales.
The success of a company‟s strategy depends on multiple factors. The balanced scorecard
links multiple performance determinants through a sequence of cause-and-effect
relationships up to the financial performance. In particular, the balanced scorecard adopted
by HighwayGrill links together the four typical performance categories through
hypothesized causal relations. A significant improvement registered in the learning and
growth category leads to an improvement of the internal processes. Improved internal
processes increase the customer satisfaction. Satisfied customers lead to an enhanced
financial performance. The balanced scorecard is not only a measurement tool, but it
underlines also the criticalities where to focus the attention in order to improve the success
of the strategies.
Please, examine carefully the balanced scorecard representation shown in the figure below.
The balanced scorecard of HighwayGrill is composed by the four categories previously
mentioned, which are linked together by cause-and-effect relationships as described above.
A measure used to evaluate the performance is associated to each category. The strategic
initiative that you have to evaluate is indicated on a separate box. Take your time to look
carefully at the cause-and-effect relationships.
Description of the performance
measures:
Financial
perspective
Measure:
operating
income
- operating income: difference
between sales revenue and
cost of sales
- customer satisfaction score:
average score from the
customer satisfaction survey
- recycling rate: percentage of
packages made with recycled
or recyclable materials
- training rate: percentage of
employees who have
attended a training course
Customer
perspective
Measure:
customer
satisfaction
score
Strategic
initiative
“Save the
environment”
Internal
processes
perspective
Measure:
recycling rate
Learning and
growth
perspective
Measure:
training rate
+
+
+
+
+ : indicates a positive
hypothesized relation

-124-
When subjects are familiar with the materials contained in the first
envelope they proceed by opening the second envelope containing the
balanced scorecard data (Figure 2). To obtain comparable results and to
avoid confounding effects, the scorecard is the same across conditions. The
performance data show that the implementation of the strategy leads to a
significant improvement of the recycling rate (t = 2.98, p-value < 0.05), a
greater customer satisfaction (t = 11.81, p-value < 0.001), and a growth of
the operating income (t = 3.32, p-value < 0.01). The training rate is not
influenced by the initiative. However, only the operating income increases
with the investment level, whereas the customer satisfaction grows almost
constantly and the recycling rate changes with a curvilinear trend. After the
examination of the balanced scorecard data, participants have to indicate the
level of investment, within a range of 0-100,000 Euro, that they believe
optimal to extend the strategic initiative to the other point of sales. In
addition, subjects in the process accountability condition have to write on a
separate sheet of paper the justification of their choice.
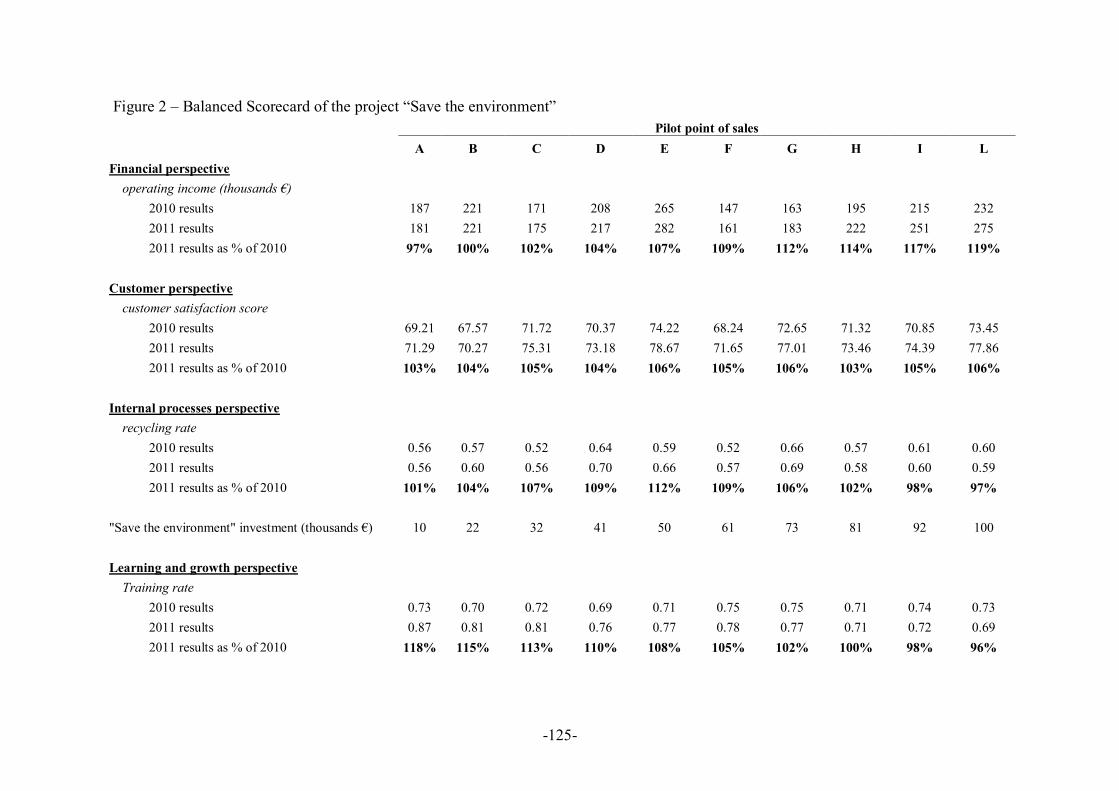
-125-
Figure 2 – Balanced Scorecard of the project “Save the environment”
Pilot point of sales
A B C D E F G H I L
Financial perspective
operating income (thousands €)
2010 results 187 221 171 208 265 147 163 195 215 232
2011 results 181 221 175 217 282 161 183 222 251 275
2011 results as % of 2010 97% 100% 102% 104% 107% 109% 112% 114% 117% 119%
Customer perspective
customer satisfaction score
2010 results 69.21 67.57 71.72 70.37 74.22 68.24 72.65 71.32 70.85 73.45
2011 results 71.29 70.27 75.31 73.18 78.67 71.65 77.01 73.46 74.39 77.86
2011 results as % of 2010 103% 104% 105% 104% 106% 105% 106% 103% 105% 106%
Internal processes perspective
recycling rate
2010 results 0.56 0.57 0.52 0.64 0.59 0.52 0.66 0.57 0.61 0.60
2011 results 0.56 0.60 0.56 0.70 0.66 0.57 0.69 0.58 0.60 0.59
2011 results as % of 2010 101% 104% 107% 109% 112% 109% 106% 102% 98% 97%
"Save the environment" investment (thousands €) 10 22 32 41 50 61 73 81 92 100
Learning and growth perspective
Training rate
2010 results 0.73 0.70 0.72 0.69 0.71 0.75 0.75 0.71 0.74 0.73
2011 results 0.87 0.81 0.81 0.76 0.77 0.78 0.77 0.71 0.72 0.69
2011 results as % of 2010 118% 115% 113% 110% 108% 105% 102% 100% 98% 96%

-126-
The quality of the strategy evaluation is the dependent variable and
its computation is based on the investment decisions of the participants. As
a proxy for decision quality we measure the absolute deviation from the
optimal investment level. Larger scores correspond to worst decisions. The
optimum is the investment that maximizes all the performance measures
influenced by the strategy. In our dataset, 61,000 Euro is the capital amount
that leads to the most „balanced‟ performance. The formula used to compute
the dependent variable is the following:
*II evaluation strategy ofquality s
where:
Is: participant‟s investment decision
I*: optimal investment
Finally, the last envelope with the debriefing and demographic
questionnaire is opened after sealing all the other envelopes (see Appendix
A3). Individual interviews to a random sample of process accountable
subjects conclude the experiment.
4.4. Results
We begin by examining the answers to the manipulation check
questions provided to the participants to understand the effectiveness of the
experimental treatments. On a statement saying that the individual
performance evaluation would be based on the accuracy of the investment
decision and not on the explanation of the choice, outcome accountable
subjects indicate a significantly higher level of agreement relative to process
accountable individuals (3.77 vs. 2.27 on a scale from 1 to 5, p < 0.001).
Further, participants in the causal chain condition recognize the presence of
cause-and-effect relationships between the four performance categories
compared to participants with a balanced scorecard without strategic
linkages (4.11 vs. 2.75, p < 0.001). In addition, the graphical representation
of the balanced scorecard is also judged more helpful for the analysis when
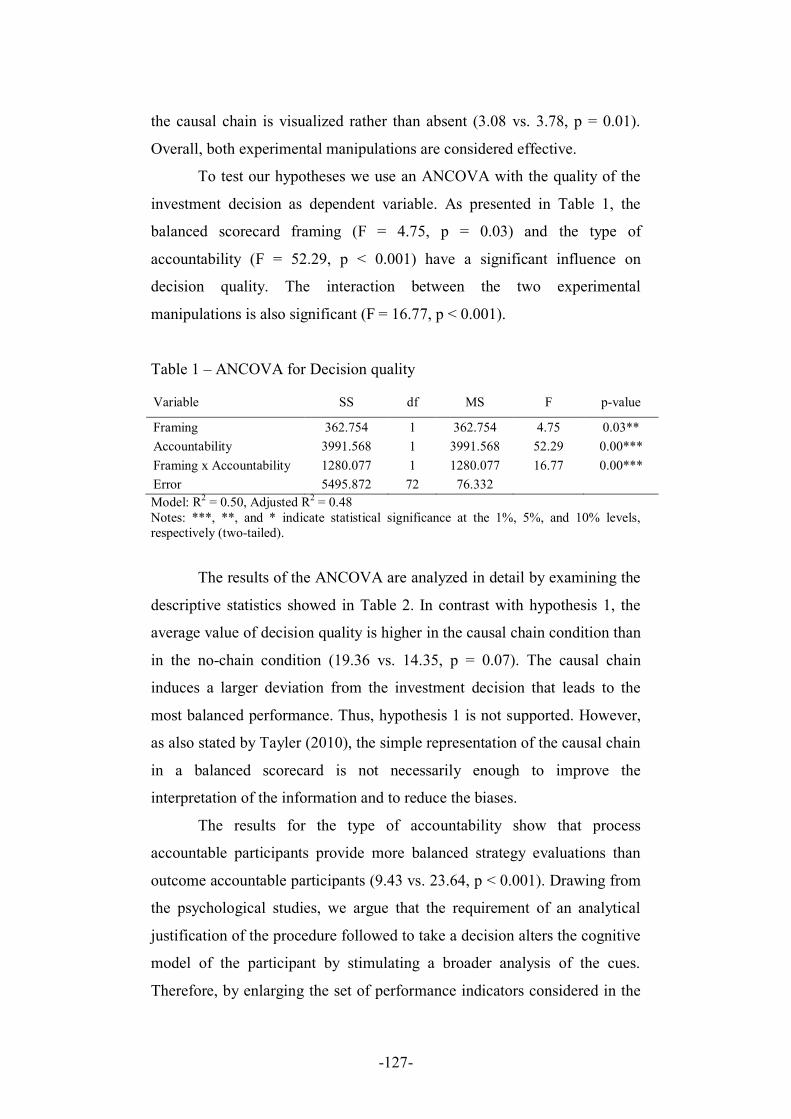
-127-
the causal chain is visualized rather than absent (3.08 vs. 3.78, p = 0.01).
Overall, both experimental manipulations are considered effective.
To test our hypotheses we use an ANCOVA with the quality of the
investment decision as dependent variable. As presented in Table 1, the
balanced scorecard framing (F = 4.75, p = 0.03) and the type of
accountability (F = 52.29, p < 0.001) have a significant influence on
decision quality. The interaction between the two experimental
manipulations is also significant (F = 16.77, p < 0.001).
Table 1 – ANCOVA for Decision quality
Variable SS df MS F p-value
Framing 362.754 1 362.754 4.75 0.03**
Accountability 3991.568 1 3991.568 52.29 0.00***
Framing x Accountability 1280.077 1 1280.077 16.77 0.00***
Error 5495.872 72 76.332
Model: R2 = 0.50, Adjusted R
2 = 0.48
Notes: ***, **, and * indicate statistical significance at the 1%, 5%, and 10% levels,
respectively (two-tailed).
The results of the ANCOVA are analyzed in detail by examining the
descriptive statistics showed in Table 2. In contrast with hypothesis 1, the
average value of decision quality is higher in the causal chain condition than
in the no-chain condition (19.36 vs. 14.35, p = 0.07). The causal chain
induces a larger deviation from the investment decision that leads to the
most balanced performance. Thus, hypothesis 1 is not supported. However,
as also stated by Tayler (2010), the simple representation of the causal chain
in a balanced scorecard is not necessarily enough to improve the
interpretation of the information and to reduce the biases.
The results for the type of accountability show that process
accountable participants provide more balanced strategy evaluations than
outcome accountable participants (9.43 vs. 23.64, p < 0.001). Drawing from
the psychological studies, we argue that the requirement of an analytical
justification of the procedure followed to take a decision alters the cognitive
model of the participant by stimulating a broader analysis of the cues.
Therefore, by enlarging the set of performance indicators considered in the

-128-
mental model, process accountability leads to enhanced judgments
compared to outcome accountability. These results provide support to
hypothesis 2.
Table 2 – Mean Decision quality (standard deviation) by experimental
condition Type of accountability
BSC framing Outcome Process Overall
No-chain 17.5 (9.56)
N=20
11.2 (5.58)
N=20
14.35 (8.36)
N=40
Causal chain 30.11 (11.12)
N=19
7.35 (7.67)
N=17
19.36 (14.94)
N=36
Overall 23.64 (12.04)
N=39
9.43 (6.81)
N=37
To study the combined effect of balanced scorecard framing and
type of accountability on the quality of strategy decision we examine the
single mean differences between experimental conditions (Table 3). As
discussed previously, the introduction of a causal chain in a balanced
scorecard is not sufficient to obtain improved decisions. In our experiment
we show that the strategic linkages are beneficial if they are associated to
process accountability (effect on decision quality = -3.85, p = 0.08). The
cognitive reasoning induced by being process accountable is further
reinforced and enhanced by the provision of a causal chain. In contrast, the
strategic chain is detrimental to individuals who are outcome accountable
(+12.61, p < 0.001) because it emphasizes the importance of the last
measure of the chain. The financial perspective is already the focus of
outcome accountable subjects, but its importance is incremented by the
causal chain representation. Table 3 also illustrates that independently on
the balanced scorecard framing, process accountability stimulates balanced
strategy evaluations. However, consistently with hypothesis 3, the biggest
difference is registered in the causal chain condition. When the balanced
scorecard measures are connected by a cause-and-effect relationship, the
choices about the strategic investment made by outcome accountable
participants deviate from the balanced level significantly more than

-129-
participants in the process accountability condition (+22.75, p < 0.001).
Therefore, hypothesis 3 is supported.
Table 3 – Effect of BSC framing and Type of accountability on Decision
quality
Effect size t-value (p-value)
(1) BSC framing on OA +12.61 3.80 (0.00***)
(2) BSC framing on PA -3.85 -1.76 (0.08*)
(3) Type of accountability on
NC
+6.30 2.55 (0.02**)
(4) Type of accountability on
CC
+22.75 7.06 (0.00***)
Notes: ***, **, and * indicate statistical significance at the 1%, 5%, and 10% levels,
respectively (two-tailed).
After the investment decision, in the final questionnaire, participants
assigned a weight from 0 to 100 to each balanced scorecard perspective
based on the importance assumed in their decision. As proved by the
previous analyses, the causal chain framing, relative to the absence of
strategic linkages between scorecard dimensions, emphasizes the
importance of the financial perspective (37.92 vs. 29.12, p = 0.001), but also
reduces the weight placed on the learning and growth dimension (12 vs. 20,
p < 0.001). Moreover, consistently with our second hypothesis, in the
decisions made by outcome accountable participants, the financial
performance outweigh all the other perspectives, whereas the weight
assigned to the financial perspective by process accountable subjects is not

-130-
significantly different from the weight assigned to the internal processes
(29.86 vs. 32.30, p = NS). Finally, as expected in our third hypothesis,
explicit cause-and-effect relationships proposed to participants in the
process accountability condition leads to a more balanced investment choice
(financial 34.12 vs. learning and growth 36.47, p = NS) than the decision
taken by participants in the outcome accountability condition (41.32 vs.
22.58, p < 0.001).
4.5. Discussion and conclusion
Strategy evaluation is a critical issue for organizations and it is
affected by a number of behavioral features characterizing managers. When
subjectivity is involved, at least in choosing the cognitive procedure to be
used in the decision, psychological mechanisms stimulate the emergence of
biases and need to be understood and controlled. With this work we
enlarged the body of research about the influence of the presentation of
information on decision making and we suggest new insights on the role of
accountability. We focus the investigation on the contribution provided by
the representation of a causal chain connecting the performance categories
of the balanced scorecard, and on the different consequences of the
introduction of process and outcome accountability. The results of our
experiment show that the visualization of the causal links between scorecard
measures is not sufficient to improve the quality of the investment decision.
However, when the causal chain is proposed to process accountable
individuals, a significant shift toward a more balanced investment on the
strategic project is registered. We also provide evidence that process
accountability, relative to outcome accountability, significantly reduces the
focus on the financial perspective and is beneficial for the strategic decision.
On this issue we confirm the accountability literature arguing that process
accountability stimulates a broader examination of the available cues and a
more analytical information processing. These findings have also benefits in
practice. In sum, we suggest that organizations improve the quality of
strategic decisions and reduce the biases by presenting performance reports

-131-
prepared coherently with the accountability condition of the manager and
with the purpose of the evaluation. The analysis of information requires an
alignment between the framing of data and the cognitive processes adopted
by the manager. An inappropriate combination of the two factors changes
the focus of the manager and has consequences on the weights placed on the
performance measures with detrimental effects on the evaluation.
Our study is not without limitations. First, to disentangle the effects
of our manipulations from other confounding determinants we keep the
balanced scorecard and the associated causal chain simple and with direct
links. In line with other studies, each performance category includes only
one indicator in order to avoid issues of information overload and to limit
the cognitive complexity. Moreover, performance data are provided with
reference to a single period and there are no insights about the future and
long-term horizon. However, the enhancement of information processing in
process accountable managers can contrast with complex scorecards.
Second, the accountability manipulation is coherent with previous research,
but the pressure induced by the organizational environment and by the
consequences of the decision is not easily replicable in an experimental
setting. Third, our task is individually solved even if strategic decisions in
companies are usually associated to group discussions. Anyway, we show
how an individual contribution to a broader discussion is influenced by
behavioral issues.
The topic of this study offers some opportunities for future research.
We compared the behavioral consequences of process and outcome
accountability in decision making. An additional manipulation based on the
combination of the two types of accountability would be interesting to show
which mental reasoning dominates. Then, in companies accountability has
non-financial consequences, but it is also associated with financial
incentive. In these types of settings, the presence of monetary incentives
interacts with accountability and with the individual evaluations. The
economics literature started to explore this issue (Vieider, 2011) and it
represents an opportunity for the management accounting field. Finally,

-132-
time pressure is a determinant that can overwhelm the reasoning induced by
the framing of the balanced scorecard and by the accountability condition.
The investigation of the manager‟s reaction in case of urgency is another
chance for future research.

-133-
References
Ahn, W., Kalish, C.W., Medin, D.L., Gelman, S.A., (1995). The role of
covariation versus mechanism information in causal attribution,
Cognition, 54, 299-352;
Ashton, R.H., (1992). Effects of justification and a mechanical aid on
judgment performance, Organizational Behavior and Human
Decision Processes, 52(2), 292-306;
Atkinson, A.A., Waterhouse, J.H., Wells, R.B., (1997). A stakeholder
approach to strategic performance measurement, Sloan Management
Review, 38(3), 25-37;
Atkinson, H., (2006). Strategy implementation: A role for the balanced
scorecard?, Management Decision, 44(10), 1441-1460;
Banker, R.D., Potter, G., Srinivasan, D., (2000). An empirical investigation
of an incentive plan that includes nonfinancial performance
measures, The Accounting Review, 75(1), 65-92;
Banker, R.D., Chang, H., Pizzini, M., (2011). The judgmental effects of
strategy maps in balanced scorecard performance evaluations,
International Journal of Accounting Information Systems, 12(4),
259-279;
Bechtoldt, M.N., De Dreu, C.K.W., Nijstad, B.A., Choi, H., (2010).
Motivated information processing, social tuning, and group
creativity, Journal of Personality and Social Psychology, 99(4), 622-
637;
Bento, A., Ferreira White, L., (2010). An exploratory study of strategic
performance measurement systems, in Epstein, M.J., Lee, J.Y, (ed.)
Advances in Management Accounting, 18, 1-26;
Booker, D., Heitger, D., Schultz, T., (2011). The effect of causal knowledge
on individuals‟ perceptions of nonfinancial performance measures in
profit prediction, Advances in Accounting incorporating Advances
in International Accounting, 27(1), 90-98;
Campbell, D., Datar, S.M., Kulp, S.L., Narayanan, V.G., (2008). Testing
strategy with multiple performance measures: Evidence from a
balanced scorecard at Store24, Working Paper, Harvard Business
School;
Cardinaels, E., Van Veen-Dirks, P.M.G., (2010). Financial versus non-
financial information: The impact of information organization and
presentation in a Balanced Scorecard, Accounting, Organizations
and Society, 35(6), 565-578;
Chaiken, S., (1980). Heuristic versus systematic information processing and
the use of source versus message cues in persuasion, Journal of
Personality and Social Psychology, 39(5), 111-120;
-134-
Cheng, M.M., Humphreys, K.A., (2010). The effect of causal chain
illustration on managers‟ assessment of perceived strategic
contribution and willingness to approve a capital investment,
Working Paper, University of New South Wales;
Cheng, M.M., Humphreys, K.A., (2012). The differential improvement
effects of the strategy map and scorecard perspectives on managers‟
strategic judgments, The Accounting Review, forthcoming;
Chong, V., Leong, M., Woodliff, D., (2010). The effects of outcome
accountability pressure on budgetary slack: An experimental
investigation, Working Paper, University of Western Australia;
DeBusk G.K., Brown, R.M., Killough, L.N., (2003). Components and
relative weights in utilization of dashboard measurement systems
like the Balanced Scorecard, The British Accounting Review, 35(3),
215-231;
De Dreu, C.K.W., Beersma, B., Stroebe, K., Euwema, M.C., (2006).
Motivated information processing, strategic choice, and the quality
of negotiated agreement, Journal of Personality and Social
Psychology, 90(6), 927-943;
De Langhe, B., van Osselaer, S., Wierenga, B., (2011). The effects of
process and outcome accountability on judgment process and
performance, Organizational Behavior and Human Decision
Processes, 115(2), 238-252;
Farrell, A.M., Luft, J., Shields, M.D., (2007). Accuracy in judging the
nonlinear effects of cost and profit drivers, Contemporary
Accounting Research, 24(4), 1139-1169;
Fennema, M.G., Perkins, J.D., (2008). Mental budgeting versus marginal
decision making: Training, experience and justification effects on
decisions involving sunk costs, Journal of Behavioral Decision
Making, 21(3), 225-239;
Frederickson, J.R., Peffer, S.A., Pratt, J., (1999). Performance evaluation
judgments: Effects of prior experience under different performance
evaluation schemes and feedback frequencies, Journal of Accounting
Research, 37(1), 151-165;
Huelsbeck, D.P., Merchant, K.A., Sandino, T., (2011). On testing business
models, The Accounting Review, 86(5), 1631-1654;
Humphreys K.A., Trotman, K.T., (2011). The balanced scorecard: The
effect of strategy information on performance evaluation judgments,
Journal of Management Accounting Research, 23(1), 81-98;
Ittner, C. D., Larcker, D. F., (2003). Coming up short on nonfinancial
performance measurement, Harvard Business Review, November,
88-95;
-135-
Ittner, C. D., Larcker, D. F., Meyer, M. W., (2003). Subjectivity and the
weighting of performance measures: evidence from a balanced
scorecard, The Accounting Review, 78(3), 725-758;
Kaplan, R.S., Norton, D.P., (1992). The balanced scorecard: measures that
drive performance, Harvard Business Review, 70(1), 71-79;
Kaplan, R.S., Norton, D.P., (2000). Having trouble with your strategy? Then
map it, Harvard Business Review, 78(5), 167-176;
Kaplan, R.S., Norton, D.P., (2001). The strategy-focused organization: How
balanced scorecard companies thrive in the new business
environment, Harvard Business School Press, Boston;
Kaplan, R.S., Norton, D.P., (2004). Strategy maps: converting intangible
assets into tangible outcomes, Harvard Business School Press,
Boston;
Kelly, K., (2010). Accuracy of relative weights on multiple leading
performance measures: Effects on managerial performance and
knowledge, Contemporary Accounting Research, 27(2), 577-608;
Lerner, J., Tetlock, P.E., (1999). Accounting for the effects of
accountability, Psychological Bulletin, 125(2), 255-275;
Libby, T., Salterio, S.E., Webb, A., (2004). The balanced scorecard: The
effects of assurance and process accountability on managerial
judgment, The Accounting Review, 79(4), 1075-1094;
Lipe, M.G., Salterio, S., (2002). A note on the judgmental effects of the
Balanced Scorecard‟s information organization, Accounting,
Organizations and Society, 27(6), 531-540;
Luft, J.L., Shields, M.D., (2001). Why does fixation persist? Experimental
evidence on the judgment performance effects of expensing
intangibles, The Accounting Review, 76(4), 561-587;
Luft, J., Shields, M., Tyler, F.T., (2011). Performance measures, motivated
reasoning, and subjective performance evaluation, Working Paper,
Michigan State University;
Malina, M.A., Selto, F.H., (2001). Communicating and controlling strategy:
An empirical study of the effectiveness of the balanced scorecard,
Journal of Management Accounting Research, 13(1), 47-90;
Malina, M.A., Nørreklit, H.S.O., Selto, F.H., (2007). Relations among
measures, climate of control, and performance measurement models,
Contemporary Accounting Research, 24(3), 935-982;
Markman, A., Gentner, D., (2001). Thinking, Annual Review of
Psychology, 52, 223-247;
McAllister, D.W., Mitchell, T.R., Beach, L.R., (1979). The contingency
model for the selection of decision strategies: An empirical test of
the effect of significance, accountability, and reversibility,
Organizational Behavior and Human Performance, 24, 228-244;

-136-
Rich, V., (2007). Interpreting the balanced scorecard: an investigation into
performance analysis and bias, Measuring Business Excellence,
11(1), 4-11;
Schkade, D.A., Kleinmuntz, D.N., (1994). Information displays and choice
processes: Differential effects of organization, form, and sequence,
Organizational Behavior and Human Decision Processes, 57(3), 319-
337;
Scholten, L., van Knippenberg, D., Nijstad, B.A., De Dreu, C.K.W., (2007).
Motivated information processing and group decision-making:
Effects of process accountability on information processing and
decision quality, Journal of Experimental Social Psychology, 43(4),
539-552;
Sedikides, C., Herbst, K.C., Hardin, D.P., Dardis, G.J., (2002).
Accountability as a deterrent to self-enhancement: The search for
mechanisms, Journal of Personality and Social Psychology, 83(3),
592-605;
Siegel-Jacobs, K., Yates, J., (1996). Effects of procedural and outcome
accountability on judgment quality, Organizational Behavior and
Human Decision processes, 65(1), 1-17;
Simonson, I., Nye, P., (1992). The effect of accountability on susceptibility
to decision errors, Organizational Behavior and Human Decision
Processes, 51(3), 416-446;
Simonson, I., Staw, B.M., (1992). Deescalation strategies: A comparison of
techniques for reducing commitment to losing courses of action,
Journal of Applied Psychology, 77(4), 419-426;
Tayler, (2010). The balanced scorecard as a strategy-evaluation tool: The
effects of implementation involvement and a causal-chain focus, The
Accounting Review, 85(3), 1095-1117;
Tetlock, P.E., (1983a). Accountability and the perseverance of first
impressions, Social Psychology Quarterly, 46(4), 285-292;
Tetlock, P.E., (1983b). Accountability and complexity of thought, Journal of
Personality and Social Psychology, 45(1), 74-83;
Tetlock, P.E., (1985). Accountability: A social check on the fundamental
attribution error, Social Psychology Quarterly, 48(3), 227-236;
Tetlock, P.E., (1992). The impact of accountability on judgment and choice:
Toward a social contingency model, Advances in Experimental
Social Psychology, 25, 331-376;
Vera-Muñoz, S.C., Shackell, M., Buehner, M., (2007). Accountants‟ usage
of causal business models in the presence of benchmark data: A
note, Contemporary Accounting Research, 24(3), 1015-1038;
Vieider, F.M., (2011). Separating real incentives and accountability,
Experimental Economics, 14(4), 507-518;

-137-
Webb, R.A., (2004). Managers‟ commitment to the goals contained in a
strategic performance measurement system, Contemporary
Accounting Research, 21(4), 925-958;
Zhank, Y., Mittal, V., (2005). Decision difficulty: Effects of procedural and
outcome accountability, Journal of Consumer Research, 32(3), 465-
472.
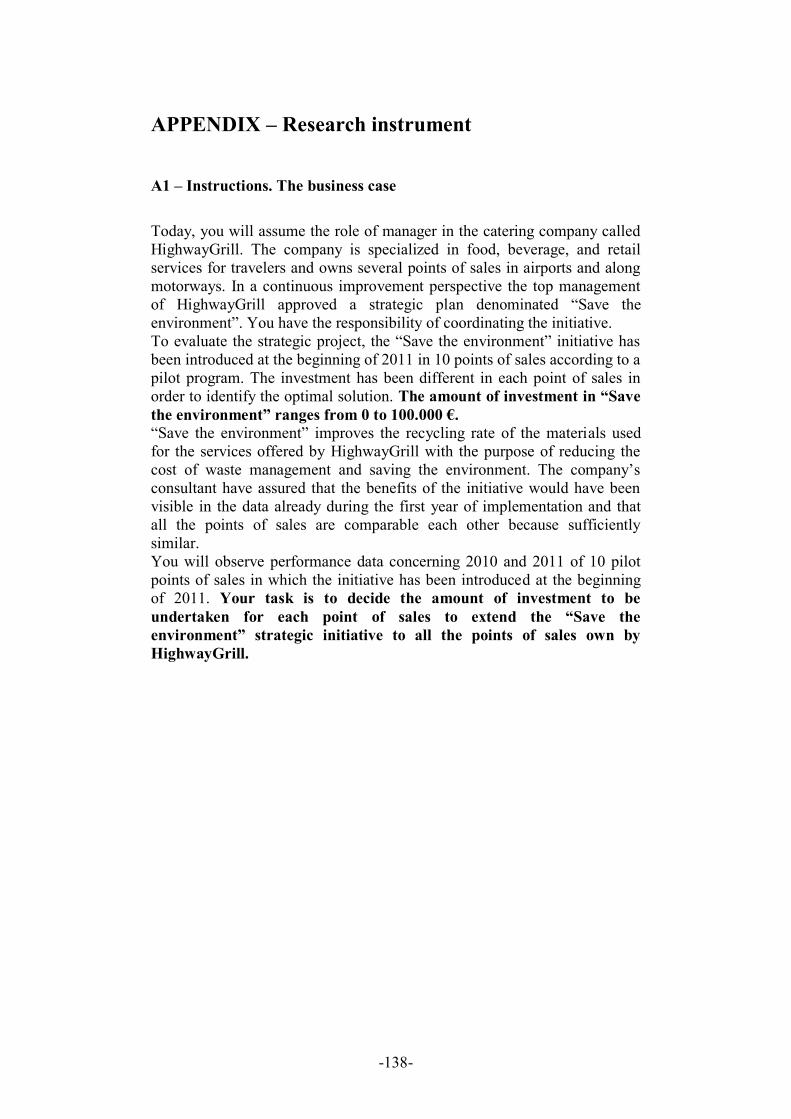
-138-
APPENDIX – Research instrument
A1 – Instructions. The business case
Today, you will assume the role of manager in the catering company called
HighwayGrill. The company is specialized in food, beverage, and retail
services for travelers and owns several points of sales in airports and along
motorways. In a continuous improvement perspective the top management
of HighwayGrill approved a strategic plan denominated “Save the
environment”. You have the responsibility of coordinating the initiative.
To evaluate the strategic project, the “Save the environment” initiative has
been introduced at the beginning of 2011 in 10 points of sales according to a
pilot program. The investment has been different in each point of sales in
order to identify the optimal solution. The amount of investment in “Save
the environment” ranges from 0 to 100.000 €. “Save the environment” improves the recycling rate of the materials used
for the services offered by HighwayGrill with the purpose of reducing the
cost of waste management and saving the environment. The company‟s
consultant have assured that the benefits of the initiative would have been
visible in the data already during the first year of implementation and that
all the points of sales are comparable each other because sufficiently
similar.
You will observe performance data concerning 2010 and 2011 of 10 pilot
points of sales in which the initiative has been introduced at the beginning
of 2011. Your task is to decide the amount of investment to be
undertaken for each point of sales to extend the “Save the
environment” strategic initiative to all the points of sales own by
HighwayGrill.

-139-
A2 – Individual evaluation
Outcome accountability condition
HighwayGrill assigned you a task with significant consequences on the
performance of the company. For this reason, at the end of the study, you
will be evaluated.
The evaluation score will be based only on the accuracy of the investment
amount that you chose. In particular, the deviation from the optimal
investment amount will be computed.
Moreover, a ranking will be prepared and it will compare your result with
the results of your colleagues. The participants with the two best scores will
receive a top up voucher for the mobile phone of 20 €.
Be sure to choose the amount of investment that you consider optimal.
Process accountability condition
HighwayGrill assigned you a task with significant consequences on the
performance of the company. For this reason, at the end of the study, you
will be evaluated.
In addition to the choice about the amount of investment, the documents
will ask you to justify with few lines of text the procedure that you followed
to take the decision. You will have to provide a justification about the
considerations that you made and to indicate the elements that you
considered in your decision. The quality of the explanation will be evaluated
by a team of researchers and it will be the only element on which the
evaluation will be based.
At the end of the experiment, after returning all the materials to the
researcher, some participants will be randomly chosen for a brief interview
about the justification of the choice provided in the experimental materials.
Moreover, a ranking will be prepared and it will compare your result with
the results of your colleagues. The participants with the two best scores will
receive a top up voucher for the mobile phone of 20 €.
Be sure to provide the most appropriate justification for your investment
choice.
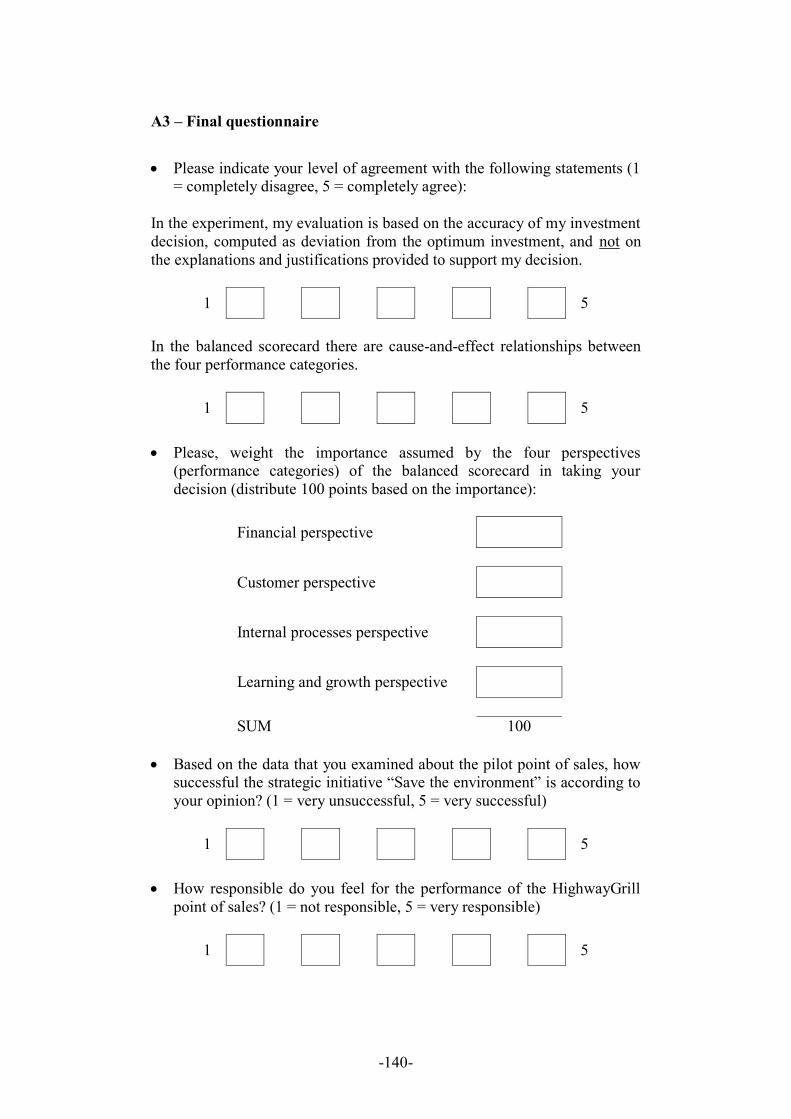
-140-
A3 – Final questionnaire
Please indicate your level of agreement with the following statements (1 = completely disagree, 5 = completely agree):
In the experiment, my evaluation is based on the accuracy of my investment
decision, computed as deviation from the optimum investment, and not on
the explanations and justifications provided to support my decision.
1 5
In the balanced scorecard there are cause-and-effect relationships between
the four performance categories.
1 5
Please, weight the importance assumed by the four perspectives (performance categories) of the balanced scorecard in taking your
decision (distribute 100 points based on the importance):
Financial perspective
Customer perspective
Internal processes perspective
Learning and growth perspective
SUM 100
Based on the data that you examined about the pilot point of sales, how successful the strategic initiative “Save the environment” is according to
your opinion? (1 = very unsuccessful, 5 = very successful)
1 5
How responsible do you feel for the performance of the HighwayGrill
point of sales? (1 = not responsible, 5 = very responsible)
1 5

-141-
Please indicate your level of agreement with the following statements (1
= completely disagree, 5 = completely agree):
The points of sales have a sure benefit from the strategic initiative “Save the
environment”
1 5
During the experiment…
…I studied carefully all the information in order to come to a more
informed decision
1 5
…I studied carefully the relationships between the different perspectives
1 5
…the balanced scorecard directed my attention towards the relationships
between perspectives
1 5
…I studied carefully the direct and indirect effects of the initiative “Save the
environment”
1 5
…I focused on the effects that the strategy “Save the environment” had on
the internal processes
1 5
…I focused on the effects that the strategy “Save the environment” had on
the financial perspective
1 5
…I did not noticed any variation on the customer satisfaction
1 5

-142-
…the training rate was not useful for decision making
1 5
Please indicate your level of agreement with the following statements (1 = completely disagree, 5 = completely agree):
I have had difficulties in coming to a decision
1 5
During the study I felt pressed in taking a good decision
1 5
The decision process was structured
1 5
The data that I analyzed were too complex
1 5
The figure of the balanced scorecard provided by the instructions helped me
in analyzing the data of the pilot points of sales
1 5
Gender
male female
Year of birth
Year:

-143-
Year of degree program
Year:
Months of relevant working experience (internship included). Please indicate 0 in case of no working experience
Months:
Have you never heard about balanced scorecard?
YES NO
Have you never heard about strategic maps?
YES NO
Please indicate your mobile phone operator (to be used only in case of prize)
TIM Vodafone
Wind 3

-144-

-145-
Estratto per riassunto della tesi di dottorato
Studente: Nicola Dalla Via
Matricola: 955549
Dottorato: Economia Aziendale
Ciclo: 24
Titolo della tesi: Three Essays in Behavioral Management Accounting
Estratto:
Con la presente tesi si intende contribuire alla letteratura riguardante il comportamento degli individui coinvolti in compiti di controllo di gestione e di decisioni aziendali. L’elaborato è composto da un capitolo introduttivo e da tre studi empirici. Il Capitolo 1 propone una recensione storica degli studi riguardanti le tematiche comportamentali nel controllo di gestione. Il Capitolo 2 esamina come l’introduzione di misure di performance soggettive in un sistema di incentivazione biennale porti a distorsioni nella valutazione. In particolare, i risultati mostrano che le valutazioni della performance condotte dai supervisori sono influenzate dal compromesso tra una funzione informativa ed una premiante. Il Capitolo 3 indaga le difficoltà di riconoscimento del comportamento dei costi denominato viscosità, quando è proposto mediante differenti formati di rappresentazione. Infine, il Capitolo 4 studia le modalità per mezzo delle quali le decisioni strategiche sono influenzate dall’adozione di una balanced scorecard con catena causale e dall’introduzione di differenti tipologie di accountability (processo e risultato).
Abstract:
The aim of the dissertation is to contribute to the literature focused on issues related to the behavior of individuals involved in management accounting tasks. The work is composed by an introductory chapter and three empirical papers. Chapter 1 proposes a historical review of the studies on behavioral management accounting and control. Chapter 2 examines how the introduction of subjective performance measures in a biannual incentive system leads to evaluation biases. In particular, the findings show that supervisors’ performance evaluations are subject to a trade-off between an informative and a rewarding function. Chapter 3 investigates whether sticky cost behavior is recognized under different presentation formats. Finally, Chapter 4 studies how strategic decisions are influenced by the adoption of a causal chain in a balanced scorecard and by the introduction of different types of accountability (process vs. outcome).
Firma dello studente
_____________________