three-dimensional multi-phase-field simulation of
TRANSCRIPT
239
CHINA FOUNDRYVol.18 No.3 May 2021Research & Development
*Chang-sheng Zhu1, 2 , Yu-jie Li1, Fang-lan Ma1, Li Feng3, Peng Lei1 1. School of Computer and Communication, Lanzhou University of Technology, Lanzhou 730050, China2. State Key Laboratory of Gansu Advanced Processing and Recycling of Non-Ferrous Metal, Lanzhou University of Technology, Lanzhou 730050, China3. School of Materials Science and Engineering, Lanzhou University of Technology, Lanzhou 730050, China
1 IntroductionAt present, the steel materials based on Fe-C alloys have been widely used in the engineering material field. The eutectoid phase transformation is the basic phase transformation in the heat treatment process [1-3], which widely exists in carbon steel and other materials. Due to the scale of eutectoid being in the micron range, it is still very difficult to observe and study through experimental methods. Micro-structure numerical simulation technology is an effective means to predict and study the mechanism of eutectoid transformation, and has become a research hotspot [4, 5]. The phase-field method (PFM) based on the Ginzburg-Landau theory is one of the most effective methods to deal with the dynamics of microstructure evolution [6-8].
Abstract: Seeking high-performance computing methods to solve the problem of a large amount of calculation, low calculation efficiency, and small simulation scale on the traditional single central processing unit (CPU) platform is of great value to the simulation study of micro-structure. In this study, based on the three-dimensional multi-phase-field model of KKSO coupling phase-field and solute field, the open computing language (OpenCL) + graphics processing unit (GPU) heterogeneous parallel computing technology is used to simulate the eutectoid growth of Fe-C alloy and the end growth process of pearlite under pure diffusion. The effects of initial supercooling and different diffusion coefficients on the growth morphology of lamellar pearlite were investigated. The results show that ferrite and cementite are perpendicular to the front of the solid-solid interface and are coupled and coordinated to grow, and there is no leading phase under the initial supercooling degree of 20 K. With the continuous increase of the initial supercooling degree (19 K-22 K), the morphology changes of the eutectoid layer are as follows: cementite stops growing → slice amplitude increases → regular symmetric growth → oblique growth → layer merge. With the increase of the diffusion coefficient from 3×10-13 m2·s-1 to 15×10-13 m2·s-1, the growth rate of the microstructure of the lamellar pearlite increases linearly, and there is no obvious change in the frontal appearance of the pearlite.
Key words: phase-field model; lamellar pearlite; eutectoid phase transition; OpenCL; Fe-C alloy
CLC numbers: TP391.9 Document code: A Article ID: 1672-6421(2021)03-239-10
*Chang-sheng ZhuMale, born in 1972, Ph.D, Professor. His research interest mainly focuses on high-performance computing.
E-mail: [email protected]: 2020-10-26; Accepted: 2021-04-06
https://doi.org/10.1007/s41230-021-0123-x
Three-dimensional multi-phase-field simulation of eutectoid alloy based on OpenCL parallel
Eutectic growth has shown many important research results from liquid phase to solid phase in phase-field [9-12]. Eutectoid growth is the transformation from solid phase to solid phase derived from the theory and equations of eutectic growth. The study of eutectic growth has laid the foundation for the study of eutectoid growth. Currently, the simulation research of Fe-C alloy eutectoid transformation by phase-field method at home and abroad has made certain progress. Mushongera et al. [13] established a phase-field model to simulate the morphological transformation of Fe-C-Mn pearlite and discussed the mechanism of pearlite divergent growth. Numerical investigations suggested that a temporal decrease in the driving force which was otherwise necessary to support manganese diffusion from the ferrite to cementite led to lamellar divergence. Nakajima et al. [14] used the multi-phase-field method (MPF) to simulate the co-growth of eutectoid steel pearlite, and the simulation results of layer spacing and growth rate were compared with the experimental results. It was predicted that diffusion in ferrite and growth of cementite from the ferrite
240
CHINA FOUNDRY Vol.18 No.3 May 2021Research & Development
increased the kinetics of pearlitic transformation by a factor of four as compared to growth from austenite only, which was assumed by the classical Zener-Hillert model. Zhang et al. [15] adopted the phase-field method to study the transformation of austenite and ferrite during the isothermal process of Fe-C alloy, and further studied the influence of temperature and Mn content on the structure. It showed that the incomplete transformation phenomenon did occur due to the diffusion of Mn inside interface. The modified MPF model was then used to study the effect of Mn contents on the microstructures and kinetics of the phase transformations. It was found that the ferrite growth along the austenite/austenite boundaries was faster than that in the perpendicular direction. Most of the above studies are limited to the simulation study of two-dimensional eutectoid and cannot fully show the microstructure growth morphology. Therefore, it is significant to carry out the simulation study of the three-dimensional multi-field coupled eutectoid transformation. However, for the three-dimensional phase-field model, the simulation scale is enlarged, the calculation amount is increased, and the calculation period becomes longer, it is difficult to solve the phase-field equation.
The computational performance bottleneck to solve the phase-field model caused by the traditional method has restricted the development of the phase-field model. Therefore, it is vital to use the graphics processing unit's (GPU) powerful floating-point computing capabilities to improve computing efficiency. Scholars at home and abroad have done a lot of work on this. Zhang et al. [16] utilized the phase-field method combined with parallel adaptive mesh refinement algorithm and lattice Boltzmann method to simulate the transformation of eutectic appearance under the condition of external temperature gradient, which could improve the computational efficiency of two orders of magnitude. Based on the phase- field model, Aoki et al. [17] used the compute unified device architecture (CUDA) to simulate the solidification process of pure metal dendrites, and found 171 GFlops can be achieved on a single GPU. Yamanaka et al. [18] used CUDA on a single GPU to perform phase-field simulations of binary alloy solidification, and evaluated the acceleration performance of three-dimensional solidification simulations, the calculation speed of single GPU is 100 times faster than single central processing unit (CPU) core. At present, the research based on the GPU multi-field coupled three-dimensional phase-field model is becoming more and more widely accepted, and has become the focus of current research. Most of them are based on the CUDA programming model [20-22], however, CUDA only supports Nvidia GPU products, and hardware devices produced by different manufacturers cannot use a unified programming framework to achieve program development, which hinders the wide application and rapid development of high-performance computing. Open computing language (OpenCL) is the first open and free standard for parallel programming for heterogeneous systems. It is also unified programming environment and has broad development prospects in many fields. Our team [19] coupled the phase-field model with
(1)
the LBM model of computational fluids, and used OpenCL's parallel computing method to obtain a speed up to 136 times faster than single CPU core.
This study is based on an OpenCL programming framework, which makes full use of GPU's extremely powerful floating-point computing performance to solve the problem of multi-field coupled three-dimensional phase-field model. The growth of Fe-C binary alloy eutectoid structure was simulated under pure diffusion, and the microstructure growth rule of lamellar pearlite was studied. The effects of different initial undercooling degrees and different diffusion coefficients on the growth morphology of pearlite for Fe-C binary alloy were simulated. Finally, the influence of supercooling and diffusion coefficient on the diffusion ability of carbon atoms was further discussed.
2 Mathematical model2.1 Phase-field equationThe phase-field control equation adopts the KKSO model, and the specific derivation process is described in Ref. [23].
The phase-field control equation is expressed as follows:
where, φ i (i=1, 2, 3) is the phase-field order parameter. In the austenite phase, φ1=φ2=0, φ3=1; in the ferrite phase, φ2=φ3=0, φ1=1; in the cementite phase, φ1=φ3=0, φ2=1. The above three variables must follow the following rules in any
position during the eutectoid growth process:
, Sij=Si ·Sj, Si, Sj are the step function, if φi=0, Si=0,
otherwise Si=1. Mij is the phase-field dynamic coefficient, the phase-field dynamic (Mi 3 for i=1, 2) is determined at the vanishing interface kinetics coefficient condition, whose
expression is, , besides, it is
assumed M12=(M13+M23)/2 in actual computations, superscript e is the equilibrium state.Where:
where, εij is the gradient energy coefficient, ,
ζ is half the height of the double-well potential, ωij is the double-well potential height between phase i and phase
j, , σij is the interface energy. satisfies
the following equation:
(2)

241
CHINA FOUNDRYVol.18 No.3 May 2021Research & Development
Fig. 1: OpenCL implementation process, including OpenCL abstract model diagram (a), OpenCL storage structure diagram (b), OpenCL composition and actions that occur on the CPU during execution (c), OpenCL program's execution process in GPU (d)
(3)
equation is:
where D is the solute diffusion coefficient, whose expression is , is the austenite concentration
diffusion coefficient, is the ferrite concentration diffusion
coefficient.
3 OpenCL parallel heterogeneous computing technology
Figure 1 shows the implementation process of solving a multi-field coupled model based on OpenCL in parallel. The OpenCL execution model is divided into two parts: one is the main program executed on the CPU, and the other is the kernel program executed on the OpenCL device.
where, Vm is the molar volume, cE is the eutectoid component, R is the Boltzmann constant, mi is the slope of the equilibrium mother phase line, f is the free energy areal density, c1, c2, c3 correspond to the solute concentration of ferrite, cementite and austenite during the eutectoid transformation process, respectively, TE is the eutectoid temperature, ki is the equilibrium distribution coefficient.
2.2 Solute field equationAccording to the solute conservation law, the solute field
(4)
(a) (b)
(d)
D Cα-Fe
D Cγ-FeD = φ3 · D C + (1-φ3) · D C
γ-Fe α-Fe
(c)
242
CHINA FOUNDRY Vol.18 No.3 May 2021Research & Development
Figure 1(a) is the OpenCL abstract model. This study designs a two-level parallel mechanism on the software structure: the first level is a work-group, which consists of multiple work-items, and the second level is an NDRange, which consists of various work-groups. Each work-item is allocated to the processing element (PE) on the hardware structure. PE is the smallest unit that performs calculation of data on the GPU. A work-group can be regarded as a thread group. Each thread in the work-group is transmitted to the same by the GPU thread scheduling unit. On a computing unit (CU), arrows I, II and III are the hardware structure corresponding to the software structure. Figure 1(b) describes the OpenCL storage structure diagram. The OpenCL storage model consists of four parts: global memory, private memory, local memory, and constant memory. Figure 1(c) shows the composition of OpenCL and the actions that take place in the CPU during execution. The study firstly creates a based-on-GPU abstract container-context by using the OpenCL interface (application programming interface, API). Then the operation of the entire platform based on OpenCL is managed by the context. The resources managed by the context include GPU devices, kernel function objects running on the GPU, and memory objects interacting between the CPU and the GPU device. Secondly, the CPU uses context to establish a command queue to coordinate the execution of the kernel function on the GPU device. The CPU puts each command to be executed on the GPU device into the command queue through the API and wait for scheduling. It includes commands to read and write memory objects, synchronization commands or kernel commands. Since the execution of the CPU is scheduled on the GPU, the execution of these commands is asynchronous. Thirdly, to allocate the memory objects required by the calculation in the GPU and execute the code on the CPU, the CPU can submit commands to the GPU command queue through the OpenCL runtime interface and copy the data required by the GPU code to the storage object of the device through the host-side API. Finally, the computer executes the device-side code and retrieves the data in the GPU storage object back to the CPU. In the Fig. 1(c), CPU and GPU exchange data through the bidirectional arrows of the data bus (PCI-E). The ideal transmission bandwidth of PCI-E3.0×16 reaches 16 GB·s-1, the actual speed can reach 13 GB·s-1, and the GPU main memory access bandwidth is 150 GB·s-1 or even higher. The data transmission overhead is much larger than the GPU accessing device memory overhead. Therefore, reasonable design is the priority to improve the calculation efficiency. The kernel function on the GPU side copies the initial memory data to the memory before the parallel calculation. It copies the calculation results from the memory to the CPU after the analysis is completed. The GPU is responsible for all the calculation work of each iteration. The result of each calculation is used as the initial value of the next iteration. The whole process is carried out on the GPU, and no data is exchanged with the CPU. Figure 1(d) shows the execution process of the OpenCL program in the GPU. The work-group is mapped to the CU of the hardware
for execution. After all threads of a work-group are executed, the execution of the work-group is completed. For the CU, its resources are fixed in a particular CU, which limits the number of work-groups in the CU that are in the scheduling state at the same time. If the number of resources is sufficient in the CU, multiple work-groups are mapped to the same CU, and those work-groups are in the scheduling state at the same time. When all threads of the work-group in the execution state are waiting for resources to change to the waiting state, different work-groups switch from the ready state to the arithmetic logic unit execution status. The cycle ends when the calculation is converged, and then the data in GPU memory is transferred to the host memory through the PCI-E bus.
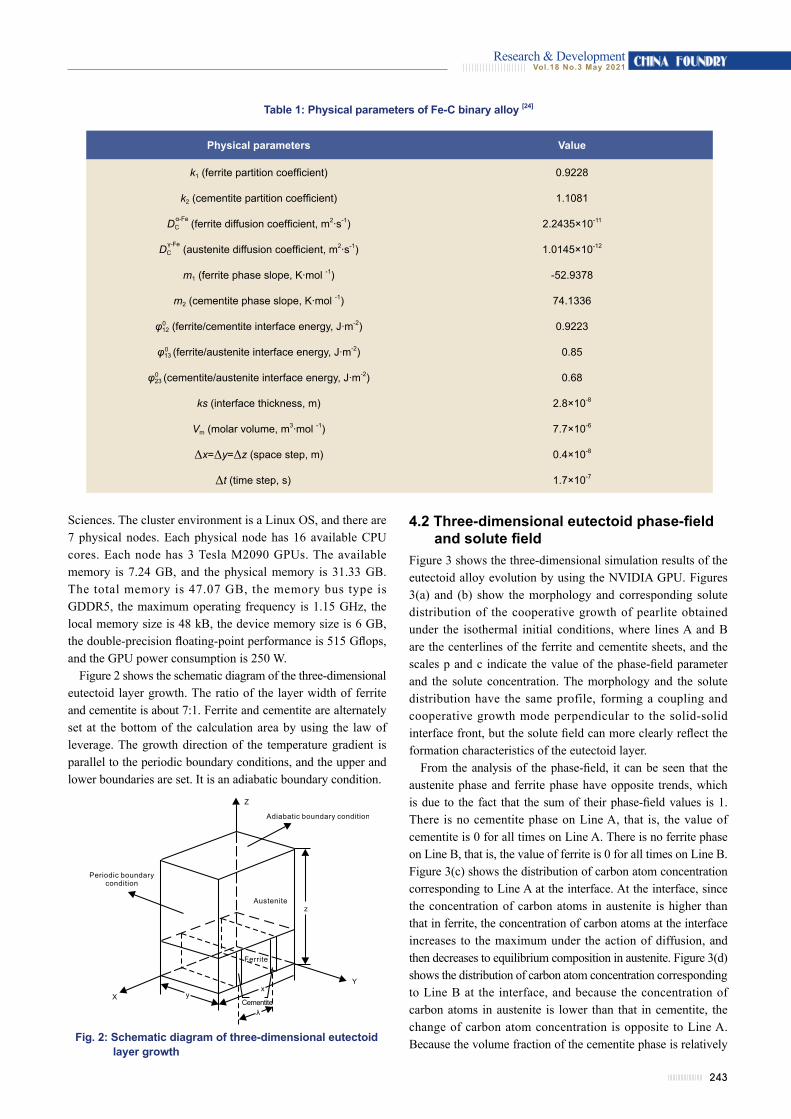
4 Simulation results and discussion4.1 Initial conditions and physical parametersThis study takes Fe-C binary alloy as an example. The physical properties of the alloy are shown in Table 1 [24]. The eutectoid temperature corresponding to the eutectoid Fe-C alloy is 1,000 K. Below the eutectoid temperature, cementite and ferrite are precipitated, generally in a lamellar spacing structure, that is, lamellar pearlite. The total width of a pair of ferrite and cementite is called the pearlite layer spacing, which is represented by λ, and the law of its change with the subcooling degree is shown in the following equation:
where, C=8.02×10³ (nm·K), ΔT is the subcooling degree, that is, the difference between the equilibrium transformation temperature of pearlite and the eutectoid transformation temperature. The initial temperature of the eutectoid is set to 980 K, that is, the initial supercooling degree is 20 K, then the initial layer spacing is 0.4 µm.
The choice of simulation calculation parameters directly affects the simulation results. This study set the calculation area to a uniform grid of 800×31×1,000. To ensure numerical convergence during the solution process, the values of the space step and time step of the calculation model in three-dimensional space satisfy the following relationship:
(6)
1
where D is the solute diffusion coefficient, Δx, Δy, Δz are the space step parameters parallel to the X-axis, Y-axis and Z-axis in the three-dimensional space coordinate system, Δt is the time step parameter of the calculation model.
The experimental research was carried out on the high-performance heterogeneous platform of the Lanzhou Branch of the Institute of Modern Physics, Chinese Academy of
(5)T
243
CHINA FOUNDRYVol.18 No.3 May 2021Research & Development
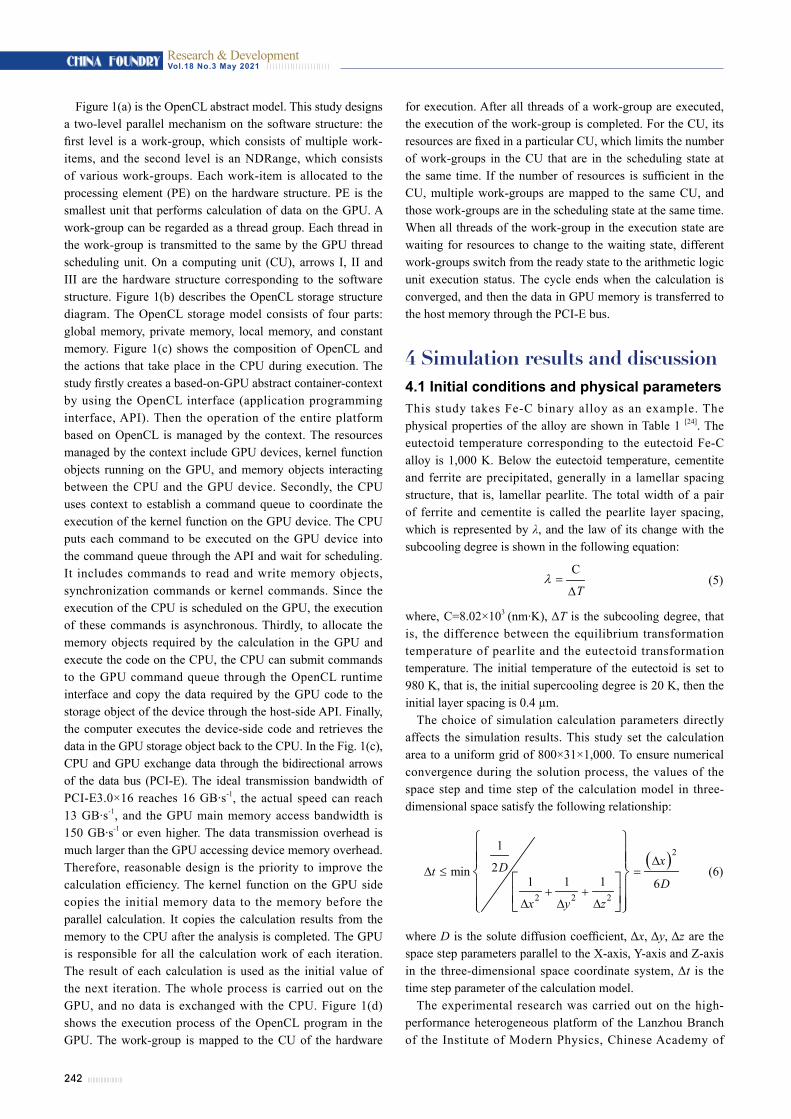
Fig. 2: Schematic diagram of three-dimensional eutectoid layer growth
Table 1: Physical parameters of Fe-C binary alloy [24]
4.2 Three-dimensional eutectoid phase-field and solute field
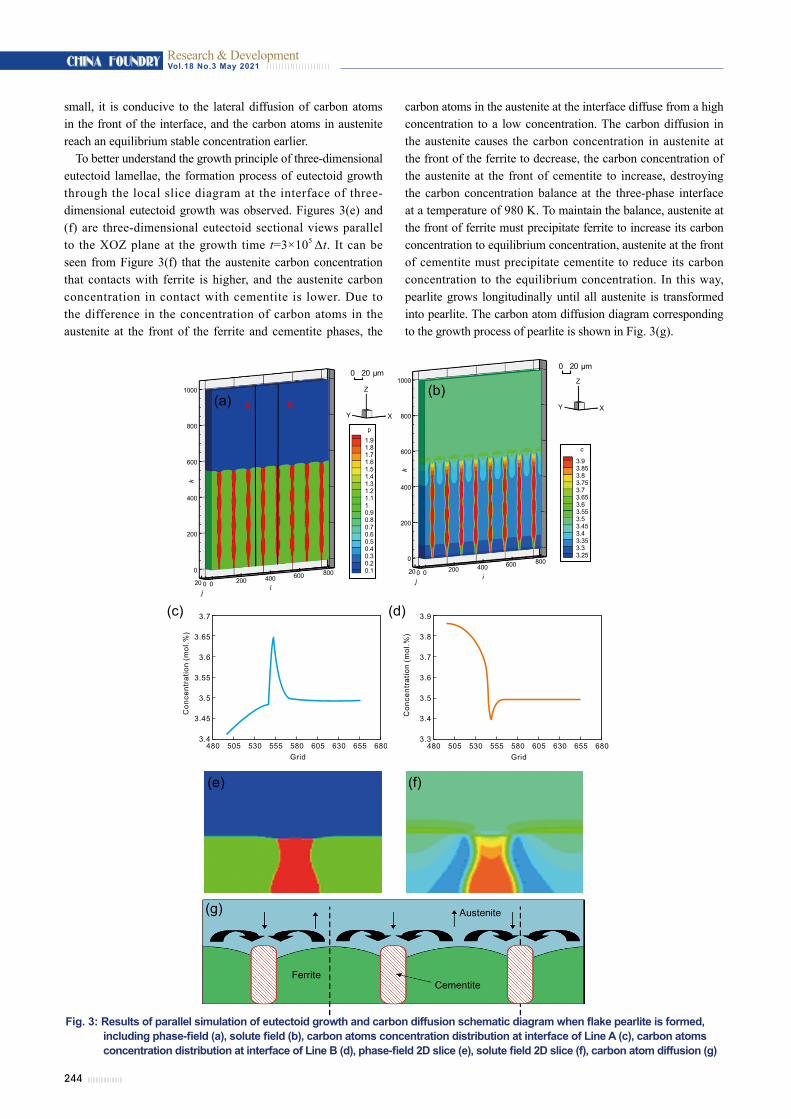
Figure 3 shows the three-dimensional simulation results of the eutectoid alloy evolution by using the NVIDIA GPU. Figures 3(a) and (b) show the morphology and corresponding solute distribution of the cooperative growth of pearlite obtained under the isothermal initial conditions, where lines A and B are the centerlines of the ferrite and cementite sheets, and the scales p and c indicate the value of the phase-field parameter and the solute concentration. The morphology and the solute distribution have the same profile, forming a coupling and cooperative growth mode perpendicular to the solid-solid interface front, but the solute field can more clearly reflect the formation characteristics of the eutectoid layer.
From the analysis of the phase-field, it can be seen that the austenite phase and ferrite phase have opposite trends, which is due to the fact that the sum of their phase-field values is 1. There is no cementite phase on Line A, that is, the value of cementite is 0 for all times on Line A. There is no ferrite phase on Line B, that is, the value of ferrite is 0 for all times on Line B. Figure 3(c) shows the distribution of carbon atom concentration corresponding to Line A at the interface. At the interface, since the concentration of carbon atoms in austenite is higher than that in ferrite, the concentration of carbon atoms at the interface increases to the maximum under the action of diffusion, and then decreases to equilibrium composition in austenite. Figure 3(d) shows the distribution of carbon atom concentration corresponding to Line B at the interface, and because the concentration of carbon atoms in austenite is lower than that in cementite, the change of carbon atom concentration is opposite to Line A. Because the volume fraction of the cementite phase is relatively
Sciences. The cluster environment is a Linux OS, and there are 7 physical nodes. Each physical node has 16 available CPU cores. Each node has 3 Tesla M2090 GPUs. The available memory is 7.24 GB, and the physical memory is 31.33 GB. The total memory is 47.07 GB, the memory bus type is GDDR5, the maximum operating frequency is 1.15 GHz, the local memory size is 48 kB, the device memory size is 6 GB, the double-precision floating-point performance is 515 Gflops, and the GPU power consumption is 250 W.
Figure 2 shows the schematic diagram of the three-dimensional eutectoid layer growth. The ratio of the layer width of ferrite and cementite is about 7:1. Ferrite and cementite are alternately set at the bottom of the calculation area by using the law of leverage. The growth direction of the temperature gradient is parallel to the periodic boundary conditions, and the upper and lower boundaries are set. It is an adiabatic boundary condition.
α-Fe
Physical parameters Value
k1 (ferrite partition coefficient) 0.9228
k2 (cementite partition coefficient) 1.1081
DC (ferrite diffusion coefficient, m2·s-1) 2.2435×10⁻¹¹
DC (austenite diffusion coefficient, m2·s-1) 1.0145×10⁻¹²
m1 (ferrite phase slope, K·mol -1) -52.9378
m2 (cementite phase slope, K·mol -1) 74.1336
φ12 (ferrite/cementite interface energy, J·m-2) 0.9223
φ13 (ferrite/austenite interface energy, J·m-2) 0.85
φ23 (cementite/austenite interface energy, J·m-2) 0.68
ks (interface thickness, m) 2.8×10⁻⁸
Vm (molar volume, m3·mol -1) 7.7×10⁻⁶
Δx=Δy=Δz (space step, m) 0.4×10⁻⁸
Δt (time step, s) 1.7×10⁻⁷
γ-Fe
0
0
0
α-Fe
244
CHINA FOUNDRY Vol.18 No.3 May 2021Research & Development
small, it is conducive to the lateral diffusion of carbon atoms in the front of the interface, and the carbon atoms in austenite reach an equilibrium stable concentration earlier.
To better understand the growth principle of three-dimensional eutectoid lamellae, the formation process of eutectoid growth through the local slice diagram at the interface of three-dimensional eutectoid growth was observed. Figures 3(e) and (f) are three-dimensional eutectoid sectional views parallel to the XOZ plane at the growth time t=3×10⁵ Δt. It can be seen from Figure 3(f) that the austenite carbon concentration that contacts with ferrite is higher, and the austenite carbon concentration in contact with cementite is lower. Due to the difference in the concentration of carbon atoms in the austenite at the front of the ferrite and cementite phases, the
Fig. 3: Results of parallel simulation of eutectoid growth and carbon diffusion schematic diagram when flake pearlite is formed, including phase-field (a), solute field (b), carbon atoms concentration distribution at interface of Line A (c), carbon atoms concentration distribution at interface of Line B (d), phase-field 2D slice (e), solute field 2D slice (f), carbon atom diffusion (g)
carbon atoms in the austenite at the interface diffuse from a high concentration to a low concentration. The carbon diffusion in the austenite causes the carbon concentration in austenite at the front of the ferrite to decrease, the carbon concentration of the austenite at the front of cementite to increase, destroying the carbon concentration balance at the three-phase interface at a temperature of 980 K. To maintain the balance, austenite at the front of ferrite must precipitate ferrite to increase its carbon concentration to equilibrium concentration, austenite at the front of cementite must precipitate cementite to reduce its carbon concentration to the equilibrium concentration. In this way, pearlite grows longitudinally until all austenite is transformed into pearlite. The carbon atom diffusion diagram corresponding to the growth process of pearlite is shown in Fig. 3(g).
(e) (f)
(c) (d)
(a)(b)
Ferrite
Austenite
Cementite
(g)
245
CHINA FOUNDRYVol.18 No.3 May 2021Research & Development
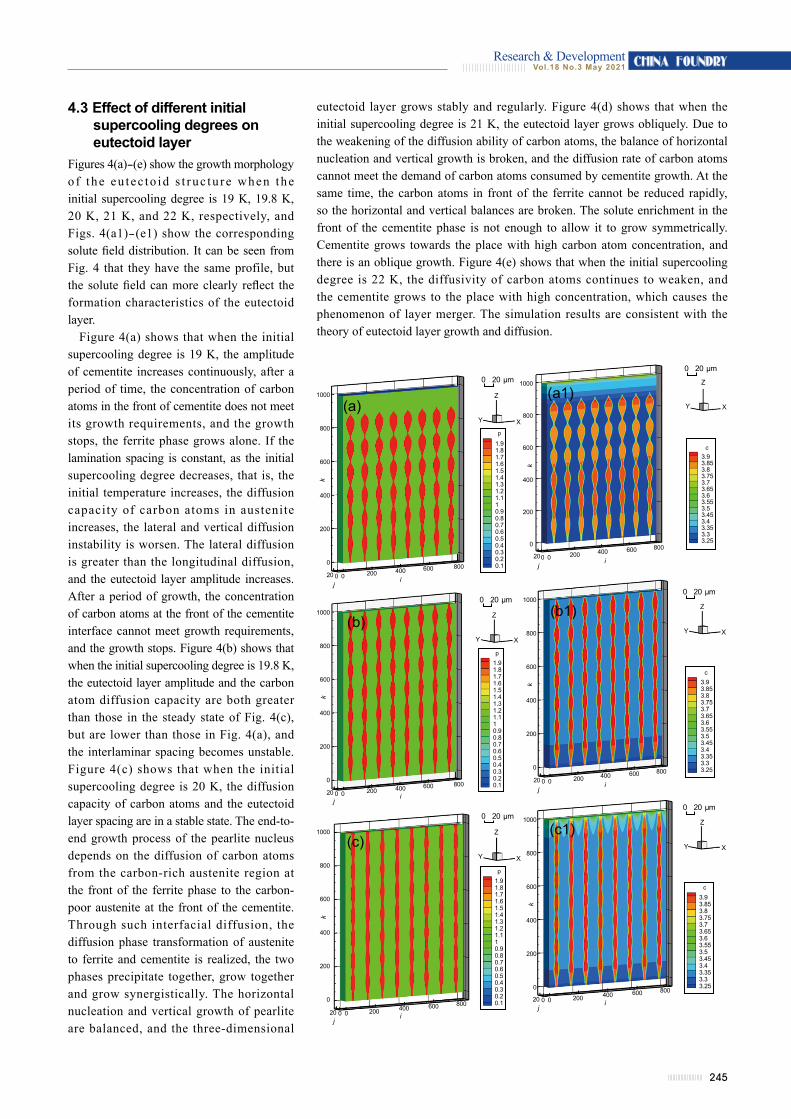
4.3 Effect of different initial supercooling degrees on eutectoid layer
Figures 4(a)-(e) show the growth morphology of the eu tec to id s t ruc tu re when theinitial supercooling degree is 19 K, 19.8 K, 20 K, 21 K, and 22 K, respectively, and Figs. 4(a1)-(e1) show the corresponding solute field distribution. It can be seen from Fig. 4 that they have the same profile, but the solute field can more clearly reflect the formation characteristics of the eutectoid layer.
Figure 4(a) shows that when the initial supercooling degree is 19 K, the amplitude of cementite increases continuously, after a period of time, the concentration of carbon atoms in the front of cementite does not meet its growth requirements, and the growth stops, the ferrite phase grows alone. If the lamination spacing is constant, as the initial supercooling degree decreases, that is, the initial temperature increases, the diffusion capacity of carbon atoms in austenite increases, the lateral and vertical diffusion instability is worsen. The lateral diffusion is greater than the longitudinal diffusion, and the eutectoid layer amplitude increases. After a period of growth, the concentration of carbon atoms at the front of the cementite interface cannot meet growth requirements, and the growth stops. Figure 4(b) shows that when the initial supercooling degree is 19.8 K, the eutectoid layer amplitude and the carbon atom diffusion capacity are both greater than those in the steady state of Fig. 4(c), but are lower than those in Fig. 4(a), and the interlaminar spacing becomes unstable. Figure 4(c) shows that when the initial supercooling degree is 20 K, the diffusion capacity of carbon atoms and the eutectoid layer spacing are in a stable state. The end-to-end growth process of the pearlite nucleus depends on the diffusion of carbon atoms from the carbon-rich austenite region at the front of the ferrite phase to the carbon-poor austenite at the front of the cementite. Through such interfacial diffusion, the diffusion phase transformation of austenite to ferrite and cementite is realized, the two phases precipitate together, grow together and grow synergistically. The horizontal nucleation and vertical growth of pearlite are balanced, and the three-dimensional
eutectoid layer grows stably and regularly. Figure 4(d) shows that when the initial supercooling degree is 21 K, the eutectoid layer grows obliquely. Due to the weakening of the diffusion ability of carbon atoms, the balance of horizontal nucleation and vertical growth is broken, and the diffusion rate of carbon atoms cannot meet the demand of carbon atoms consumed by cementite growth. At the same time, the carbon atoms in front of the ferrite cannot be reduced rapidly, so the horizontal and vertical balances are broken. The solute enrichment in the front of the cementite phase is not enough to allow it to grow symmetrically. Cementite grows towards the place with high carbon atom concentration, and there is an oblique growth. Figure 4(e) shows that when the initial supercooling degree is 22 K, the diffusivity of carbon atoms continues to weaken, and the cementite grows to the place with high concentration, which causes the phenomenon of layer merger. The simulation results are consistent with the theory of eutectoid layer growth and diffusion.
(a)
(b)
(c)
(a1)
(b1)
(c1)
246
CHINA FOUNDRY Vol.18 No.3 May 2021Research & Development
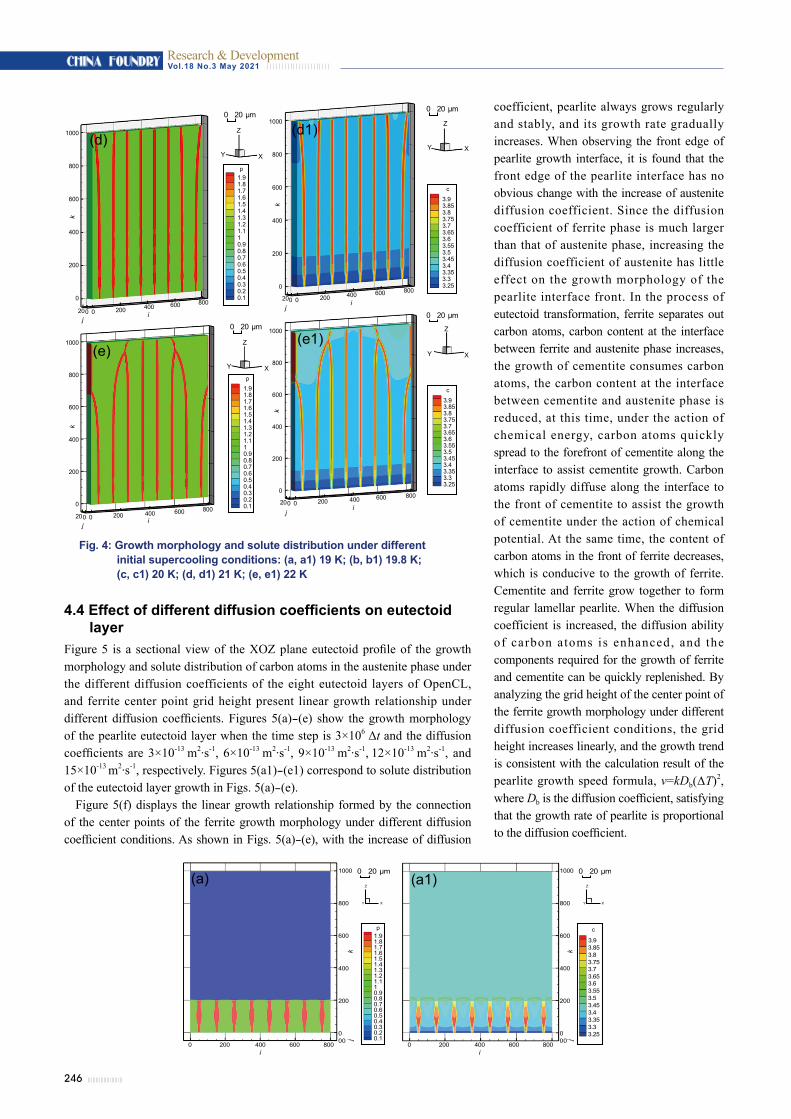
4.4 Effect of different diffusion coefficients on eutectoid layer
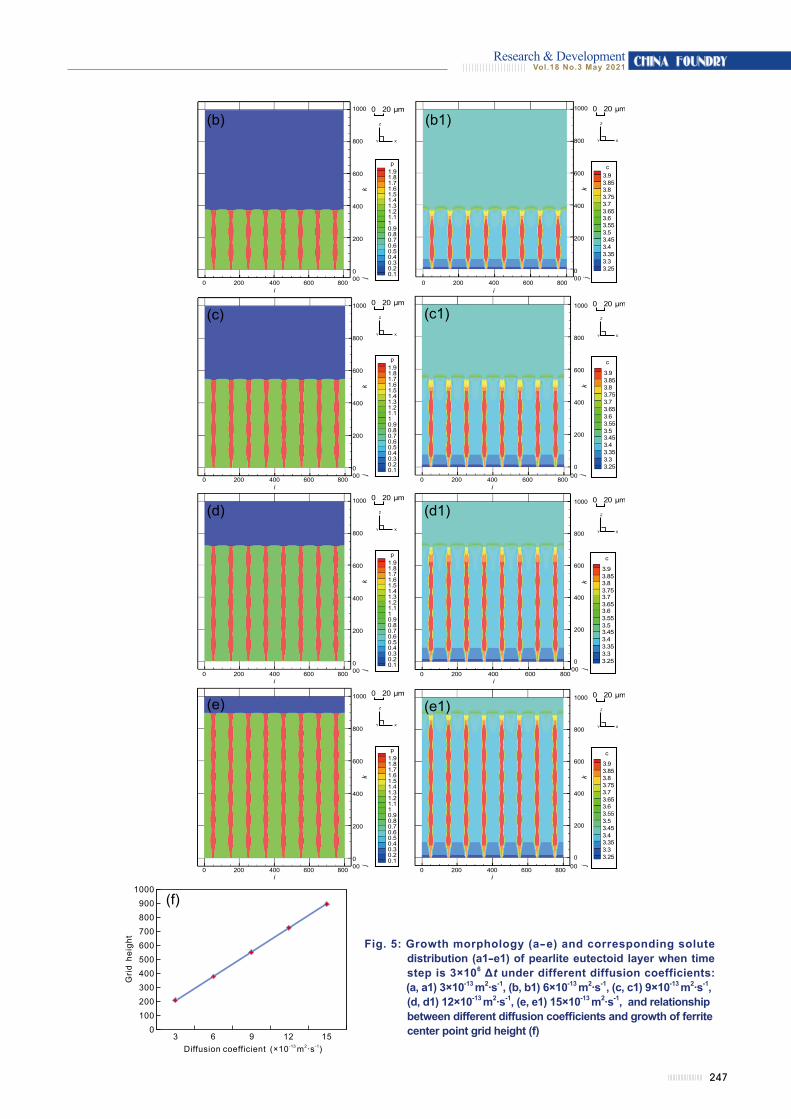
Figure 5 is a sectional view of the XOZ plane eutectoid profile of the growth morphology and solute distribution of carbon atoms in the austenite phase under the different diffusion coefficients of the eight eutectoid layers of OpenCL, and ferrite center point grid height present linear growth relationship under different diffusion coefficients. Figures 5(a)-(e) show the growth morphology of the pearlite eutectoid layer when the time step is 3×10⁶ Δt and the diffusion coefficients are 3×10-13 m2·s-1, 6×10-13 m2·s-1, 9×10-13 m2·s-1, 12×10-13 m2·s-1, and 15×10-13 m2·s-1, respectively. Figures 5(a1)-(e1) correspond to solute distribution of the eutectoid layer growth in Figs. 5(a)-(e).
Figure 5(f) displays the linear growth relationship formed by the connection of the center points of the ferrite growth morphology under different diffusion coefficient conditions. As shown in Figs. 5(a)-(e), with the increase of diffusion
coefficient, pearlite always grows regularly and stably, and its growth rate gradually increases. When observing the front edge of pearlite growth interface, it is found that the front edge of the pearlite interface has no obvious change with the increase of austenite diffusion coefficient. Since the diffusion coefficient of ferrite phase is much larger than that of austenite phase, increasing the diffusion coefficient of austenite has little effect on the growth morphology of the pearlite interface front. In the process of eutectoid transformation, ferrite separates out carbon atoms, carbon content at the interface between ferrite and austenite phase increases, the growth of cementite consumes carbon atoms, the carbon content at the interface between cementite and austenite phase is reduced, at this time, under the action of chemical energy, carbon atoms quickly spread to the forefront of cementite along the interface to assist cementite growth. Carbon atoms rapidly diffuse along the interface to the front of cementite to assist the growth of cementite under the action of chemical potential. At the same time, the content of carbon atoms in the front of ferrite decreases, which is conducive to the growth of ferrite. Cementite and ferrite grow together to form regular lamellar pearlite. When the diffusion coefficient is increased, the diffusion ability of carbon atoms is enhanced, and the components required for the growth of ferrite and cementite can be quickly replenished. By analyzing the grid height of the center point of the ferrite growth morphology under different diffusion coefficient conditions, the grid height increases linearly, and the growth trend is consistent with the calculation result of the pearlite growth speed formula, v=kDb(ΔT)2, where Db is the diffusion coefficient, satisfying that the growth rate of pearlite is proportional to the diffusion coefficient.
Fig. 4: Growth morphology and solute distribution under different initial supercooling conditions: (a, a1) 19 K; (b, b1) 19.8 K; (c, c1) 20 K; (d, d1) 21 K; (e, e1) 22 K
(d)
(e)
(d1)
(e1)
(a) (a1)
247
CHINA FOUNDRYVol.18 No.3 May 2021Research & Development
Fig. 5: Growth morphology (a-e) and corresponding solute distribution (a1-e1) of pearlite eutectoid layer when time step is 3×10⁶ Δt under different diffusion coefficients:
(a, a1) 3×10-13 m2·s-1, (b, b1) 6×10-13 m2·s-1, (c, c1) 9×10-13 m2·s-1, (d, d1) 12×10-13 m2·s-1, (e, e1) 15×10-13 m2·s-1, and relationship between different diffusion coefficients and growth of ferrite center point grid height (f)
(b)
(c)
(d)
(e)
(b1)
(c1)
(d1)
(e1)
(f)
248
CHINA FOUNDRY Vol.18 No.3 May 2021Research & Development
5 ConclusionIn this study, the OpenCL programming framework is used to implement the simulation of binary alloy eutectoid growth in a three-dimensional phase-field on a GPU cluster composed of NVIDIA Tesla M2090 GPU. Experimental results show that as the initial undercooling degree is 20 K, the phases of ferrite and cementite are eutectoid symbiosis, and pearlite grows regularly and stably in the direction perpendicular to the front of the solid-solid interface. When the initial undercooling degree decreases from 20 K to 19 K, that is, the temperature increases, and the diffusion ability of carbon atoms is enhanced, the amplitude of the eutectoid lamellar increases, the amplitude further expands, and the cementite stops growing. When the initial undercooling degree increases from 20 K to 22 K, the diffusion ability of carbon atoms is weakened, and the balance between horizontal and vertical diffusion is broken. The concentration of carbon atoms in the front edge of the cementite phase is not enough to allow it to grow steadily and regularly, and the cementite grows towards the place with high concentration, resulting in the phenomenon of inclined growth and lamellar merger. As the diffusion coefficient increases, the growth rate of pearlite increases linearly.
AcknowledgementsThis work was financially supported by the National Natural Science Foundation of China (Grant Nos. 51661020, 11504149 and 11364024) , the Postdoctoral Science Foundation of China (Grant No. 2014M560371) and the Funds for Distinguished Young Scientists of Lanzhou University of Technology (Grant No. J201304).
References[1] Lachowicz M M, Jasionowski R. Effect of cooling rate at
the eutectoid transformation temperature on the corrosion resistance of Zn-4Al alloy. Materials, 2020, 13(7): 1703-1717.
[2] Huang L H, Zhang R, Zhou X F, et al. Atomic interactions between Si and Mn during eutectoid transformation in high-carbon pearlitic steel. Journal of Applied Physics, 2019, 126(24): 245102.
[3] Cai Z H, Mao X P, Bao S Q, et al. Influence of vanadium microalloying on isothermal transformation behavior of eutectoid steel. Physics of Metals and Metallography, 2019, 120(10): 936-942.
[4] Anufriev N P, Maisuradze M V, Yudin Y V. Numerical simulation of structural transformations in hypoeutectoid low-alloy steels. Metal Science and Heat Treatment, 2011, 53(3): 189-194.
[5] Cai Z, Mao X P, Bao S Q, et al. Influence of vanadium microalloying on deformation-induced pearlite transformation of eutectoid steel. Metals, 2019, 9(2): 268-282.
[6] Sun Y Y, Zhao Y H, Zhao B J, et al. Phase-field modeling of microstructure evolution of Cu-rich phase in Fe-Cu-Mn-Ni-Al quinary system coupled with thermodynamic databases. Journal of Materials Science, 2019, 54: 11263-11278.
[7] Zhang Y M, Liu L L. Computational design of microstructures of textured ferroelectric ceramics by phase-field simulation. Computational Materials Science, 2019, 159: 24-31.
[8] Lu Y, Beckermann C, Ramirez J C. Three-dimensional phase-field simulations of the effect of convection on free dendritic growth. Journal of Crystal Growth, 2005, 280(1-2): 320-334.
[9] Zhang A, Guo Z P, Xiong S M. Phase-field-lattice Boltzmann study for lamellar eutectic growth in a natural convection melt. China Foundry, 2017, 14(5): 373-378.
[10 Zhang A, Du J L, Guo Z P, et al. Lamellar eutectic growth under forced convection: A phase-field lattice-Boltzmann study based on a modified Jackson-Hunt theory. Physical Review E, 2018, 98(4): 043301.
[11] Feng L, Feng X J, Lu Y, et al. Phase-field modeling of lamellar eutectic growth under the influence of fluid flow. Computational Materials Science, 2017, 137: 171-178.
[12] Ebrahimi Z. Modeling of eutectic formation in Al-Si alloy using a phase-field method. Archives of Metallurgy & Materials, 2017, 62(4): 1969-1981.
[13] Mushongera L T, Amos P G K, Nestler B, et al. Phase-field simulations of pearlitic divergence in Fe-C-Mn steels. Acta Materialia, 2018, 150: 78-87.
[14] Nakajima K, Tanaka Y, Hosoya Y, et al. Phase-field simulation of cooperative growth of pearlite. Materials Science Forum, 2007, 558-559: 1013-1020.
[15] Zhang J, Chen W X, Zheng C W, et al. Phase-field simulation of austenite-ferrite transformation in Fe-C-Mn ternary alloy. Acta Metallurgica Sinica, 2017, 53(6): 122-130. (In Chinese)
[16] Zhang A, Guo Z, Xiong S M. Eutectic pattern transition under different temperature gradients: A phase-field study coupled with the parallel adaptive-mesh-refinement algorithm. Journal of Applied Physics, 2017, 121(12): 125101.
[17] Aoki T, Ogawa S, Yamanaka A. Multiple-GPU scalability of phase-field simulation for dendritic solidification. In: Selected Papers of the Joint International Conference of Supercomputing in Nuclear Applications and Monte Carlo: SNA + MC, 2010. Progress in Nuclear Science & Technology, 2011, 2: 639-642.
[18] Yamanaka A, Aoki T, Ogawa S, et al. GPU-accelerated phase-field simulation of dendritic solidification in a binary alloy. Journal of Crystal Growth, 2011, 318(1): 40-45.
[19] Zhu C S, Deng Z Y, Feng L, et al. Simulation of eutectic growth using phase-field method and LBM based on OpenCL. Computational Materials Science, 2020, 176: 109523.
[20] Zhu C S, Liu J Q, Feng L, et al. Research on the simulation of PF-LBM model based on MPI+CUDA mixed granularity parallel. Aip Advances, 2018, 8(6): 065017.
[21] Liu Q S, Wang W Q, Ma H. Parallelized combined finite-discrete element (FDEM) procedure using multi-GPU with CUDA. International Journal for Numerical and Analytical Methods in Geomechanics, 2020, 44(2): 208-238.
[22] Warren C, Giannopoulos A, Gray A, et al. A CUDA-based GPU engine for gprMax: Open source FDTD electromagnetic simulation software. Computer Physics Communications, 2019, 237: 208-218.
[23] Kim S G, Kim W T, Suzuki T, et al. Phase-field modeling of eutectic solidification. Journal of Crystal Growth, 2004, 261(1): 135-158.
[24] Feng L, Lu N N, Gao Y L, et al. Mult iphase numerical simulations of binary alloy lamellar eutectoid growth. IOP Conference Series Materials Science and Engineering, 2018, 381(1): 012176.