three-dimensional effects of a deep excavation on wall
TRANSCRIPT
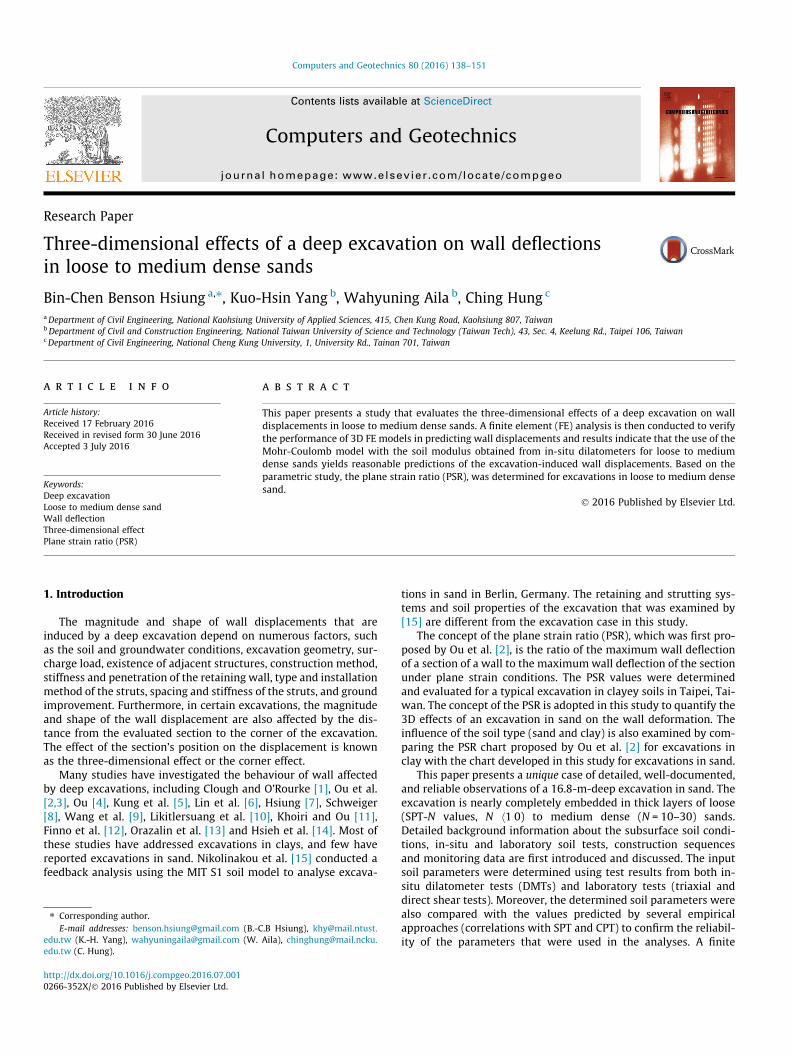
Computers and Geotechnics 80 (2016) 138–151
Contents lists available at ScienceDirect
Computers and Geotechnics
journal homepage: www.elsevier .com/ locate/compgeo
Research Paper
Three-dimensional effects of a deep excavation on wall deflectionsin loose to medium dense sands
http://dx.doi.org/10.1016/j.compgeo.2016.07.0010266-352X/� 2016 Published by Elsevier Ltd.
⇑ Corresponding author.E-mail addresses: [email protected] (B.-C.B Hsiung), [email protected].
edu.tw (K.-H. Yang), [email protected] (W. Aila), [email protected] (C. Hung).
Bin-Chen Benson Hsiung a,⇑, Kuo-Hsin Yang b, Wahyuning Aila b, Ching Hung c
aDepartment of Civil Engineering, National Kaohsiung University of Applied Sciences, 415, Chen Kung Road, Kaohsiung 807, TaiwanbDepartment of Civil and Construction Engineering, National Taiwan University of Science and Technology (Taiwan Tech), 43, Sec. 4, Keelung Rd., Taipei 106, TaiwancDepartment of Civil Engineering, National Cheng Kung University, 1, University Rd., Tainan 701, Taiwan
a r t i c l e i n f o a b s t r a c t
Article history:Received 17 February 2016Received in revised form 30 June 2016Accepted 3 July 2016
Keywords:Deep excavationLoose to medium dense sandWall deflectionThree-dimensional effectPlane strain ratio (PSR)
This paper presents a study that evaluates the three-dimensional effects of a deep excavation on walldisplacements in loose to medium dense sands. A finite element (FE) analysis is then conducted to verifythe performance of 3D FE models in predicting wall displacements and results indicate that the use of theMohr-Coulomb model with the soil modulus obtained from in-situ dilatometers for loose to mediumdense sands yields reasonable predictions of the excavation-induced wall displacements. Based on theparametric study, the plane strain ratio (PSR), was determined for excavations in loose to medium densesand.
� 2016 Published by Elsevier Ltd.
1. Introduction
The magnitude and shape of wall displacements that areinduced by a deep excavation depend on numerous factors, suchas the soil and groundwater conditions, excavation geometry, sur-charge load, existence of adjacent structures, construction method,stiffness and penetration of the retaining wall, type and installationmethod of the struts, spacing and stiffness of the struts, and groundimprovement. Furthermore, in certain excavations, the magnitudeand shape of the wall displacement are also affected by the dis-tance from the evaluated section to the corner of the excavation.The effect of the section’s position on the displacement is knownas the three-dimensional effect or the corner effect.
Many studies have investigated the behaviour of wall affectedby deep excavations, including Clough and O’Rourke [1], Ou et al.[2,3], Ou [4], Kung et al. [5], Lin et al. [6], Hsiung [7], Schweiger[8], Wang et al. [9], Likitlersuang et al. [10], Khoiri and Ou [11],Finno et al. [12], Orazalin et al. [13] and Hsieh et al. [14]. Most ofthese studies have addressed excavations in clays, and few havereported excavations in sand. Nikolinakou et al. [15] conducted afeedback analysis using the MIT S1 soil model to analyse excava-
tions in sand in Berlin, Germany. The retaining and strutting sys-tems and soil properties of the excavation that was examined by[15] are different from the excavation case in this study.
The concept of the plane strain ratio (PSR), which was first pro-posed by Ou et al. [2], is the ratio of the maximum wall deflectionof a section of a wall to the maximumwall deflection of the sectionunder plane strain conditions. The PSR values were determinedand evaluated for a typical excavation in clayey soils in Taipei, Tai-wan. The concept of the PSR is adopted in this study to quantify the3D effects of an excavation in sand on the wall deformation. Theinfluence of the soil type (sand and clay) is also examined by com-paring the PSR chart proposed by Ou et al. [2] for excavations inclay with the chart developed in this study for excavations in sand.
This paper presents a unique case of detailed, well-documented,and reliable observations of a 16.8-m-deep excavation in sand. Theexcavation is nearly completely embedded in thick layers of loose(SPT-N values, N h1 0) to medium dense (N = 10–30) sands.Detailed background information about the subsurface soil condi-tions, in-situ and laboratory soil tests, construction sequencesand monitoring data are first introduced and discussed. The inputsoil parameters were determined using test results from both in-situ dilatometer tests (DMTs) and laboratory tests (triaxial anddirect shear tests). Moreover, the determined soil parameters werealso compared with the values predicted by several empiricalapproaches (correlations with SPT and CPT) to confirm the reliabil-ity of the parameters that were used in the analyses. A finite
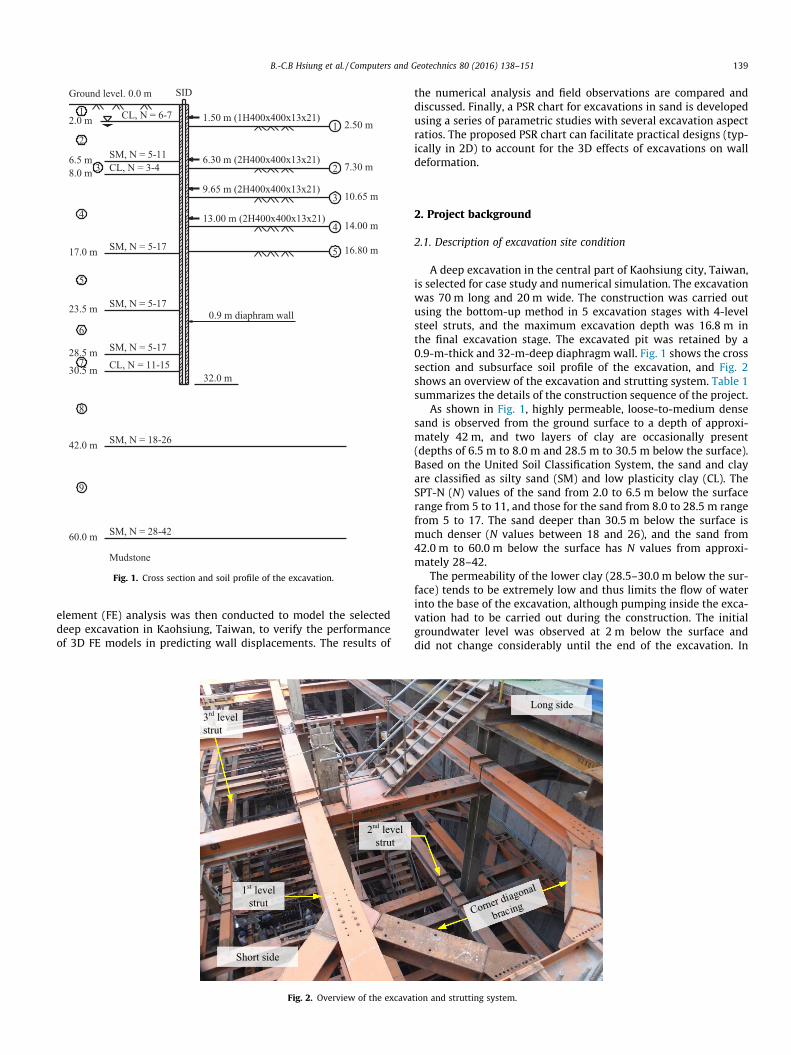
Fig. 1. Cross section and soil profile of the excavation.
B.-C.B Hsiung et al. / Computers and Geotechnics 80 (2016) 138–151 139
element (FE) analysis was then conducted to model the selecteddeep excavation in Kaohsiung, Taiwan, to verify the performanceof 3D FE models in predicting wall displacements. The results of
Short side
1st level strut
2nd level strut
3rd level strut
Fig. 2. Overview of the excava
the numerical analysis and field observations are compared anddiscussed. Finally, a PSR chart for excavations in sand is developedusing a series of parametric studies with several excavation aspectratios. The proposed PSR chart can facilitate practical designs (typ-ically in 2D) to account for the 3D effects of excavations on walldeformation.
2. Project background
2.1. Description of excavation site condition
A deep excavation in the central part of Kaohsiung city, Taiwan,is selected for case study and numerical simulation. The excavationwas 70 m long and 20 m wide. The construction was carried outusing the bottom-up method in 5 excavation stages with 4-levelsteel struts, and the maximum excavation depth was 16.8 m inthe final excavation stage. The excavated pit was retained by a0.9-m-thick and 32-m-deep diaphragm wall. Fig. 1 shows the crosssection and subsurface soil profile of the excavation, and Fig. 2shows an overview of the excavation and strutting system. Table 1summarizes the details of the construction sequence of the project.
As shown in Fig. 1, highly permeable, loose-to-medium densesand is observed from the ground surface to a depth of approxi-mately 42 m, and two layers of clay are occasionally present(depths of 6.5 m to 8.0 m and 28.5 m to 30.5 m below the surface).Based on the United Soil Classification System, the sand and clayare classified as silty sand (SM) and low plasticity clay (CL). TheSPT-N (N) values of the sand from 2.0 to 6.5 m below the surfacerange from 5 to 11, and those for the sand from 8.0 to 28.5 m rangefrom 5 to 17. The sand deeper than 30.5 m below the surface ismuch denser (N values between 18 and 26), and the sand from42.0 m to 60.0 m below the surface has N values from approxi-mately 28–42.
The permeability of the lower clay (28.5–30.0 m below the sur-face) tends to be extremely low and thus limits the flow of waterinto the base of the excavation, although pumping inside the exca-vation had to be carried out during the construction. The initialgroundwater level was observed at 2 m below the surface anddid not change considerably until the end of the excavation. In
Long side
tion and strutting system.

Table 1Construction activities and sequence of the excavation in this study.
Construction sequence Construction period
Start End
Diaphragm wall installation 2012/09/19 2012/09/23Kingpost installation 2012/09/24 2012/10/02
Phase 1Dewatering 2012/10/03Excavation to 2.5 m below the surface 2012/10/12 2012/10/171st level strut installation at 1.5 m below the surface 2012/10/17 2012/10/21
Phase 2Dewatering 2012/10/15Excavation to 7.3 m below the surface 2012/10/22 2012/10/252nd level strut installation at 6.3 m below the surface 2012/10/26 2012/10/30
Phase 3Dewatering 2012/10/27Excavation to 10.65 m below the surface 2012/10/31 2012/11/033rd level strut installation at 9.65 m below the surface 2012/11/04 2012/11/07
Phase 4Dewatering 2012/11/07Excavation to 14.0 m below the surface 2012/11/08 2012/11/114th level strut installation at 13.0 m below the surface 2012/11/11 2012/11/14
Phase 5Dewatering 2012/11/11Excavation to 16.8 m below the surface 2012/11/15 2012/11/19
Casting of floor base slab 2012/11/30 2012/12/03Completion of the 1st slab at floor B4 2012/12/04 2012/12/12Completion of the 2nd slab at floor B3 2012/12/13 2013/01/02Completion of the 3rd slab at floor B2 2013/01/03 2013/01/19Completion of the 4th slab at floor B1 2013/01/20 2013/02/05Completion of the final slab at the ground floor 2013/02/06 2013/03/09
140 B.-C.B Hsiung et al. / Computers and Geotechnics 80 (2016) 138–151
contrast, the groundwater level remained from 0 m to 8 m belowthe excavation level during the construction stage.
2.2. In-situ monitoring and observations
The observations of the excavation are discussed in this section.The instruments that were used to monitor the behaviour of theground and structure due to the deep excavation include incli-nometers in both the diaphragm wall (SID) and soils (SIS), settle-
Fig. 3. Layout of instrumen
ment markers on the ground and buildings, building tiltmeters,observation wells inside and outside the excavation, and vibrationwire gauges (VG) on the strut. Fig. 3 shows the overall layout of theinstruments installed at the site.
The observations of lateral wall displacement are examinedfirst. The wall behaved first in cantilever-mode and then changedto prop-mode after the struts were installed. The corner effect islikely the reason for the wide variation in the maximum walldisplacement because the displacement measured by the
ts installed at the site.

(a)
(b)
0
5
10
15
20
25
30
35
0 20 40 60 80 100D
epth
(m)
Lateral wall displacement (mm)
Excavate to 2.5 mExcavate to 7.3 mExcavate to 10.6 mExcavate to 14.0 mExcavate to 16.8 m
1st strut
2nd strut
3rd strut
4th strut
0
5
10
15
20
25
30
35
-10 0 10 20 30 40
Dep
th (m
)
Lateral wall displacement (mm)
Excavate to 2.5 mExcavate to 7.3 mExcavate to 10.65 mExcavate to 14.0 mExcavate to 16.8 m
1st strut
2nd strut
3rd strut
4th strut
GL -16.8 m
GL -16.8 m
Fig. 4. Monitored wall displacements: (a) SID3; (b) SID4.
(a)
(b)
-5
0
5
10
15
20
25
300 2 4 6 8 10
Surf
ace
settl
emen
t (m
m)
Distance to diaphragm wall (m)
After kingpost installationAfter excavate to 2.5 mAfter excavate to 7.3 mAfter excavate to 10.65 mAfter excavate to 14.0 mAfter excavate to 16.8 m
-5
0
5
10
15
20
25
300 2 4 6 8 10
Surf
ace
settl
emen
t (m
m)
Distance to diaphragm wall (m)
After kingpost installationAfter excavate to 2.5 mAfter excavate to 7.3 mAfter excavate to 10.65 mAfter excavate to 14.0 mAfter excavate to 16.8 m
Fig. 5. Selected surface settlement measurements: (a) Section 1 (at the corner ofthe wall); (b) Section 4 (at the centre of the long wall).
B.-C.B Hsiung et al. / Computers and Geotechnics 80 (2016) 138–151 141
inclinometer located on the short side is considerably smaller thanthat measured by the inclinometer on the long side (Fig. 4). In thiscase, the maximum wall displacements on the short side and longside gradually increased as the excavation progressed to 8.6 mmand 54.4 mm, respectively, at the end of excavation.
Eight monitoring sections were installed to measure the groundsettlements outside the perimeter of the excavation. However,because the site is next to a main road with heavy traffic, reliablemeasurements can only be taken up to 3 m from the diaphragmwall. Fig. 5 shows the ground surface settlement measured fromSections 1 and 4. A shown in Fig. 3, Section 1 is located at the cor-ner of the wall, and Section 4 is located at the centre of the longside wall. The measurements indicate that the maximum surfacesettlement reaches approximately 25 mm at the end of the excava-tion, whereas the maximum surface settlement graduallydecreases as the measured section approaches the corner.
The strut loads were monitored continuously during the differ-ent excavation stages (Fig. 6). The maximum strut load wasapproximately 1500 kN from the 2nd to 4th level struts at the
end of the excavation. However, the maximum strut load of the1st level strut at the end of the excavation (Fig. 7) is considerablylower, which is likely because of the influence of the wall deforma-tion pattern as excavation progressed (i.e., small wall deformationat the top). Fig. 7 compares the distributed prop load (DPL) dia-grams that were proposed by Twine and Roscoe [16] and calcu-lated from the measured strut loads in this study to the apparentearth pressure diagrams for excavations in sand that were pro-posed by Peck [17]. Based on a database of the strut loads from ele-ven case histories of excavations in granular materials from the UK,the USA, Germany, Brazil and Japan, Twine and Roscoe [16] pro-posed that the DPL in sand can be calculated as:
p ¼ 0:2 � c � H ð1Þwhere p is the distributed prop load (kN/m), c is the unit weight ofthe granular soil, and H is the excavation depth. Notably, unlike theexcavation case in this study, none of the case histories compiled byTwine and Roscoe [16] was an excavation completely in loose tomedium dense sand.
Peck [17] proposed apparent earth pressure envelopes aftermaking observations of several braced cuts. Peck’s equation forsand is expressed as:

0
500
1000
1500
2000
10/20 10/30 11/9 11/19 11/29 12/9 12/19
Axi
al fo
rce
on st
rut (
kN)
Date
VG201 & 202VG203 & 204Numerical simulation
Fig. 6. Measured and predicted strut loads at the 2nd level strut (VG denotesvibration gauges for strut load measurements).
0
2
4
6
8
10
12
14
16
18
0 50 100 150 200
Dep
th (m
)
Distributed load (kN)
Twine and Roscoe [16]Peck [17]DPL from this study
Fig. 7. Comparison of the distributed prop load (DPL) and apparent earth pressurediagrams for excavations in sand.
0
2
4
6
8
10
12
14
16
18
20
9/13 9/23 10/3 10/13 10/23 11/2 11/12 11/22 12/2 12/12 12/22
Dep
th o
f gro
undw
ater
(m)Date
Inside the excavationOutside the excavation
Stage 1
Stage 2
Stage 3
Stage 4
Year: 2012Wall &kingpost installation
Stage 5
Permanent structure
construction
Fig. 8. Monitoring of groundwater levels inside and outside the excavation areaduring each construction stage (arrows indicate the construction period andexcavation depth).
142 B.-C.B Hsiung et al. / Computers and Geotechnics 80 (2016) 138–151
p ¼ 0:65Ka � c � H ð2Þwhere Ka is the active earth pressure coefficient, c is the unit weightof sand, and H is the excavation depth. In both Eqs. (1) and (2), theearth pressure and the water pressure below the groundwater tablewere calculated separately, and the unit weight of the soil should betaken as the submerged unit weight c0.
A comparison of the results in Fig. 7 shows that the apparentearth pressure diagram for sand suggested by Peck [17] and theDPL diagram by Twine and Roscoe [16] match well for these sub-surface soil conditions (i.e., sand with an average /0 of 33�). Theempirical equations by Twine and Roscoe [16] and Peck [17] gen-erally agree well with the DPL calculated in this study at depthsof 3–9 m. However, the two empirical methods, which involvethe increase of water pressure with depth in the calculation, over-estimate the distributed strut load at depths greater than 9 m.Because this comparison is based on only one measured DPL, addi-tional case histories for excavations in loose to medium dense sandshould be compiled for further evaluation and comparison.
Fig. 8 shows the variation of the groundwater levels inside andoutside the excavation area. Because the excavation has to be con-ducted in high permeability sand with a shallow groundwatertable (i.e., 3 m below the surface), pumping inside the excavationis essential to keep the water table at least 1 m below the excava-tion level. Therefore, the groundwater table inside the excavationgradually decreased as the excavation progressed. As a result ofthe impermeable reinforced concrete diaphragmwall and the pres-ence of an impermeable clay layer near the toe of the wall, thegroundwater table outside the excavation area seems to not beaffected by pumping the water inside the excavation. Finally, theimpacts of the excavation on the adjacent buildings were inspectedand considered insignificant because limited settlement and tiltingof the buildings were detected at the end of the excavation.
3. Soil Tests and determination of soil properties
3.1. In-situ soil tests
Fig. 9 shows detailed information from 3 boreholes (BH1, BH5 &BH7) located on site or nearby, including the profiles of the SPT-Nvalues, sand and fines contents and void ratios (related to soil den-sity) with depth. The N values remain lower than 10 to depths ofapproximately 10 m below the surface and less than 30 until adepth of 40 m. In most of the borehole logs, the sand contentsare very high (between 80% and 90%) to the final excavation level(i.e., 16.8 m below the ground surface). The void ratios are also
large (approximately 0.6 to 1.0), which indicates that the sand isloose to medium dense. The total unit weight of the soil rangesfrom 18.0 to 21.0 kN/m3, and the water contents below thegroundwater level range from 18% to 31%.
The SPT is a simple and useful in-situ test that is widely appliedin various foundation design standards and codes worldwide, suchas that of the Architectural Institute of Japan [18]. By collectingdata from different soils, Stroud [19] developed empirical correla-tions of SPT-N values with soil shear strength and stiffness proper-ties. Skempton [20] analysed data with SPT-N, effective verticalstress r0
v and relative density information and demonstrated a lin-ear relationship between N and r0
v in sand. Fig. 10 shows a linearrelationship between SPT-N and r0
v for the excavation in sand inthis study, which supports the observations of Skempton [20].
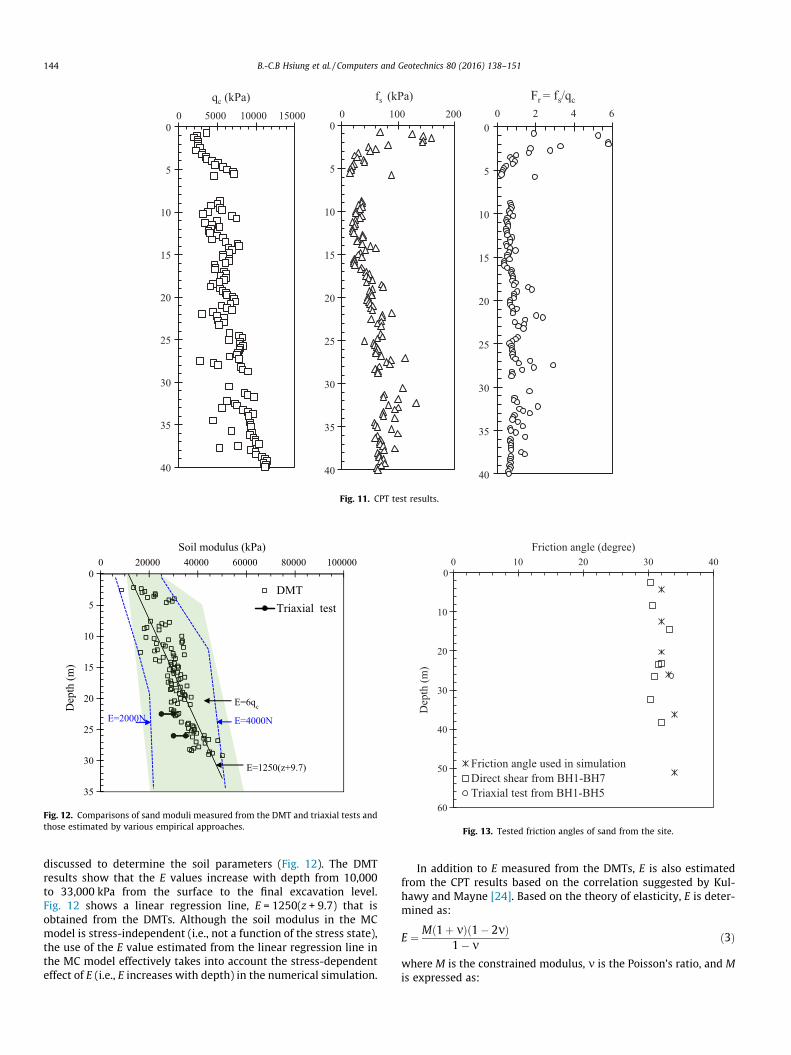
In addition to the SPT-N values and the soil physical propertiesthat were evaluated, a series of DMTs and CPTs were conducted tofurther confirm the reliability of the soil strength and deformationparameters that were determined in this study. The maximumdepths of the boreholes for the DMTs and CPTs were 30 m and40 m, respectively. Fig. 11 shows the CPT readings, including thelogs of the tip resistance qc, side friction fs and friction ratio Fr. At

(a) (b) (c) (d)
0
5
10
15
20
25
30
35
40
45
0 10 20 30 40
Dep
th(m
)
SPT-N
BH1 BH5 BH7
0
5
10
15
20
25
30
35
40
45
0 50 100
Sand content (%)
BH1 BH5 BH7
0
5
10
15
20
25
30
35
40
45
0 50 100
Fine content(%)
BH1 BH5 BH7
0
5
10
15
20
25
30
35
40
45
0 0.5 1 1.5Void ratio
BH1 BH5 BH7
Fig. 9. Information from borehole logs: (a) SPT-N; (b) sand content; (c) fines content; and (d) void ratio.
Fig. 10. Relationship between SPT-N value and r0v in sand.
B.-C.B Hsiung et al. / Computers and Geotechnics 80 (2016) 138–151 143
the final excavation level, qc reached 6000 kPa, and fs reachedapproximately 45 kPa. The detailed test results of the DMTs anda comparison with the soil modulus estimated from the SPT andCPT correlations are discussed later.
3.2. Soil modulus and shear strength properties
Many previous studies have applied and assessed soil modelsfor excavation modelling. Powire et al. [21] applied three soil con-stitutive models, namely the Mohr-Coulomb (MC) model, BRICKmodel, and Schofield model based on critical state soil mechanics,to simulate wall displacements induced by deep excavations inLondon clay and concluded that the wall movement predicted bythe FE analyses depended more on the soil modulus than on thesoil model. However, the calculated ground movement dependson both the soil model and the soil stiffness. Powire et al. [21] alsofound that all three soil models predicted ground heaves of up to20 mm immediately behind the wall, and the MC model predicteda very large settlement (50 mm) at the far end of the excavation(approximately 50 m from the excavation). Jardine et al. [22] stud-ied an excavation in London clay numerically using a non-linearsoil model to accurately analyse the soil-structure interaction. Bur-land and Kalra [23] investigated the excavations for the Queen Eliz-abeth II Conference Centre in London Clay. Two types of soilmoduli, undrained and drained, were considered for the analyses.Unlike the excavation in clay in Burland and Kalra [23], the excava-tion in this study is situated in very deep and thick loose sand, sothe drained modulus, rather than the undrained modulus, is antic-ipated to play a key role.
In this study, the linearly elastic-perfect plastic MC model isadopted for the numerical simulation. The MC model has fiveparameters, including the friction angle /, cohesion c, Young’smodulus E, Poisson’s ratio m, and dilatation angle w. Because thesoil modulus plays a key role in calculating the wall movementinduced by an excavation, the soil moduli obtained from the in-situ and lab tests and estimated from empirical correlations are
0
5
10
15
20
25
30
35
40
0 5000 10000 15000
qc (kPa)
0
5
10
15
20
25
30
35
40
0 100 200
fs (kPa)
0
5
10
15
20
25
30
35
40
0 2 4 6Fr = fs/qc
Fig. 11. CPT test results.
0
5
10
15
20
25
30
35
0 20000 40000 60000 80000 100000
Dep
th (m
)
Soil modulus (kPa)
DMTTriaxial test
E=4000NE=2000N
E=6qc
E=1250(z+9.7)
Fig. 12. Comparisons of sand moduli measured from the DMT and triaxial tests andthose estimated by various empirical approaches.
0
10
20
30
40
50
60
0 10 20 30 40
Dep
th (m
)
Friction angle (degree)
Friction angle used in simulationDirect shear from BH1-BH7Triaxial test from BH1-BH5
Fig. 13. Tested friction angles of sand from the site.
144 B.-C.B Hsiung et al. / Computers and Geotechnics 80 (2016) 138–151
discussed to determine the soil parameters (Fig. 12). The DMTresults show that the E values increase with depth from 10,000to 33,000 kPa from the surface to the final excavation level.Fig. 12 shows a linear regression line, E = 1250(z + 9.7) that isobtained from the DMTs. Although the soil modulus in the MCmodel is stress-independent (i.e., not a function of the stress state),the use of the E value estimated from the linear regression line inthe MC model effectively takes into account the stress-dependenteffect of E (i.e., E increases with depth) in the numerical simulation.
In addition to E measured from the DMTs, E is also estimatedfrom the CPT results based on the correlation suggested by Kul-hawy and Mayne [24]. Based on the theory of elasticity, E is deter-mined as:
E ¼ Mð1þ mÞð1� 2mÞ1� m
ð3Þ
where M is the constrained modulus, m is the Poisson’s ratio, and Mis expressed as:

60 m
32 m
Diaphragm wall (t = 0.9 m)
Strut2H400x400x13x21 Strut
1H400x400x13x21
60 m
(a)
(b)
(c)
Fig. 14. Finite element model: (a) 3D benchmark model; (b) details of structural elements; (c) 3D plane strain model for the reference for the calculation of the PSR.
B.-C.B Hsiung et al. / Computers and Geotechnics 80 (2016) 138–151 145
M ¼ aqc ð4Þwhere a is a dimensionless coefficient that is closely related to thesoil’s relative density, which typically ranges from 3 to 8 for nor-mally consolidated sand, and qc is the tip resistance of the CPT. Con-sidering the low N value as well as the high void ratio of the loosesand at the site, a = 8 and m = 0.3 are input into Eqs. (3) and (4), so Eis calculated as:
E ¼ 6qc ð5Þ
The values of E interpreted from the CPT results are plotted inFig. 12 and are consistent with the values obtained from theDMT measurements.
The value of E is also estimated using SPT correlations. Based ona series of back analyses of monitoring data, Hsiung [7] suggested acorrelation between E and SPT-N as follows:
E ¼ 2000 NðkPaÞ ð6Þ

Table 2Input parameters of the MC model for sand layers using the effective stress and a drained analysis.
Layer Depth (m) Soil type c (kN/m3) N average /0 (�) c0 (kPa) E0 (kPa) m0 w (�)
2 2.0–6.5 SM 20.9 8 32 0.5 21,500 0.3 24 8.0–17.0 SM 20.6 11 32 0.5 27,753 0.3 25 17.0–23.5 SM 18.6 11 32 0.5 37,440 0.3 26 23.5–28.5 SM 19.6 11 33 0.5 44,628 0.3 38 30.5–42.0 SM 19.6 22 34 0.5 57,449 0.3 49 42.0–60.0 SM 19.9 35 34 0.5 75,878 0.3 4
Table 3Input parameters of the MC model for clay layers using the total stress and anundrained analysis.
Layer Depth (m) Soil type c (kN/m3) Su (kPa) Eu (kPa) mu
1 0.0–2.0 CL 19.3 28 14,000 0.4953 6.5–8.0 CL 19.7 21 10,500 0.4957 28.0–30.5 CL 18.6 84 42,000 0.495
Table 4Input parameters for the diaphragm wall.
Parameter Name Value Unit
Compressive strength of concrete f0c 28 MPaThickness d 0.9 mYoung’s modulus E 24.8 � 106 kPaYoung’s modulus � 70% 70%E 17.36 � 106 kPaUnit weight w 5.5 kN/m3
Poisson’s ratio m 0.2
146 B.-C.B Hsiung et al. / Computers and Geotechnics 80 (2016) 138–151
Stroud [19] presented a relationship between E and N values bycollecting data from different soils, and he suggested that Edecreases as the soil strain increases. Within the proper strainrange of a retaining wall (�0.1%), Yong [25] suggested that E canbe estimated as:
E ¼ 4000 N ðkPaÞ ð7ÞIn addition, the Architectural Institute of Japan [18] recom-
mended using E = 2800 N (unit in kPa), which is also commonlyadopted for engineering practice. Fig. 12 shows the E values esti-mated from 2000 N to 4000 N. The E values estimated by the SPTcorrelations match the E values obtained from the CPT correlationsand the DMT measurements.
Additionally, Fig. 12 shows two secant E values at strains of 0.1–0.3% (typical range of strains in deep excavations) interpreted fromthe triaxial stress-strain curves of sand specimens that were sam-pled from depths of 24 and 26 m. The secant E values range from27,500 to 30,000 kPa, which are at the lower bound of the E valuesmeasured from the DMTs (Fig. 12). The lower values of E arethought to be caused by sample disturbance.
Finally, the E values based on linear regression from the DMTtests are used as an input for the subsequent FE analysis. The E val-ues estimated by 2000 N and 4000 N are also selected for the FEanalysis for comparison. As shown in Fig. 12, the E values that weredirectly measured from the shallow DMTs tend to be higher thanthose interpreted from linear regression because of the influenceof stiff compacted backfill or the existence of old building founda-tions. As a result, an average value of E from the DMTs in the 1stlayer of sand was taken as an input instead of that from the linearregression.
Several sets of direct shear tests were conducted during the siteinvestigation phase to define the friction angle of the sand. Thefriction angle adopted in the analysis was thus taken from directshear tests of soil samples that were collected from the construc-tion site. Fig. 13 shows the friction angles of the sand, which rangefrom 32 to 34 degrees and agree well with the direct shear and
Table 5Input parameters for steel struts.
Strut level Strut level Preload (kN)
Level 1 1H400 � 400 � 13 � 21 450Level 2 2H400 � 400 � 13 � 21 1000Level 3 2H400 � 400 � 13 � 21 1400Level 4 2H400 � 400 � 13 � 21 1400
triaxial test results from nearby boreholes. This further confirmsthe reliability of the friction angle values used in the FE analyses.
4. Finite element analyses
4.1. Soil model and input properties
A three-dimensional FE analysis, called a ‘‘benchmark analysis”,was conducted to simulate the excavation in this study. The com-mercial software PLAXIS 3D, version 2013, was used as a numericaltool for the 3D analyses. Fig. 14 shows the 3D FE model of thebenchmark analysis. The FE model consists of 50,364 ten-nodetetrahedral elements with a total of 76,588 nodes. The dimensionsof the FE model are 310 m � 260 m � 60 m. The base of the modelwas placed at the top of the mudstone layer, which is at a depth of60 m below the ground surface. The distance from the lateralboundaries of the model to the retaining wall was 120 m, whichis approximately seven times the excavation depth; this was sug-gested by Khoiri and Ou [11] for numerical modelling of deep exca-vations. Standard fixed conditions were applied to the FE model;horizontal movement was restrained on the lateral boundaries,and both horizontal and vertical movements were restrained onthe bottom boundary of the model. Details of the structural ele-ments (i.e., struts and diaphragm walls) and a 3D plane strainmodel for reference in the calculation of the PSR are also shownin Fig. 14b and c, respectively.
This study focuses on the 3D effects of the excavation on thewall deformation and the PSR value interpreted from the maxi-mum lateral wall displacement. According to previous studies byPowire et al. [21], Ou [4], Kung et al. [5], Schweiger [8] and Khoiriand Ou [11], the constitutive soil model that is adopted in thenumerical analysis has only a minor influence on the predictedwall displacements. Furthermore, limited information about someinput soil properties and the considerably high computational costlimit the application of advanced constitutive soil models in 3D
Section area (m2) EA (kN) 60%EA (kN)
0.0219 4.59 � 106 2.75 � 106
0.0437 9.18 � 106 5.50 � 106
0.0437 9.18 � 106 5.50 � 106
0.0437 9.18 � 106 5.50 � 106
-35
-30
-25
-20
-15
-10
-5
00 20 40 60 80 100
Dep
th (m
)
Wall displacement (mm)
SID3E=DMTE=2000NE=4000N
-35
-30
-25
-20
-15
-10
-5
00 20 40 60 80 100
Dep
th (m
)
Wall displacement (mm)
SID3E=DMTE=2000NE=4000N
-35
-30
-25
-20
-15
-10
-5
00 20 40 60 80 100
Dep
th (m
)
Wall displacement (mm)
SID3E=DMTE=2000NE=4000N
-35
-30
-25
-20
-15
-10
-5
00 20 40 60 80 100
Dep
th (m
)Wall displacement (mm)
SID3E=DMTE=2000NE=4000N
1st strut
GL -2.5 m
3rd strut
GL -10.65 m
GL -16.8 m
4th strut
GL -14.0 m
1st strut
2nd strut
3rd strut
1st strut
2nd strut
4th strut
3rd strut
1st strut
2nd strut
(a) (b)
(c) (d)
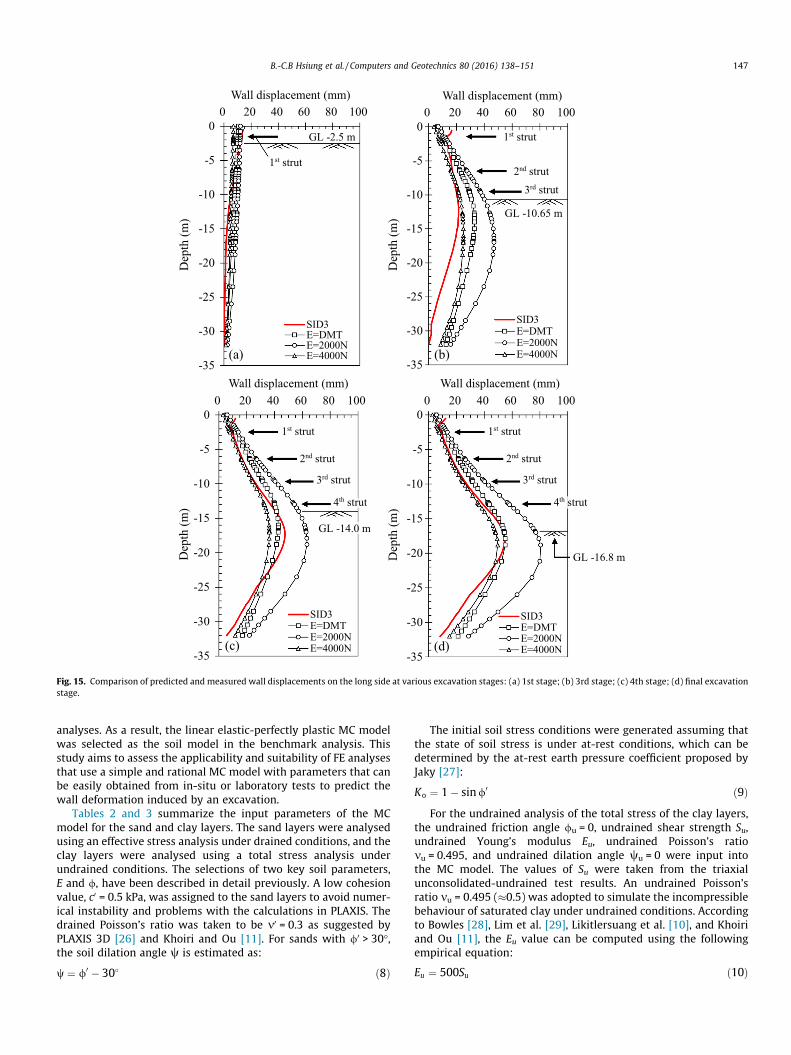
Fig. 15. Comparison of predicted and measured wall displacements on the long side at various excavation stages: (a) 1st stage; (b) 3rd stage; (c) 4th stage; (d) final excavationstage.
B.-C.B Hsiung et al. / Computers and Geotechnics 80 (2016) 138–151 147
analyses. As a result, the linear elastic-perfectly plastic MC modelwas selected as the soil model in the benchmark analysis. Thisstudy aims to assess the applicability and suitability of FE analysesthat use a simple and rational MC model with parameters that canbe easily obtained from in-situ or laboratory tests to predict thewall deformation induced by an excavation.
Tables 2 and 3 summarize the input parameters of the MCmodel for the sand and clay layers. The sand layers were analysedusing an effective stress analysis under drained conditions, and theclay layers were analysed using a total stress analysis underundrained conditions. The selections of two key soil parameters,E and /, have been described in detail previously. A low cohesionvalue, c0 = 0.5 kPa, was assigned to the sand layers to avoid numer-ical instability and problems with the calculations in PLAXIS. Thedrained Poisson’s ratio was taken to be m0 = 0.3 as suggested byPLAXIS 3D [26] and Khoiri and Ou [11]. For sands with /0 > 30�,the soil dilation angle w is estimated as:
w ¼ /0 � 30� ð8Þ
The initial soil stress conditions were generated assuming thatthe state of soil stress is under at-rest conditions, which can bedetermined by the at-rest earth pressure coefficient proposed byJaky [27]:
Ko ¼ 1� sin/0 ð9ÞFor the undrained analysis of the total stress of the clay layers,
the undrained friction angle /u = 0, undrained shear strength Su,undrained Young’s modulus Eu, undrained Poisson’s ratiomu = 0.495, and undrained dilation angle wu = 0 were input intothe MC model. The values of Su were taken from the triaxialunconsolidated-undrained test results. An undrained Poisson’sratio mu = 0.495 (�0.5) was adopted to simulate the incompressiblebehaviour of saturated clay under undrained conditions. Accordingto Bowles [28], Lim et al. [29], Likitlersuang et al. [10], and Khoiriand Ou [11], the Eu value can be computed using the followingempirical equation:
Eu ¼ 500Su ð10Þ

-35
-30
-25
-20
-15
-10
-5
0-10 0 10 20 30 40 50 60
Dep
th (m
)
Wall displacement (mm)
SID4E=DMTE=2000NE=4000N
-35
-30
-25
-20
-15
-10
-5
0-10 0 10 20 30 40 50 60
Dep
th (m
)
Wall displacement (mm)
SID4E=DMTE=2000NE=4000N
-35
-30
-25
-20
-15
-10
-5
0-10 0 10 20 30 40 50 60
Dep
th (m
)
Wall displacement (mm)
SID4E=DMTE=2000NE=4000N
-35
-30
-25
-20
-15
-10
-5
0-10 0 10 20 30 40 50 60
Dep
th (m
)Wall displacement (mm)
SID4E=DMTE=2000NE=4000N
1st strut
GL -2.5 m
3rd strut
GL -10.65 m
4th strut
GL -14.0 m GL -16.8 m
1st strut
2nd strut
3rd strut
1st strut
2nd strut
4th strut
3rd strut
1st strut
2nd strut
(a) (b)
(c) (d)
Fig. 16. Comparison of predicted and measured wall displacements on the short side at various excavation stages: (a) 1st stage; (b) 3rd stage; (c) 4th stage; (d) finalexcavation stage.
148 B.-C.B Hsiung et al. / Computers and Geotechnics 80 (2016) 138–151
Notably, the simulated clay layers have a minor influence on thewall behaviour because the clay layers at the site were very thincompared to the sand layers.
4.2. Structural model and input properties
Tables 4 and 5 list the input parameters of the diaphragm walland steel struts used in the analysis. The diaphragm wall was sim-ulated by plate elements, and the steel struts were modelled bynode-to-node anchor elements. The behaviours of both the plateelements and the node-to-node anchor elements were governedby the linear-elastic model, which requires two input parameters:Young’s modulus and Poisson’s ratio. Poisson’s ratio of the struc-tural elements was taken to be 0.2 for both the diaphragm walland the steel struts. The Young’s modulus of the diaphragm wallwas calculated by the formula of ACI Committee 318 [30] asfollows:
E ¼ 4700ffiffiffiffif 0c
qðMPaÞ ð11Þ
where f 0c ðMPaÞ is the standard compressive strength of the con-crete. The Young’s modulus of the steel struts was assigned to be2.1 � 105 (MPa). As suggested by Ou [4], the stiffnesses of the dia-phragm wall and steel struts were reduced by 30% and 40% fromtheir nominal values, respectively, to consider defects and cracksin the diaphragm wall caused by the bending moments and toaccount for the stiffness reduction of the steel struts due to repeateduse and improper installation. The unit weight of the plate was sub-tracted from the unit weight of the soil because the wall was mod-elled as non-volume elements. The interface elements were alsoincluded in the simulation to represent the interaction betweenthe soil and the diaphragm wall. As suggested by Khoiri and Ou[11] and the default value suggested by PLAXIS 3D [26], the inter-face reduction parameter between the wall and the soil is assumedas Rinter = 0.67.

Fig. 17. Definitions of the excavation length L, excavation width B and distancefrom the evaluated section to the excavation corner d.
0.0
0.2
0.4
0.6
0.8
1.0
0 10 20 30 40
PSR
Distance from the corner, d (m)
This study (sand case)Ou [2] (clay case)
0.0
0.2
0.4
0.6
0.8
1.0
0 10 20 30 40
PSR
Distance from the corner, d (m)
This study (sand case)Ou [2] (clay case)
0.0
0.2
0.4
0.6
0.8
1.0
0 10 20 30 40
PSR
Distance from the corner, d (m)
This study (sand case)Ou [2] (clay case)
(a) B/L = 0.5
(b) B/L = 1.0
(c) B/L = 2.0
Fig. 18. Variation of PSR with d for various B/L values: (a) B/L = 0.5; (b) B/L = 1.0; (c)B/L = 2.0.
B.-C.B Hsiung et al. / Computers and Geotechnics 80 (2016) 138–151 149
5. Results and discussion
5.1. Comparison between measured and predicted results
The wall displacements induced by the excavation are exam-ined and discussed in this section. Fig. 15 compares the predictedand measured wall displacements on the long side at variousstages of excavation. The measured wall displacement was takenfrom the inclinometer reading of SID3, which was installed at thecentre of the long diaphragm wall. The predicted maximum lateralwall displacements using E from the DMTs increase from 10 mm inthe 1st excavation stage to 54 mm in the final excavation stage.The comparison shows that the predictions using E from the DMTsslightly overestimate the wall displacement in the 1st and 3rdexcavation stages but agree well with the measured displacementsin the 4th and final excavation stages. The predictions usingE = 2000 N overpredict the wall displacements at all excavationstages because the lower bound value of the SPT-N correlationwas used to estimate the soil modulus in the simulation. Overall,the predicted results using E from the DMT and SPT-N correlationsappear to accurately predict the depth with the maximum lateralwall displacement. Thus, the use of the MC model with the soilmodulus obtained from the DMTs yields reasonable predictionsof the excavation-induced wall displacements in loose to mediumdense sands.
The wall displacement on the short side was also examined. Theinclinometer located at the centre of the wall on the short side,SID4, was selected for comparison. Fig. 16 compares the predictedand measured wall displacements on the short side at variousexcavation stages. The observations show that the wall movementgradually increases from no movement in the 1st excavation stageto 12 mm at the end of excavation. The maximum displacementcorresponds to the depth of the final excavation level. All of thepredictions indicated displacements of approximately 3 mm inthe 1st excavation stage and then range from 24 to 33 mm in thefinal excavation stage, which is almost twice as large as theobserved values. The discrepancy between the measured and pre-dicted wall displacements is likely attributed to the heavy cornerdiagonal bracing of each strut, which is shown in the strut layoutin Fig. 2. The heavy corner diagonal bracing, which is not consid-ered in the numerical simulation, likely stiffened the wall systemand reduced the wall displacement on the short side. Several refer-ences [31,32] indicated that wall deformations are connected withsmall strain properties of soil as well as relative stiffness of soil and
retaining and strutting system. It is seen that the displacement onthe short side is much smaller than that on the long side so soilstiffness on the short side should be much higher. Further investi-gation is required to include the effect of factors stated above in thenumerical analysis.
Fig. 6 compares the measured and predicted strut loads at the2nd level strut during the entire excavation period. The compar-ison reveals that the measured and predicted strut loads agreefairly well in both the magnitude and the overall trend with time.Because the predicted strut load from the FE analysis is a functionof the strut deformation, which is related to the wall deformation,the good agreement between the predicted and measured wall dis-placements in Fig. 15 ensures good results in predicting the strutloads. This comparison again confirms the applicability and suit-

(a)
(b)
0.0
0.5
1.0
1.5
2.0
2.5
3.0
0 10 20 30 40 50
B/L
Distance from the corner, d (m)
PSR=0.1
PSR=0.2
PSR=0.3
PSR=0.4
PSR=0.5
PSR=0.6
PSR=0.7
PSR=0.8
PSR=0.9
0.0
0.5
1.0
1.5
2.0
2.5
3.0
0 10 20 30 40 50
B/L
Distance from the corner, d (m)
This studyOu [2]
0.10.2
0.3
0.4
0.5
0.60.7
0.8 0.9
0.1 0.2 0.3 0.4 0.5 0.60.7
0.8
0.9
Fig. 19. PSR charts: (a) excavations in loose to medium dense sands; (b)comparison of PSR values in clay and in sand.
150 B.-C.B Hsiung et al. / Computers and Geotechnics 80 (2016) 138–151
ability of 3D FE models for predicting the wall behaviour due toexcavations in sand.
5.2. 3D effect of excavation and plan strain ratio
After the numerical model was verified, a series of parametricstudies was performed by varying the excavation length and widthto evaluate the 3D effects of the excavation on the wall displace-ment. Fig. 17 shows the definitions of the excavation length L,excavation width B and distance from the evaluated section tothe excavation corner d. In the parametric study, the input param-eters for the soils and structures remained unchanged. Only thedimensions of the excavation (i.e., L and B) were varied; the valuesof L are 20, 40, 60, 80 and 100 m, and the values of B are 10, 20, 40,60, 80 and 100 m. A total of 30 3D simulations were conducted inthe parametric study. In addition, a 3D plane strain model wasdeveloped (Fig. 14c), in which the thickness of the model was equalto the horizontal spacing of the steel struts; i.e., 5.5 m. The 3Dplane strain model was used to mimic a 2D model, which is com-monly used in practical design, and the wall displacement of the3D plane strain model served as the reference value for the walldisplacement under plane strain conditions.
The 3D effect on the wall displacement is quantitativelyassessed using the PSR, which is the ratio of the maximum walldeflection of a section of the wall to the maximum wall deflectionof the section under plane strain conditions. This ratio was firstproposed by Ou et al. [2] as follows:
PSR ¼ dhm;d
dhm;psð12Þ
where dhm;d is the maximum wall deflection at a certain sectionalong the wall, and dhm;ps is the maximum wall deflection of the sec-tion under plane strain conditions.
Fig. 18 shows the PSR results for B/L = 0.5, 1.0, and 2.0. For allthree cases, the PSR increases gradually with increasing d andthen reaches a constant value at large d, which indicates thatthe corner effect disappears as the distance from the section tothe corner increases. In addition, the PSR appears to be increaserapidly as B/L decreases. Fig. 19a shows the relationship betweenB/L and d for various PSR values. At a given d, B/L would have asignificant impact on the PSR. The displacements easily reachplane strain conditions with very narrow excavations (smallerB/L) but not with wide ones. The influence of the corner effectdecreases when d is greater than 30 m; the PSR value exceeds0.6 regardless of the B/L. Under these conditions, the maximumwall displacement at a certain d is not significantly smaller thanthe maximum displacement under plane strain conditions, whichsuggests the decreasing influence of the 3D effect on the wall dis-placement. The proposed PSR chart (Fig. 18a) provides an alterna-tive to transfer wall displacements from a 2D analysis to one thatconsiders the 3D effect, which therefore allows a practical design(typically in 2D) to account for the 3D effects of an excavation onwall deformation.
Figs. 18 and 19b compare the PSR values in sand that were cal-culated in this study and those calculated in clay by Ou et al. [2].The comparisons show that the proposed PSR values in this studyare different from that in previous studies of deep excavations inclay, especially for cases when d and B/L are large. As shown inFig. 18c, the PSR values in this study are substantially lower thanthose in clay by Ou [2] for B/L = 2.0 and d > 10 m. Because thesame construction method (i.e., bottom-up method) was adoptedfor the background cases that were used to determine the PSRvalues in both studies, the different subsurface soil conditions(sand and clay) and analysis types (drained and undrained) ledto the discrepancies in the PSR charts. As described above, soilstiffness might be higher on the short side so B/L ratio might alsobe correlated to soil modulus and PSR values. Based on the com-parison results, this study demonstrated that the soil and analysistypes have significant effects on the wall behaviour of deepexcavations.
6. Conclusions
This paper presents a study that evaluates the 3D effects of adeep excavation in loose to medium dense sands on wall dis-placements. An FE analysis was conducted to model a deep exca-vation in Kaohsiung, Taiwan, to verify the performance of a 3D FEmodel in predicting wall displacements. Thereafter, a series ofparametric studies was performed by varying the excavationlength and width to determine the PSR and establish its relation-ships with the excavation aspect ratio B/L and the distance fromthe evaluated section to the excavation corner d. The followingconclusions were drawn from the results of this study:
1. For an excavation in sand, the wall initially behaves incantilever-mode and then changes to prop-mode after thestruts are installed. The 3D corner effect exists because the wall
B.-C.B Hsiung et al. / Computers and Geotechnics 80 (2016) 138–151 151
displacements measured by the inclinometer located on thelong side of the diaphragm wall are considerably greater thanthose on the short side.
2. The distributed prop load (DPL) suggested by Twine and Roscoe[16] and the apparent earth pressure diagram for sand sug-gested by Peck [17] generally agree well with the DPL calcu-lated in this study at depths from 3 to 9 m. The two empiricalequations, which include the increase of water pressure withdepth in the calculation, overestimate the measured DPLs atdepths below 9 m.
3. The soil modulus E plays a key role in predicting the wall dis-placement induced by an excavation. The MC model with thesoil modulus obtained from in-situ DMT measurements cangive reasonable predictions for wall displacements induced bydeep excavations in loose to medium dense sand. The predic-tions using E = 2000 N overpredicted the wall displacementsin all excavation stages because the lower bound value of theSPT-N correlation was used for the soil modulus in thesimulation.
4. The observed wall displacements on the short side of the dia-phragm wall tend to be smaller than the predicted valuesbecause the heavy corner diagonal bracing of each strut stiff-ened the wall system and reduced the wall displacements. Fur-ther investigation is needed to include the effect of cornerdiagonal bracing of struts in the numerical analysis.
5. A relationship between B/L and d for various PSR values isestablished to quantitatively assess the 3D effects on the walldisplacements. With a combination of large d (large distancefrom the corner) and small B/L (narrow excavation aspect ratio),the displacements easily reach plane strain conditions, whichsuggests the decreasing influence of the 3D effect on the walldisplacements.
6. The comparison results revealed that the proposed PSR in thisstudy is different from those in previous studies of deep excava-tions in clay, especially for cases when d and B/L are large. Thedifferent subsurface soil conditions (sand and clay) and analysistypes (drained and undrained) led to the discrepancies betweenthe PSR charts. Based on the comparison results, this studydemonstrated that the soil and analysis types have a significanteffect on the wall behaviour of deep excavations.
Finally, for engineering practice, the proposed PSR chart pro-vides an alternative for transferring the wall displacement from a2D analysis to one that considers the 3D effects, which thereforecan provide designers with a practical reference to account forthe 3D effects of excavations on wall deformations.
Acknowledgements
The authors would like to thank the Ministry of Science andTechnology, Taiwan, for financial support for this project (ResearchGrant Number 100-2622-E-151-021-CC3). In addition, assistancefrom Mr. Juei-Jen Chang and Resources Engineering Services Inc.for the field work and testing is appreciated. Finally, help with thenumerical analyses by Dr. Dao, Sy Dan, former PhD student at theNational Kaohsiung University of Applied Sciences, is appreciated.
References
[1] Clough GW, O’Rourke TD. Construction-induced movements of in situ walls.In: Design and performance of earth retaining structures. Geotech spec publ25. ASCE; 1990. p. 439–70.
[2] Ou CY, Chiou D, Wu T. Three-dimensional finite element analysis of deepexcavations. J Geotech Eng 1996;122:337–45. http://dx.doi.org/10.1061/(ASCE)0733-9410(1996) 122:5(337).
[3] Ou CY, Shiau B, Wang I. Three-dimensional deformation behavior of the Taipeinational enterprise center (TNEC) excavation case history. Can Geotech J2000;37:438–48. http://dx.doi.org/10.1139/t00-018.
[4] Ou CY. Deep excavation: theory and practice. Netherlands: Taylor & Francis;2006.
[5] Kung GT, Juang CH, Hsiao EC, Hashash YM. Simplified model for wall deflectionand ground-surface settlement caused by braced excavation in clays. J GeotechGeoenviron Eng 2007;133:731–47. http://dx.doi.org/10.1061/(ASCE)1090-0241(2007) 133:6(731).
[6] Lin DG, Woo SM. Three-dimensional analyses of deep excavation in Taipei 101construction project. J Geoeng 2007;2:29–41.
[7] Hsiung BCB. A case study on the behaviour of a deep excavation in sand.Comput Geotech 2009;36:665–75. http://dx.doi.org/10.1016/j.compgeo.2008.10.003.
[8] Schweiger HF. Influence of constitutive model and EC7 design approach in FEManalysis of deep excavations. In: Proceedings of ISSMGE international seminaron deep excavations and retaining structures, Budapest, Hungary. p. 99–114.
[9] Wang JH, Xu ZH, Wang WD. Wall and ground movements due to deepexcavations in Shanghai soft soils. J Geotech Geoenviron Eng2010;136:985–94. http://dx.doi.org/10.1061/(ASCE)GT.1943-5606.0000299.
[10] Likitlersuang S, Surarak C, Wanatowski D, Oh E, Balasubramaniam A. Finiteelement analysis of a deep excavation: a case study from the Bangkok MRT.Soils Found 2013;53:756–73. http://dx.doi.org/10.1016/j.sandf.2013.08.013.
[11] Khoiri M, Ou C. Evaluation of deformation parameter for deep excavation insand through case histories. Comput Geotech 2013;47:57–67. http://dx.doi.org/10.1016/j.compgeo.2012.06.009.
[12] Finno RJ, Arboleda-Monsalve LG, Sarabia F. Observed performance of the OneMuseum park west excavation. J Geotech Geoenviron Eng2015;141:04014078. http://dx.doi.org/10.1061/(ASCE)GT.1943-5606.0001187.
[13] Orazalin Z, Whittle AJ, Olsen MB. Three-dimension analysis of excavationsupport system for the Stata Centre Basement on the MIT campus. J GeotechGeoenviron Eng 2015;141:0501500.
[14] Hsieh PG, Ou CY, Lin YK, Lu FC. Lessons learned in design of an excavation withthe installation of buttress walls. J Geo Eng 2015;10:67–73.
[15] Nikolinakou MA, Whittle AJ, Savidis S, Schran U. Prediction and interpretationof the performance of a deep excavation in Berlin sand. J Geotech GeoenvironEng 2011;137:1047–61. http://dx.doi.org/10.1061/(ASCE)GT.1943-5606.0000518.
[16] Twine D, Roscoe H. Temporary propping of deep excavations-guidance ondesign, Ciria C517. London: Construction Industry Research and InformationAssociation; 1999.
[17] Peck RB. Deep excavation and tunneling in soft ground. In: Proceedings of the7th international conference on soil mechanics and foundation engineering,Mexico City, Mexico. p. 225–90.
[18] Architectural Institute of Japan. Recommendations of design of buildingfoundation. Japan. (Interface [Japanese] 2001).
[19] Stroud MA. The standard penetration test- its application andinterpretation. London: Thomas Telford; 1989. p. 29–49.
[20] Skempton AW. Standard penetration test procedures and the effects in sandsof overburden pressure, relative density, particle size, ageing andoverconsolidation. Geotechnique 1986;36:425–47. http://dx.doi.org/10.1680/geot.1986.36.3.425.
[21] Powrie W, Chandler RJ, Carder DR, Watson GVR. Back-analysis of an embeddedretaining wall with a stabilizing base slab. Proc Inst Civ Eng Geotech Eng1999;137:75–86.
[22] Jardine RJ, Potts DM, Fourie AB, Burland JB. Studies of the influence of non-linear stress–strain characteristics in soil–structure interaction. Geotechnique1986;36:377–96. http://dx.doi.org/10.1680/geot.1986.36.3.377.
[23] Burland J, Kalra J. Queen Elizabeth Ii conference centre: geotechnical aspects.Proc Inst Civ Eng 1986;80:1479–503. http://dx.doi.org/10.1680/iicep.1986.527.
[24] Kulhawy FH, Mayne PW. Manual on estimating soil properties for foundationdesign. Elctric Power Research Institute; 1990. p. 1493–6. EL-6800, ResearchProject.
[25] Yong KY. Learning lessons from the construction of Singapore Downtown line(DTL). In: Proceedings of international conference and exhibition on tunnelingand underground space, Kuala Lumpur, Malaysia.
[26] PLAXIS. Reference manual. Amsterdam, The Netherlands: Plaxis BV; 2013.[27] Jaky J. The coefficient of earth pressure at rest. J Soc Hung Archit Eng
1944;7:355–8 [in Hungarian].[28] Bowles JE. Foundation analysis and design. 5th ed. New York: McGraw Hill;
2009.[29] Lim A, Ou CY, Hsieh PG. Evaluation of clay constitutive models for analysis of
deep excavation under undrained conditions. J Geo Eng 2010;5:9–20.[30] ACI. Committe 318: building codes requirements for reinforcement concrete;
1995.[31] Ng CWW, Yan WM. A true three- dimensional numerical analysis of
diaphragm walling. Geotechnique 1999;49(6):825–34.[32] Tang YG, Kung GTC. Investigating the effect of soil models on deformations
caused by braced excavation through an inverse- analysis technique. ComputGeotech 2010;37:769–80.