threadneedle investments
DESCRIPTION
TRANSCRIPT

Nicolas Robin
Threadneedle Enhanced Commodities Strategy
May 2012

Agenda
01 Commodity market overview – risk back on the agenda
02 Commodities at Threadneedle – a strong fund management team
03 Threadneedle Enhanced Commodities Strategy
AP Appendix
2 PT/12/01215

3
01
Commodity market overview – risk back on the agenda

Market outlook: mixed macro, energy fundamentals strong
Asia
Prospects for Chinese growth weakening, with target now looking to be closer to 7.5%
Europe
Continued uncertainty amid key election year (France, Greece) and renewed concerns around
Spain
US
Macro environment starting to improve but monetary policy to continue to be accomodative and
benefit of an election year
4 PT/12/01215

Market outlook: mixed macro, energy fundamentals strong
Geopolitical risk still high: Iran, Syria, Irak, Nigeria, Libya
Wild card: Chavez’s health and the risk associated with political transition in Venezuela
On the supply side, Saudi Arabia probably running much closer to full capacity than anticipated
Mild weather in Northern hemisphere has put a lid on demand this winter
Despite the mild weather, the Brent market still remains extremely well supported
Japan’s continued problems with nuclear plants support demand for LNG and oil products
5 PT/12/01215

Market outlook: mixed macro, energy fundamentals strong
Environment continues to favour the energy sector and, within it, refined products
Downside risk in base metals and agricultural products
Improving US economy could lead to a stronger dollar and therefore put more pressure on base and
precious metals generally
6 PT/12/01215

US Natural Gas: it’s all about shale gas, still...
Shale gas expansion continues to be the
driving force behind US natural gas
weakness
The domestic nature of the US market and
the difference in pricing mechanism with
international LNG markets is the key to
understand the current price dislocation
The situation is likely to endure until US
producer curtail production and/or export
capacity comes online
7
Since 2000, U.S shale gas production has
increased 17-fold and now comprises about 30%
of total U.S. dry production
Source: Lippman Consulting, Inc. gross withdrawal estimates as of November 2011
and converted to dry production estimates with EIA-calculated average gross-to-dry
shrinkage factors by state and/or shale play. Note: 2011 is annual for first 10 months.
Annual shale gas production (dry) trillion cubic feet
PT/12/01215

…and the mild weather this winter has exacerbated the glut
Mild temperatures in the US this winter are
to blame for the sharp decline recorded so
far this year
Inventories are now trending more than
50% above averages and may lead to
containment issues later this year
Average injections during the injection
season would take inventories to unknown
territory near 4.5Tcf
8
Total Lower 42 Natural Gas Inventories
Source: IEA, Threadneedle
1 Estimated inventory trajectory assuming average injections
0
500
1,000
1,500
2,000
2,500
3,000
3,500
4,000
4,500
5,000
1 4 7 10 13 16 19 22 25 28 31 34 37 40 43 46 49 52
Week
Avg High Low 2010
2011 2012 2012E1
PT/12/01215

Libyan production has been recovering faster than anticipated but spare capacity is shrinking fast…
Oil and the return of geopolitical risk
OPEC crude production (million barrels per day)
Source: International Energy Agency as at 12 April 2012
1 Capacity levels can be reached within 30 days and sustained for 90 days
2 Includes half of Neutral Zone production
3 Nigeria’s current capacity estimate excludes some 200kb/d of shut-in capacity
4 Includes upgraded Orinoco extra-heavy oil assumed at 470kb/d in September
Supply Sustainable
production capacitiy1
Spare capacity vs.
March 2012 supply
3Q12 Average
Sustainable
Production Capacity
3Q12 Average
Sustainable 2Q12
Capacity Jan 2012 Feb 2012 Mach 2012
Algeria 1.20 1.14 1.14 1.18 0.04 1.23 0.05
Angola 1.70 1.76 1.68 1.90 0.22 2.00 0.10
Ecuador 0.48 0.48 0.48 0.52 0.04 0.54 0.02
Iran 3.30 3.35 3.30 3.51 0.21 3.45 -0.07
Kuwait2 2.75 2.70 2.72 2.84 0.12 2.89 0.05
Libya 1.15 1.29 1.32 1.39 0.07 1.40 0.01
Nigeria3 2.04 2.10 2.05 2.55 0.50 2.59 0.04
Qatar 0.82 0.81 0.81 0.86 0.05 0.86 0.00
Saudi Arabia2 9.85 10.00 10.00 11.88 1.88 11.88 0.00
UAE 2.58 2.59 2.65 2.75 0.10 2.79 0.04
Venezuela4 2.47 2.46 2.44 2.53 0.09 2.53 0.00
OPEC-11 28.34 28.67 28.59 31.90 3.31 32.14 0.24
Iraq 2.65 2.62 2.84 3.01 0.17 3.13 0.12
Total OPEC 30.99 31.29 31.43 34.91 3.48 35.27 0.36
Excluding Iraq, Nigeria and Venezuela 2.54
9 PT/12/01215

Oil and the return of geopolitical risk
10
… demand continues to strengthen, driven by Asia / Pacific
Global oil demand – 2010–2012 (million barrels per day)
Source: International Energy Agency as at 12 April 2012
2010 2011 2012
Q1 Q2 Q3 Q4 Total Q1 Q2 Q3 Q4 Total Q1 Q2 Q3 Q4 Total
Africa 3.3 3.5 3.4 3.5 3.4 3.4 3.4 3.3 3.4 3.4 3.5 3.6 3.5 3.6 3.5
Americas 29.5 30.0 30.6 30.2 30.1 30.1 29.8 30.2 29.9 30.0 29.6 29.7 30.3 30.2 30.0
Asia / Pacific 27.2 27.0 26.7 28.3 27.3 28.6 27.3 27.4 28.9 28.0 29.4 28.1 28.0 29.4 28.7
Europe 15.0 14.9 15.6 15.5 15.3 14.9 14.8 15.4 14.8 15.0 14.4 14.3 15.1 14.7 14.6
FSU 4.4 4.3 4.5 4.6 4.4 4.4 4.6 4.8 4.8 4.7 4.6 4.7 4.9 4.9 4.8
Middle East 7.4 7.8 8.3 7.7 7.8 7.6 8.0 8.5 8.0 8.0 7.9 8.2 8.7 8.2 8.2
World 86.8 87.5 89.1 89.8 88.3 89.1 87.9 89.6 89.8 89.1 89.4 88.6 90.6 91.0 89.9
Annual change (%) 2.6 3.3 3.5 3.5 3.2 2.6 0.5 0.5 0.0 0.9 0.4 0.7 1.1 1.3 0.9
Annual change (mb/d) 2.2 2.8 3.0 3.1 2.8 2.3 0.4 0.5 0.0 0.8 0.3 0.6 1.0 1.2 0.8
Changes from last OMR (mb/d) 0.00 0.01 0.02 0.01 0.01 0.04 0.04 0.05 0.02 0.03 0.10 -0.14 0.10 -0.14 -0.02
PT/12/01215

Non-OECD: Demand by product
11
Demand Annual Change (kb/d) Annual Change %
Dec 2011 Jan 2012 Feb 2012 Jan 2012 Feb 2012 Jan 2012 Feb 2012
LPG & Ethane 5,111 4,990 5,071 83 66 1.7 1.3
Naphtha 2,589 2,725 2,729 -96 -129 -3.4 -4.5
Motor Gasoline 8,789 8,526 8,674 547 467 6.9 5.7
Jet Fuel & Kerosene 2,777 2,784 2,718 48 -37 1.8 -1.4
Gas/Diesel Oil 13,804 13,488 13,796 505 399 3.9 3.0
Residual Fuel Oil 5,657 5,409 5,730 -308 90 -5.4 1.6
Other Products 5,576 5,528 5,808 282 202 5.4 3.6
Total Products 44,302 43,450 44,527 1,061 1,057 2.5 2.4
Source: International Energy Agency as at 12 April 2012
Non-OECD: Demand by product (thousand barrels per day)
PT/12/01215
Non-OECD product demand continues to be strong, driven by transportation fuels (Motor Gasoline
and Diesel)

Chinese Strategic Petroleum Reserve: more capacity coming on stream
12
Operator Location Capacity Status Completion
Sinopec Zhenhai, Zhejiang 32.7 Filled 3Q06
Sinochem Zhoushan, Zhejiang 31.4 Filled 4Q07
Sinopec Huangdao, Shandong 20.1 Filled 4Q07
CNPC Dalian, Liaoning 18.9 Filled 4Q08
Phase 1 103.2 2008
CNPC Dushanzi, Xinjiang 18.9 Completed and ready to
be filled 3Q11
CNPC Lanzhou, Gansu 18.9 Completed and ready to
be filled 4Q11
CNPC Jinzhou, Liaoning 18.9 Under construction 1Q12
Sinopec Tianjin 22.0 Unser construction 1Q12
Other 90.3 2013
Phase 2 169.0 2013
Phase 3 227.8 2016
Total SPR 500.0
Chinese Strategic Petroleum Reserve Sites (million barrels)
According to the IEA, up to 79mb of new SPR capacity would be ready to receive Crude Oil in 2012
Source: IEA
PT/12/01215

US Shale Oil: towards of remake of shale gas in oil?
Production growth in the unconventional US
Oil plays is projected to increase strongly
from 2013 onwards
Shale Oil expansion is set to mimic the
production growth in Natural Gas at the end
of the last decade
This production growth will put increasing
strain on oil logistics
13
US shale oil plays could add well over 2-m b/d of
output over this decade
Source: Citi Investment Research and Analysis
End Game
27 February 2012
Citigroup Global Markets 8
Figure 11. US shale oil plays could add well over 2-m b/d of output over this decade
Bakken
Eagle Ford
Granite Wash
Permian Delaware
Permian Midland
Niobrara
Anadarko
0
500
1,000
1,500
2,000
2,500
3,000
3,500
4,000
2010 2011 2012 2013 2014 2015 2016 2017 2018 2019 2020 2021 2022
Bakken Eagle Ford Granite Wash Permian Delaware
Permian Midland Niobrara Uinta Barnett
Utica Woodford/Anadarko Monterey Upside potential?
Source: Citi Investment Research and Analysis
The surplus of crude production and imports over refinery needs is growing more
acute too. Although Cushing crude stocks were able to draw down in 2H'11, this
was only due to PADD II refiners running at blistering utilization rates as they made
the most of favorable margins. These high rates, hitting 98% at times, have only just
managed to keep stocks roughly flat, but will soon be unable to keep rising crude
production in check. Outages should place huge pressures on the logistical system.
In particular, PADD II planned maintenance in 2012 is likely to hit in the fall, with a
high of 400-k b/d of planned maintenance set for this October; and given that
unplanned outages in PADD II have averaged around 50-k b/d over planned
maintenance capacity in the last few years, actual outages could be somewhat
higher, and in our view should drive a major blow-out in late-2012.
…and this is already happening while
refineries are running at full steam
PT/12/01215

US Shale Oil: rising Canadian and US production choking logistics
The rapid growth in US unconventional
Crude Oil production, couple with that of
Western Canada, has created a crude
corridor in the US Midwest
While crude oil logistics are being upgraded
(rail terminal, new pipelines, reversal of
existing), such upgrades are not keeping
pace with production growth
Constraints surrounding US crude oil
exports are likely to keep US physical
market crude prices depressed
14
Simplified schematic of the crude glut corridor with major
production centres feeding Cushing and the broad direction of
crude oil flows amongst the PADD regions
Source: EIA, Citi Investment Research and Analysis
PT/12/01215
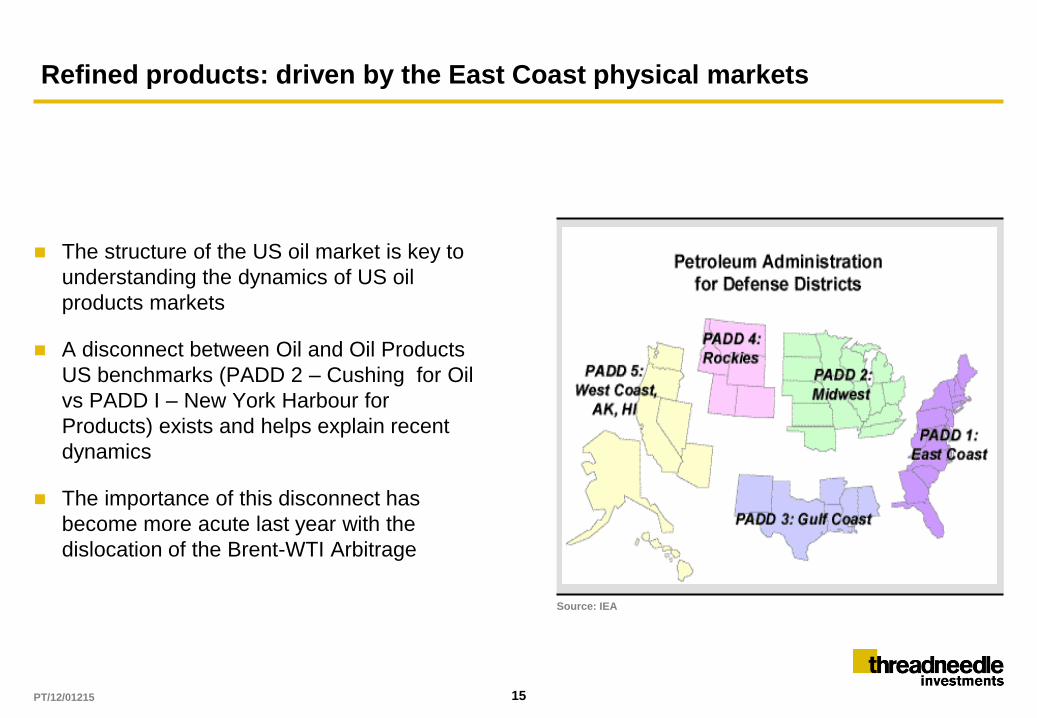
Refined products: driven by the East Coast physical markets
The structure of the US oil market is key to
understanding the dynamics of US oil
products markets
A disconnect between Oil and Oil Products
US benchmarks (PADD 2 – Cushing for Oil
vs PADD I – New York Harbour for
Products) exists and helps explain recent
dynamics
The importance of this disconnect has
become more acute last year with the
dislocation of the Brent-WTI Arbitrage
15
Source: IEA
PT/12/01215

Refining capacity in the US North East (PADD I): dangerously shrinking…
16
Owner City State Operating Crude Unit
capacity(bbl / calender day) Percent of Region (%) Status
Operating and Idled
Refineries
Conoco Phillips Linden NJ 238,000 17 Operating
PBF Energy Co. LLC Delaware City DE 182,200 13 Operating
PBF Energy Co. LLC Paulsboro NJ 160,000 12 Operating
United Refining Co. Warren PA 65,000 5 Operating
American Refining Bradford PA 10,000 1 Operating
Ergon-West Virgina Newell / Congo WV 20,000 1 Operating
Hess Corp. Port Reading NJ 01 0 Operating
Sunoco Inc. Philadelphia PA 335,000 24 Operating, For Sale
Sunoco Inc. Marcus Hook PA 178,000 13 Idled 12/2011, For Sale
Conoco Phillips Trainer PA 185,000 13 Idled 9/2011, For Sale
Total operating and idled 1,373,200 100
Recently shut refineries
Western refining Yorktown VA 66,300 Shut 9/2010
Sunoco Inc. Eagle Pt / Westville NJ 145,000 Shut 2/2010
Source: U.S. Energy Information Administration
1 Hess Port Reading has a production capacity of 70,000 bbl / calendar day but no crude unit capacity.
Notes: indicates operating refineries for sale and at risk of shutdown. indicates idled refineries for sale and at risk of shut down. indicates shut refineries. Total refinery capacity
excludes two refineries that primarily asphalt, as well as the Yorktown VA and Eagle Point refineries that were shut down in 2010.
US North East refiners have traditionally used Brent and Brent related grade as feedstock
The dislocation of the Brent WTI arbitrage has had devastating effects on PADD I margins and led to a string of closures
Up to 50% of PADD I distillation capacity is set to close by July 2012
PT/12/01215
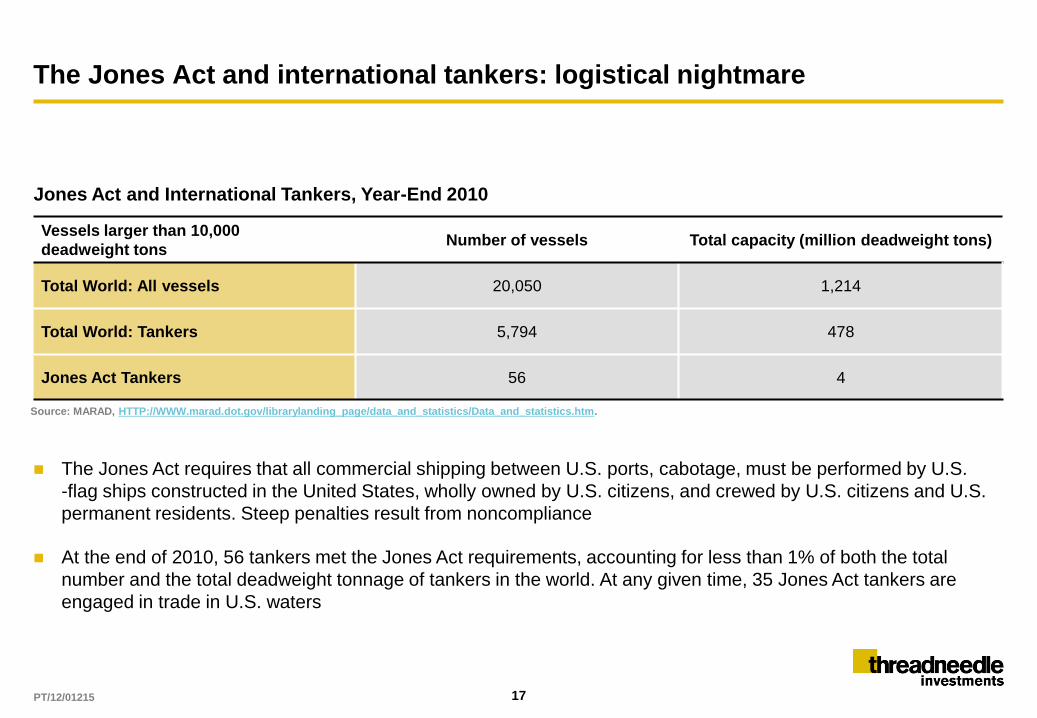
The Jones Act and international tankers: logistical nightmare
17
Vessels larger than 10,000
deadweight tons Number of vessels Total capacity (million deadweight tons)
Total World: All vessels 20,050 1,214
Total World: Tankers 5,794 478
Jones Act Tankers 56 4
Source: MARAD, HTTP://WWW.marad.dot.gov/librarylanding_page/data_and_statistics/Data_and_statistics.htm.
Jones Act and International Tankers, Year-End 2010
The Jones Act requires that all commercial shipping between U.S. ports, cabotage, must be performed by U.S.
-flag ships constructed in the United States, wholly owned by U.S. citizens, and crewed by U.S. citizens and U.S.
permanent residents. Steep penalties result from noncompliance
At the end of 2010, 56 tankers met the Jones Act requirements, accounting for less than 1% of both the total
number and the total deadweight tonnage of tankers in the world. At any given time, 35 Jones Act tankers are
engaged in trade in U.S. waters
PT/12/01215

PADD I Petroleum Product Assets: further logistical bottlenecks
Lack of ports and terminal capable of handling
waterbone products in PADD I is the largest
logistical hurdle
Existing infrastructure handles crude oil
deliveries and docks and tanks are not
equipped to receive oil products
The Colonial Pipeline delivers more than
500kbd into NY Harbour
Additional capacity on the line could be up to
100kbd according to the DOE, far less than the
lost output should Sunoco’s Philadelphia
refinery be shut permanently
18
U.S. Energy Information Administration | Potential Impacts of Reductions in Refinery Activity on Northeast Petroleum Product Markets 6
3. Logistical Constraints on Moving Product to the Northeast
As discussed below, ULSD replacement supplies may have limited foreign sources and may need to
come from the U.S. Gulf Coast. When suppliers move product from the U.S. Gulf Coast to the Northeast,
they will need to overcome both pipeline and tanker constraints. Currently, most Gulf Coast products
move to the Northeast through the Colonial Pipeline, which is running near capacity. The Lower Atlantic,
excluding Florida, is supplied largely from the Gulf Coast by the Colonial and Kinder Morgan Plantation
pipelines. The Colonial pipeline extends into the Northeast, but the majority of its volumes supply the
Southeast. Still, more than 500,000 bbl/d of gasoline and distillate are delivered into the Northeast via
the Colonial pipeline, which terminates in Linden, NJ (part of New York Harbor). This pipeline may be
able to move slightly more product into the Northeast in the coming summer. In the short term,
however, additional movements into the Northeast are unlikely to exceed 100,000 bbl/d – well less than
the expected production shortfall if the Sunoco Philadelphia refinery is closed.
The larger logistical hurdle is the lack of terminal and pipeline connections to move products from
waterborne vessels (either from foreign supply sources or from the Gulf Coast) into the product
distribution system that currently supplies areas through Pennsylvania and into western New York
(Figure 1). Ports serving Philadelphia-area refineries primarily handle crude oil and their docks and tanks
are not equipped to offload waterborne products.
Figure 1. Petroleum Product Assets in the Northeast
Source: U.S. Energy Information Administration.
Petroleum Product Assets in the Northeast
PT/12/01215

PADD I Gasoline balances: tighter, considerably
19
2007 2008 2009 2010 20111 2012 outlook 2013 outlook
Consumption 1,660 1,630 1,620 1,610 1,540 1,540 1,540
Supply 1,660 1,630 1,610 1,610 1,540 1,380 1,300
In-Region
Production (+) 750 710 640 560 580 420 350
Ethanol Inputs (+) 100 120 140 150 150 150 150
Net Receipts from
other Regions (+) 120 120 200 270 270 250 250
Imports (+) 720 700 630 -610 560 560 550
Exports (-) 20 20 - - - - -
Stock Decrease (+) /
Increase (-) - -10 - 10 - - -
Surplus (+) / Gap (-) - - - - - -160 -240
1 Data through November 2011
Notes: Projected consumption is based on data from EIA’s Short-Term Energy Outlook. Projected production is based on assumed yields and the capacity of remaining refineries. Sunoco
Philadelphia is assumed to close in July 2012. Projected imports are 3-year historical averages adjusted down by U.S. Virgin Islands contributions. Historical net receipts are estimated.
Projected net receipts are 3-year historical averages. The Surplus / Gap indicates the under-or-over supply needed to meet consumption.
Northeast Gasoline Supply-Demand Balance and Projections: Annual average 2007-2013
The impact of refinery closures is even more severe in the PADD I Gasoline market
The market is set to turn into a marked deficit this summer in the middle of the summer driving season making
the supply response even more difficult
PT/12/01215

Conclusion: energy remains our preferred sector
Energy fundamentals are strong and underpinned by geopolitical risk
Mixed macroeconomic environment negative for metals and to a lesser extent agricultural
commodities
Overweight Oil based energy: strong conviction overweight in Refined Products and Brent but
underweight WTI and Natural Gas
Underweight base metals sector: overweight Nickel, underweight Aluminium and Copper
Underweight soft commodities: full underweight in Cotton and Coffee
20 PT/12/01215

Commodities at Threadneedle – a strong fund management team
02

Commodities at Threadneedle
An integral component of the Threadneedle Investment Platform
Building commodities as the fourth asset class
A team drawn from the Commodities Markets
Leveraging the resources of the Fixed Income Group …
Making the most of the group’s trade-flow information
Participating if formulation of the Macro and Fundamental views
… and Threadneedle’s extensive strength in equities
Sharing investment ideas and broadening our perspective on commodity markets
Meeting with resources companies’ management teams provides unique insights into supply and
demand and technological developments across commodity markets
22 PT/12/01215

An experienced team with genuine commodities expertise
Source: Threadneedle as at 31 March 2012
David Donora
over 25 years’ experience
4 years at Threadneedle
Nicolas Robin
11 years’ experience
2 years at Threadneedle
Daniel Belchers
10 years’ experience
4 years at Threadneedle
23
Ullaas Misra
7 years’ experience
6 months at Threadneedle
Head of Commodities
Co-Lead Manager of Threadneedle Enhanced Commodities Fund and Columbia
Commodity Strategy Fund
Fund Manager
Co-Lead Manager of Threadneedle Enhanced Commodities Fund and Columbia
Commodity Strategy Fund
Fund Manager
Responsible for Materials
Analytics, bulk commodities, base and precious metals
Quantitative Specialist
Develop commodity analytics and models
PT/12/01215

Commodities at Threadneedle – the investment team
A wealth of expertise covering all aspects of commodity trading
More than 40 years of combined investment and trading experience
From physical and futures commodity trading to commodity related equities investment
Strong expertise in macro, volatility, forward curve and relative value trading
Products to capitalise on generating outperformance
A strong track record in both absolute returns and long only
Threadneedle Enhanced Commodity Fund launched June 2010
Columbia Commodity Strategy launched July 2011
24 PT/12/01215

Threadneedle Enhanced Commodities Strategy
03

Threadneedle Enhanced Commodities Fund Product highlights and features
Current target outperformance of 3–6%1 (benchmark: DJ-UBS TR Commodity Index)
tracking error up to 6%
Actively managed long-only fund investing in commodities
No leverage
No shorting
Fully invested
Daily liquidity
UCITS qualifying fund
Exposure created through Commodity Index swaps margined daily, (futures and physical not
permitted by regulator)
Diversified exposure across the commodity futures spectrum
Collateral invested in US T-Bills with maturities to 1 year
Hedged Share Classes: Euro, Sterling, Swiss Franc and Singapore Dollar
26
1 Gross of fees, per annum
PT/12/01215

Threadneedle Enhanced Commodities Fund Active management of Commodities
Fundamentally driven investment process which aims to generate outperformance
Active Weights
Driven by investment process
Active rebalancing of weights
Proactive curve positioning
Positioning of individual commodity weight along the term-structure
Timing of moving allocations along the curve
Seeking to capture curve volatility and uncorrelated alpha
27 PT/12/01215

Bottom up – the engine room of idea generation
28
Source: Threadneedle
Proprietary Database
Underlying markets
Sectors
Indices
Supply/Demand
Inventories
Logistics
Weather
Technological development
Investment flows
Speculative positioning
Hedger Activity
Algorithmic traders impact
Futures Exchange Rules
Options activity and
Volatility
Trade
Ideas
Market Structure
and Technicals Fundamentals
Seasonality
PT/12/01215

Portfolio construction: emphasis on relative value
Focus on relative value opportunities within the commodity universe
Intra sector
Across sectors
Position size to reflect both conviction and underlying market liquidity
Portfolio positions constructed with emphasis on:
Correlation
Volatility
Maximise performance outcome within the tracking error budget constraint
Deliver high risk adjusted relative returns with a portfolio volatility close benchmark
29 PT/12/01215

NY Harbour Gasoline v. Henry Hub Natural Gas
30
Relative
Value
Market
Structure and
Technicals Fundamentals
Seasonality
NG seasonality negative through
summer
RBOB seasonal most positive ahead of
US summer and winter changeover
Natural Gas storage constraint
Robust supply +16,800 wells in ‘11
Little infrastructure to export
NGL’s & wet gas increase margins
Gasoline tight with Middle East
supply disruption
Logistics impaired / affects refining
US refiners reducing capacity
NG producers actively hedge
affecting front of curve
US NG is a domestic market
RBOB inclined to backwardation
50
70
90
110
130
150
170
Oct 10 Dec 10 Feb 11 Apr 11 Jun 11 Aug 11 Oct 11 Dec 11
Re
ba
se
d =
10
0
Dow Jones – UBS Natural Gas Sub-Index
S&P GSCI Unleaded Gasoline Official Close Index
Strong seasonal
Lower 48 Inventory surplus (deficit) to other years
Source: EIA, Citi Investment Research and Analysis
PT/12/01215

Wheat – In an active strategy, it is possible to capture the volatility in the
protein spread and the difference in carry
31
Relative
Value
Market
Structure and
Technicals Fundamentals
Seasonality
We allocated to MW wheat Feb
2011 - fundamentals and structure
MW wheat has high protein content
Grown in different regions of NA
La Nina effect severely impacted
MW production in 2011
Logistics impaired shipment of
2010 crop
Minneapolis, Kansas and Chicago
wheat all have different physical
delivery conditions
Chicago wheat most affected by
VSR
MW more inclined to
backwardation/positive roll yield
Less speculative and index activity
MW in backwardation,
W in contango
50
60
70
80
90
100
Feb 11 Apr 11 Jun 11 Aug 11 Oct 11 Dec 11
Reb
ased
= 1
00
DJ-UBS Wheat Sub-Index
S&P GSCI Kansas Wheat Index
Citi Minneapolis F3 Custom Index
MW has stronger Spring and Summer
seasonal performance
Source: EIA, Citi Investment Research and Analysis
PT/12/01215

Source: Threadneedle / FactSet as at 31 March 2012. Gross performance based on official global close prices adjusted by the TER. Performance figures for periods greater than 1 year are
cumulative.
1 Since inception at 30 June 2010 (cumulative)
2 Index – Dow Jones-UBS Commodity Index
Past performance is not a guide to future performance
Threadneedle Enhanced Commodities Fund Performance to Date (in USD)
2010 Jul Aug Sep Oct Nov Dec 2010
Fund (gross) 7.3% -1.2% 6.4% 5.5% -0.1% 10.8% 31.5%
Index2 6.8% -2.5% 7.3% 5.0% -0.4% 10.7% 29.2%
Relative +0.5% +1.3% -0.9% +0.5% +0.3% +0.1% +1.8%
32
2011 Jan Feb Mar Apr May Jun Jul Aug Sep Oct Nov Dec 2011 Since
inception1
Fund
(gross) 1.9% 3.6% 2.4% 4.8% -5.5% -3.3% 3.8% 1.7% -14.0% 6.5% -1.4% -1.6% -2.8% 27.9%
Index2 1.0% 1.3% 2.1% 3.5% -5.1% -5.0% 3.0% 1.0% -14.7% 6.6% -2.2% -3.7% -13.3% 12.0%
Relative +0.9% +2.2% +0.3% +1.3% -0.4% +1.8% +0.8% +0.7% +0.9% -0.1% +0.9% +2.3% +12.2% +14.2%
2012 Jan Feb Mar Apr May Jun Jul Aug Sep Oct Nov Dec Since
inception1
Fund
(gross) 4.6% 3.4% -1.8% 35.9%
Index2 2.5% 2.7% -4.1% 13.0%
Relative +2.1% +0.7% +2.4% +20.2%
PT/12/01215

Threadneedle Enhanced Commodities Fund Performance to Date (in USD)
Performance vs. index
33
2012 YTD Since inception1
(annualised)
Since inception1
(cumulative) Historical Volatility
Fund (gross) 6.2% 19.1% 35.9% 18.5%
Index2 0.9% 7.2% 13.0% 19.3%
Relative +5.3% +11.1% +20.2%
Source: Threadneedle / FactSet as at 31 March 2012. Gross performance based on official global close prices, Fund data is quoted on a bid to bid basis with gross income re-invested at bid.
Fund returns calculated Gross of TER (and Tax) for comparison with index
1 Since inception at 30 June 2010
2 Index – Dow Jones-UBS Commodity Index
3 Threadneedle / FactSet as at 31 March 2012. Based on monthly observations since inception
4 Backtesting using TECF’s daily realised relative performance vs DJUBSTR
Past performance is not a guide to future performance
100
105
110
115
120
125
130
135
140
145
150
Jun
10
Jul
10
Aug
10
Sep
10
Oct
10
Nov
10
Dec
10
Jan
11
Feb
11
Mar
11
Apr
11
May
11
Jun
11
Jul
11
Aug
11
Sep
11
Oct
11
Nov
11
Dec
11
Jan
12
Feb
12
Mar
12
Reb
ased
= 1
00
T-Lux Enhanced Commodities Fund DJ-UBS Commodity (TR) Index
Historical Tracking Error3: 3.1%
Correlation of alpha with index4: -0.06
PT/12/01215

Threadneedle Enhanced Commodities Strategy Product update
Strong inflows since inception – more than $600 million in AUM, highly diversified client base
US clone fund (futures based) launched at the end of July 2011 by Columbia AM
Long / short, market neutral product to launch in Q2
34 PT/12/01215

Risk control and monitoring
Multiple controls inside and outside the process ensure that risks are intended and appropriate
Within the process
Adherence to risk budgeting discipline
Daily review of exposures
Weekly review of all trades vs. targets and market developments
Robust external controls
Blend of proprietary and third-party analytics provide comprehensive view of portfolio risk (Threadneedle uses
Advanced Portfolio Technologies, Inc. (APT) as a risk model provider)
Ongoing portfolio monitoring and challenge of fund managers by dedicated (and independent) investment risk
team
Formal reviews by Head of Fixed Income and Head of Risk Management
35 PT/12/01215

Managing risk for investment return
Investment risk: daily reports provide insight
into portfolio exposures and risks
Positions, number of holdings, net and gross
exposures
Tracking error, value-at-risk, breakdowns by
commodity, sector and size
Scenario analysis/stress tests
Sensitivity analysis
Operational risk: Safeguards and analysis
Dedicated unit within risk management team
conducts on-going analysis of counterparty risk
IRIS, Threadneedle’s risk reporting system
For illustrative purposes only
36 PT/12/01215
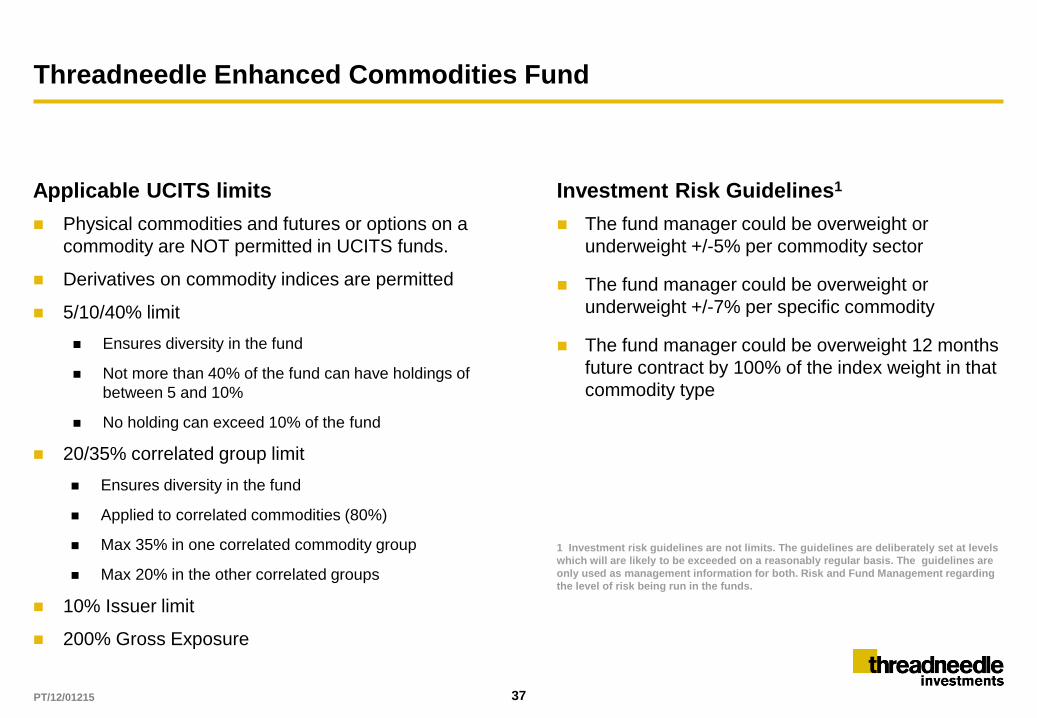
Threadneedle Enhanced Commodities Fund
37
Physical commodities and futures or options on a
commodity are NOT permitted in UCITS funds.
Derivatives on commodity indices are permitted
5/10/40% limit
Ensures diversity in the fund
Not more than 40% of the fund can have holdings of
between 5 and 10%
No holding can exceed 10% of the fund
20/35% correlated group limit
Ensures diversity in the fund
Applied to correlated commodities (80%)
Max 35% in one correlated commodity group
Max 20% in the other correlated groups
10% Issuer limit
200% Gross Exposure
Applicable UCITS limits
The fund manager could be overweight or
underweight +/-5% per commodity sector
The fund manager could be overweight or
underweight +/-7% per specific commodity
The fund manager could be overweight 12 months
future contract by 100% of the index weight in that
commodity type
Investment Risk Guidelines1
1 Investment risk guidelines are not limits. The guidelines are deliberately set at levels
which will are likely to be exceeded on a reasonably regular basis. The guidelines are
only used as management information for both. Risk and Fund Management regarding
the level of risk being run in the funds.
PT/12/01215

Appendix
AP

Source: Threadneedle as at 30 March 2012
Bridging the gap towards theoretical spot returns?
39
90
100
110
120
130
140
150
160
Jun
10
Jul
10
Aug
10
Sep
10
Oct
10
Nov
10
Dec
10
Jan
11
Feb
11
Mar
11
Apr
11
May
11
Jun
11
Jul
11
Aug
11
Sep
11
Oct
11
Nov
11
Dec
11
Jan
12
Feb
12
Mar
12
Reb
ased
= 1
00
DJUBSSP Index DJUBSTR Index DJUBSF3T Index T-Lux Enchanced Commodities Fund
Since inception, the strategy has tracked spot returns closer than a passive forward exposure
Trading the curve actively allows to seek forward exposure to minimise contango while taking advantage of the
curve volatility to generate outperformance
PT/12/01215

Source: Threadneedle as at 30 March 2012
Gold vs. gasoline – is gold really your inflation hedge?
40
0
500
1,000
1,500
2,000
2,500
3,000
3,500
4,000
4,500
5,000
1987 1988 1989 1990 1991 1992 1993 1994 1995 1996 1997 1998 1999 2000 2001 2002 2003 2004 2005 2006 2007 2008 2009 2010 2011
SPGCHUTR Index SPGCGCTR Index
In spite of recent precious bull market, gold continues to underperform gasoline over the long-term
PT/12/01215

Backwardation, contango and roll yield
The slope of the futures / forward curve indicates the
state of available, deliverable inventory relative to
market demand
Commodities with abundant supply are typically in
contango – short-dated futures prices are lower than
longer-dated ones. Precious metals are usually in
contango because of the significant stocks available and
therefore the low metal lease rates
Commodities with tight supply are typically
backwardated – short-dated futures prices are higher than
longer-dated ones
Maintaining long positions in commodity futures
necessitates replacing maturing futures contracts with
longer dated futures. For a commodity market in contango
the investor will suffer an erosion of return by replacing
cheap futures with more expensive futures further along
the curve. Conversely, for a market in backwardation the
investor will benefit from improvement in the return
Contango – negative roll return
Commodity indices – roll return impacting performance
Backwardation – positive roll return
Roll return has historically eroded 50% of the returns of the spot returns for S&P GSCI and 55% of
the spot returns for DJ-UBSCI
Pri
ce
Maturity
Maturity
Pri
ce
Source: JP Morgan
41 PT/12/01215

Hypothetical cumulative roll return
Commodity indices – from ‘roll return’ to ‘roll drag’
-70%
-60%
-50%
-40%
-30%
-20%
-10%
0%
10%
20%
30%
1991 1993 1995 1997 1999 2001 2003 2005 2007 2009
S&P GSCI S&P GSCI Light Energy DJ-UBSCI
Excess return = price return + roll return
Price return – change in contracts’ prices
The roll return is the incidental cost or
benefit of tracking the price index and is
inherent to commodity investing
42 PT/12/01215

NICOLAS ROBIN
Fund Manager
Nicolas Robin joined Threadneedle in 2010 and is the Co- Lead Manager of the Threadneedle (Lux) Enhanced
Commodities Fund and Columbia Commodity Strategy Fund.
Nicolas has more than 10 years experience at managing both long only and relative value strategies focusing on
commodity markets and brings both hedge fund and commodity index trading experience to the team. He started his
career at Barep Asset Management (SG Group) in 2002, helping to set up a Commodity Arbitrage hedge fund desk.
He became Co-Manager in 2004 and Lead Manager in 2005, seeing assets rise to $200 million. The strategy was
focused on relative value strategies in commodities and aimed to take advantage of short-term dislocations in
commodity forward curves. In 2006 Nicolas joined JPMorgan Chase to run the bank’s commodity index trading
book. During his tenure, index assets under management trebled making JPMorgan Chase a leading index dealer.
In his time at JPMorgan Chase, Nicolas was responsible overhauling the bank’s commodity index trading platform
and driving the bank’s effort into fully customisable commodity index solutions. He participated in the creation of the
JPMorgan Commodity Curve Index (JPMCCI), the bank’s foray into second generation commodity indices launched
in 2007. He also contributed to the development of the bank’s commodity customised indices and algorithmic
strategies, looking at both momentum and curve based strategies. Alongside his commodity index trading
responsibilities, Nicolas also ran a proprietary trading book across commodities, using both relative value and
directional strategies with an emphasis on the energy complex.
Nicolas holds a BSc in Government and Economics and a MSc in Political Theory from the London School of
Economics.
Threadneedle start date: 2010
Industry start date: 2001
Biography
43 PT/12/01215
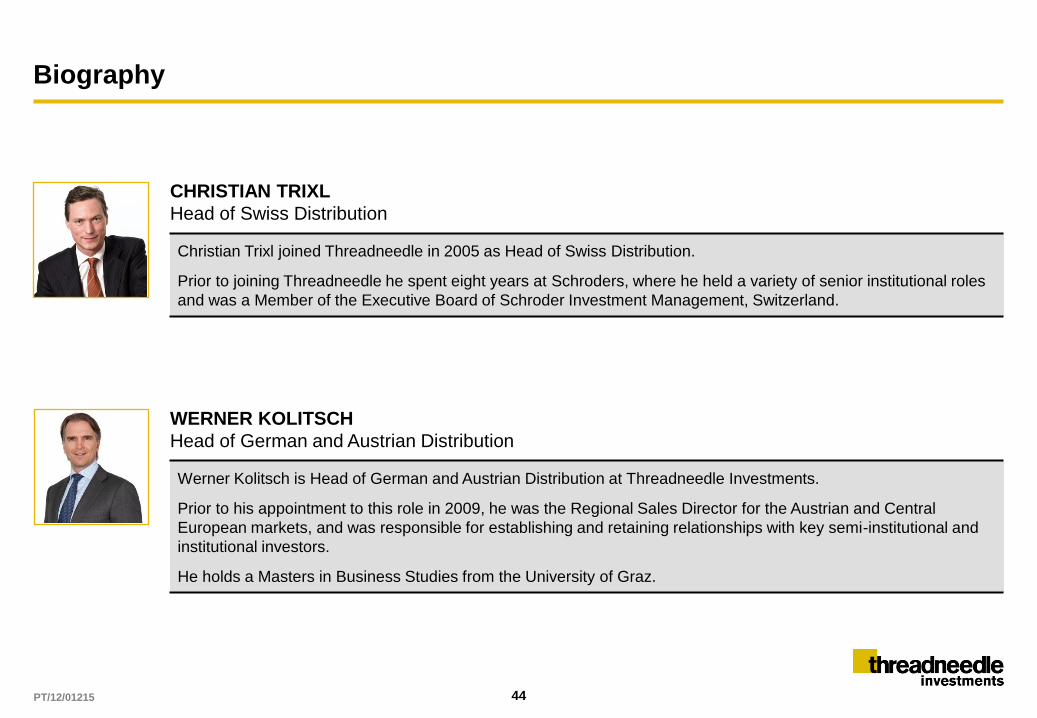
Biography
44
CHRISTIAN TRIXL
Head of Swiss Distribution
Christian Trixl joined Threadneedle in 2005 as Head of Swiss Distribution.
Prior to joining Threadneedle he spent eight years at Schroders, where he held a variety of senior institutional roles
and was a Member of the Executive Board of Schroder Investment Management, Switzerland.
WERNER KOLITSCH
Head of German and Austrian Distribution
Werner Kolitsch is Head of German and Austrian Distribution at Threadneedle Investments.
Prior to his appointment to this role in 2009, he was the Regional Sales Director for the Austrian and Central
European markets, and was responsible for establishing and retaining relationships with key semi-institutional and
institutional investors.
He holds a Masters in Business Studies from the University of Graz.
PT/12/01215

Important information
For Investment Professionals use only, not to be relied upon by private investors.
Past performance is not a guide to future returns. The value of investments and any income is not guaranteed and can go down as well as up and may be affected by exchange rate fluctuations.
This means that an investor may not get back the amount invested.
Where investments are made in assets that are denominated in foreign currency, changes in exchange rates may affect the value of the investments.
The fund invests in markets where economic and political risk can be significant and where governance and regulation may not be well developed. These factors can affect liquidity, settlement
and asset values. The fund invests in assets that are not always readily saleable without suffering a discount to fair value. The portfolio may have to lower the selling price, sell other investments
or forego another, more appealing investment opportunity. The fund may exhibit significant price volatility. The fund invests in commodity derivatives rather than physical commodities.
Therefore, changes in the prices of the underlying commodities will not be mirrored exactly in the fund price.
Threadneedle (Lux) is an investment company with variable capital (Société d’investissement à capital variable, or "SICAV") formed under the laws of the Grand Duchy of Luxembourg. The
SICAV issues, redeems and exchanges shares of different classes, which are listed on the Luxembourg Stock Exchange. The management company of the SICAV is Threadneedle
Management Luxembourg S.A, who is advised by Threadneedle Asset Management Ltd. and/or selected sub-advisors..
The SICAV is registered in Austria, France, Germany, Hong Kong, Italy, Luxembourg, The Netherlands, Portugal, Spain, Sweden, Switzerland, Taiwan and the UK; however, this is subject to
applicable jurisdictions and some sub-funds and/or share classes may not be available in all jurisdictions. Shares in the Funds may not be offered to the public in any other country and this
document must not be issued, circulated or distributed other than in circumstances which do not constitute an offer to the public and are in accordance with applicable local legislation.
Shares in the Funds may not be offered, sold or delivered directly or indirectly in the United States or to or for the account or benefit of any “U.S. Person”, as defined in Regulation S under the
1933 Act.
Subscriptions to a Fund may only be made on the basis of the current Prospectus and the Key Investor Information Document, as well as the latest annual or interim reports, which can be
obtained free of charge on request, and the applicable terms & conditions. Please refer to the ‘Risk Factors’ section of the Prospectus for all risks applicable to investing in any fund and
specifically this Fund. The above documents are available in English, French, German, Portuguese, Italian, Spanish and Dutch (no Dutch Prospectus) and free of charge on request by writing to
the SICAV’s registered office at 69, route D’Esch. L-1470 Luxembourg, Grand Duchy of Luxembourg.
The research and analysis included in this document has been produced by Threadneedle Investments for its own investment management activities, may have been acted upon prior to
publication and is made available here incidentally. Any opinions expressed are made as at the date of publication but are subject to change without notice. Information obtained from external
sources is believed to be reliable but its accuracy or completeness cannot be guaranteed.
This presentation and its contents are confidential and proprietary. The information provided in this presentation is for the sole use of those attending the presentation. It may not be reproduced
in any form or passed on to any third party without the express written permission of Threadneedle Investments. This presentation is the property of Threadneedle Investments and must be
returned upon request.
Threadneedle Management Luxembourg S.A. Registered with the Registre de Commerce et des Societes (Luxembourg), Registered No. B 110242, rue Mühlenweg, L-2155 Luxembourg, Grand
Duchy of Luxembourg.
In the UK issued by Threadneedle Asset Management Limited. Registered in England and Wales, Registered No. 573204, 60 St Mary Axe, London EC3A 8JQ, United Kingdom. Authorised and
regulated in the UK by the Financial Services Authority.
Threadneedle Investments is a brand name and both the Threadneedle Investments name and logo are trademarks or registered trademarks of the Threadneedle group of companies.
45 PT/12/01215