thorium resources in rare earth elements (ragheb, m., aug. 2011
TRANSCRIPT
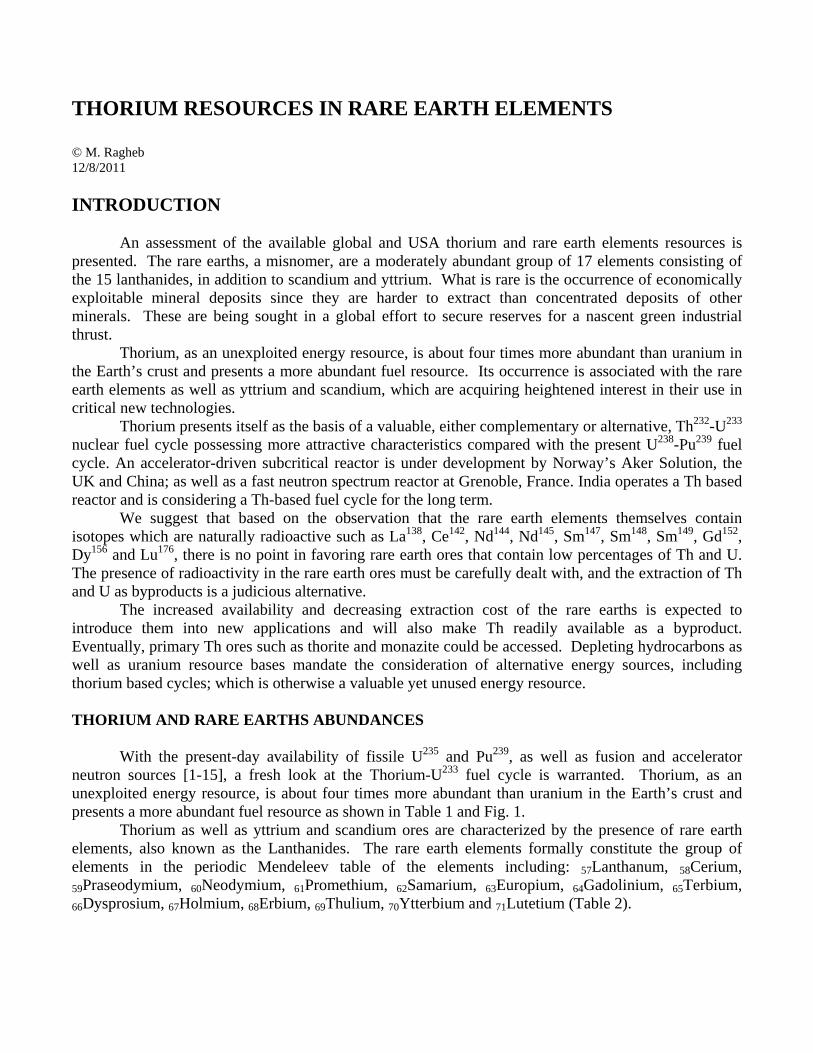
THORIUM RESOURCES IN RARE EARTH ELEMENTS © M. Ragheb 12/8/2011 INTRODUCTION An assessment of the available global and USA thorium and rare earth elements resources is presented. The rare earths, a misnomer, are a moderately abundant group of 17 elements consisting of the 15 lanthanides, in addition to scandium and yttrium. What is rare is the occurrence of economically exploitable mineral deposits since they are harder to extract than concentrated deposits of other minerals. These are being sought in a global effort to secure reserves for a nascent green industrial thrust. Thorium, as an unexploited energy resource, is about four times more abundant than uranium in the Earth’s crust and presents a more abundant fuel resource. Its occurrence is associated with the rare earth elements as well as yttrium and scandium, which are acquiring heightened interest in their use in critical new technologies. Thorium presents itself as the basis of a valuable, either complementary or alternative, Th232-U233 nuclear fuel cycle possessing more attractive characteristics compared with the present U238-Pu239 fuel cycle. An accelerator-driven subcritical reactor is under development by Norway’s Aker Solution, the UK and China; as well as a fast neutron spectrum reactor at Grenoble, France. India operates a Th based reactor and is considering a Th-based fuel cycle for the long term. We suggest that based on the observation that the rare earth elements themselves contain isotopes which are naturally radioactive such as La138, Ce142, Nd144, Nd145, Sm147, Sm148, Sm149, Gd152, Dy156 and Lu176, there is no point in favoring rare earth ores that contain low percentages of Th and U. The presence of radioactivity in the rare earth ores must be carefully dealt with, and the extraction of Th and U as byproducts is a judicious alternative. The increased availability and decreasing extraction cost of the rare earths is expected to introduce them into new applications and will also make Th readily available as a byproduct. Eventually, primary Th ores such as thorite and monazite could be accessed. Depleting hydrocarbons as well as uranium resource bases mandate the consideration of alternative energy sources, including thorium based cycles; which is otherwise a valuable yet unused energy resource. THORIUM AND RARE EARTHS ABUNDANCES With the present-day availability of fissile U235 and Pu239, as well as fusion and accelerator neutron sources [1-15], a fresh look at the Thorium-U233 fuel cycle is warranted. Thorium, as an unexploited energy resource, is about four times more abundant than uranium in the Earth’s crust and presents a more abundant fuel resource as shown in Table 1 and Fig. 1. Thorium as well as yttrium and scandium ores are characterized by the presence of rare earth elements, also known as the Lanthanides. The rare earth elements formally constitute the group of elements in the periodic Mendeleev table of the elements including: 57Lanthanum, 58Cerium, 59Praseodymium, 60Neodymium, 61Promethium, 62Samarium, 63Europium, 64Gadolinium, 65Terbium, 66Dysprosium, 67Holmium, 68Erbium, 69Thulium, 70Ytterbium and 71Lutetium (Table 2).
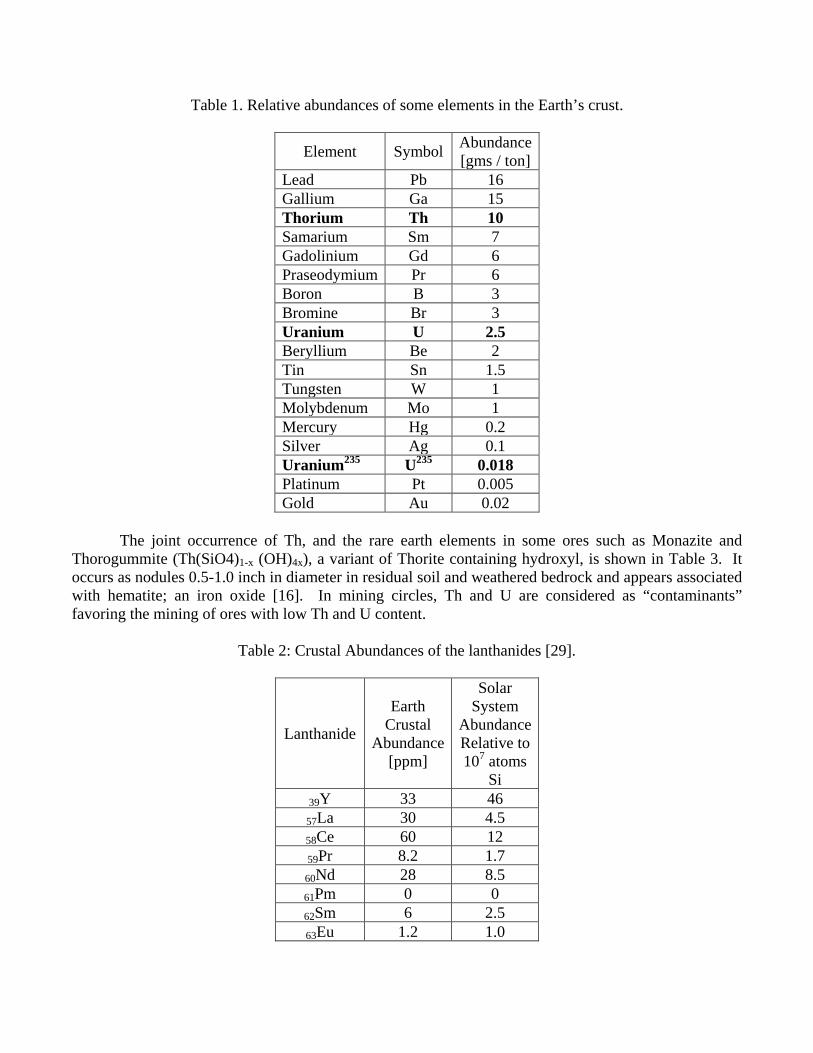
Table 1. Relative abundances of some elements in the Earth’s crust.
Element Symbol Abundance [gms / ton]
Lead Pb 16 Gallium Ga 15 Thorium Th 10 Samarium Sm 7 Gadolinium Gd 6 Praseodymium Pr 6 Boron B 3 Bromine Br 3 Uranium U 2.5 Beryllium Be 2 Tin Sn 1.5 Tungsten W 1 Molybdenum Mo 1 Mercury Hg 0.2 Silver Ag 0.1 Uranium235 U235 0.018 Platinum Pt 0.005 Gold Au 0.02
The joint occurrence of Th, and the rare earth elements in some ores such as Monazite and Thorogummite (Th(SiO4)1-x (OH)4x), a variant of Thorite containing hydroxyl, is shown in Table 3. It occurs as nodules 0.5-1.0 inch in diameter in residual soil and weathered bedrock and appears associated with hematite; an iron oxide [16]. In mining circles, Th and U are considered as “contaminants” favoring the mining of ores with low Th and U content.
Table 2: Crustal Abundances of the lanthanides [29].
Lanthanide
Earth Crustal
Abundance [ppm]
Solar System
Abundance Relative to 107 atoms
Si 39Y 33 46 57La 30 4.5 58Ce 60 12 59Pr 8.2 1.7 60Nd 28 8.5 61Pm 0 0 62Sm 6 2.5 63Eu 1.2 1.0
64Gd 5.4 3.3 65Tb 0.9 0.6 66Dy 3.0 3.9 67Ho 1.2 0.9 68Er 2.8 2.5
69Tm 0.5 0.4 70Yb 3.0 2.4 71Lu 0.5 0.4
Figure 1. Logarithmic abundance of the elements relative to silicon in the Earth’s crust. Source: USGS.
Figure 2. From top center, oxides of praseodymium, cerium, lanthanum, neodymium, samarium and gadolinium. Source: USDA.
The Cerium142 isotope with a natural abundance of 11.114 percent in Ce is radioactive with a half life of > 5x10¹⁶ years. Cerium has a crustal abundance of 60 ppm, comparable with Ni at 75 ppm and Cu at 55 ppm. The least abundant lanthanides, thulium and lutetium are more abundant than silver and bismuth. Promethium does not occur in nature and has no stable isotopes. In mining activities, Total Rare Earth Oxides (TREO) refers to the elements lanthanum to lutetium, plus yttrium, expressed as oxides. Heavy Rare Earth Oxides (HREO) refers to the elements Eu, Gd, Tb, Dy, Ho, Er, Tm, Yb, Lu, and Y, expressed as oxides as a percentage of the TREO. Light Rare Earths (LREO) refers to the elements La, Ce, Pr, Nd, and Sm, expressed as oxides. Neodymium, Dysprosium, Terbium and Europium are in high demand. Rare earths are also associated with other rare elements including: Li, Be, Rb, Cs, Y, Zr, Nb, Hf, Ta, Ga, Ge, In, and Sn. The economics of rare earths extraction involves the balance between the “Heavies” and the “Lights.” The rare earths occur together as a group and must be sequentially separated at additional effort and cost. Most deposits are tilted towards the LREOs which constitute 97-99 percent of the resource base. Deposits having an unusual balance with a high proportion of the HREOs > 20 percent are rare and consequently more valuable. For instance light cerium goes for about $4/kg, whereas heavy europium goes for $470 / kg. The refining process of each element is performed using solvent extraction or ion exchange processes. The balance of chemicals used and the design of the processes depend on the composition of the feedstock concentrates. Solvent extraction is commonly used for the light elements, whereas the ion exchange process is used for the heavy ones. Induced fluorescence using a short wave ultraviolet light or a laser and chemical reaction with a basic reagent containing an alkali metal such as sodium hydroxide (lye) or sodium bicarbonate (baking soda) and with a halide acid such as hydrochloric acid, is used to detect the presence of the rare earths. The presence of radioactive elements in half of their 30 important minerals helps in the detection and location of the rare earths deposits, but poses a health physics operation protection of the workers, as well as an environmental disposal consideration for the tailings (Table 4). Radiation detectors, scintillometers and airborne radiometric surveys are used in identifying placer deposits.
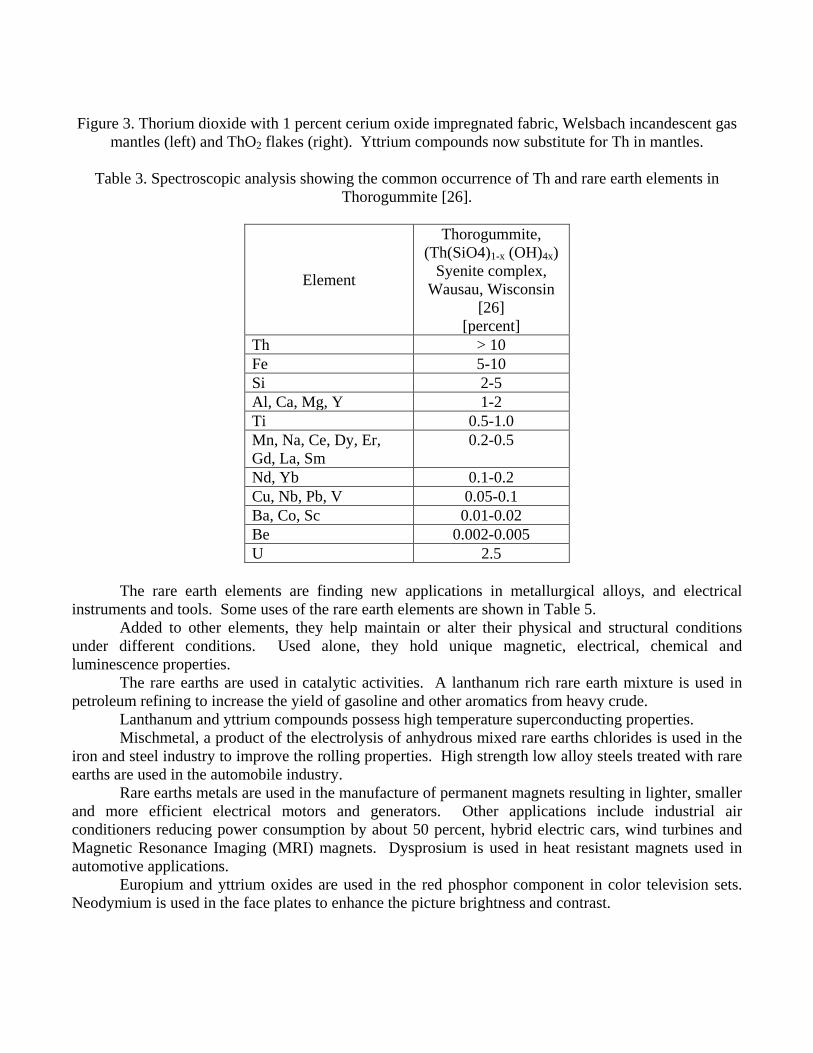
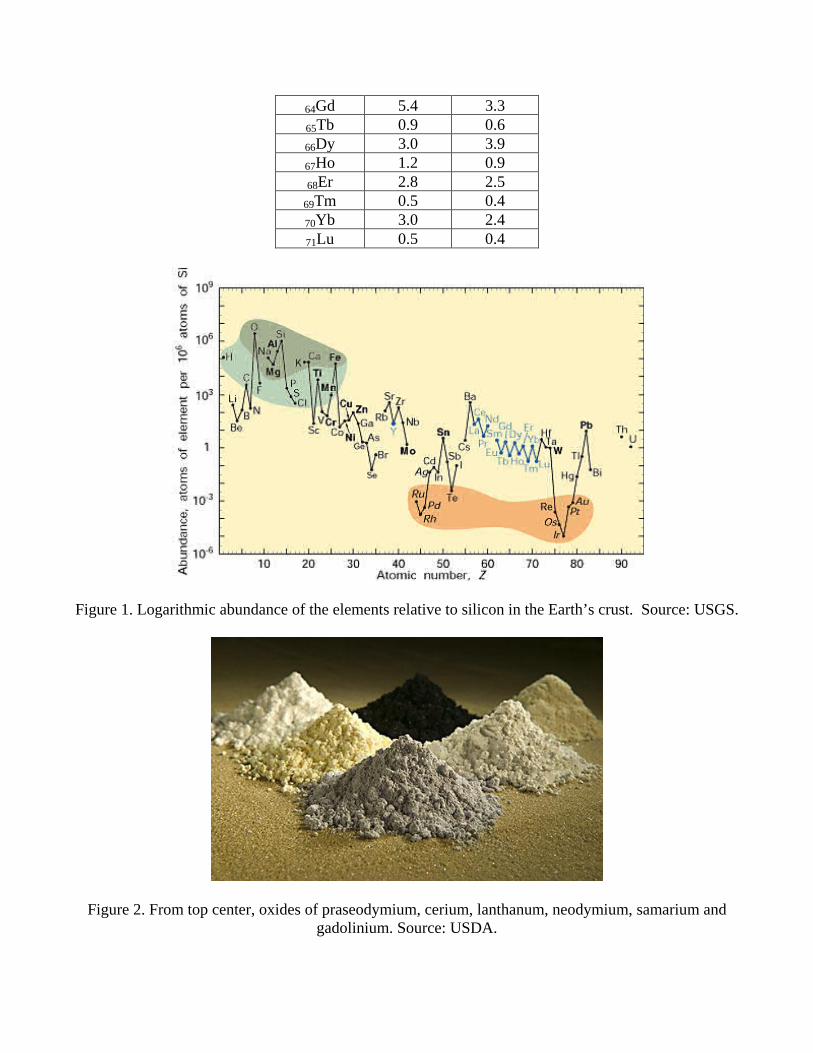
Figure 3. Thorium dioxide with 1 percent cerium oxide impregnated fabric, Welsbach incandescent gas
mantles (left) and ThO2 flakes (right). Yttrium compounds now substitute for Th in mantles.
Table 3. Spectroscopic analysis showing the common occurrence of Th and rare earth elements in Thorogummite [26].
Element
Thorogummite, (Th(SiO4)1-x (OH)4x)
Syenite complex, Wausau, Wisconsin
[26] [percent]
Th > 10 Fe 5-10 Si 2-5 Al, Ca, Mg, Y 1-2 Ti 0.5-1.0 Mn, Na, Ce, Dy, Er, Gd, La, Sm
0.2-0.5
Nd, Yb 0.1-0.2 Cu, Nb, Pb, V 0.05-0.1 Ba, Co, Sc 0.01-0.02 Be 0.002-0.005 U 2.5
The rare earth elements are finding new applications in metallurgical alloys, and electrical instruments and tools. Some uses of the rare earth elements are shown in Table 5. Added to other elements, they help maintain or alter their physical and structural conditions under different conditions. Used alone, they hold unique magnetic, electrical, chemical and luminescence properties. The rare earths are used in catalytic activities. A lanthanum rich rare earth mixture is used in petroleum refining to increase the yield of gasoline and other aromatics from heavy crude. Lanthanum and yttrium compounds possess high temperature superconducting properties. Mischmetal, a product of the electrolysis of anhydrous mixed rare earths chlorides is used in the iron and steel industry to improve the rolling properties. High strength low alloy steels treated with rare earths are used in the automobile industry. Rare earths metals are used in the manufacture of permanent magnets resulting in lighter, smaller and more efficient electrical motors and generators. Other applications include industrial air conditioners reducing power consumption by about 50 percent, hybrid electric cars, wind turbines and Magnetic Resonance Imaging (MRI) magnets. Dysprosium is used in heat resistant magnets used in automotive applications. Europium and yttrium oxides are used in the red phosphor component in color television sets. Neodymium is used in the face plates to enhance the picture brightness and contrast.

Lanthanum or gadolinium is used in x-ray intensification screens to reduce patient diagnostic radiation effective dose exposure. In ceramics and optics they are used as polishing compounds and glass additives. Emerging new technologies include Magnetic refrigeration using alloys of gadolinium and the magneto-caloric effect, electric bicycles using Nd magnets, tidal power and run-of–river hydro power generation. The rare earth elements are constituent in more than 100 minerals. The most important ones are monazite, bastnäsite, davidite, xenotime, euxenite, samarskite, and allanite (Table 4). Thorium as well as uranium appear as components in many of these minerals. The extraction industry has favored the use of minerals free of Th or U such as bastnäsite, even though it contains Ce142 which is radioactive albeit with a long half life and hence a low activity.
Table 4. Chemical composition of some rare earth ores with Th and U occurrence.
Ore Chemical composition Allanite (Ca,Ce,Th)2(Al,Fe,Mg)3Si3O12(OH) Monazite (Ce,La,Pr,Nd,Th,Y)PO4 Parisite 2(Ce,La,Di,Th)OF.CaO.3CO3 Polymignite (Ca,Fe,Y,Th)(Nb,Ti,Ta,Zr)O4 Euxenite (Y,Ca,Er,La,Ce,U,Th)(Nb,Ta,Ti)2O6 Cheralite (Ca,Ce,Th)(P,Si)O4 Samarskite (Y,Er,Ce,U,Ca,Fe,Pb,Th)(Nb,Ta,Ti,Sn)2O6 Thorogummite (Th(SiO4)1-x (OH)4x) Davidite (La,Ce)(Y,U,Fe+2)(Ti,Fe+3)20(O,OH)38 Fergusonite (Y,Er,Ce,Fe)(Nb,Ta,Ti)O4 Loparite (Ce,Na,Ca)(Ti,Nb)O3 Bastnäsite (Ce,La,Di)F.CO2
In the early 1980s, the General Motors (GM) Company developed an alternative method to manufacture magnets. Rather than use solid iron magnets, a magnetic powder which could be mixed with rubber and injected into molds then sintered, was adopted. This powder, like many high-performance magnets, required the use of neodymium, a rare earth. With the powder, less metal was needed, so that vehicle parts could be lighter in weight. GM's magnet division was named Magnequench. It followed a pattern of acquisition and outsourcing in USA manufacturing. Seeking favorable labor conditions, environmental regulations and better access to resources, its manufacturing facilities were moved overseas in 2004 after being acquired in 1995 by the San Huan New Materials Company, partially owned by National Nonferrous Metals Import and Export Company.

Figure 4. Enhanced field strength in rare earth permanent magnets in Mega Gauss Oersted (MGOe).
Table 5. Some technological uses of the rare earth elements [17].
Rare earth element Usage
Cerium
Automotive emission control, catalytic converters. Chemical and oil industries, oxidation and cracking catalyst. Manufacture of glass, paint, ceramics. Ultraviolet UV absorbing cut glass. Polishing powder for glass, lenses and mirrors. Lighter flints
Lanthanum Fluid cracking catalysts, processing of heavy crude oil and tar sands. Glass and ceramics production.
Samarium
Samarium cobalt (SmCo) ultra-high temperature magnets for space applications. Lighting products. Neutron absorber.
Europium Red phosphor color in display applications, television, digital projectors.
Gadolinium
Electronics. Magnetic refrigeration. Alloying agent. Nuclear medicine.
Yttrium Cathode Ray Tube, CRT, TV screens and computer displays. Lasers and semiconductors. Phosphors used in energy efficient lighting.
Dysprosium, Terbium
High operating temperature magnets. Magnets for wind turbines, mobile phones, hybrid cars. Jet and rocket engines.
0
10
20
30
40
50
60
Ferrite Al-Ni-Co Sm-Co Nd-Fe-B
Mag
net s
tren
gth
MG
Oe

High performance motor vehicles. Europium Yttrium Cerium
Liquid Crystal Displays, LCDs.
Cerium Lanthanum
Diesel Fuel additive.
Neodymium Praseodymium Dysprosium Terbium
Hybrid electric automobile motor and generator. Wind turbines generators’ magnets.
Neodymium Neodymium iron boron (NdFeB) high strength, light weight permanent magnets. Electric motors’ permanent magnets. Wind turbine generators. Magnetic bearings, jet engines, wind generators, uranium enrichment centrifuges Absorbing ultraviolet light. With cerium to decolor glass.
Cerium/Zirconium Lanthanum
Motor vehicles’ catalytic converters.
Lanthanum Cerium
Nickel metal hydride (NiMH) rechargeable batteries. Hybrid automobile batteries.
Lanthanum Samarium Gadolinium
Infrared absorption in glass. Improving the refractive index of glass. Microwave oven temperature controls.
Praesodymium Coloring agent in glass when the index of refraction must remain constant.
PROPERTIES OF THORIUM Thorium (Th) is named after Thor, the Scandinavian god of war. It occurs in nature in the form of a single isotope: Th232. Twelve artificial isotopes are known for Th. It occurs in Thorite, (Th,U)SiO4 and Thorianite (ThO2 + UO2). It is four times as abundant as uranium and is as abundant as lead and molybdenum. It can be commercially extracted from the Monazite mineral containing 3-22 percent ThO2 with other rare earth elements or lanthanides. Its large abundance makes it a valuable resource for electrical energy generation with supplies exceeding both coal and uranium combined. This would depend on breeding of the fissile isotope U233 from thorium according to the breeding reactions [20]:
1 232 2330 90 90
233 233 0 *90 91 -1
233 233 0 *91 92 -1
1 232 233 0 *0 90 92 -1
n + Th Th +
Th Pa + e + +
Pa U + e + + __________________________________n + Th U + 2 e + 2 3
γ
ν γ
ν γ
ν γ
→
→
→
→ +
(1)

Together with uranium, its radioactive decay chain leads to the stable Pb208 lead isotope with a half-life of 1.4 x 10¹⁰ years for Th232. It contributes to the internal heat generation in the Earth, together with other radioactive elements such as U and K40. As Th232 decays into the stable Pb208 isotope, radon220 or thoron forms in the chain. Rn220 has a low boiling point and exists in gaseous form at room temperature. It poses a radiation hazard through its own daughter nuclei and requires adequate ventilation in underground mining. Radon tests are needed to check for its presence in new homes that are possibly built on rocks like granite or sediments like shale or phosphate rock containing significant amounts of thorium. Adequate ventilation of homes that are over-insulated becomes a design consideration in this case. Thorium, in the metallic form, can be produced by reduction of ThO2 using calcium or magnesium. Also by electrolysis of anhydrous thorium chloride in a fused mixture of Na and K chlorides, by calcium reduction of Th tetrachloride mixed with anhydrous zinc chloride, and by reduction with an alkali metal of Th tetrachloride. Thorium is the second member of the actinides series in the periodic table of the elements. When pure, it is soft and ductile, can be cold-rolled and drawn and it is a silvery white metal retaining its luster in air for several months. If contaminated by the oxide, it tarnishes in air into a gray then black color. Thorium oxide has the highest melting temperature of all the oxides at 3,300 degrees C. Just a few other elements and compounds have a higher melting point such as tungsten and tantalum carbide. Water attacks it slowly, and acids do not attack it except for hydrochloric acid. Thorium in the powder form is pyrophyric and can burn in air with a bright white light. In portable gas lights the Welsbach mantle is prepared with ThO2 with 1 percent cerium oxide and other ingredients. As an alloying element in magnesium, it gives high strength and creep resistance at high temperatures. Tungsten wire and electrodes used in electrical and electronic equipment such as electron guns in x-ray tubes or video screens are coated with Th due to its low work function and associated high electron emission. Its oxide is used to control the grain size of tungsten used in light bulbs and in high temperature laboratory crucibles. Glasses for lenses in cameras and scientific instruments are doped with Th to give them a high refractive index and low dispersion of light. In the petroleum industry, it is used as a catalyst in the conversion of ammonia to nitric acid, in oil cracking, and in the production of sulfuric acid. ADVANTAGES OF THE THORIUM FUEL CYCLE The following advantages of the thorium fuel cycle over the U235-Pu239 fuel cycle have been suggested [8-14]: 1. Breeding is possible in both the thermal and fast parts of the neutron spectrum with a regeneration factor of η > 2 (Fig. 4).
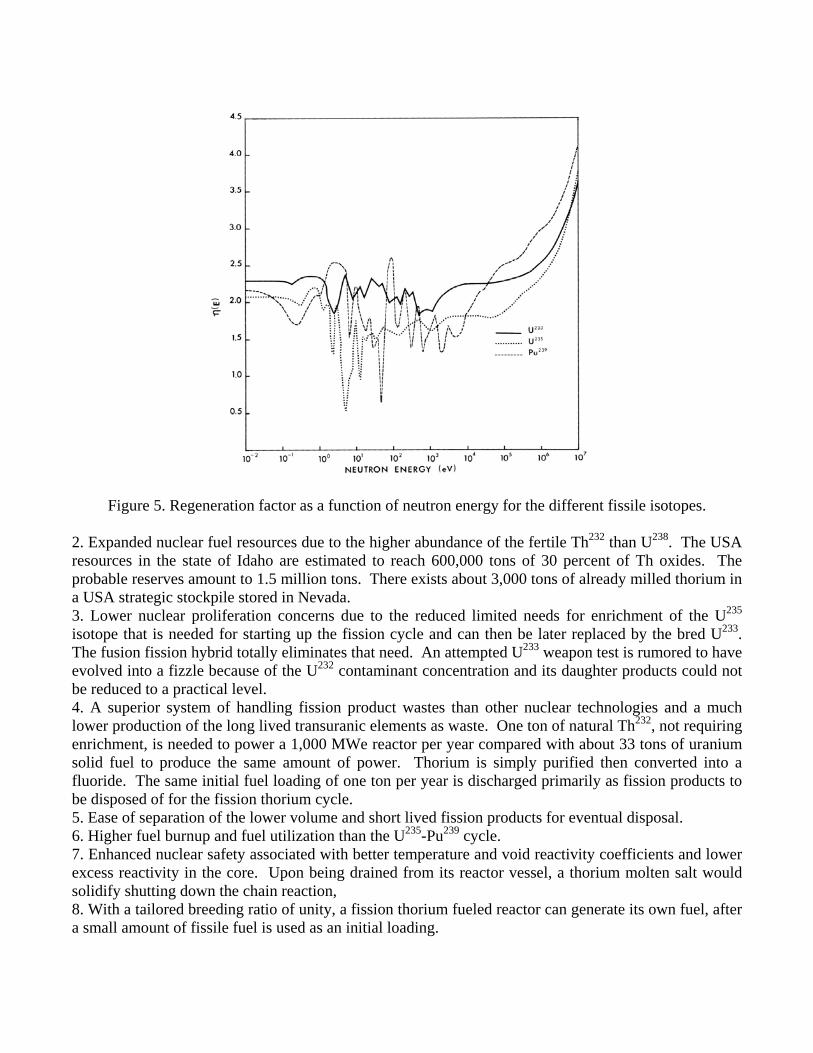
Figure 5. Regeneration factor as a function of neutron energy for the different fissile isotopes. 2. Expanded nuclear fuel resources due to the higher abundance of the fertile Th232 than U238. The USA resources in the state of Idaho are estimated to reach 600,000 tons of 30 percent of Th oxides. The probable reserves amount to 1.5 million tons. There exists about 3,000 tons of already milled thorium in a USA strategic stockpile stored in Nevada. 3. Lower nuclear proliferation concerns due to the reduced limited needs for enrichment of the U235 isotope that is needed for starting up the fission cycle and can then be later replaced by the bred U233. The fusion fission hybrid totally eliminates that need. An attempted U233 weapon test is rumored to have evolved into a fizzle because of the U232 contaminant concentration and its daughter products could not be reduced to a practical level. 4. A superior system of handling fission product wastes than other nuclear technologies and a much lower production of the long lived transuranic elements as waste. One ton of natural Th232, not requiring enrichment, is needed to power a 1,000 MWe reactor per year compared with about 33 tons of uranium solid fuel to produce the same amount of power. Thorium is simply purified then converted into a fluoride. The same initial fuel loading of one ton per year is discharged primarily as fission products to be disposed of for the fission thorium cycle. 5. Ease of separation of the lower volume and short lived fission products for eventual disposal. 6. Higher fuel burnup and fuel utilization than the U235-Pu239 cycle. 7. Enhanced nuclear safety associated with better temperature and void reactivity coefficients and lower excess reactivity in the core. Upon being drained from its reactor vessel, a thorium molten salt would solidify shutting down the chain reaction, 8. With a tailored breeding ratio of unity, a fission thorium fueled reactor can generate its own fuel, after a small amount of fissile fuel is used as an initial loading.
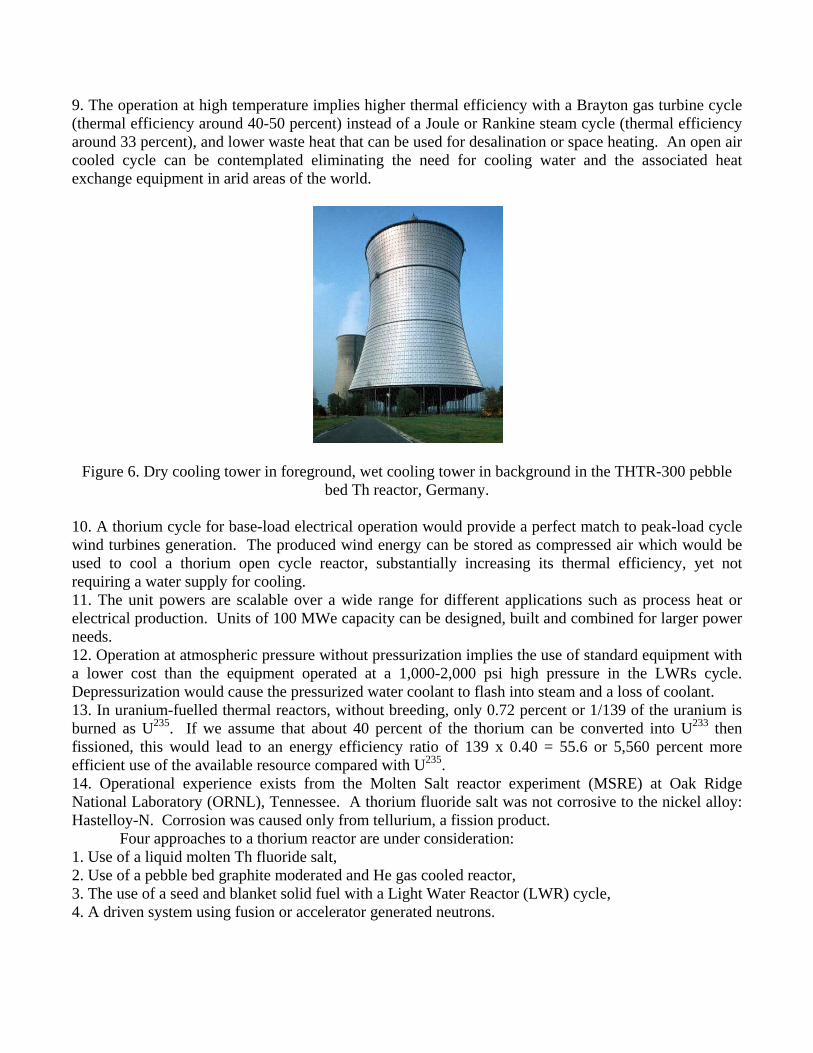
9. The operation at high temperature implies higher thermal efficiency with a Brayton gas turbine cycle (thermal efficiency around 40-50 percent) instead of a Joule or Rankine steam cycle (thermal efficiency around 33 percent), and lower waste heat that can be used for desalination or space heating. An open air cooled cycle can be contemplated eliminating the need for cooling water and the associated heat exchange equipment in arid areas of the world.
Figure 6. Dry cooling tower in foreground, wet cooling tower in background in the THTR-300 pebble bed Th reactor, Germany.
10. A thorium cycle for base-load electrical operation would provide a perfect match to peak-load cycle wind turbines generation. The produced wind energy can be stored as compressed air which would be used to cool a thorium open cycle reactor, substantially increasing its thermal efficiency, yet not requiring a water supply for cooling. 11. The unit powers are scalable over a wide range for different applications such as process heat or electrical production. Units of 100 MWe capacity can be designed, built and combined for larger power needs. 12. Operation at atmospheric pressure without pressurization implies the use of standard equipment with a lower cost than the equipment operated at a 1,000-2,000 psi high pressure in the LWRs cycle. Depressurization would cause the pressurized water coolant to flash into steam and a loss of coolant. 13. In uranium-fuelled thermal reactors, without breeding, only 0.72 percent or 1/139 of the uranium is burned as U235. If we assume that about 40 percent of the thorium can be converted into U233 then fissioned, this would lead to an energy efficiency ratio of 139 x 0.40 = 55.6 or 5,560 percent more efficient use of the available resource compared with U235. 14. Operational experience exists from the Molten Salt reactor experiment (MSRE) at Oak Ridge National Laboratory (ORNL), Tennessee. A thorium fluoride salt was not corrosive to the nickel alloy: Hastelloy-N. Corrosion was caused only from tellurium, a fission product. Four approaches to a thorium reactor are under consideration: 1. Use of a liquid molten Th fluoride salt, 2. Use of a pebble bed graphite moderated and He gas cooled reactor, 3. The use of a seed and blanket solid fuel with a Light Water Reactor (LWR) cycle, 4. A driven system using fusion or accelerator generated neutrons.
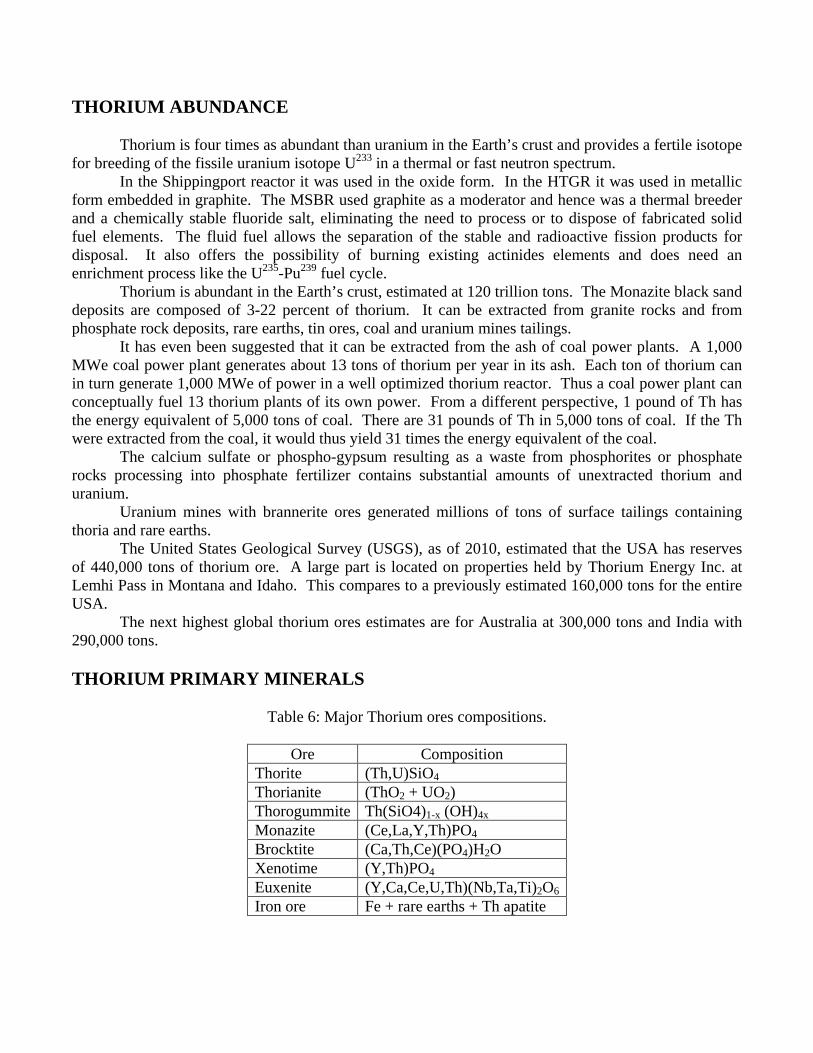
THORIUM ABUNDANCE Thorium is four times as abundant than uranium in the Earth’s crust and provides a fertile isotope for breeding of the fissile uranium isotope U233 in a thermal or fast neutron spectrum. In the Shippingport reactor it was used in the oxide form. In the HTGR it was used in metallic form embedded in graphite. The MSBR used graphite as a moderator and hence was a thermal breeder and a chemically stable fluoride salt, eliminating the need to process or to dispose of fabricated solid fuel elements. The fluid fuel allows the separation of the stable and radioactive fission products for disposal. It also offers the possibility of burning existing actinides elements and does need an enrichment process like the U235-Pu239 fuel cycle. Thorium is abundant in the Earth’s crust, estimated at 120 trillion tons. The Monazite black sand deposits are composed of 3-22 percent of thorium. It can be extracted from granite rocks and from phosphate rock deposits, rare earths, tin ores, coal and uranium mines tailings. It has even been suggested that it can be extracted from the ash of coal power plants. A 1,000 MWe coal power plant generates about 13 tons of thorium per year in its ash. Each ton of thorium can in turn generate 1,000 MWe of power in a well optimized thorium reactor. Thus a coal power plant can conceptually fuel 13 thorium plants of its own power. From a different perspective, 1 pound of Th has the energy equivalent of 5,000 tons of coal. There are 31 pounds of Th in 5,000 tons of coal. If the Th were extracted from the coal, it would thus yield 31 times the energy equivalent of the coal. The calcium sulfate or phospho-gypsum resulting as a waste from phosphorites or phosphate rocks processing into phosphate fertilizer contains substantial amounts of unextracted thorium and uranium. Uranium mines with brannerite ores generated millions of tons of surface tailings containing thoria and rare earths. The United States Geological Survey (USGS), as of 2010, estimated that the USA has reserves of 440,000 tons of thorium ore. A large part is located on properties held by Thorium Energy Inc. at Lemhi Pass in Montana and Idaho. This compares to a previously estimated 160,000 tons for the entire USA. The next highest global thorium ores estimates are for Australia at 300,000 tons and India with 290,000 tons. THORIUM PRIMARY MINERALS
Table 6: Major Thorium ores compositions.
Ore Composition Thorite (Th,U)SiO4 Thorianite (ThO2 + UO2) Thorogummite Th(SiO4)1-x (OH)4x Monazite (Ce,La,Y,Th)PO4 Brocktite (Ca,Th,Ce)(PO4)H2O Xenotime (Y,Th)PO4 Euxenite (Y,Ca,Ce,U,Th)(Nb,Ta,Ti)2O6 Iron ore Fe + rare earths + Th apatite
Thorium occurs in several minerals [16, 19]: 1. Monazite, (Ce,La,Y,Th)PO4, a rare earth-thorium phosphate with 5-5.5 hardness. Its content in Th is 3-22 percent with 14 percent rare earth elements and yttrium. It occurs as a yellowish, reddish-brown to brown, with shades of green, nearly white, yellowish brown and yellow ore. This is the primary source of the world’s thorium production. Until World War II, thorium was extracted from Monazite as a primary product for use in products such as camping lamp mantles. After World War II, Monazite has been primarily mined for its rare earth elements content. Thorium was extracted in small amounts and mainly discarded as waste. 2. Thorite, (Th,U)SiO4 is a thorium-uranium silicate with a 4.5 hardness with yellow, yellow-brown, red-brown, green, and orange to black colors. It shares a 22 percent Th and a 22 percent U content. This ore has been used as a source of uranium, particularly the uranium rich uranothorite, and orangite; an orange colored calcium-rich thorite variety. 3. Brocktite, (Ca,Th,Ce)(PO4)H2O. 4. Xenotime, (Y,Th)PO4. 5. Euxenite, (Y,Ca,Ce,U,Th)(Nb,Ta,Ti)2O6. 6. Iron ore, (Fe)-rare earth elements-Th-apatite, Freta deposits at Pea Ridge, Missouri, Mineville, New York, and Scrub Oaks, New Jersey. GLOBAL AND USA THORIUM RESOURCES Estimates of the available Th resources vary widely. The largest known resources of Th occur in the USA followed in order by Australia, India, Canada, South Africa, Brazil, and Malaysia. Concentrated deposits occur as vein deposits, and disseminated deposits occur as massive carbonatite stocks, alkaline intrusions, and black sand placer or alluvial stream and beach deposits. Carbonatites are rare carbonate igneous rocks formed by magmatic or metasomatic processes. Most of these are composed of 50 percent or higher carbonate minerals such as calcite, dolomite and/or ankerite. They occur near alkaline igneous rocks.
Table 7. Estimated Global Thorium Resources [16].
Country
ThO2 Reserves [metric tonnes] USGS estimate
2010 [16]
ThO2 Reserves [metric tonnes]
NEA estimate [22]***
Mined amounts
2007 [metric tonnes]*
USA 440,000 400,000 -** Australia 300,000 489,000 - Turkey 344,000 India 290,000 319,000 5,000 Venezuela 300,000 Canada 100,000 44,000 - South Africa
35,000 18,000 -
Brazil 16,000 302,000 1,173 Norway 132,000 Egypt 100,000
Russia 75,000 Greenland 54,000 Canada 44,000 Malaysia 4,500 800 Other countries
90,000 33,000 -
Total 1,300,000 2,610,000 6,970 * Average Th content of 6-8 percent. ** Last mined in 1994. ***Reasonably assured and inferred resources available at up to $80/kg Th The alkaline igneous rocks, also referred to as alkali rocks, have formed from magmas and fluids so enriched in alkali elements that Na and K bearing minerals form components of the rocks in larger proportion than usual igneous rocks. They are characterized by feldspathoid minerals and/or alkali pyroxenes and amphiboles [19].
Table 8. Locations of USA major ThO2 proven reserves [19].
Deposit type
Mining District Location
ThO2 reserves [metric tonnes]
Vein deposits
Lehmi Pass district
Montana-Idaho
64,000
Wet Mountain area
Colorado 58,200
Hall Mountain
Idaho 4,150
Iron Hill Colorado 1,700 (thorium veins) 690 (Carbonatite dikes)
Diamond Creek
Idaho -
Bear Lodge Mountains
Wyoming -
Monroe Canyon
Utah -
Mountain Pass district
California -
Quartzite district
Arizona -
Cottonwood area
Arizona -
Gold Hill district
New Mexico
-
Capitan Mountain
New Mexico
-
Laughlin Peak
New Mexico
-
Wausau, Marathon County
Wisconsin -
Bokan Mountain
Alaska -
Massive Carbonatite stocks
Iron Hill Colorado 28,200
Mountain Pass
California 8,850
Black Sand Placer, Alluvial Deposits
Stream deposits
North, South Carolina
4,800
Stream placers
Idaho 9,130
Beach placers
Florida-Georgia
14,700
Alkaline Intrusions
Bear Lodge Mountains
Wyoming -
Hicks Dome
Illinois -
Total, USA 194,420
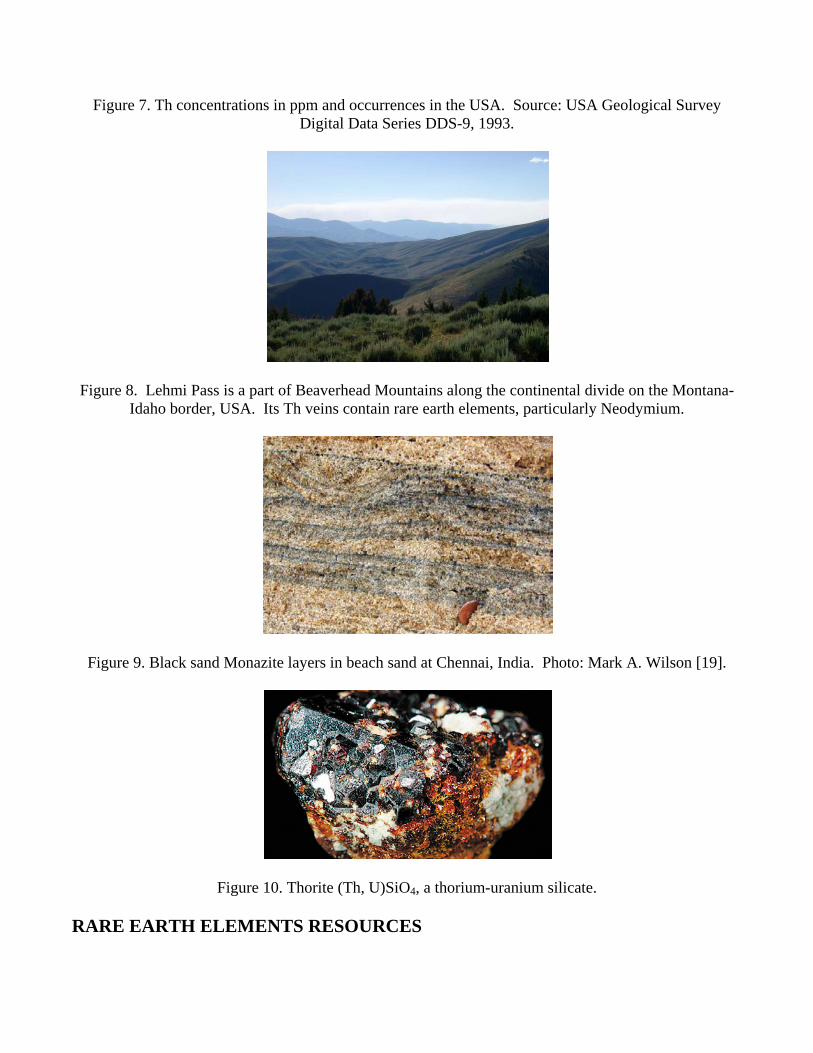
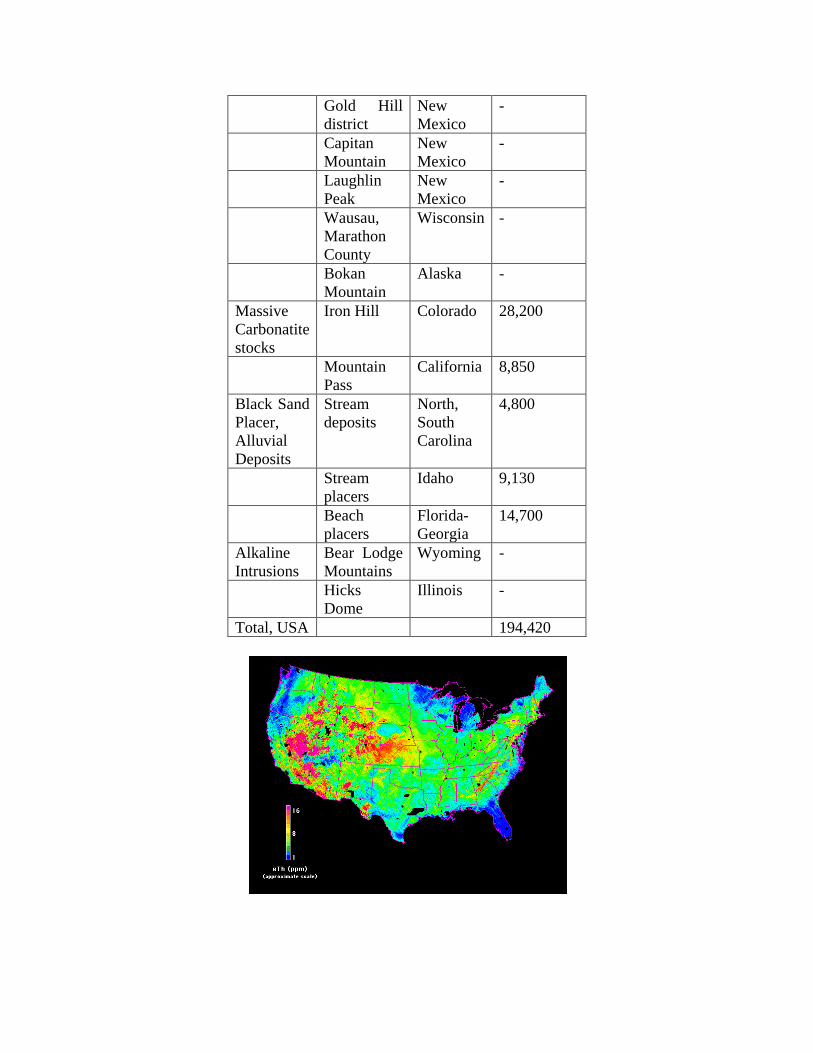
Figure 7. Th concentrations in ppm and occurrences in the USA. Source: USA Geological Survey Digital Data Series DDS-9, 1993.
Figure 8. Lehmi Pass is a part of Beaverhead Mountains along the continental divide on the Montana-Idaho border, USA. Its Th veins contain rare earth elements, particularly Neodymium.
Figure 9. Black sand Monazite layers in beach sand at Chennai, India. Photo: Mark A. Wilson [19].
Figure 10. Thorite (Th, U)SiO4, a thorium-uranium silicate. RARE EARTH ELEMENTS RESOURCES
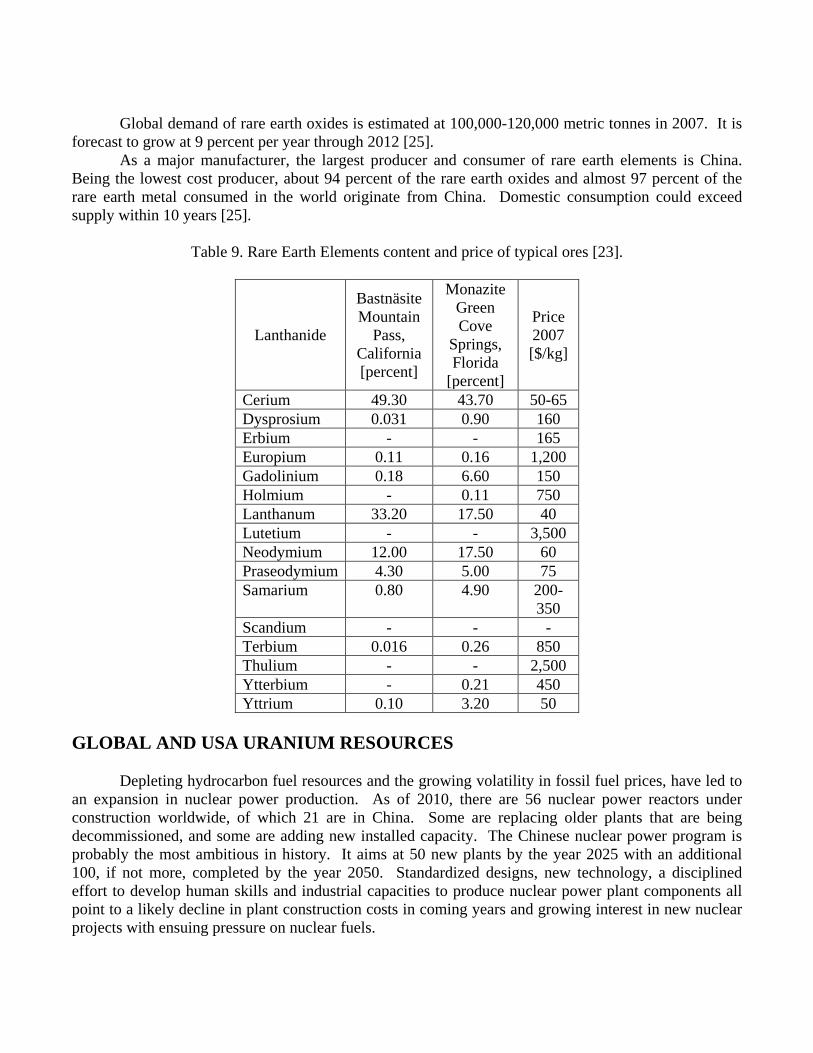
Global demand of rare earth oxides is estimated at 100,000-120,000 metric tonnes in 2007. It is forecast to grow at 9 percent per year through 2012 [25]. As a major manufacturer, the largest producer and consumer of rare earth elements is China. Being the lowest cost producer, about 94 percent of the rare earth oxides and almost 97 percent of the rare earth metal consumed in the world originate from China. Domestic consumption could exceed supply within 10 years [25].
Table 9. Rare Earth Elements content and price of typical ores [23].
Lanthanide
Bastnäsite Mountain
Pass, California [percent]
Monazite Green Cove
Springs, Florida
[percent]
Price 2007 [$/kg]
Cerium 49.30 43.70 50-65 Dysprosium 0.031 0.90 160 Erbium - - 165 Europium 0.11 0.16 1,200 Gadolinium 0.18 6.60 150 Holmium - 0.11 750 Lanthanum 33.20 17.50 40 Lutetium - - 3,500 Neodymium 12.00 17.50 60 Praseodymium 4.30 5.00 75 Samarium 0.80 4.90 200-
350 Scandium - - - Terbium 0.016 0.26 850 Thulium - - 2,500 Ytterbium - 0.21 450 Yttrium 0.10 3.20 50
GLOBAL AND USA URANIUM RESOURCES Depleting hydrocarbon fuel resources and the growing volatility in fossil fuel prices, have led to an expansion in nuclear power production. As of 2010, there are 56 nuclear power reactors under construction worldwide, of which 21 are in China. Some are replacing older plants that are being decommissioned, and some are adding new installed capacity. The Chinese nuclear power program is probably the most ambitious in history. It aims at 50 new plants by the year 2025 with an additional 100, if not more, completed by the year 2050. Standardized designs, new technology, a disciplined effort to develop human skills and industrial capacities to produce nuclear power plant components all point to a likely decline in plant construction costs in coming years and growing interest in new nuclear projects with ensuing pressure on nuclear fuels.

Figure 11. Number of power reactors under construction worldwide. Total: 56. Net electrical capacity: 51.9 MWe. Data source: IAEA, 2010.
It should be noted that there are currently 150 international reactor projects in some advanced permitting stage. An additional 300 projects are in some early planning stage. Added to a significant fraction of the currently 439 operating power reactors will likely double global nuclear capacity in the coming couple decades (most countries seem willing to try to extend the operating lives of existing reactors through safety-compliant upgrades and retrofits). Building a nuclear power plant practically requires contracting its fuel supply for 40-60 years. When adding all new projects it is reasonable to conclude that fuel requirements could double in the coming couple decades. About 30 percent of the known recoverable global uranium oxide resources are found in Australia, followed by Kazakhstan (17 percent), Canada (12 percent), South Africa (8 percent), Namibia (6 percent), and Russia, Brazil and the USA, each with about 4 percent of the world production [21]. The uranium resources are classified into “conventional” and “non-conventional” resources. The conventional resources are further categorized into “Reasonably Assured Resources,” RAR and the believed-to-exist “Inferred Resources,” IR. The RAR and IR categories are further subdivided according to the assumed exploitation cost in USA dollars. These cost categories are given as < 40 $/kg, < 80 $/kg, and < 130 $/kg. The non-conventional resources are split into “Undiscovered Resources,” UR, further separated into “Undiscovered Prognosticated Resources,” UPR with assumed cost ranges of < 80 $/kg and < 130 $/kg, and “Undiscovered Speculative Resources” USR. The USR numbers are given for an estimated exploitation cost of < 130 $/kg and also for a category with an unknown cost. In the twentieth century, the USA was the world leading uranium producer until it was surpassed by Canada and Australia. In 2007, Canada accounted for 23 percent and Australia for 21 percent of global production, with the USA at 4 percent. Africa is becoming a new frontier in uranium production with Namibia 7 percent, Niger 8 percent, and South Africa 1 percent. Exploration and new mine development is ongoing in Botswana, Tanzania. Jordan and Nigeria.
1 1 1 1 1 1 1
2 2 2 2
5 6
9 21
0 5 10 15 20 25
ArgentinaFinlandFranceJapan
PakistanUSA
Islamic Republic of IranBulgaria
Slovak RepublicUkraineTaiwan
IndiaRepublic of Korea
RussiaChina

The federal, provincial and local governments in Australia have all unilaterally and forcefully banned the development of any new uranium mines, even though existing mines continue operation. The French company Areva was not successful in receiving approval to build a new uranium mine in Australia. It has mining activities in the Niger Republic and received exploration licenses in other countries such as Jordan. Canadian producer Cameco rates as the first world producer of uranium oxide, followed by French Areva, and then Energy Resources of Australia (68 percent owned by Rio Tinto), which produces some 6,000 tons per year. As of 2007, five operating uranium mines existed in the USA, with 3 in Texas, one in Wyoming and one in Northern Nebraska as shown in Table 10. The state of Texas has a positive attitude towards uranium mining, and energy production in general, with an advantageous regulatory framework that streamlines the permit process using in situ leaching of uranium. Texas, being an “Agreement State,” implies that the USA Nuclear Regulatory Commission (NRC) has delegated its authority to the state regulatory agencies such as the Texas Commission on Environmental Quality (TCEQ), and companies deal directly with the state agencies in Texas rather than with the federal government’s NRC. Most of the uranium mining operations in the USA and Kazakhstan use in situ leach methods, also designated as In Situ Recovery (ISR) methods. Conventional methods are used in 62 percent of U mining, with 28 percent as ISR and 9 percent as byproduct extraction. By 2008, U production in the USA fell 15 percent to 1,780 tonnes U3O8. The U production in the USA is currently from one mill at White Mesa, Utah, and from 6 ISR operations. In 2007, four operating mines existed in the Colorado Plateau area: Topaz, Pandora, West Sunday and Sunday-St. Jude. Two old mines reopened in 2008: Rim Canyon and Beaver Shaft and the Van 4 mine came into production in 2009. As of 2010, Cameco Resources operated two ISL operations: Smith Ranch-Highland Mine in Wyoming and Cross Butte Mine in Nebraska, with reserves of 15,000 tonnes U3O8. The Denison Mines Company produced 791,000 tonnes of U3O8 in 2008 at its 200 t/day White Mesa mill in Southern Utah from its own and purchased ore, as well as toll milling.
Table 10: World main producing uranium mines, 2008. Source: World Nuclear Association, WNA.
Country Production [tonnes U]
Share of world
production [percent]
Main owner Extraction method Mine
Canada 6,383 15 Cameco Conventional McArthur River
Australia 4,527 10 Rio Tinto
Conventional Ranger
Namibia 3,449 8 Rio Tinto
Conventional Rδssing
Australia 3,344 8 BHP Billiton
Byproduct Olympic Dam
Russia 3,050 7 ARMZ Conventional Priargunsky
Niger 1,743 4 Areva Conventional Somair Canada 1,368 3 Cameco Conventional Rabbit
Lake Niger 1,289 3 Areva Conventional Cominak Canada 1,249 3 Areva Conventional McLean Kazakhstan 1,034 2 Uranium
One In Situ Retorting, ISR
Akdata
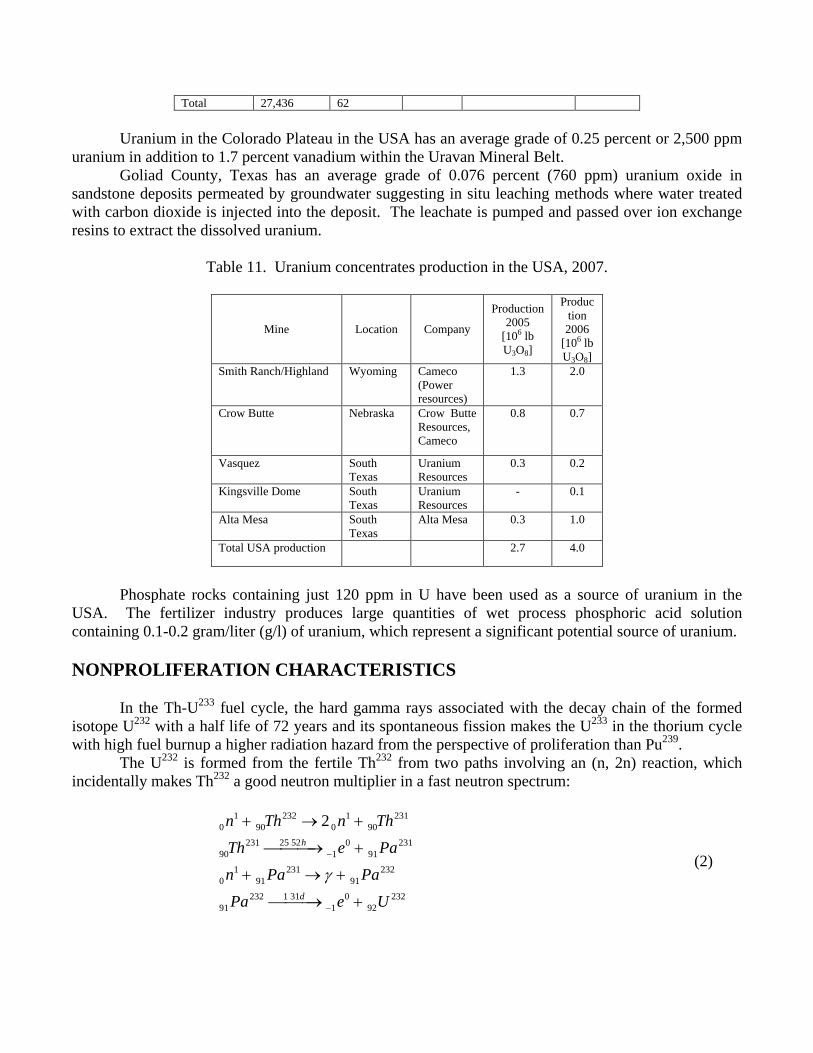
Total 27,436 62 Uranium in the Colorado Plateau in the USA has an average grade of 0.25 percent or 2,500 ppm uranium in addition to 1.7 percent vanadium within the Uravan Mineral Belt. Goliad County, Texas has an average grade of 0.076 percent (760 ppm) uranium oxide in sandstone deposits permeated by groundwater suggesting in situ leaching methods where water treated with carbon dioxide is injected into the deposit. The leachate is pumped and passed over ion exchange resins to extract the dissolved uranium.
Table 11. Uranium concentrates production in the USA, 2007.
Mine Location Company
Production 2005
[106 lb U3O8]
Production 2006
[106 lb U3O8]
Smith Ranch/Highland Wyoming Cameco (Power resources)
1.3 2.0
Crow Butte Nebraska Crow Butte Resources, Cameco
0.8 0.7
Vasquez South Texas
Uranium Resources
0.3 0.2
Kingsville Dome South Texas
Uranium Resources
- 0.1
Alta Mesa South Texas
Alta Mesa 0.3 1.0
Total USA production 2.7 4.0
Phosphate rocks containing just 120 ppm in U have been used as a source of uranium in the USA. The fertilizer industry produces large quantities of wet process phosphoric acid solution containing 0.1-0.2 gram/liter (g/l) of uranium, which represent a significant potential source of uranium. NONPROLIFERATION CHARACTERISTICS In the Th-U233 fuel cycle, the hard gamma rays associated with the decay chain of the formed isotope U232 with a half life of 72 years and its spontaneous fission makes the U233 in the thorium cycle with high fuel burnup a higher radiation hazard from the perspective of proliferation than Pu239. The U232 is formed from the fertile Th232 from two paths involving an (n, 2n) reaction, which incidentally makes Th232 a good neutron multiplier in a fast neutron spectrum:
1 232 1 2310 90 0 90
25 52231 0 23190 1 91
1 231 2320 91 91
1 31232 0 23291 1 92
2h
d
n Th n ThTh e Pan Pa PaPa e U
γ−
−
+ → +
→ +
+ → +
→ +
(2)
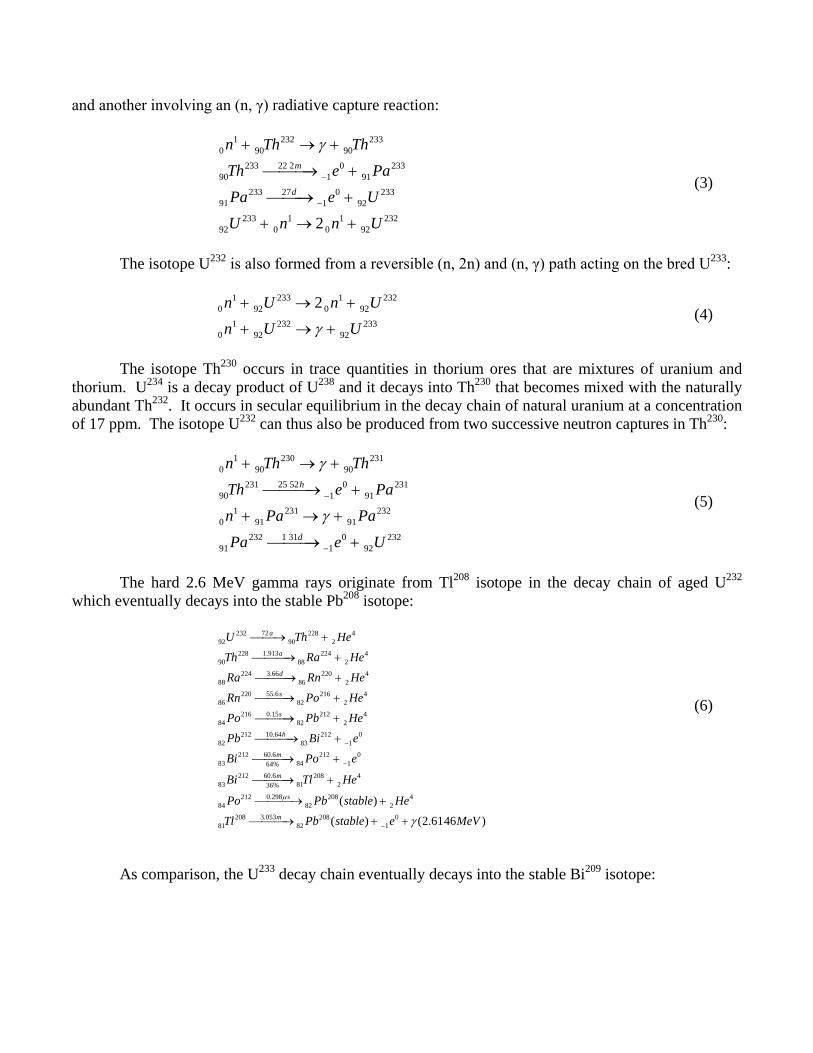
and another involving an (n, γ) radiative capture reaction:
1 232 2330 90 90
22 2233 0 23390 1 91
27233 0 23391 1 92
233 1 1 23292 0 0 922
m
d
n Th ThTh e PaPa e UU n n U
γ
−
−
+ → +
→ +
→ +
+ → +
(3)
The isotope U232 is also formed from a reversible (n, 2n) and (n, γ) path acting on the bred U233:
1 233 1 232
0 92 0 921 232 233
0 92 92
2n U n Un U Uγ
+ → +
+ → + (4)
The isotope Th230 occurs in trace quantities in thorium ores that are mixtures of uranium and thorium. U234 is a decay product of U238 and it decays into Th230 that becomes mixed with the naturally abundant Th232. It occurs in secular equilibrium in the decay chain of natural uranium at a concentration of 17 ppm. The isotope U232 can thus also be produced from two successive neutron captures in Th230:
1 230 2310 90 90
25 52231 0 23190 1 91
1 231 2320 91 91
1 31232 0 23291 1 92
h
d
n Th ThTh e Pan Pa PaPa e U
γ
γ−
−
+ → +
→ +
+ → +
→ +
(5)
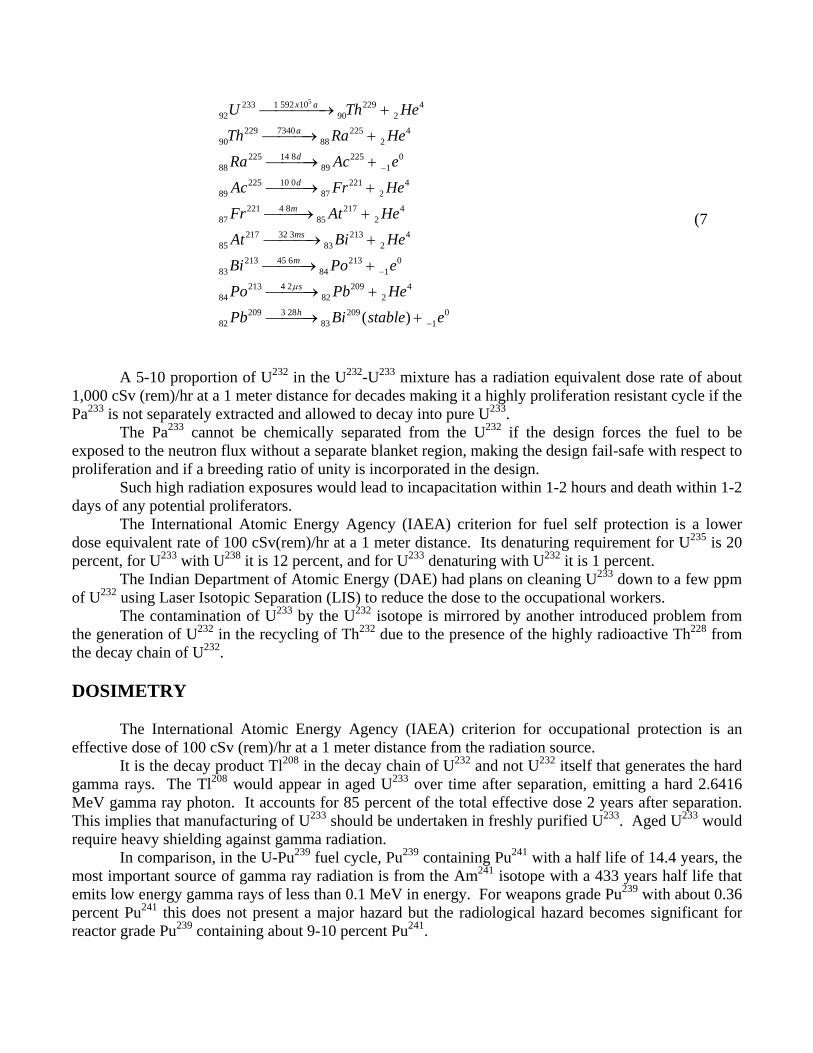
The hard 2.6 MeV gamma rays originate from Tl208 isotope in the decay chain of aged U232 which eventually decays into the stable Pb208 isotope:
72232 228 492 90 2
1.913228 224 490 88 2
3.66224 220 488 86 2
55.6220 216 486 82 2
0.15216 212 484 82 2
10.64212 212 082 83 1
60.6212 212 083 84 164%
83
a
a
d
s
s
h
m
U Th HeTh Ra HeRa Rn HeRn Po HePo Pb HePb Bi eBi Po e
B
−
−
→ +
→ +
→ +
→ +
→ +
→ +
→ +60.6212 208 4
81 236%0.298212 208 4
84 82 23.053208 208 0
81 82 1
( )
( ) (2.6146 )
m
s
m
i Tl He
Po Pb stable HeTl Pb stable e MeV
µ
γ−
→ +
→ +
→ + +
(6)
As comparison, the U233 decay chain eventually decays into the stable Bi209 isotope:
51 592 10233 229 492 90 2
7340229 225 490 88 2
14 8225 225 088 89 1
10 0225 221 489 87 2
4 8221 217 487 85 2
32 3217 213 485 83 2
45 6213 21383 84 1
x a
a
d
d
m
ms
m
U Th HeTh Ra HeRa Ac eAc Fr HeFr At HeAt Bi HeBi Po e
−
−
→ +
→ +
→ +
→ +
→ +
→ +
→ + 0
4 2213 209 484 82 2
3 28209 209 082 83 1( )
s
h
Po Pb HePb Bi stable e
µ
−
→ +
→ +
(7
A 5-10 proportion of U232 in the U232-U233 mixture has a radiation equivalent dose rate of about 1,000 cSv (rem)/hr at a 1 meter distance for decades making it a highly proliferation resistant cycle if the Pa233 is not separately extracted and allowed to decay into pure U233. The Pa233 cannot be chemically separated from the U232 if the design forces the fuel to be exposed to the neutron flux without a separate blanket region, making the design fail-safe with respect to proliferation and if a breeding ratio of unity is incorporated in the design. Such high radiation exposures would lead to incapacitation within 1-2 hours and death within 1-2 days of any potential proliferators. The International Atomic Energy Agency (IAEA) criterion for fuel self protection is a lower dose equivalent rate of 100 cSv(rem)/hr at a 1 meter distance. Its denaturing requirement for U235 is 20 percent, for U233 with U238 it is 12 percent, and for U233 denaturing with U232 it is 1 percent. The Indian Department of Atomic Energy (DAE) had plans on cleaning U233 down to a few ppm of U232 using Laser Isotopic Separation (LIS) to reduce the dose to the occupational workers. The contamination of U233 by the U232 isotope is mirrored by another introduced problem from the generation of U232 in the recycling of Th232 due to the presence of the highly radioactive Th228 from the decay chain of U232. DOSIMETRY
The International Atomic Energy Agency (IAEA) criterion for occupational protection is an effective dose of 100 cSv (rem)/hr at a 1 meter distance from the radiation source. It is the decay product Tl208 in the decay chain of U232 and not U232 itself that generates the hard gamma rays. The Tl208 would appear in aged U233 over time after separation, emitting a hard 2.6416 MeV gamma ray photon. It accounts for 85 percent of the total effective dose 2 years after separation. This implies that manufacturing of U233 should be undertaken in freshly purified U233. Aged U233 would require heavy shielding against gamma radiation. In comparison, in the U-Pu239 fuel cycle, Pu239 containing Pu241 with a half life of 14.4 years, the most important source of gamma ray radiation is from the Am241 isotope with a 433 years half life that emits low energy gamma rays of less than 0.1 MeV in energy. For weapons grade Pu239 with about 0.36 percent Pu241 this does not present a major hazard but the radiological hazard becomes significant for reactor grade Pu239 containing about 9-10 percent Pu241.
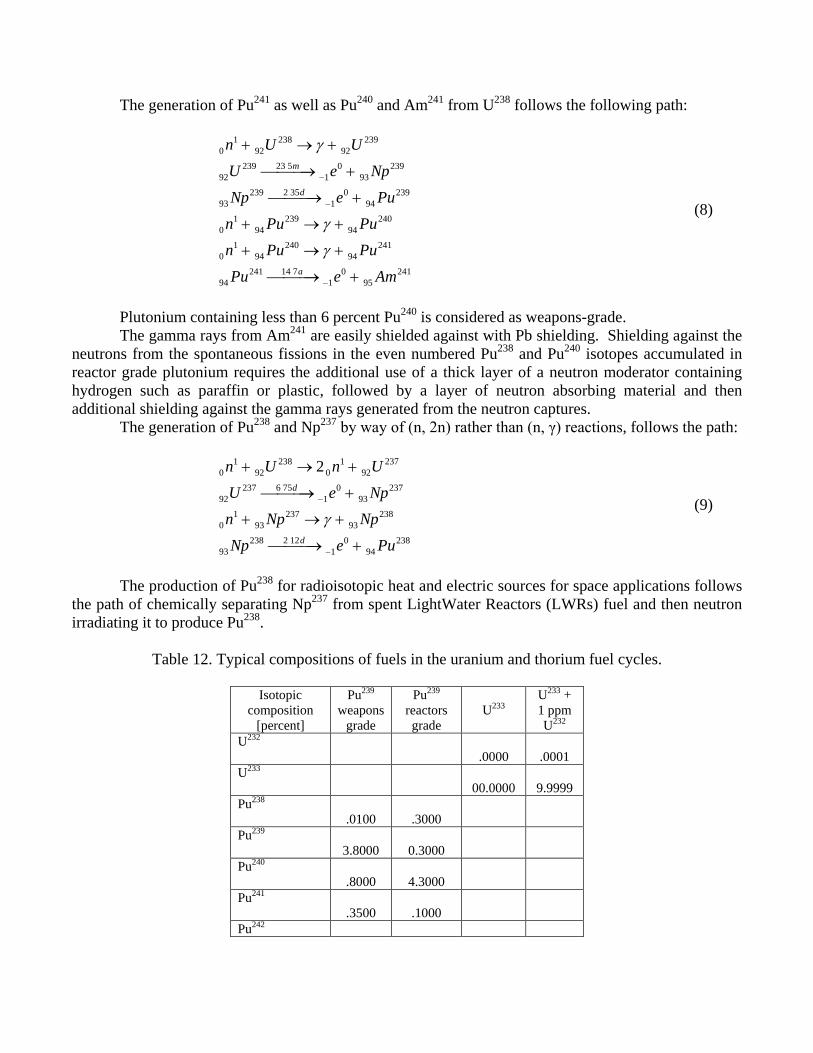
The generation of Pu241 as well as Pu240 and Am241 from U238 follows the following path:
1 238 2390 92 92
23 5239 0 23992 1 93
2 35239 0 23993 1 94
1 239 2400 94 94
1 240 2410 94 94
14 7241 0 24194 1 95
m
d
a
n U UU e NpNp e Pu
n Pu Pun Pu PuPu e Am
γ
γ
γ
−
−
−
+ → +
→ +
→ +
+ → +
+ → +
→ +
(8)
Plutonium containing less than 6 percent Pu240 is considered as weapons-grade. The gamma rays from Am241 are easily shielded against with Pb shielding. Shielding against the neutrons from the spontaneous fissions in the even numbered Pu238 and Pu240 isotopes accumulated in reactor grade plutonium requires the additional use of a thick layer of a neutron moderator containing hydrogen such as paraffin or plastic, followed by a layer of neutron absorbing material and then additional shielding against the gamma rays generated from the neutron captures. The generation of Pu238 and Np237 by way of (n, 2n) rather than (n, γ) reactions, follows the path:
1 238 1 2370 92 0 92
6 75237 0 23792 1 93
1 237 2380 93 93
2 12238 0 23893 1 94
2d
d
n U n UU e Npn Np NpNp e Pu
γ−
−
+ → +
→ +
+ → +
→ +
(9)
The production of Pu238 for radioisotopic heat and electric sources for space applications follows the path of chemically separating Np237 from spent LightWater Reactors (LWRs) fuel and then neutron irradiating it to produce Pu238.
Table 12. Typical compositions of fuels in the uranium and thorium fuel cycles.
Isotopic composition
[percent]
Pu239
weapons grade
Pu239
reactors grade
U233 U233 + 1 ppm U232
U232 .0000 .0001
U233 00.0000 9.9999
Pu238 .0100 .3000
Pu239 3.8000 0.3000
Pu240 .8000 4.3000
Pu241 .3500 .1000
Pu242

.0200 .0000 Density [gm/cm3] 9.86 9.86 9.05 9.05 Radius [cm]
.92 .92 .96 .96 Weight [kg]
Table 13. Glove box operation dose rate required to accumulate a limiting occupational 5 cSv (rem)
dose equivalent from a 5 kg metal sphere, one year after separation at a 1/2 meter distance [27].
Fuel, U232/U233
Time to 5 cSv effective
dose [hr]
Effective dose rate
cSv/hr
0.01 0.039 127.0000 100 ppm 3.937 1.2700 5 ppm 84.746 0.0590 1 ppm 384.615 0.0130 Reactor grade Pu239 609.756 0.0082 Weapons grade Pu239 3846.154 0.0013
Both reactor-grade plutonium and U233 with U232 would pose a significant radiation dose equivalent hazard for manufacturing personnel as well as military personnel, which precludes their use in weapons manufacture in favor of enriched U235 and weapons-grade Pu239.
Table 14. Dose equivalent rates in cSv (rem)/hr from 5 kg metal spheres at a 1/2 meter distance for different times after separation [27].
Material Type of
radiation Dose equivalent rate at time after
separation [cSv(rem)/hr]
0 yr 1 yr 5 yr 10 yr 15 yr Pure U233 γ total 0.32 0.42 0.84 1.35 1.89 U233 +1 ppm U232
γ total 0.32 13.08 35.10 39.57 39.17 γ from Tl208
0.00 11.12 29.96 33.48 32.64
Pu239,, weapons grade
γ 0.49 0.71 1.16 1.57 1.84 neutrons 0.56 0.56 0.56 0.56 0.56 γ + neutron
1.05 1.27 1.72 2.13 2.40
Pu239, Reactor grade
γ total 0.49 5.54 16.72 28.64 37.54 γ from Am241
0.00 3.24 14.60 26.00 34.80
neutrons 2.66 2.66 2.65 2.64 2.63 γ + neutrons
3.15 8.20 19.37 31.28 40.17
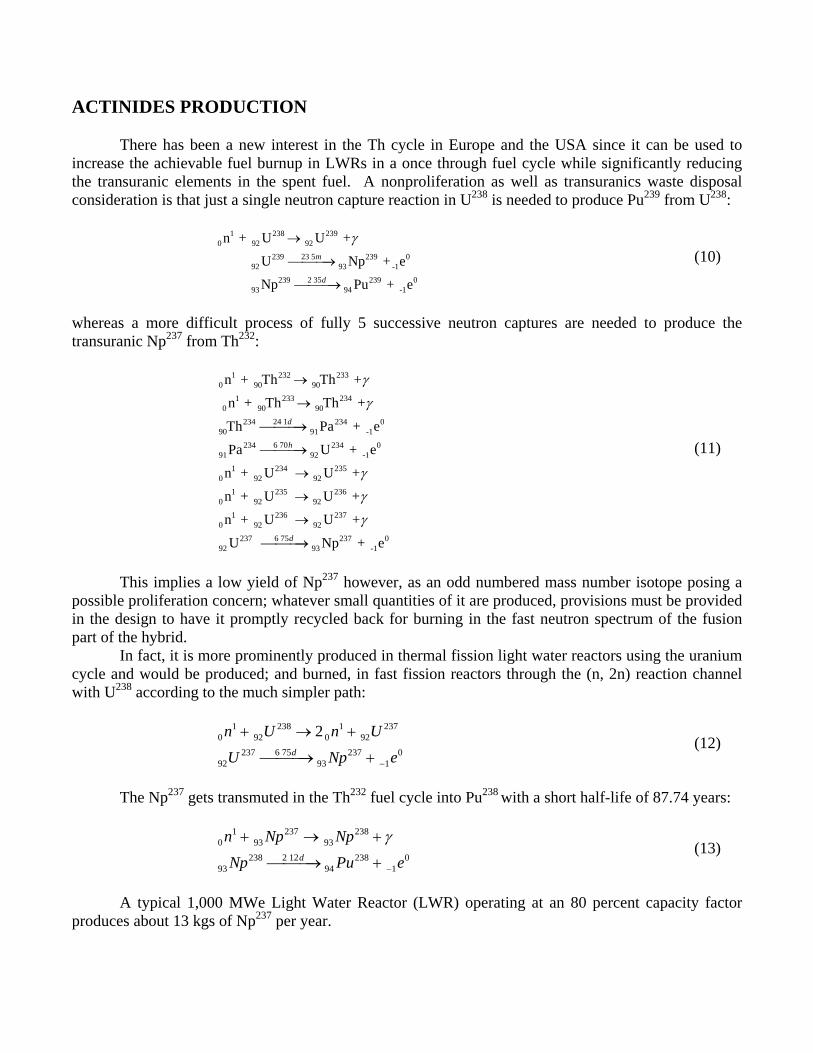
ACTINIDES PRODUCTION There has been a new interest in the Th cycle in Europe and the USA since it can be used to increase the achievable fuel burnup in LWRs in a once through fuel cycle while significantly reducing the transuranic elements in the spent fuel. A nonproliferation as well as transuranics waste disposal consideration is that just a single neutron capture reaction in U238 is needed to produce Pu239 from U238:
1 238 2390 92 92
23 5239 239 092 93 -1
2 35239 239 093 94 -1
n + U U +
U Np + e
Np Pu + e
m
d
γ→
→
→
(10)
whereas a more difficult process of fully 5 successive neutron captures are needed to produce the transuranic Np237 from Th232:
1 232 2330 90 90
1 233 2340 90 90
24 1234 234 090 91 -1
6 70234 234 091 92 -1
1 234 2350 92 92
1 235 2360 92 92
1 236 2370 92 92
6 7523792 93
n + Th Th +
n + Th Th +
Th Pa + e
Pa U + e
n + U U +
n + U U +
n + U U +
U Np
d
h
d
γ
γ
γ
γ
γ
→
→
→
→
→
→
→
→ 237 0-1 + e
(11)
This implies a low yield of Np237 however, as an odd numbered mass number isotope posing a possible proliferation concern; whatever small quantities of it are produced, provisions must be provided in the design to have it promptly recycled back for burning in the fast neutron spectrum of the fusion part of the hybrid. In fact, it is more prominently produced in thermal fission light water reactors using the uranium cycle and would be produced; and burned, in fast fission reactors through the (n, 2n) reaction channel with U238 according to the much simpler path:
1 238 1 237
0 92 0 926 75237 237 0
92 93 1
2d
n U n U
U Np e−
+ → +
→ + (12)
The Np237 gets transmuted in the Th232 fuel cycle into Pu238 with a short half-life of 87.74 years:
1 237 238
0 93 932 12238 238 0
93 94 1d
n Np Np
Np Pu e
γ
−
+ → +
→ + (13)
A typical 1,000 MWe Light Water Reactor (LWR) operating at an 80 percent capacity factor produces about 13 kgs of Np237 per year.
This has led to suggested designs where Th232 replaces U238 in LWRs fuel and accelerator driven fast neutron subcritical reactors that would breed U233 from Th232. Incidentally, whereas the Pu238 isotope is produced in the Th fuel cycle, it is the Pu240 isotope with a longer 6,537 years half-life, that is produced in the U-Pu fuel cycle:
1 238 2390 92 92
239 239 0 *92 93 -1
239 239 0 *93 94 -1
1 239 2400 94 94
n + U U +
U Np + e + +
Np Pu + e + +
n + Pu Pu +
γ
ν γ
ν γ
γ
→
→
→
→
(14)
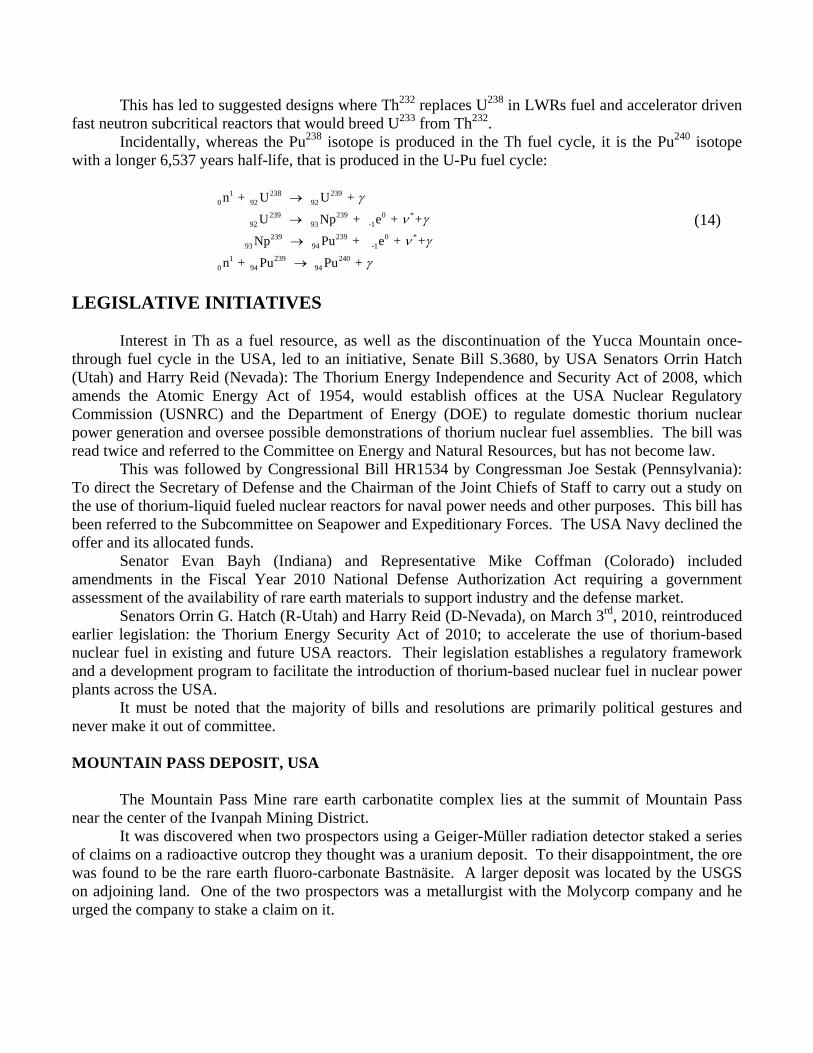
LEGISLATIVE INITIATIVES Interest in Th as a fuel resource, as well as the discontinuation of the Yucca Mountain once-through fuel cycle in the USA, led to an initiative, Senate Bill S.3680, by USA Senators Orrin Hatch (Utah) and Harry Reid (Nevada): The Thorium Energy Independence and Security Act of 2008, which amends the Atomic Energy Act of 1954, would establish offices at the USA Nuclear Regulatory Commission (USNRC) and the Department of Energy (DOE) to regulate domestic thorium nuclear power generation and oversee possible demonstrations of thorium nuclear fuel assemblies. The bill was read twice and referred to the Committee on Energy and Natural Resources, but has not become law. This was followed by Congressional Bill HR1534 by Congressman Joe Sestak (Pennsylvania): To direct the Secretary of Defense and the Chairman of the Joint Chiefs of Staff to carry out a study on the use of thorium-liquid fueled nuclear reactors for naval power needs and other purposes. This bill has been referred to the Subcommittee on Seapower and Expeditionary Forces. The USA Navy declined the offer and its allocated funds. Senator Evan Bayh (Indiana) and Representative Mike Coffman (Colorado) included amendments in the Fiscal Year 2010 National Defense Authorization Act requiring a government assessment of the availability of rare earth materials to support industry and the defense market. Senators Orrin G. Hatch (R-Utah) and Harry Reid (D-Nevada), on March 3rd, 2010, reintroduced earlier legislation: the Thorium Energy Security Act of 2010; to accelerate the use of thorium-based nuclear fuel in existing and future USA reactors. Their legislation establishes a regulatory framework and a development program to facilitate the introduction of thorium-based nuclear fuel in nuclear power plants across the USA. It must be noted that the majority of bills and resolutions are primarily political gestures and never make it out of committee. MOUNTAIN PASS DEPOSIT, USA The Mountain Pass Mine rare earth carbonatite complex lies at the summit of Mountain Pass near the center of the Ivanpah Mining District. It was discovered when two prospectors using a Geiger-Müller radiation detector staked a series of claims on a radioactive outcrop they thought was a uranium deposit. To their disappointment, the ore was found to be the rare earth fluoro-carbonate Bastnäsite. A larger deposit was located by the USGS on adjoining land. One of the two prospectors was a metallurgist with the Molycorp company and he urged the company to stake a claim on it.
The new deposit contained less thorium and uranium and hence is thought to contain less radioactivity. What is conveniently ignored is that it contains primarily cerium which itself is radioactive. In fact, the Cerium142 isotope with a natural abundance of 11.114 percent in Ce is radioactive with a long half life of > 5x10¹⁶ years, hence low activity. It is thought to be a double-beta emitter. Cerium has a crustal abundance of 60 ppm, comparable with Ni at 75 ppm and Cu at 55 ppm.
Figure 12. Mountain Pass, California. Source: USGS.
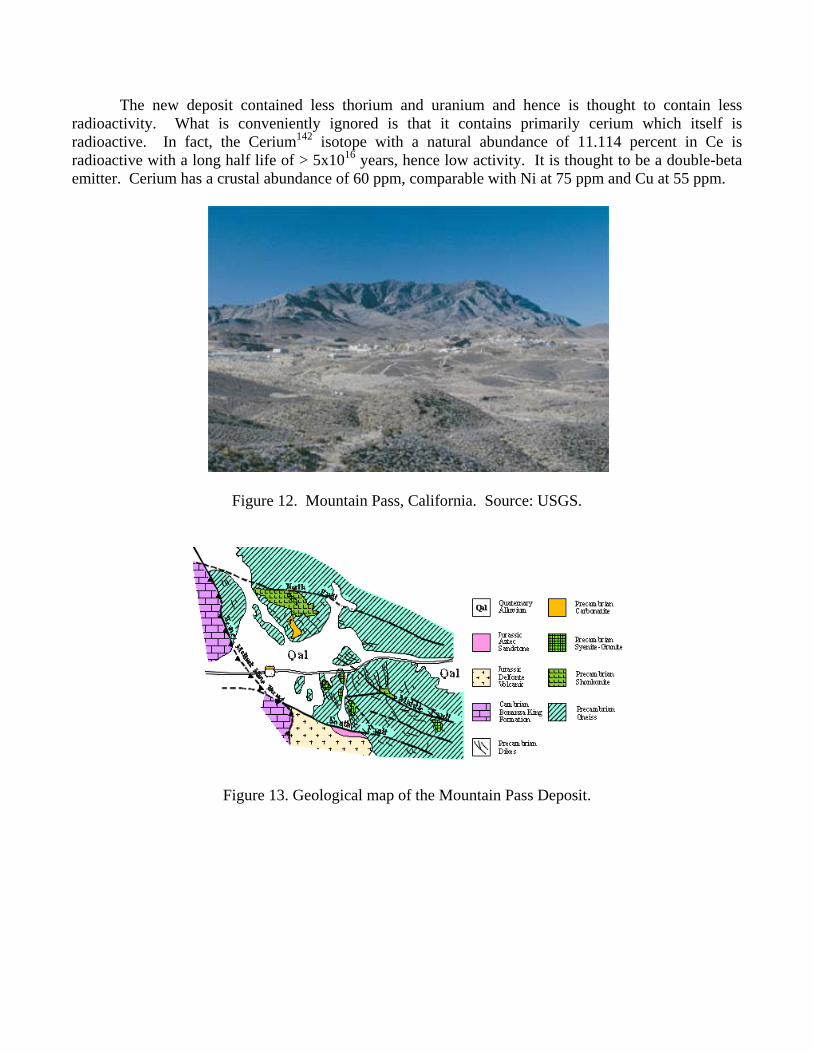
Figure 13. Geological map of the Mountain Pass Deposit.
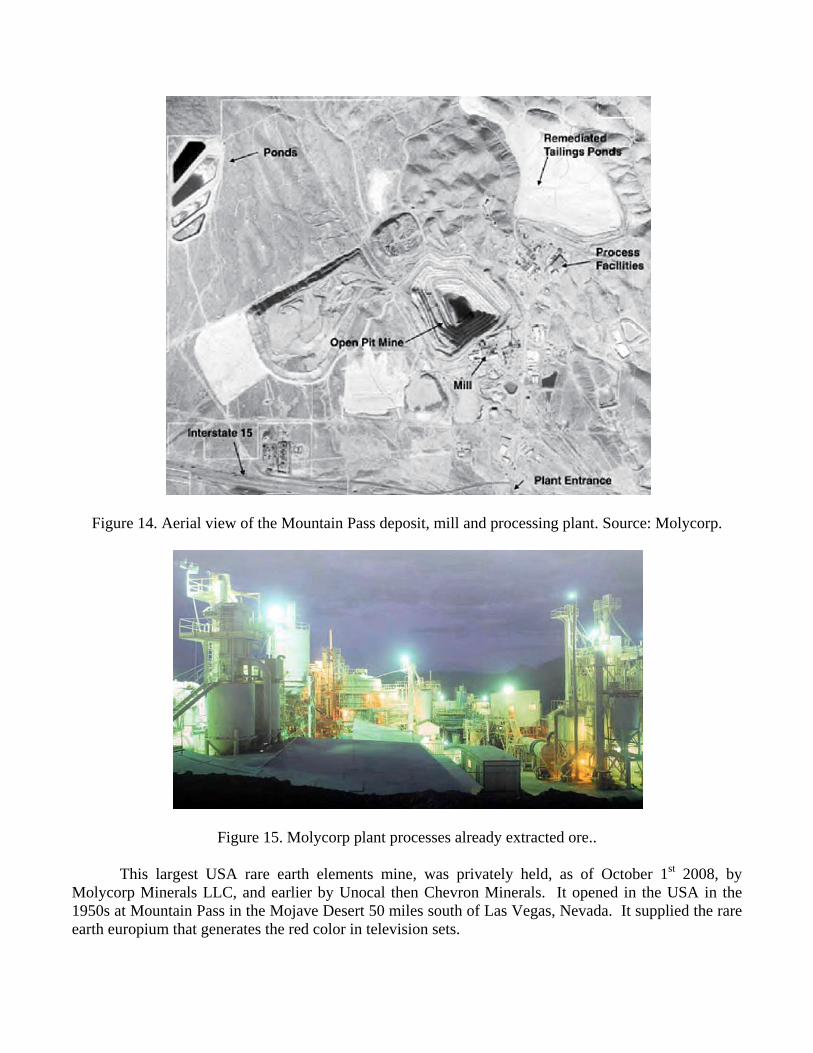
Figure 14. Aerial view of the Mountain Pass deposit, mill and processing plant. Source: Molycorp.
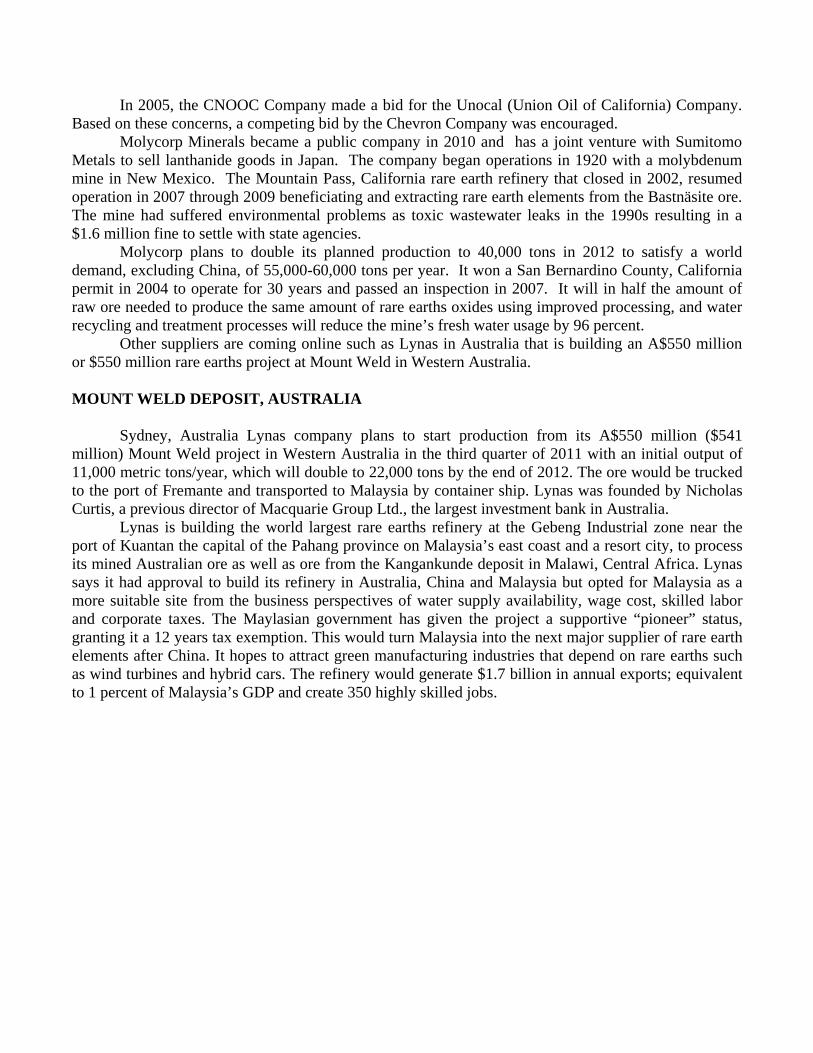
Figure 15. Molycorp plant processes already extracted ore..
This largest USA rare earth elements mine, was privately held, as of October 1st 2008, by Molycorp Minerals LLC, and earlier by Unocal then Chevron Minerals. It opened in the USA in the 1950s at Mountain Pass in the Mojave Desert 50 miles south of Las Vegas, Nevada. It supplied the rare earth europium that generates the red color in television sets.
In 2005, the CNOOC Company made a bid for the Unocal (Union Oil of California) Company. Based on these concerns, a competing bid by the Chevron Company was encouraged. Molycorp Minerals became a public company in 2010 and has a joint venture with Sumitomo Metals to sell lanthanide goods in Japan. The company began operations in 1920 with a molybdenum mine in New Mexico. The Mountain Pass, California rare earth refinery that closed in 2002, resumed operation in 2007 through 2009 beneficiating and extracting rare earth elements from the Bastnäsite ore. The mine had suffered environmental problems as toxic wastewater leaks in the 1990s resulting in a $1.6 million fine to settle with state agencies. Molycorp plans to double its planned production to 40,000 tons in 2012 to satisfy a world demand, excluding China, of 55,000-60,000 tons per year. It won a San Bernardino County, California permit in 2004 to operate for 30 years and passed an inspection in 2007. It will in half the amount of raw ore needed to produce the same amount of rare earths oxides using improved processing, and water recycling and treatment processes will reduce the mine’s fresh water usage by 96 percent. Other suppliers are coming online such as Lynas in Australia that is building an A$550 million or $550 million rare earths project at Mount Weld in Western Australia. MOUNT WELD DEPOSIT, AUSTRALIA Sydney, Australia Lynas company plans to start production from its A$550 million ($541 million) Mount Weld project in Western Australia in the third quarter of 2011 with an initial output of 11,000 metric tons/year, which will double to 22,000 tons by the end of 2012. The ore would be trucked to the port of Fremante and transported to Malaysia by container ship. Lynas was founded by Nicholas Curtis, a previous director of Macquarie Group Ltd., the largest investment bank in Australia. Lynas is building the world largest rare earths refinery at the Gebeng Industrial zone near the port of Kuantan the capital of the Pahang province on Malaysia’s east coast and a resort city, to process its mined Australian ore as well as ore from the Kangankunde deposit in Malawi, Central Africa. Lynas says it had approval to build its refinery in Australia, China and Malaysia but opted for Malaysia as a more suitable site from the business perspectives of water supply availability, wage cost, skilled labor and corporate taxes. The Maylasian government has given the project a supportive “pioneer” status, granting it a 12 years tax exemption. This would turn Malaysia into the next major supplier of rare earth elements after China. It hopes to attract green manufacturing industries that depend on rare earths such as wind turbines and hybrid cars. The refinery would generate $1.7 billion in annual exports; equivalent to 1 percent of Malaysia’s GDP and create 350 highly skilled jobs.
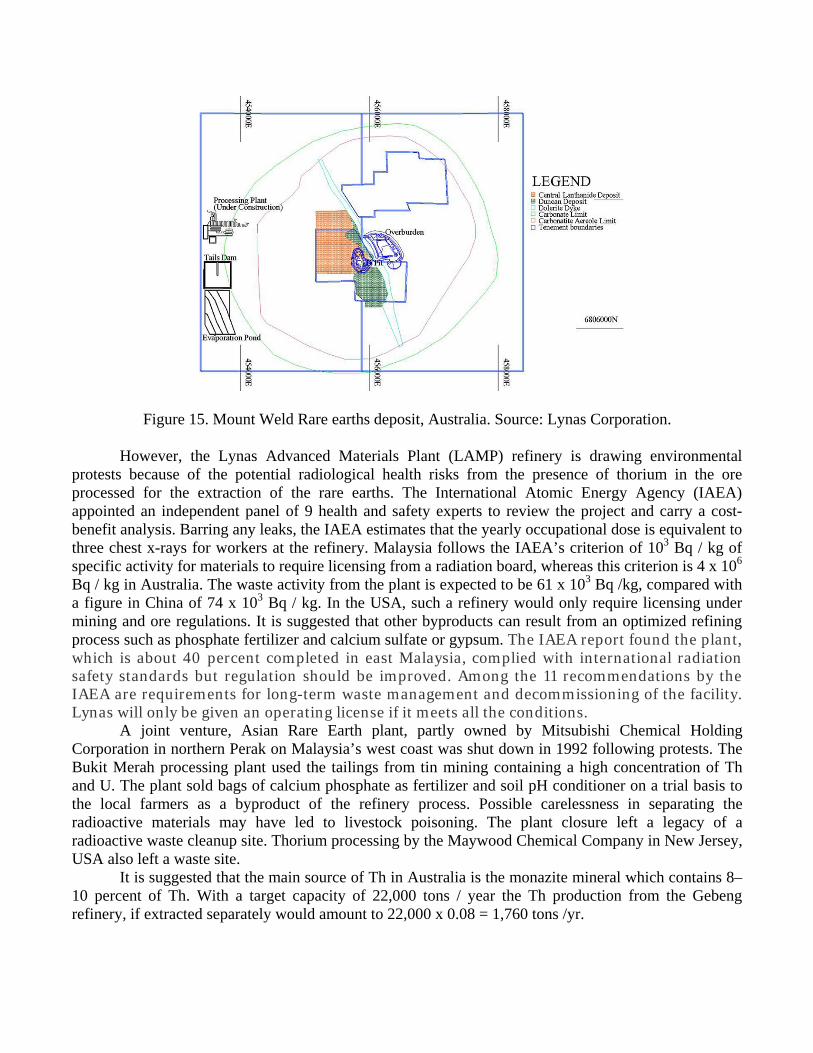
Figure 15. Mount Weld Rare earths deposit, Australia. Source: Lynas Corporation. However, the Lynas Advanced Materials Plant (LAMP) refinery is drawing environmental protests because of the potential radiological health risks from the presence of thorium in the ore processed for the extraction of the rare earths. The International Atomic Energy Agency (IAEA) appointed an independent panel of 9 health and safety experts to review the project and carry a cost-benefit analysis. Barring any leaks, the IAEA estimates that the yearly occupational dose is equivalent to three chest x-rays for workers at the refinery. Malaysia follows the IAEA’s criterion of 103 Bq / kg of specific activity for materials to require licensing from a radiation board, whereas this criterion is 4 x 10⁶ Bq / kg in Australia. The waste activity from the plant is expected to be 61 x 103 Bq /kg, compared with a figure in China of 74 x 103 Bq / kg. In the USA, such a refinery would only require licensing under mining and ore regulations. It is suggested that other byproducts can result from an optimized refining process such as phosphate fertilizer and calcium sulfate or gypsum. The IAEA report found the plant, which is about 40 percent completed in east Malaysia, complied with international radiation safety standards but regulation should be improved. Among the 11 recommendations by the IAEA are requirements for long-term waste management and decommissioning of the facility. Lynas will only be given an operating license if it meets all the conditions. A joint venture, Asian Rare Earth plant, partly owned by Mitsubishi Chemical Holding Corporation in northern Perak on Malaysia’s west coast was shut down in 1992 following protests. The Bukit Merah processing plant used the tailings from tin mining containing a high concentration of Th and U. The plant sold bags of calcium phosphate as fertilizer and soil pH conditioner on a trial basis to the local farmers as a byproduct of the refinery process. Possible carelessness in separating the radioactive materials may have led to livestock poisoning. The plant closure left a legacy of a radioactive waste cleanup site. Thorium processing by the Maywood Chemical Company in New Jersey, USA also left a waste site. It is suggested that the main source of Th in Australia is the monazite mineral which contains 8–10 percent of Th. With a target capacity of 22,000 tons / year the Th production from the Gebeng refinery, if extracted separately would amount to 22,000 x 0.08 = 1,760 tons /yr.
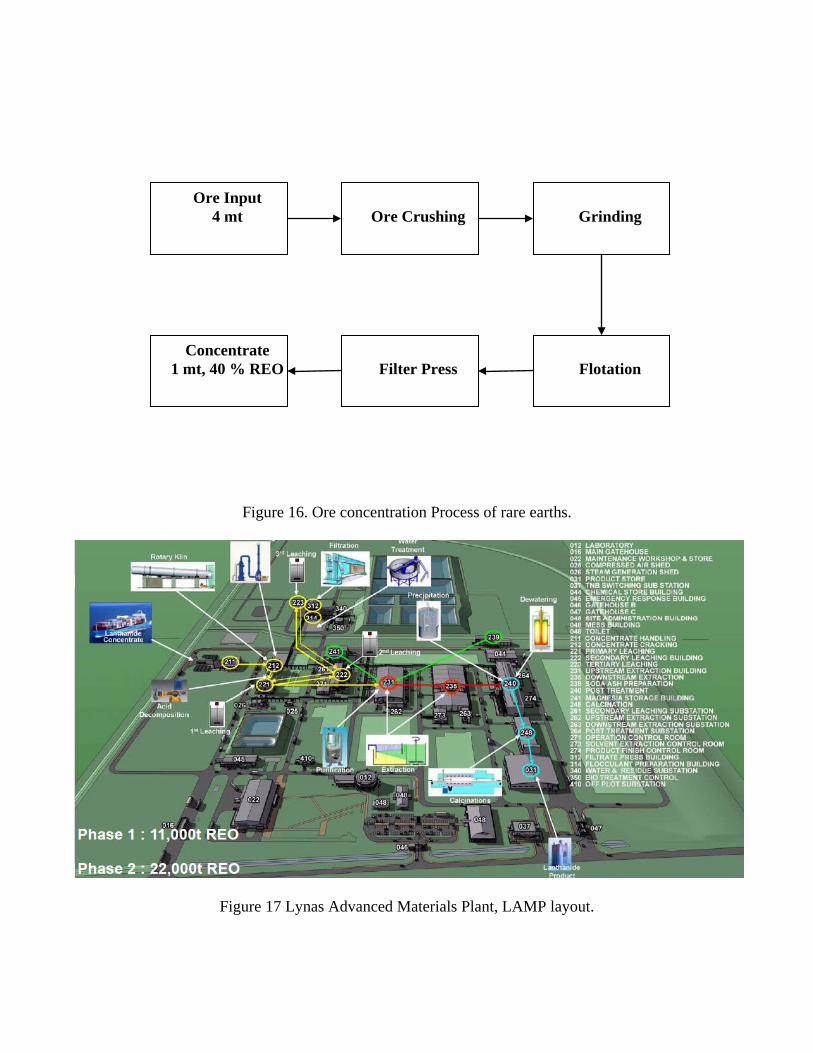
Figure 16. Ore concentration Process of rare earths.
Figure 17 Lynas Advanced Materials Plant, LAMP layout.
Ore Input 4 mt
Ore Crushing
Grinding
Flotation
Filter Press
Concentrate 1 mt, 40 % REO
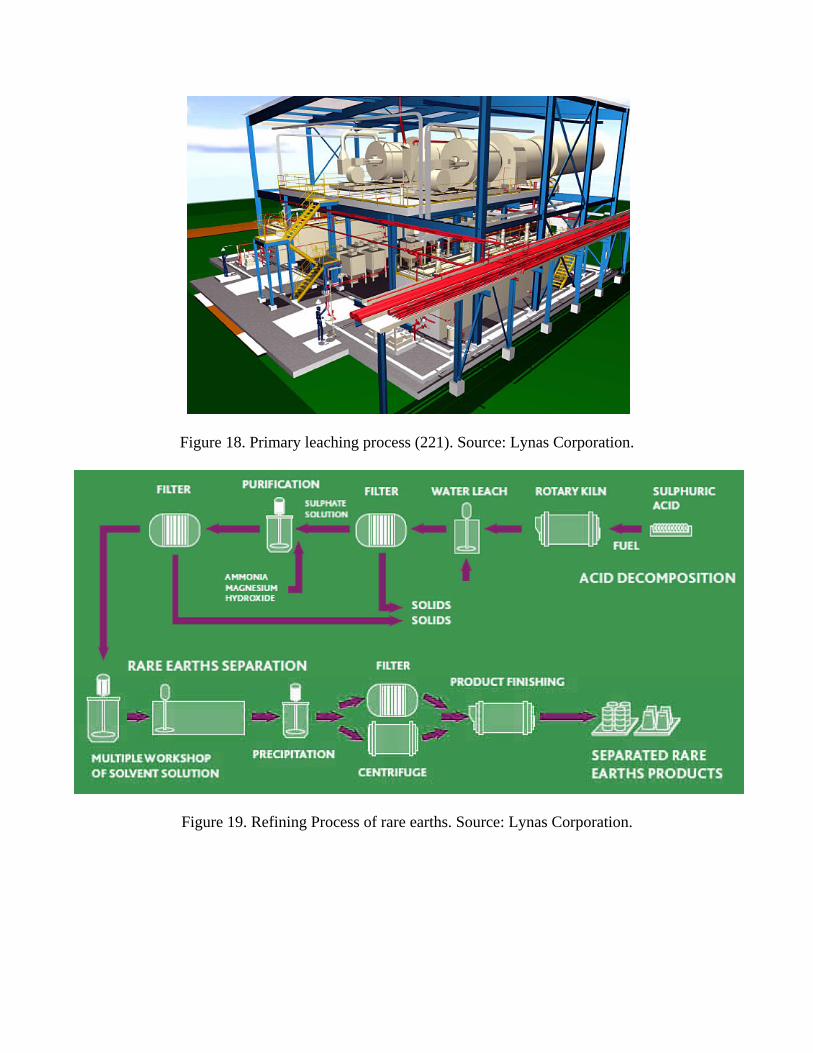
Figure 18. Primary leaching process (221). Source: Lynas Corporation.
Figure 19. Refining Process of rare earths. Source: Lynas Corporation.
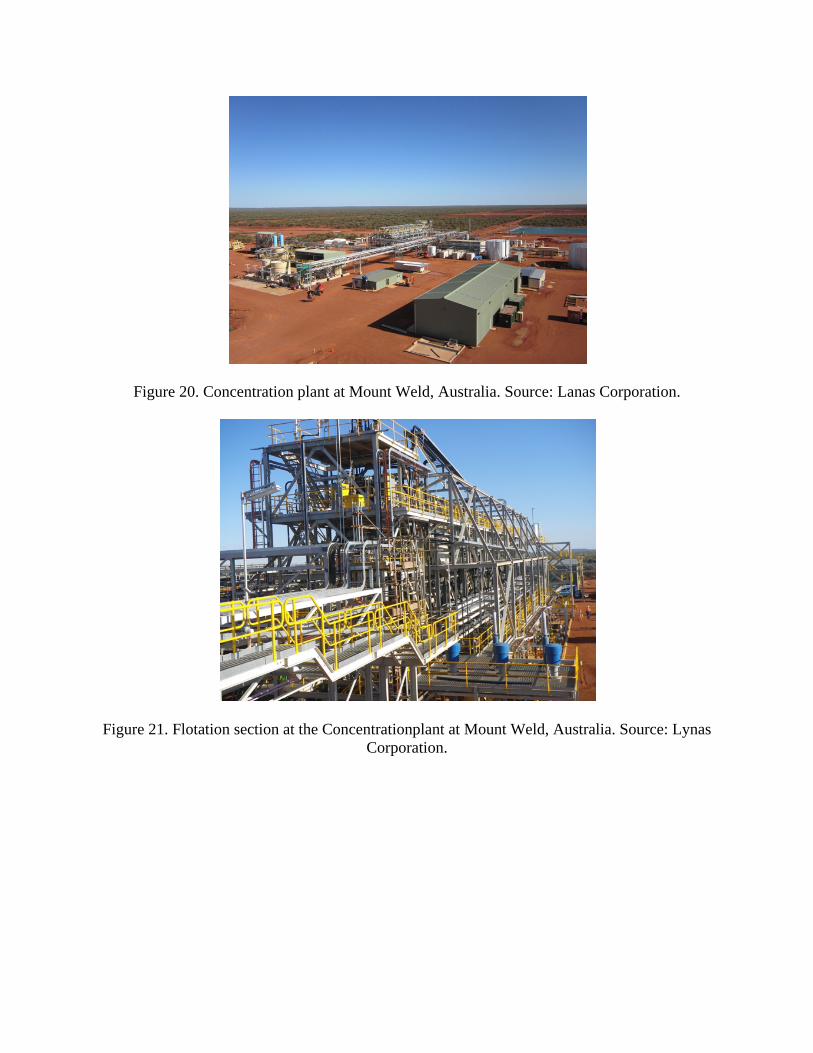
Figure 20. Concentration plant at Mount Weld, Australia. Source: Lanas Corporation.
Figure 21. Flotation section at the Concentrationplant at Mount Weld, Australia. Source: Lynas Corporation.
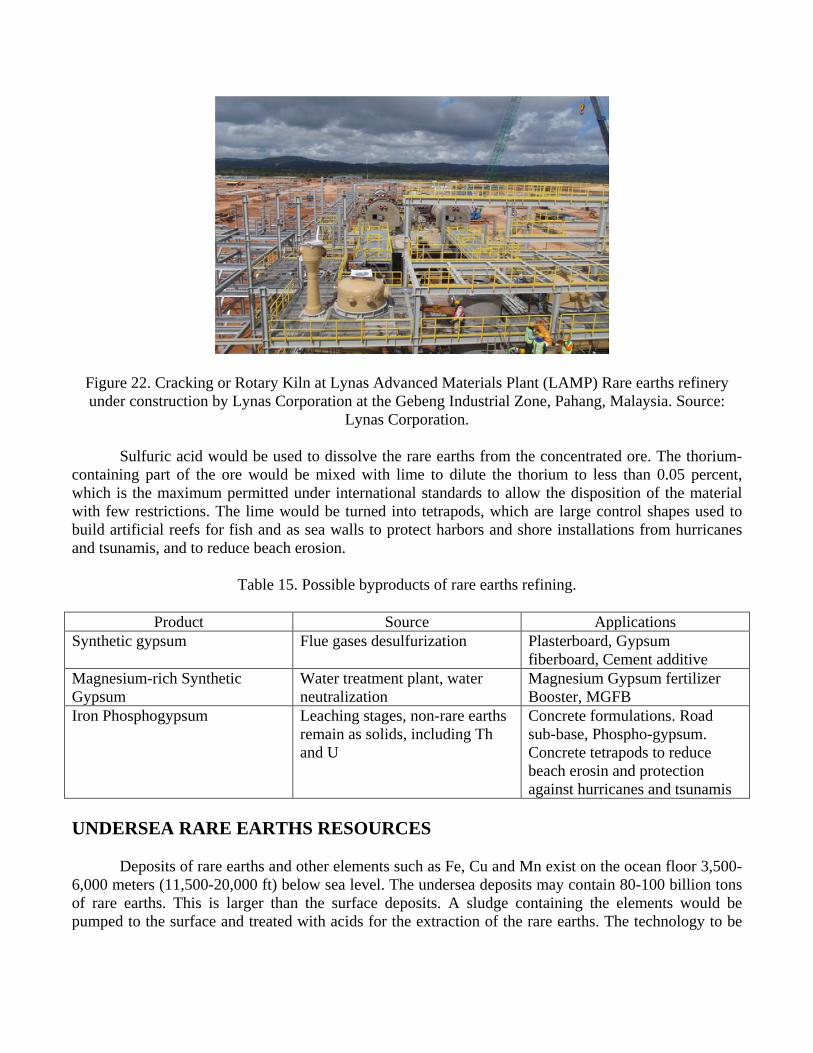
Figure 22. Cracking or Rotary Kiln at Lynas Advanced Materials Plant (LAMP) Rare earths refinery under construction by Lynas Corporation at the Gebeng Industrial Zone, Pahang, Malaysia. Source:
Lynas Corporation. Sulfuric acid would be used to dissolve the rare earths from the concentrated ore. The thorium-containing part of the ore would be mixed with lime to dilute the thorium to less than 0.05 percent, which is the maximum permitted under international standards to allow the disposition of the material with few restrictions. The lime would be turned into tetrapods, which are large control shapes used to build artificial reefs for fish and as sea walls to protect harbors and shore installations from hurricanes and tsunamis, and to reduce beach erosion.
Table 15. Possible byproducts of rare earths refining.
Product Source Applications Synthetic gypsum Flue gases desulfurization Plasterboard, Gypsum
fiberboard, Cement additive Magnesium-rich Synthetic Gypsum
Water treatment plant, water neutralization
Magnesium Gypsum fertilizer Booster, MGFB
Iron Phosphogypsum Leaching stages, non-rare earths remain as solids, including Th and U
Concrete formulations. Road sub-base, Phospho-gypsum. Concrete tetrapods to reduce beach erosin and protection against hurricanes and tsunamis
UNDERSEA RARE EARTHS RESOURCES Deposits of rare earths and other elements such as Fe, Cu and Mn exist on the ocean floor 3,500-6,000 meters (11,500-20,000 ft) below sea level. The undersea deposits may contain 80-100 billion tons of rare earths. This is larger than the surface deposits. A sludge containing the elements would be pumped to the surface and treated with acids for the extraction of the rare earths. The technology to be
developed would have to operate in high pressure and highly corrosive environments and is likely to be more expensive than that for above-surface deposits. RADIOACTIVITY IN RARE EARTHS Most rare earths ores contain Th and U and their daughter products which must be disposed of responsibly. Rare earths require more chemicals for their extraction than the base metals such as copper, zinc and lead. Pollution from the rare earths production is significant. China’s rare earths industry produced 13 billion m3 of gas and 25 million tons of waste water containing heavy metals such as Cd. The gases are more than five times waste gases as fluorine and sulfur dioxide than the total released by all miners and oil refiners in the USA. This led China to shut down unregulated rare earth mines to protect its environment. It reduced its export quotas by 72 percent in the second half of 2010 and again by 35 percent in the first half of 2011 to prevent the depletion of its resources, after it supplied the world with 95 percent of the global shipments of rare earth metals. Rising demand and export restrictions led to the price of neodymium used in magnets manufacture to rise from $19.12 / kg in 2009 to $80 / kg in 2010.
Table 16. Composition of Mountain Pass Mine ore.
Component Percentage Cerium 50.0 Lanthanum 34.0 Neodymium 11.0 Praesodimium 4.0 Samarium 0.5 Gadolinium 0.2 Europeum 0.1 Others 0.2
Table 17. Some naturally occurring rare earths radioactive isotopes in comparison with Th232.
Component Radioactive
isotopes Natural
Abundance [a/o]
Mode of radioactive
decay
Half life [a]
39Y 57La La138 0.0902 ε, β-, γ 1.05x10¹¹ 58Ce Ce142 11.08 2β-, γ, α? >5x10¹⁶ 59Pr
60Nd Nd144
Nd145 23.8 8.3
α, no γ α
2.29x10¹⁵ >1017
61Pm 62Sm Sm147
Sm148
Sm149
15.0 11.3 13.8
α, no γ α, no γ
α
1.06x10¹¹ 8.0x10¹⁵ 2.0x10¹⁵
63Eu 64Gd Gd152 0.20 α, no γ 1.08x10¹⁴ 65Tb 66Dy Dy156 0.06 ? >1018 67Ho 68Er
69Tm 70Yb 71Lu Lu176 2.59 β-, ε, γ 4.0x10¹⁰ 90Th Th232 100.0 α, γ 1.405x10¹⁰
Cerium is a main component of some rare earths ores, even those with a low content in Th and U. The 58Cerium142 isotope with a natural abundance of 11.114 percent in Ce is radioactive with a long half life of > 5x10¹⁶ years, hence low activity. Cerium has a crustal abundance of 60 ppm, comparable with Ni at 75 ppm and Cu at 55 ppm. Its single beta decay energy can be calculated from:
142 14258 59
( , ) ( , 1) 931.48
( ) ( Pr ) 931.48[141.909243673 141.910044328] 931.48[ 0.000800655] 931.48
0.745794
E M A Z M A Z
M Ce M
MeV
β = − + ×
= − ×= − ×= − ×= −
(15)
As it decays through beta emission into 59Pr142 which is itself a beta emitter with a short half life of 19.12 hours, it has been reported as a double beta emitter. In this case its beta decay energy would be calculated from:
2
142 14258 60
( , ) ( , 2) 931.48
( ) ( ) 931.48[141.909243673 141.907722750] 931.48[ 0.001520893] 931.48
1.416681
E M A Z M A Z
M Ce M Nd
MeV
β = − + ×
= − ×= − ×= + ×= +
(16)
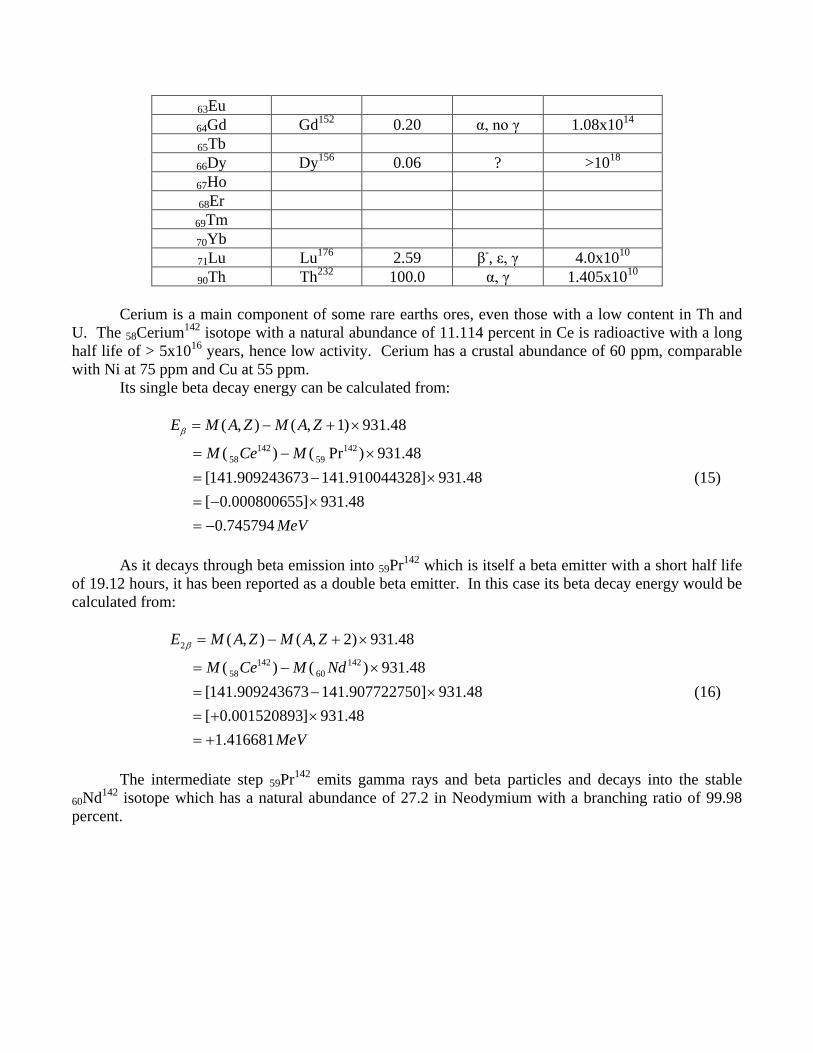
The intermediate step 59Pr142 emits gamma rays and beta particles and decays into the stable 60Nd142 isotope which has a natural abundance of 27.2 in Neodymium with a branching ratio of 99.98 percent.
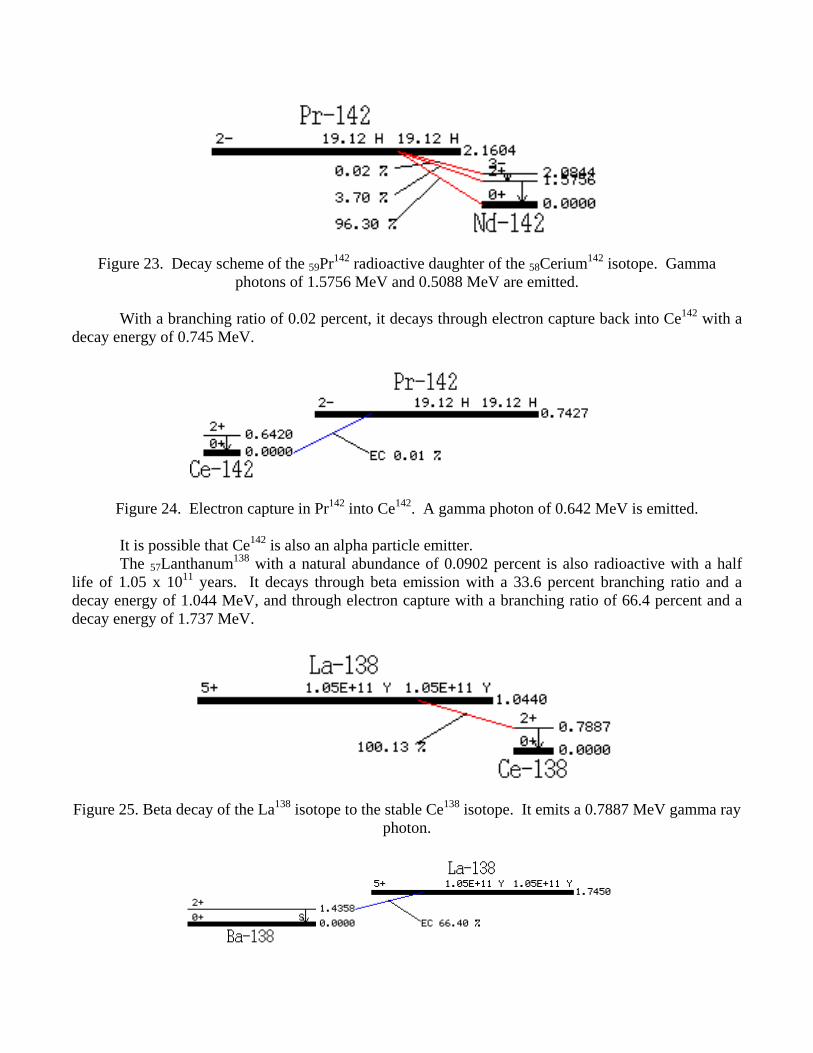
Figure 23. Decay scheme of the 59Pr142 radioactive daughter of the 58Cerium142 isotope. Gamma photons of 1.5756 MeV and 0.5088 MeV are emitted.
With a branching ratio of 0.02 percent, it decays through electron capture back into Ce142 with a decay energy of 0.745 MeV.
Figure 24. Electron capture in Pr142 into Ce142. A gamma photon of 0.642 MeV is emitted. It is possible that Ce142 is also an alpha particle emitter. The 57Lanthanum138 with a natural abundance of 0.0902 percent is also radioactive with a half life of 1.05 x 10¹¹ years. It decays through beta emission with a 33.6 percent branching ratio and a decay energy of 1.044 MeV, and through electron capture with a branching ratio of 66.4 percent and a decay energy of 1.737 MeV.
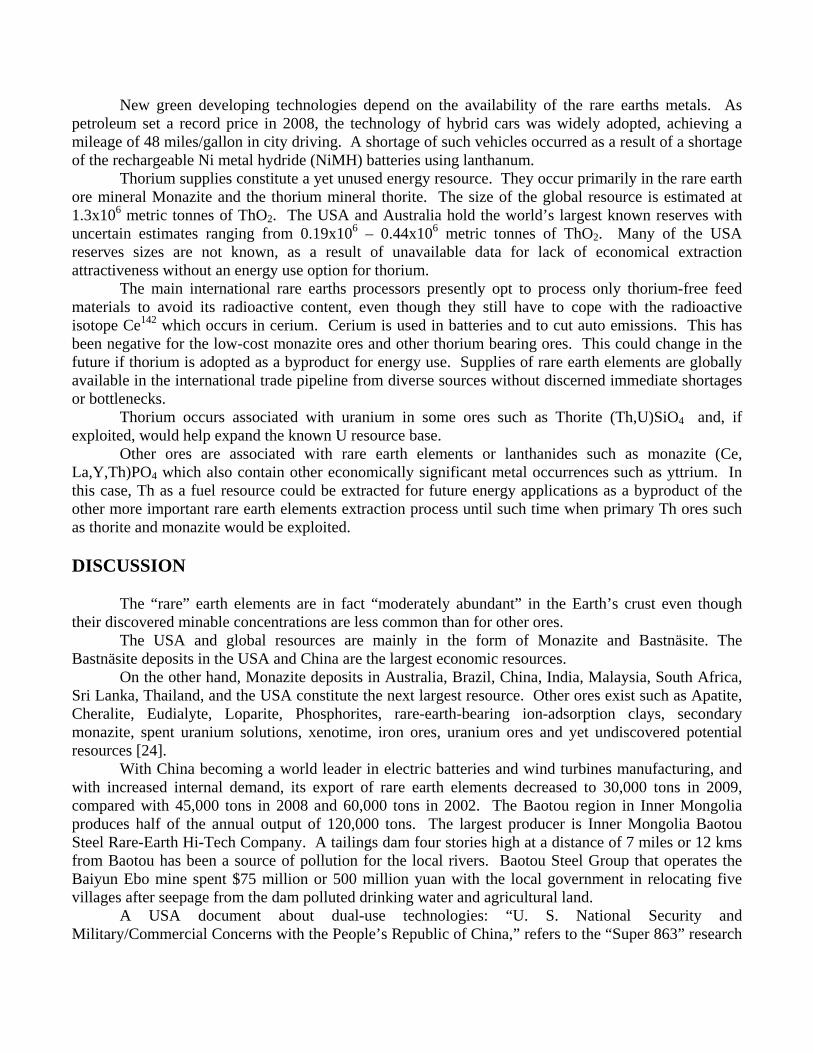
Figure 25. Beta decay of the La138 isotope to the stable Ce138 isotope. It emits a 0.7887 MeV gamma ray photon.
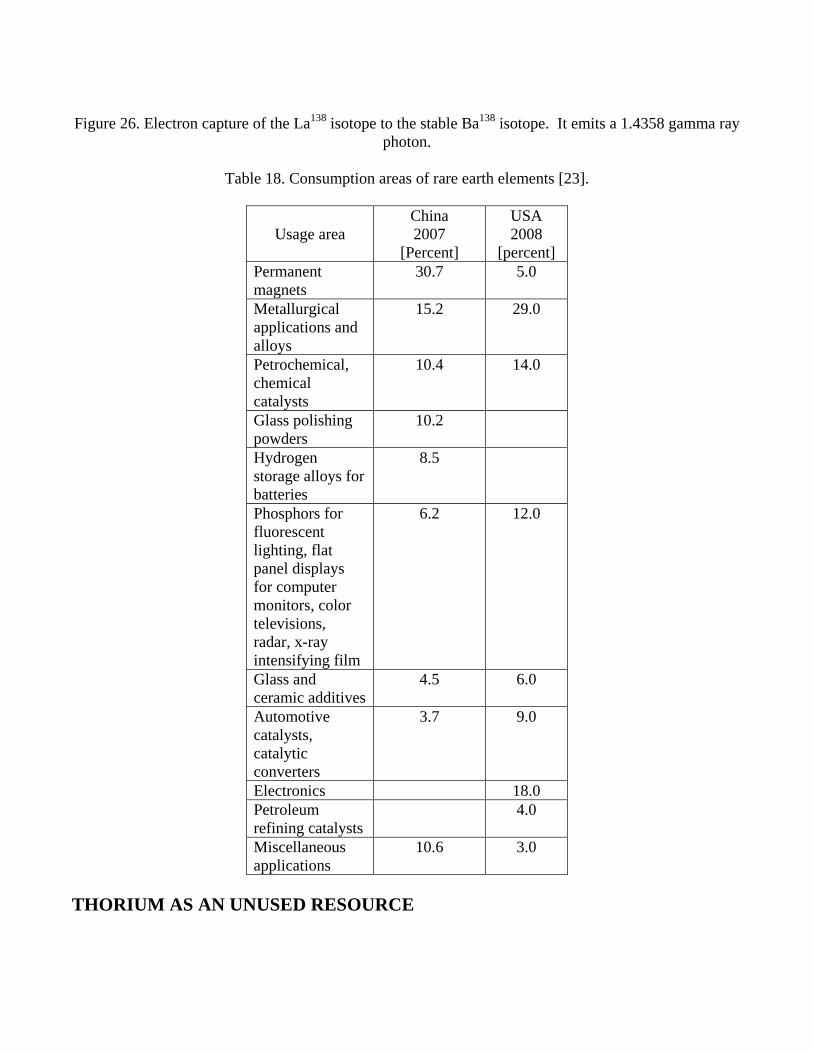
Figure 26. Electron capture of the La138 isotope to the stable Ba138 isotope. It emits a 1.4358 gamma ray
photon.
Table 18. Consumption areas of rare earth elements [23].
Usage area China 2007
[Percent]
USA 2008
[percent] Permanent magnets
30.7 5.0
Metallurgical applications and alloys
15.2 29.0
Petrochemical, chemical catalysts
10.4 14.0
Glass polishing powders
10.2
Hydrogen storage alloys for batteries
8.5
Phosphors for fluorescent lighting, flat panel displays for computer monitors, color televisions, radar, x-ray intensifying film
6.2 12.0
Glass and ceramic additives
4.5 6.0
Automotive catalysts, catalytic converters
3.7 9.0
Electronics 18.0 Petroleum refining catalysts
4.0
Miscellaneous applications
10.6 3.0
THORIUM AS AN UNUSED RESOURCE
New green developing technologies depend on the availability of the rare earths metals. As petroleum set a record price in 2008, the technology of hybrid cars was widely adopted, achieving a mileage of 48 miles/gallon in city driving. A shortage of such vehicles occurred as a result of a shortage of the rechargeable Ni metal hydride (NiMH) batteries using lanthanum. Thorium supplies constitute a yet unused energy resource. They occur primarily in the rare earth ore mineral Monazite and the thorium mineral thorite. The size of the global resource is estimated at 1.3x10⁶ metric tonnes of ThO2. The USA and Australia hold the world’s largest known reserves with uncertain estimates ranging from 0.19x10⁶ – 0.44x10⁶ metric tonnes of ThO2. Many of the USA reserves sizes are not known, as a result of unavailable data for lack of economical extraction attractiveness without an energy use option for thorium. The main international rare earths processors presently opt to process only thorium-free feed materials to avoid its radioactive content, even though they still have to cope with the radioactive isotope Ce142 which occurs in cerium. Cerium is used in batteries and to cut auto emissions. This has been negative for the low-cost monazite ores and other thorium bearing ores. This could change in the future if thorium is adopted as a byproduct for energy use. Supplies of rare earth elements are globally available in the international trade pipeline from diverse sources without discerned immediate shortages or bottlenecks.
Thorium occurs associated with uranium in some ores such as Thorite (Th,U)SiO4 and, if exploited, would help expand the known U resource base.
Other ores are associated with rare earth elements or lanthanides such as monazite (Ce, La,Y,Th)PO4 which also contain other economically significant metal occurrences such as yttrium. In this case, Th as a fuel resource could be extracted for future energy applications as a byproduct of the other more important rare earth elements extraction process until such time when primary Th ores such as thorite and monazite would be exploited. DISCUSSION
The “rare” earth elements are in fact “moderately abundant” in the Earth’s crust even though their discovered minable concentrations are less common than for other ores.
The USA and global resources are mainly in the form of Monazite and Bastnäsite. The Bastnäsite deposits in the USA and China are the largest economic resources.
On the other hand, Monazite deposits in Australia, Brazil, China, India, Malaysia, South Africa, Sri Lanka, Thailand, and the USA constitute the next largest resource. Other ores exist such as Apatite, Cheralite, Eudialyte, Loparite, Phosphorites, rare-earth-bearing ion-adsorption clays, secondary monazite, spent uranium solutions, xenotime, iron ores, uranium ores and yet undiscovered potential resources [24].
With China becoming a world leader in electric batteries and wind turbines manufacturing, and with increased internal demand, its export of rare earth elements decreased to 30,000 tons in 2009, compared with 45,000 tons in 2008 and 60,000 tons in 2002. The Baotou region in Inner Mongolia produces half of the annual output of 120,000 tons. The largest producer is Inner Mongolia Baotou Steel Rare-Earth Hi-Tech Company. A tailings dam four stories high at a distance of 7 miles or 12 kms from Baotou has been a source of pollution for the local rivers. Baotou Steel Group that operates the Baiyun Ebo mine spent $75 million or 500 million yuan with the local government in relocating five villages after seepage from the dam polluted drinking water and agricultural land. A USA document about dual-use technologies: “U. S. National Security and Military/Commercial Concerns with the People’s Republic of China,” refers to the “Super 863” research
and development program, named after its conception date in March 1986 that reportedly involved 30,000 scientists and engineers including about 1,000 doctorate holders. A visionary 1992 outlook attributed to China’s late “paramount leader” Deng Xiaoping is: “There is oil in the Middle East. There are rare earths in China. We must take full advantage of this resource.” The program started in 1996 and claims the achievement of 1,500 unspecified technological breakthroughs. After the launch of the Super 863 program in 1997, the Chinese Communist Party adopted the “16-Character Policy” in reference to the 16 Chinese characters that describe a four-sentence blueprint for China’s ascendance on the world’s stage: “Combine the military with the civil. Combine peace and war. Give priority to military products. Let the civil support the military.” This signals a possible future competition for the global rare earths resources as feed materials to a new green technologies industrial thrust. Global demand for rare earth elements is expected to expand at a 9 percent yearly rate of growth. China’s share of the world market is a substantial 95 percent. Caused by a product oversupply, producers complain that prices are controlled by the end users. Nurturing and protecting its rare earth production industry, China promises rare earth resource availability only if the production facilities are located in China, attracting industry, research, technology, manufacturing plants and jobs. REFERENCES 1. M. M. H. Ragheb, R. T. Santoro, J. M. Barnes, and M. J. Saltmarsh, “Nuclear Performance of Molten Salt Fusion-Fission Symbiotic Systems for Catalyzed Deuterium and Deuterium-Tritium Reactors,” Nuclear Technology, Vol. 48, pp. 216-232, May 1980. 2. M. Ragheb, “Optimized Fissile and Fusile Breeding in a Laser-Fusion Fissile-Enrichment Flux Trap Blanket,” Journal of Fusion Energy, Vol. 1, No.1, pp.285-298, 1981. 3. M. M. H. Ragheb, G. A Moses, and C. W. Maynard, “Pellet and Pellet-Blanket neutronics and Photonics for Electron Beam Fusion,” Nucl. Technol., Vol. 48:16, April 1980. 4. M. Ragheb and S. Behtash, “Symbiosis of Coupled Systems of Fusion D-3He Satellites and Tritium and He3 Generators,” Nuclear Science and Engineering, Vol. 88, pp. 16-36, 1984. 5. M. Ragheb and C. W. Maynard, “On a Nonproliferation Aspect of the Presence of U232 in the U233 fuel cycle,” Atomkernenergie, 1979. 6. M. M. H. Ragheb, M. Z. Youssef, S. I. Abdel-Khalik, and C. W. Maynard, “Three-Dimensional Lattice Calculations for a Laser-Fusion Fissile Enrichment Fuel Factory,” Trans. Am. Nucl. Soc., Vol. 30, 59, 1978. 7. M. M. H. Ragheb, S. I. Abdel-Khalik, M. Youssef, and C. W. Maynard, “Lattice Calculations and Three-Dimensional Effects in a Laser Fusion-Fission Reactor,” Nucl. Technol. Vol. 45, 140, 1979. 8. H. A. Bethe, “The Fusion Hybrid,” Nucl. News, Vol. 21, 7, 41, May 1978. 9. S. S. Rozhkov and G. E. Shatalov, “Thorium in the Blanket of a Hybrid Thermonuclear Reactor,” Proc. U.S.-USSR Symp. Fusion-Fission Reactors, July 13-16, 1976, CONF-760733, p. 143, 1976. 10. V. L. Blinkin and V. M. Novikov, “Symbiotic System of a Fusion and Fission Reactor with Very Simple Fuel Reprocessing,” Nucl. Fusion, Vol. 18, 7, 1978. 11. Jungmin Kang and Frank N. von Hippel, “U-232 and the Proliferation Resistance of U-233 in Spent Fuel,” Science and Global Security, Volume 9, pp. 1-32, 2001. 12. J. A. Maniscalco, L. F. Hansen, and W. O. Allen, “Scoping Studies of U233 breeding fusion fission hybrid,” UCRL-80585, Lawrence Livermore Laboratory, 1978.
13. L. M. Lidsky, “Fission-fusion Systems: Hybrid, Symbiotic and Augean,” Nucl. Fusion, Vol. 15, 1975. 14. J. D. Lee, “The Beryllium/molten salt blanket-a new concept,” UCRL-80585, Lawrence Livermore Laboratory, 1979. 15. M. M. H. Ragheb and C. W. Maynard, “Three-dimensional cell calculations for a fusion reactor gas-cooled solid blanket,” Atomkernenergie (ATKE) Bd. 32, Lfg. 3, 159, 1978. 16. James B. Hedrick, “Thorium in the United States,” “1st Thorium Energy Alliance Conference, The Future Thorium Energy Economy," Kellog Conference Center, Gallaudet University, Washington D. C. 2002-3695, USA, October 19-20, 2009. 17. Jim Kennedy, “Critical and Strategic Failure in Rare Earth Resources, A National Defense and Industrial Policy Failure,” “1st Thorium Energy Alliance Conference, The Future Thorium Energy Economy," Kellog Conference Center, Gallaudet University, Washington D. C. 2002-3695, USA, October 19-20, 2009. 18. Robert Hargraves, “Aim High,” “1st Thorium Energy Alliance Conference, The Future Thorium Energy Economy," Kellog Conference Center, Gallaudet University, Washington D. C. 2002-3695, USA, October 19-20, 2009. 19. Bradley S. Van Gosen, Virginia S. Gillerman and Theodore J. Armbrustmacher, “Thoriun Resources of the United States-Energy Resources for the Future?” Circular 1336, USA Geological Survey, USGS, Reston, Virginia, 2009. 20. Magdi Ragheb, “Nuclear Age Elements,” in: “Nuclear, Plasma and Radiation Science, Inventing the Future,” https://netfiles.uiuc.edu/mragheb/www, 2010. 21. Magdi Ragheb, “Uranium Resources in Phosphate Rocks,” in: “Nuclear, Plasma and Radiation Science, Inventing the Future,” https://netfiles.uiuc.edu/mragheb/www, 2010. 22. WNA, World Nuclear Association, “Thorium,” http://www.world-nuclear.org/info/inf62.html, 2009. 23. James B. Hedrick, “2007 Minerals Yearbook,” USGS, September 2009. 24. James B. Hedrick, “Mineral Commodity Summaries, Rare Earths,” http://minerals.usgs.gov/minerals/pubs/commodity/rare_earths/mcs-2010-raree.pdf, USGS, September 2010. 25. M. H. Walmer, J. F. Liu and P. C. Dent, “Current Status of Permanent Magnet Industry in the United States,” Proceedings of 20th International Workshop on “Rare earth Permanent Magnets and their Applications,” Sept. 8-10, Crete, Greece, 2009. 26. R. C. Vickers, “Airborne and ground Reconnaissance of Part of the Syenite Complex Near Wausau, Wisconsin, Contributions to the Economic Geology, USGS, Geological Survey Bulletin 1042-B, 1956. 27. Jungmin Kang and Frank N. von Hippel, “U-232 and the Proliferation Resistance of U-233 in Spent Fuel,” Science and Global Security, Volume 9, pp. 1-32, 2001. 28. Magdi Ragheb, “The Global Status of Nuclear Power,” in: “Nuclear, Plasma and Radiation Science, Inventing the Future,” https://netfiles.uiuc.edu/mragheb/www, 2010. 29. S. R. Taylor, “Abundances of Chemical Elements in the Continental Crust: a New Table,” Geochim. Cosmochim. Acta, 28, 1273, 1964. APPENDIX
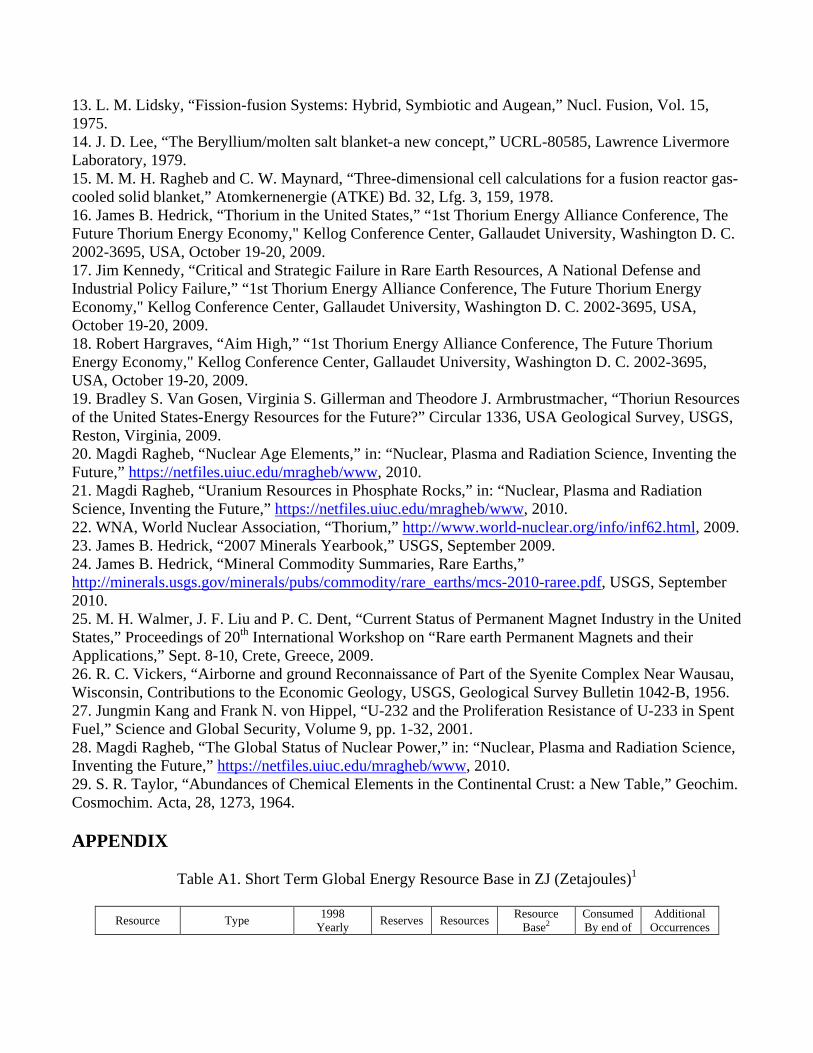
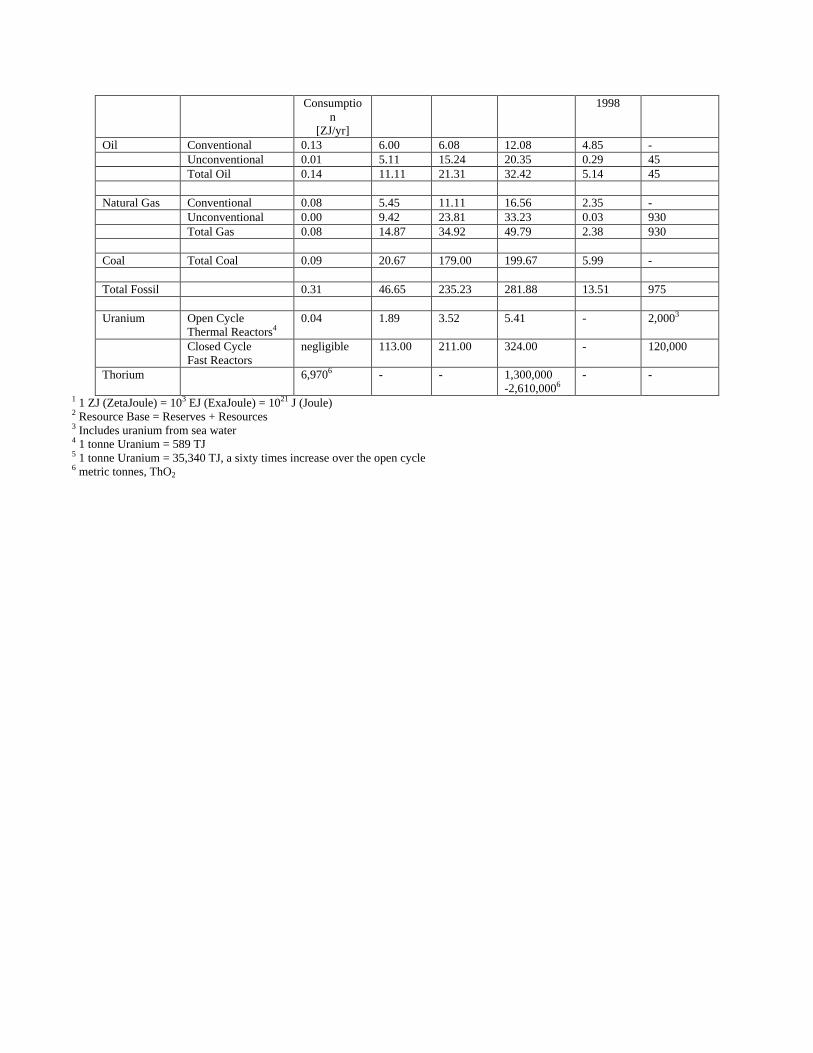
Table A1. Short Term Global Energy Resource Base in ZJ (Zetajoules)1
Resource Type 1998 Yearly Reserves Resources Resource
Base2 Consumed By end of
Additional Occurrences
Consumption
[ZJ/yr]
1998
Oil Conventional 0.13 6.00 6.08 12.08 4.85 - Unconventional 0.01 5.11 15.24 20.35 0.29 45 Total Oil 0.14 11.11 21.31 32.42 5.14 45 Natural Gas Conventional 0.08 5.45 11.11 16.56 2.35 - Unconventional 0.00 9.42 23.81 33.23 0.03 930 Total Gas 0.08 14.87 34.92 49.79 2.38 930 Coal Total Coal 0.09 20.67 179.00 199.67 5.99 - Total Fossil 0.31 46.65 235.23 281.88 13.51 975 Uranium Open Cycle
Thermal Reactors4 0.04 1.89 3.52 5.41 - 2,0003
Closed Cycle Fast Reactors
negligible 113.00 211.00 324.00 - 120,000
Thorium 6,9706 - - 1,300,000 -2,610,0006
- -
1 1 ZJ (ZetaJoule) = 103 EJ (ExaJoule) = 1021 J (Joule) 2 Resource Base = Reserves + Resources 3 Includes uranium from sea water 4 1 tonne Uranium = 589 TJ 5 1 tonne Uranium = 35,340 TJ, a sixty times increase over the open cycle 6 metric tonnes, ThO2