thl i wivir1sr1on kaiiu of modified piston for
TRANSCRIPT

PERPUSTAKAAN UMP
0000044299 THL i wivir1sr1oN KAIIU OF MODIFIED PISTON FOR
COMPRESSED NATURAL GAS (CNG) USAGE
IZAR FARHAN BIN NOR KHIRI
A report submitted in partial fulfillment of the requirements
for the award of the degree of
Bachelor of Mechanical Engineering with Automotive Engineering
Faculty of Mechanical Engineering
UNIVERSITI MALAYSIA PAHANG
NOVEMBER2009
FUSTAKMN LJNIVER$,T1 MALAYSIA PAHAP4G
No. PeroIeha No. Pi4 044299
Ta—rik—h +89
0 5 MAR 2010
Vi
ABSTRACT
Compression ratio can be defined as the pressure different between top dead
center (TDC) and bottom dead center (BDC) of the piston in the combustion
chamber. Compression ratio takes importance element to determine the power of the
engine. Therefore, the objective of this study to determine the best compression ratio
of modified piston for compressed natural gas (CNG) usage. The original engine is
single cylinder four-stroke diesel engine. Compression ratio for this diesel engine is
20.28:1. The original piston of this engine is bore a bowl on the piston head to get
certain compression ratio. Therefore, Computational Fluid Dynamics (CFD) method
using FLUENT simulation software was used for this purpose. Model of combustion
chamber with modified piston construct by using GAMBIT software, than export the
model to FLUENT for dynamics analysis. The maximum pressure and maximum
temperature in the combustion chamber model determined. Base on the simulation
result, the highest pressure before the spark plug spark the flame is 15.5:1 of
compression ratio. Meaning that, the best compression ratio of modified piston for
compressed natural gas is 15.5:1.
vii
ABSTRAK
Nisbah mampatan boleh definisikan sebagai tekanan yang berbeza antara
pusat mati atas (TDC) dan pusat mati bawah (BDC) piston di dalam ruangan
pembakaran. Nisbah mampatan merupakan elemen penting untuk menentukan
kekuatan enjin. Oleh itu, objektif kajian mi adalah untuk menentukan nisbah
mampatan terbaik bagi piston yang telah diubahsuai untuk kegunaan gas alam
mampat (CNG). Enjin asal ialah enjin diesel empat lejang, satu silinder. Nisbah
mampatan enjin diesel mi adalah 20.28:1. Piston asal enjin mi ditebuk mangkuk path
permukaan piston untuk mendapatkan nisbah mampatan tertentu. Dengan itu,
perisian Computational Fluid Dynamics (CFD) yang digunakan untuk tujuan
simulasi mi ialah perisian FLUENT. Model ruangan pembakaran bersama piston
yang telah diubahsuai dibuat dengan menggunakan perisian GAMBIT sebelum
model dieksport untuk dianalisis dengan menggunakan analisis dinamik. Tekanan
maksimum dan suhu maksimum dalam model ruangan pembakaran akan
menentukan. Berdasarkan keputusan simulasi, tekanan tertinggi sebelum percikan
busi api ialah nisbah mampatan 15.5:1. Kesimpulan, nisbah mampatan yang terbaik
bagi piston yang telah diubahsuai untuk kegunaan gas alam mampat (CNG) ialah
15.5:1.

viii
TABLE OF CONTENTS
Page
SUPERVISOR'S DECLARATION
11
STUDENT'S DECLARATION
111
ACKNOWLEDGEMENTS
V
ABSTRACT vi
ABSTRAK vii
TABLE OF CONTENTS
viii
LIST OF TABLES x
LIST OF FIGURES xi
LIST OF ABBREVIATIONS xlii
CHAPTER 1 INTRODUCTION
1.1 Introduction 1
1.3 Problem Statement 2
1.3 Objective of the Study 3
1.4 Scope of the Study 3
CHAPTER 2 LITERATURE REVIEW
2.1 Fudamental of Four-Stroke Engine 4 2.2 Compression Ratio (CR) 6 2.3 Piston Modification
2.4 Natural Gas 10 2.5 Computational Fluid Dynamics (CFD) 13
lx
CHAPTER 3 METHODOLOGY
3.1 Introduction 16
3.2 Project Flowcharts 16 3.3 Engine Specification 18 3.4 Combustion Chamber Modeling 18 3.5 Mesh Sensitivity Study 21 3.6 Modeling Computational Fluuid Dynamics (CFD) 22
CHAPTER 4 RESULTS
4.1 Introduction 28 4.2 Result and Discussion 29
4.2.1 Graph Trend 29 4.2.2 CFD Analysis Data 30 4.2.3 Pressure Contours 35 4.2.4 Temperature Contours 37
CHAPTER 5 CONCLUSION AND RECOMMENDATIONS
5.1 Conclusions 40 5.2 Recommendation 41
REFERENCES 42 APPENDICES 43 A Gantt Chart for FYP 1 and 2 43

x
LIST OF TABLES
Table no. Title Page
2.1 Typical Composition of Natural Gas in Malaysia 11
2.2 Natural Gas Composition Recommended by the NGV Coalition (U.S.A) 12
2.3 Natural Gas Composition (U.S.A & Europe) (Bassi 1990) 13
3.1 Compression Ratio of 14.5 at 2600rpm 21
4.1 Analysis Data for CRofl3.5:1 31
4.2 Analysis Data for CR of 14.5:1 32
4.3 Analysis Data for CRofl5.5:1 33
Xi
LIST OF FIGURES
Figure No. Title Page
2.1 Four-Stroke Cycle 7
2.2 Structure of Piston (Ferguson 1986) 8
2.3 Various Shapes of Piston Crown 9
3.1 Project Methodology 17
3.2 Simulation Model 19
3.3 Modified Piston 19
3.4 Mesh with spacing of 2, 1 and 0.7. 21
3.5 Creating vertex 22
3.6 Creating edge 23
3.7 Creating face 23
3.8 Grid generation 23
3.9 Boundary types setting 24
3.10 Continuum types setting 24
3.11 Solver setting 24
3.12 Save and export model. 25
4.1 Graph Pressure versus CA 29
4.2 Graph Temperature versus CA 30
4.3 Graph Maximum Pressure versus RPM 34
4.4 Graph Maximum Temperature versus RPM 34
4.5 Pressure Contour at 300° CA
4.6 Pressure Contour at 310° CA

xli
4.7 Pressure Contour at 320° CA 36
4.8 Pressure Contour at 330° CA 36
4.9 Pressure Contour at 340° CA 36
4.10 Pressure Contour at 350° CA 37
4.11 Temperature Contour at 300° CA 38
4.12 Temperature Contour at 3100 CA 38
4.13 Temperature Contour at 320° CA 38
4.14 Temperature Contour at 330° CA 39
4.15 Temperature Contour at 340° CA 39
4.16 Temperature Contour at 350° CA 39
LIST OF ABBREVIATIONS
BDC Bottom Dead Center
CA Crank Angle
CFD Computational Fluid Dynamics
CNG Compressed Natural Gas
CR Compression Ratio
FYP Final Year Project
LCA Lobe Centerline Angle
NGV Natural Gas Vehicles
RPM Revolution per Minute
TDC Top Dead Center
2-D Two-Dimentjons
3-D Three-Dimentions
xlii

CHAPTER 1
INTRODUCTION
1.1 Introduction
It is important to understand the function and the operation of the diesel
engine before the modification stage begins. Therefore, a brief explanation of the
operation for the conventional diesel engine is explained below and the main focus
on the compression stroke. The detail of the operation in the diesel engine will be
explained further more in Chapter 2.
• Air flows into the internal combustion engine through the inlet/intake valve
during the induction stroke of the piston.
• Then, it is compressed adiabatically to the top dead centre (TDC) of the
combustion chamber during the compression stroke. Before the piston
reaches the TDC at the end of the compression stroke, fuel (diesel) is injected
into the combustion chamber. The mixture of fuel and air would auto-ignite
soon after the fuel is injected.
However, in reality, the diesel engine might not work as in theoretically.
Normally, the mixture of fuel and air would burn very rapidly. This causes the Pressure to rise rapidly and produces excessive knocking that can damage the engine. Therefore, the higher the pressure rise rates in the combustion process, the noisier is
the diesel engine compared to the gasoline engine (Selim 2003).
Besides that, it produces gases like carbon monoxide, nitrogen oxides, Unburned hydrocarbon, smoke, soot and other forms of black carbon as well as

2
particulate matter such as lead. All the gases are harmful to the environment and
human kind. They can cause greenhouse effect, acid rain, ozone thinning and air
pollution to the environment. Due to these effects, human will get all kind of diseases
such as lung cancer, breathing difficulties, poison and skin cancer.
Therefore, to overcome the above problems, researchers had been
investigating into a new engine development to replace the conventional diesel
engine. The aim is to develop a more environmental-friendly engine with similar if
not better performance as the conventional diesel engine. One such development
being investigated is the CNG-diesel engine. Since conventional diesel engine
operates at a high compression ratio, the compression ratio of the CNG-diesel engine
system is an area of major concern.
1.2 Problem Statement
Converting diesel engine to CNG-diesel engine give a huge change to the
design of the combustion chamber. It is because of the engine need to reduce the
compression ratio to the optimum level to get the best engine performance. There is
several ways to reduce the compression ratio in the combustion ratio; one of them is
by boring a bowl on the piston head. Therefore, this study is carried out with purpose
to investigate and simulate the best compression ratios on the engine performance for
Compressed Natural Gas (CNG)-diesel engine using CFD method

3
1.3 Objectives of the Study
In order to achieve the project, the objective of this project must be stated as a
guide for the project. The objective of this project is stated below:
i) The main objective of the project is to find the best compression ratios on the
engine performance for Compressed Natural Gas (CNG)-diesel engine by
simulate the compression process of the engine.
ii) To investigate maximum temperature at certain compression ratio
1.4 Scopes of the Study
For this study, the scope that the project limited to is stated below:
i) To research on the information related to the combustion process, piston
design, compression ratio and natural gas.
ii) Modify the piston design in the combustion chamber to get different
compression ratio for the investigation.
iii) Using CFD simulation software such as FLUENT to simulate a 2D model of
the piston in the combustion chamber during compression stroke. iv) To analysis compression ratio between 13.5:1 to 15.5:1 at speed from 200
RPM to 4000 RPM with increment of 200 RPM. v) Select the best compression ratio that delivered highest maximum pressure
before the spark plug spark the flame.

—c
1
4
Yl^I
CHAPTER 2
LITERATURE REVIEW
2.1 FUNDAMENTAL OF FOUR-STROKE ENGINE
The engine can be divided into two categories. One is the four-stroke cycle
and the other one is the two-stroke cycle (Ferguson 1986). For the purpose of this
project, only the four-stroke cycle will be discussed in this section. Basically, the
four stroke cycle consists of the intake, compression, power and exhaust strokes as
shown in Figure 2.1 below:
Intake Stroke Compression Stroke Power Stroke Exhaust Stoke
Figure 2.1: Four-Stroke Cycle

Each of the strokes is explained in more details as in the following:
• Intake stroke is the first stroke for the Diesel cycle, where the piston moves
down to the bottom dead center (BDC). During this stroke, the inlet valve
will open at the start of the stroke until it ends to let the air to flow into the
combustion chamber while the exhaust valve is closed.
• Next, the piston will move up to the top dead center (TDC), which is also
known as the compression stroke. Here, the air is compressed until just before
the piston reaching the TDC, fuel is injected into the combustion chamber to
ignite the combustion process through diffusion between fuel and air.
• Due to the high pressure gases compressed in the compression stroke, the
piston is pushed down by the gases and forces the crank to rotate. Therefore,
the piston will move from the TDC to the BDC again. This stroke powers the
engine and thus it is known as the power stroke.
• For the fourth stroke, the piston will move up again to the TDC. As it
approaches the TDC, the exhaust valve will open and allows the combustion
products and the remaining burned gases to exit through it. Therefore, this
stroke is known as exhaust stroke and the cycle will repeat again.
From the explanation above, the information will provide the basic
knowledge for the design of piston in the combustion chamber. The most important
part among the strokes mentioned above is the compression stroke, which is the time
when the combustion will start to ignite before TDC level.

7
promotes better mixing quality of the fuel and air that improves the efficiency and
faster combustion process. To lower the peak pressures and widening the knock
limits, high compression engine needs a high performance ignition system with a
gross overkill mode and cam's advance reduced by 2-3 degrees.
Lastly, seeking a high compression engine to produce maximum power
output through the effectiveness of the combustion process means that the engine
must operate at a higher rpm also. Therefore, combustion chamber compacted by
lengthening the piston stroke, modified the piston crown to be flatter and bringing
the intake and exhaust valves to a more vertical position approximately 18 degrees
(Vizard 2003).
2.3 PISTON MODIFICATION
Generally, piston is one of the components in the internal combustion engine
that is connected to a connecting rod to control its movement. The structure of the
piston can be divided into two sections, which are the top section and the lower
section as shown in Figure 2.1 in the following page. The top section is known as the
crown or head while the lower section is called the skirt.
For the purpose of this project, the skirt is neglected and only the crown will
be focused. The crown of the piston is the top surface where the explosive force is
exerted when the piston moved up and down in the combustion chamber. Therefore,
it is usually thick to resist the high gas pressure and to provide a smooth heat flow
from the crown to the combustion rings.

Piston nn carrier
Lower chamber
Piston ph cailier -
Pistor skirt
Upper chamber
Pistol head
Piston oil collector
8
Oil supply valve Oil discharge valve /
Figure 2.2: Structure of Piston (Ferguson 1986)
The shape of the piston crown depends on the design of the combustion
chamber. There are various shapes such as concave, flat, cup, dome, hump and
contour to promote turbulence in combustion or to control the combustion process
(Yusof 2000). For example, a piston with an offset of a non-annular bowl is
contoured to increase the spray plume length in order to avoid impingement. The
shapes of the piston crown are shown in Figure 2.2 in the following page.

thgii jUMN50404;--
6io 0-0 ir d.- 46; .44I
Figure 2.3: Various Shapes of Piston Crown
Besides that, it is important to select a proper material for the piston. The
material must be light in weight, strong, economical and has high heat conductivity
and wear resistance as well as can expand slightly when heated to achieve good
combustion efficiency. Therefore, piston used in internal combustion engine is
usually made of aluminum for its lightness and good heat conductor; or cast iron for
greater heat and wear resistance (Yusof 2000). With a proper understanding on how
the piston works in the engine, the design process will be made easier.

2.4 NATURAL GAS
Natural gas was first used as fuel in China during the Shu Han dynasty in
AD221-263. The gas was obtained from shallow wells near seepages and was
distributed locally through piping made of hollowed-out bamboos. Since then, there
are no records on the usage of natural gas until the early 17th century in Northern
Italy, where it was used as a fuel to provide lighting and heating (Tiratsoo 1979). As
the time moves on, the usage of natural gas spread to North America, Canada, New
Zealand and Europe. The usage was limited to domestic and industry heating.
When the world turned into the 20th century, the usage of natural gas
expanded to most part of Western Europe and USA. Exploration for the natural gas
source was more active after the post-war years. It became a commercial item in the
form of liquefied natural gas (Tiratsoo 1979) for exports and imports. The gas fields
or the natural gas resources are mainly found in Asia and Middle East countries.
These include Malaysia, Brunei, Algeria, Libya, Saudi Arabia, Kuwait and Iran. By
1980s, these countries became the main exporters of natural gas.
The usage of natural gas as a vehicle fuel was discovered back in the early
1920s in Italy. The usage was not popular then due to the fact that natural gas was
more commonly used in domestic and industry heating as well as to generate
electricity. However, after the World War 2, there is growing interest on the usage of
natural gas as vehicle fuel. This interest had led to establishment of approximately
1200 refueling stations and 1500 sub stations for natural gas in Italy by the early
1950s (Shamsudjn & Yusaf 1995).
In 1991, Italy became the leading country in the research of natural gas vehicles Italy had about 235 000 gasoline vehicles and 20 diesel vehicles that were Converted to natural gas (Shamsudjn & Yusaf 1995). Natural gas is compressed in a
high pressure tank of I 8-2OMPa to form compressed natural gas (CNG). The country with
the second highest natural gas vehicles is Argentina, which has about 100 000 gasoline v
ehicles and 10 Converted diesel vehicles (Shamsudin & Yusaf 1995).
10

11
The trend towards converting gasoline and diesel vehicles to use CNG is still
quite unpopular in Malaysia, compared to more developed western countries.
However, due to the limitation of the crude petroleum oil reserves, which should last
for another 15 years, Malaysia has since resolved to do more researches and
experiments to use alternative fuels like natural gas. This is because the country
natural gas reserves would last for about 80 - 90 years. Review showed that up until
December 1994, there were about 900 vehicles converted to use CNG as fuel in
Malaysia (Shamsudin & Yusaf 1995).
Generally, natural gas is one of the hydrocarbon families, made up of carbon
and hydrogen atom. There are different compounds in natural gas such as methane,
ethane, propane and iso-butane as well as other non-hydrocarbon compounds such as
carbon dioxide and nitrogen. The natural gas found in Malaysia and used in this
project is assumed to consist of mainly methane, ethane and propane. Their
respective composition percentage of the typical natural gas found in Malaysia is
shown in table below;
Table 2.1: Typical Composition of Natural Gas in Malaysia
(Yusaf et al., cited in Heath 1996)
Components Mole (%)
Methane 83.44
Ethane 10.55
Propane 1.13
Iso-butane 0.13,
Normal butane 0.07
Iso-pentane 0.01
Normal pentane -
Hexane 0.01
Carbon dioxide 4.17
Nitrogen 0.31
12
The variation in the natural gas composition brought difficulties in the
improvement of engine performance and minimization of the exhaust gas pollution.
Since the proportion of methane in natural gas is the largest compare to other gases
like propane and ethane, the main characteristic of natural gas can be directly related
to the characteristic of methane.
To configure this problem with variation of natural gas composition, the
Natural Gas Vehicles (NGV) Coalition in USA has recommended a general guideline
of natural gas composition used for the emission test certificate. This test is carried
out to help the certification of the engine's performance and its exhaust gas pollution
characteristics that are affected by the gas composition (Bassi 1990).
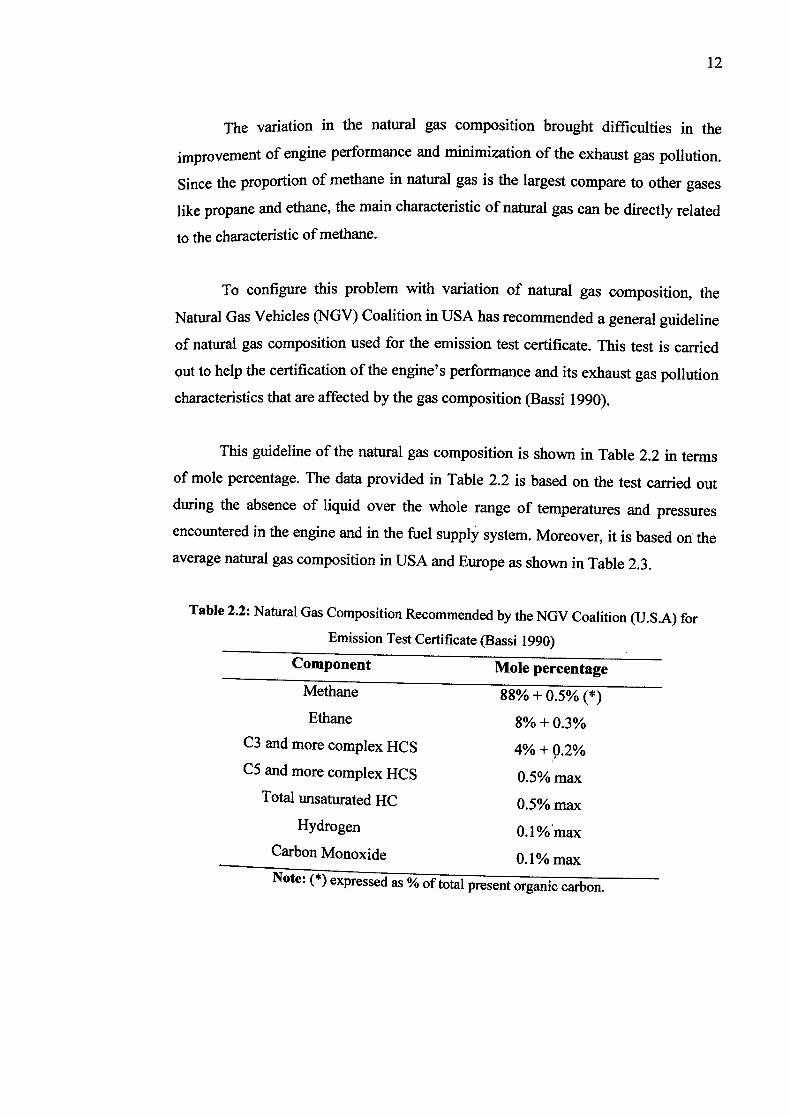
This guideline of the natural gas composition is shown in Table 2.2 in terms
of mole percentage. The data provided in Table 2.2 is based on the test carried out
during the absence of liquid over the whole range of temperatures and pressures
encountered in the engine and in the fuel supply system. Moreover, it is based on the
average natural gas composition in USA and Europe as shown in Table 2.3.
Table 2.2: Natural Gas Composition Recommended by the NGV Coalition (U.S.A) for Emission Test Certificate (Bassi 1990)
Component Mole percentage Methane 88% + 0.5% (*)
Ethane 8%+0.3% C3 and more complex HCS 4%+0.2% CS and more complex HCS 0.5% max
Total unsaturated HC 0.5% max Hydrogen 0.1%'max
Carbon Monoxide 0.1% max
Note: (*) expressedas % of total present organic carbon.

13
Table 2.3: Natural Gas Composition (U.S.A & Europe) (Bassi 1990)
Component USA (%) Italy (%) Holland (%) Russia (%)
Methane 92.21 99.63 89.44 93.27
Ethane 3.78 0.07 3.25 3.32
Propane 0.91 0.04 0.69 0.83
Butanes 0.47 - 0.29 0.37
Pentanes 0.10 - 0.09 -
Hexane and0.04 - - -
higher
Carbon0.59 0.01 0.70 1.00
Dioxide
Oxygen 0.05 - - -
Nitrogen 1.84 0.25 5.51 0.91
From the information given above, the composition of natural gas affects its
properties no matter is physically or chemically. This is the reason to the difficulties
faced by engineers all around the world to configure their engine design since every
gas field in every nation has its own natural gas composition.
2.5 COMPUTATIONAL FLUID DYNAMICS (CFD)
Computational fluid dynamics (CFD) is a technology that is used to analyze
the dynamics of anything that can flow regardless in liquid . or gaseous state. It is a
software tool that can model or simulate a flow or phenomena of any system or
device under analysis.
CFD is computed using a set of partial differential equations to predict the
flow behavior. Besides that, it is also used for analyzing heat transfer model, mass
flow rate, phase change such as solidification, chemical reaction such as combustion,
turbulence model, mechanical movement such as rotating shaft, deformation of solid Structure and many more (FL UENT Manual - Introduction 2004).

14
It is always a preferred method over the conventional design method because
it is cheaper and save a lot of time. Before there is such technology, usually
engineers need to build a real model for testing and redo the model again until the
optimum result is obtained. Such a long procedure would consume more money and
time. With the aid of CFD software, engineers can simulate different set of
parameters for testing to get the optimum result before working on the real prototype
without any additional cost.
The procedure for most of the CFD analysis divided by three phase. They are
pre-processing, processing and post data who are the final step of analysis. In
FLUENT software, the steps of three phases are shown below:
i. Pre-processing: The model used for the analysis is drawn, meshed and the
boundary layers are determined. This is done using the GAMBIT software,
which is the compatible modeling software for FLUENT. All the files for the
geometry and meshing of the model are saved as mesh or grid file. Next, in
FLUENT, the saved mesh or grid file of the model is read, checked and
scaled for the required working unit.
ii. Processing: The model is defined for the type of solver and boundary
conditions to be used. The model is defined according to the type of analysis
required in the research project. The model is solved by setting the required
parameters in the solution panel and then iterated for convergence.
Post Data: Finally, results can be obtained from the graphic display and report
in FLUENT. Results can be displayed in terms of contour, velocity vector,
and particle track and path line. Any calculation required can be performed in
FLUENT also. The results and all the data can be saved for fixture references by writing the files.
This software has various modeling capabilities that can be used in numerous
kinds of analysis and application. Among its capabilities are listed in the following P8C. (FLUENT Manual - Program Capabilities 2004):

15
• Flows in 2D or 3D geometries are using unstructured solution-adaptive
triangular/tetrahedral, quadrilateral/hexahedral, or mixed (hybrid) grids that include prisms (wedges) or pyramids.
• Incompressible or compressible flows.
• Steady-state or transient analysis.
• In viscid, laminar, and turbulent flows.
• Newtonian or non-Newtonian flow.
• Convective heat transfer, including natural or forced convection.
• Coupled conduction/convective heat transfer.
• Radiation heat transfer.
• Inertial (stationary) or non-inertial (rotating) reference frame models.
• Multiple moving reference frames, including sliding mesh interfaces and
mixing planes for rotor/stator interaction modeling.
• Chemical species mixing and reaction, including combustion sub-models and
surface deposition reaction models.
• Arbitrary volumetric sources of heat, mass, momentum, turbulence, and
chemical species.
• Lagrangian trajectory calculations for a dispersed phase of
particles/droplets/bubbles, including coupling with the continuous phase.
• Flow through porous media.
• One-dimensional fan/heat-exchanger performance models.
• Two-phase flows, including cavitation. • Free-surface flows with complex surface shapes.
All the capabilities mentioned above are useful in providing a better approach
for the analysis in applications such as process equipment, aerospace and turbo machinery, automobile, heat exchanger power generation in oil/gas industry and material Processing. Therefore, with the availability of such capabilities, the analysis
før the purpose of this research project can be carried out in a more accurate and user friendly way.

CHAPTER 3
METHODOLOGY
3.1 INTRODUCTION
Methodology is underlying principles and rules that govern a system while
method can be defined as systematic procedure for a set of activities. Methodology is
starting with piston modification by choosing a design from several idea and concept.
Than, model of combustion chamber with modified piston is build up using the
modeling software, GAMBIT and so with the grid generations. Before running
simulation of the combustion chamber with modified piston, mesh sensitivity
analysis is carried out to get the best grid generation. From the best grid generation,
simulation procedures are carried out using computational fluid dynamics (CFD) simulation software, FLUENT.
3.2 PROJECT FLOWCHART
To achieve the objectives of this project, a methodology has been constructed
(see figure 3.1). The methodology flow chart is purposed to give guidelines and
directions to successfully accomplish the main goal of this project. The following is
the summary methodology flow chart. Start with searching the information for
literature review. Then select the piston design and start modeling. Grid selection is
done after mesh sensitivity analysis. The best grid generation is setting up for analysis. Ail data from the analysis is collected and interpreted into table format.
Lfly discuss the obtain result.