this space should be left blank, except for the name of...
TRANSCRIPT

Can bed-load help to validate hydrology studies in mountainous catchment? The case study of the Roize (Voreppe – FR)
Guillaume Piton1,a , Daniel Vázquez-Tarrío1, Alain Recking1
1 Université Grenoble Alpes, Irstea, UR ETGR, 2 rue de la Papeterie-BP 76, F-38402 St-Martin-d'Hères, Francea Corresponding author: [email protected]
Abstract. Larges uncertainties are attached to hazard prediction in mountain streams, because of some limitations in our knowledge of physical processes, and overall, because of the lack of measurements for validation. This is particularly true for hydrological data, making the hydrology assessment of a mountain river a very difficult task, usually associated with large uncertainties. On the other hand, contrarily to lowland rivers, bed-load in mountain streams is often trapped in mitigation-structures, such as open check dams. This study aims to take advantage of these additional information for compensating the general lack of hydrological data, in order to converge toward a comprehensive diagnosis of the catchment hydrological behavior. A hydrology and sediment transport study has been done on the Roize torrent (16.1-km² - Voreppe - 38-FR). After a classical historical study, a regional analysis of rain-gauges and water-discharge-stations situated in the calcareous north Pre-Alps massifs of the Vercors, Chartreuse and Bauges has been done. A catchment geomorphology study has been performed to get insight about the Roize torrential activity and sediment transport. The volumes of bed-load transported each year on average and during extreme floods have been computed using the estimated hydrology. The good bed-load predictions compare to the volume dredged in the Voreppe sediment trap are considered an indirect validation of the hydrology study.
1 Introduction
Assessing the hydrology of a river is a difficult task, usually associated with very large uncertainties. It is even more difficult in mountainous regions where streams are characterized by flash floods in conjunction with an erratic capacity to massively transport sediments (Fabre 1797). Indeed, sediment transport can aggravate flood hazard by obstructing hydraulic structures as bridges and channels, as well as strongly affect the channel geometry during a given event (Costa de Bastelica 1874), and consequently the associated stage discharge relationships (Baldassarre and Montanari 2009). When compared to standard lowland rivers, bed-load can thus be considered as a large additional source of error in assessing hydrology and flood hazards in steep mountain streams. On the other hand, contrarily to water discharge, in these streams, bed-load volumes are often trapped in mitigation-structures as open check dams and can be measured later during their dredging, being useful data of the catchment activity (Rickenmann 2001, Rickenmann and Koschni 2010, Peteuil et al. 2012, Rickenmann et al. 2015). In this work we propose to test methods of bed-load transport estimation and to take advantage of these sediment transport measurements for indirectly validating the hydrology.
It is tested within a case study of the Roize, a torrent located in the Chartreuse massif (38-FR) which drains a
16.1-km² watershed at its fan apex. The city of Voreppe (10,000 inhabitants in 2015) occupies the Roize well-developed fan. Voreppe and the Roize share a long history of flood-hazards and hazard-mitigation since the firsts countermeasures were built in 1761 and complementary structures were regularly added (Lamand et al. 2015). After the last catastrophic flood of July 1971 (Jail and Martin 1971), a sediment trap with an open check dam has been built. The structure traps nearly all the bed-load transport of the torrent. The dredged-volumes of this structure were collected by the French torrent control service (RTM) since 1985 and constitute an interesting database of sediment production.
The present paper synthetizes i) the Roize flood history, ii) a geomorphology study that clarify what kind of torrential floods can occur in the torrent; e.g., debris flows, bed-load and driftwoods; iii) a regional hydrology study covering the calcareous north Pre-Alps massifs of the Vercors, Chartreuse and Bauges and iv) bedload transport estimations using state-of-the-art methods. Several complementary information on the morphology, land use, hydrology and hydraulics can be found in Lamand et al. (2015).
2 Catchment presentation

The European Physical Journal Conferences
2.1 Roize catchment
The Roize torrent is a tributary of the Isere River located in the south western part of the Chartreuse massif (Isère FRA. – Fig. 1). Its 16.1-km² catchment is drained by two main-stems: The Upper Roize is the more active in term of sediment transport, though it has a half size catchment compare to the other: the Roizette.
The local geology is mainly composed of limestone with marl layers. Limestone cliffs founded on poor quality marlly-limestone located in the Upper Roize headwaters constitute the main catchment sediment sources (extension of the actively eroding area: 0.38 km² - RTM38 2009). Evidences of debris flows are numerous in the headwaters steep channels (e.g., lateral levees). Downstream of their confluence (Fig. 1), the Roize flows in 3.3 km-long gorges with limestone, and further downstream, molasses side cliffs and a bed paved with big limestone boulders. The bed morphology is a mix of bedrock and cascade in the headwaters and a shift from cascade to step-pools in the gorges (sensu. Montgomery and Buffington 1997). The active bed width (~5 m) varies with the gorge width: Several wider areas (up to 20 m-wide) seem to be natural solid-transport regulating areas since evidences of debris flows deposits are numerous along these specific gorge reaches and the solid transport processes slightly shift from mainly debris flows to mainly bedload. This analysis is based on a detailed catchment field survey with a special attention to natural traces of sediment transport processes, the so-call "silent witnesses" (lateral levees, old boulder fronts, deposit patterns, bed morphology - Kaitna and Hübl 2013).
Conversely, the Roizette catchment has no significant sediment source. Its catchment is mainly covered by woods and fields. Its bed, much narrower than the Roize's, is heavily constrained by stable vegetation. It seems that its solid transport is negligible out of extreme events. Consequently its vegetated step pools seems very stables, consistently with the Recking et al. (2012a) conclusion of more stable step-pools in system disconnected from sediment sources.
Numerous woody debris are presented everywhere in both streams, creating woody debris jams as well as natural dams trapping sediment.
The Roize-Roizette confluence is located 200 m upstream of the sediment trap (Fig. 1). The water input of the Roizette in the Roize induces an increasing sediment transport capacity with negligible sediment input, consequently the bed is more paved and its slope is milder downstream of the confluence.
Downstream of the sediment trap, the bed morphology is very different. Much less alluvial material can be observed (few pebble patches). Vegetation is considerably more present in the bed. Finally, bank erosions are numerous, suggesting that nearly no sediments are transported from upstream and that the Roize tend to recruit sediment in the existing old alluvial terraces. It is thus assumed that the sediment trap stops nearly the entire coarse sediment supply and that the
recorded dredged volumes are good indication of the bulk catchment bed-load production.
About 1.3 km downstream of the sediment trap, the Roize finally reach its fan which is quite large and currently nearly completely urbanized by the Voreppe city (~10,000 inhabitants in 2015). Several strategic transportation networks cross the fan (Fig. 1). The potential damages and elements at risk in case of fan-flooding are numerous and the Roize has a long history of flood hazard mitigation.
2.2 Brief history
A complete historical analysis has been done to gather data on flood occurrences and mitigation measures' implementations (Lamand et al. 2015). The main historical facts are reported in Table 1. In sum the Roize catchment exemplifies typical large French torrents' history: 1. The first cut-stone structure built on the stream
during the 17th century was a bridge aiming at securing the channel crossing. It was located near the fan apex to be protected from avulsion problems and to serve the old Voreppe village.
2. The first flood mitigation measures were concentrated on the fan channel, specifically in bridges and old village vicinity, with several campaigns of dike construction and extension since the 18th century.
3. Structures aiming to cope with sediment transport problems were first implemented in the mid-19th
century with a bed-load deposition basin in the fan lower part.
4. Check dams were built upstream of the fan only in the second part of the 19th century, with major operations occurring after the 1882's law of mountain areas' restoration (RTM law) and concentrated in the headwaters.
5. These intense works were stopped between ca. 1914 and the 1960s.
6. However, it is only following an extreme flood in 1971 that a modern sediment trap with an open check dam was built in 1985. Since its creation the structure is regularly dredged providing data on the sediment production of the Roize upper catchment.
Human impacts on the Roize are thus quite numerous, a typical situation of the European alpine streams (Wohl 2006), with i) a completely artificial bed along the entire fan, ii) a sediment trap disrupting sediment transport 1.3 km upstream of the fan apex and iii) more than one hundred check dams located in the headwaters channel. However, according to the RTM archives, few maintenance or dredging operations took place in the last decades in the upper-catchment and the sediment transport is assumed to be marginally influenced in the headwaters and gorges parts. The application of classical hydrology and sediment transport methods is thus assumed to be reasonable.

Title of the conference
Figure 1. Location of the Roize catchment and main geomorphic and structures, indication of catchment and sub-catchment area, lower and top elevation, Roughness Index (Melton 1965), outlet bed slope and bed-surface grain size
Table 1: Major historial facts concerning flood hazards, mitigation measured and catchment management
Date Historical fact: (Color legend: Divers information, Structures, Floods, Dredging) Source1680 Main Voreppe bridge construction on the Grenoble-Lyon road Pilot 1856
1690-1761 Multiples flood (1690,1692,1695,1703,1750,1757,1761) BD-RTM1761 First dikes construction near the old Voreppe and its bridge: from the fan apex to shortly
downstream of the bridge Pilot 1856
1769 Flood, correct protection of the old Voreppe, proposition to extend the dikes to protect Brandegaudière Pilot 1856
1772 Dikes extension downstream of the RN75 to protect Brandegaudière Pilot 185603/01/1850 Creation of the Roize association to maintain and protect the city
New protection measures: small bed sills at the fan apex, large deposition basin surounded by dikes in the fan distal part, downstream of the dikes (extension: ~ 20,000m²)
Isère dept. ArchivesBD-RTM
31/7/1851 Severe flood with huge sediment transport, extensive bank erosionsCreation of the first torrent control check dams built in France: 3 dams 600, 1300, 1800 m upstream of the fan apex. Built to promote sediment deposition and prevent incision
BD-RTMGras 1857
1852-1856 Floods (1852, 1856), deposition observed on the check dams (Gras 1857, Culman 1865) BD-RTM1862 Lyon-Grenoble railway creation: cross the fan by a tunnel to prevent flood hazard. Pinhas 19871882 Flood, downstream deposition basin filled BD-RTM1882 Mountain areas restoration law: huge reforestation and torrent control plans1901 Roize considered as one of the most dangerous torrent of the Isère.
Torrent control work project: reforestation (1.45 km²), 140 check dams (1.5-2.5 m-high), bioengineering, access tracks, gabion dikes, etc.
Eaux et Forêts 1911
1904 Flood, bank erosion, general deposition on the fan, avulsion and deposit near the fan toe BD-RTM1967 7 new check dams, creation of a new access track for trucks, maintenance operations RTM arch.
05/07/1971 Major flood, RN75-bridge jammed by driftwood, general flooding of the fan, 50,000 m³ (RTM arch.) to 100,000 m³ (Jail and Martin 1971) of sediment transported. BD-RTM
1985 Sediment trap with an open check dam construction (capacity ~5,000 – 10,000m³) Pinhas 1987

The European Physical Journal Conferences
1990-2014 ~21,200 m³ of sediment dredged in 25 years. RTM arch.2.3 Sediment production data
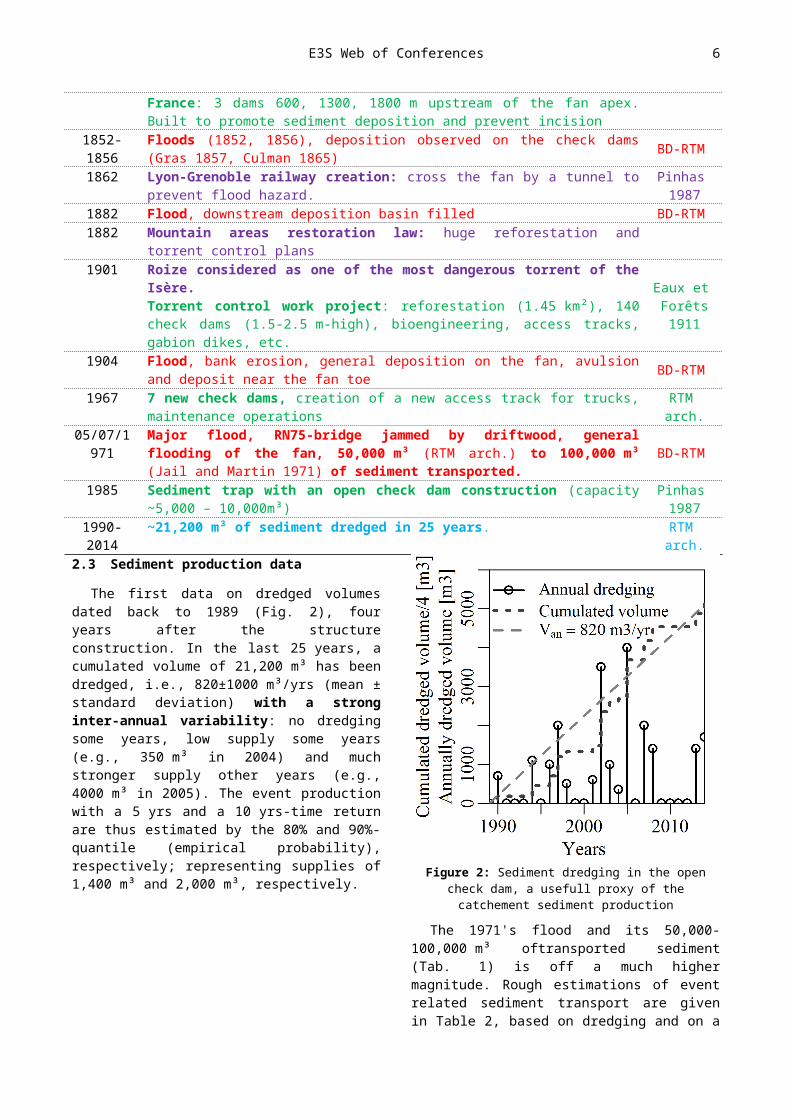
The first data on dredged volumes dated back to 1989 (Fig. 2), four years after the structure construction. In the last 25 years, a cumulated volume of 21,200 m³ has been dredged, i.e., 820±1000 m³/yrs (mean ± standard deviation) with a strong inter-annual variability: no dredging some years, low supply some years (e.g., 350 m³ in 2004) and much stronger supply other years (e.g., 4000 m³ in 2005). The event production with a 5 yrs and a 10 yrs-time return are thus estimated by the 80% and 90%-quantile (empirical probability), respectively; representing supplies of 1,400 m³ and 2,000 m³, respectively.
Figure 2: Sediment dredging in the open check dam, a usefull proxy of the catchement sediment production
The 1971's flood and its 50,000-100,000 m³ oftransported sediment (Tab. 1) is off a much higher magnitude. Rough estimations of event related sediment transport are given in Table 2, based on dredging and on a preliminary sediment transport study using historical analysis and classical morphodynamics approaches (RTM38 2006). These data are later compared with the computed sediment transport volumes.
Table 2: Event related sediment production
Time return [yrs] 5 10 30 100
Volume [m³] 1,400 2,000 10,000 30,000
The uncertainty on the transported volumes u(V) for the annual and event related volumes are arbitrarily considered to be of a factor 3, i.e., u(V)/V = [1/3;3]. Bed-load estimation being regularly under or over estimated by more than one order of magnitude (Recking et al. 2012b, 2013), a computation falling in the range [1/3;3] of the empirically estimated transport is considered as reasonably accurate.
3 Method presentation
3.1 Hydrological analysis
No rainfall, nor discharge measurement exist in the Roize catchment. A regional analysis has thus been performed to determine flow-duration curves of annual flows and frequency-discharge curves of flood events. Data from the discharge stations and rain gauges located in the Chartreuse, Vercors and Bauges massifs (Fig. 3) were uploaded in the Banque Hydro database (hydro.eaufrance.fr) and Meteo France database (publitheque.meteo.fr). These three massifs belong to the northern limestone French Pré-Alpes and have ever been considered quite homogeneous in term of hydrology (Mathys et al. 2013), due to similar geology (limestone and karst influences), relief and climate, though a quite strong influence of the relief on the rain falls is obvious (e.g., mean annual rainfall: color background on Fig. 3).
A preliminary study aiming at controlling the data results in the exclusion of stations with excessive karst influence (Meaudret), insufficiently long time series (Vernaison, Belle Eau, La Leysse, Le Tillet) or too large watersheds (>115 km²: Sierroz, Cheran, Leysse) to be compared to the 4-16 km² Roize catchments. Two stations (Guiers Vif, Guiers Mort) where the rain falls are significantly larger than the other are used only in the flood discharge definition, which is rainfall-dependent, but not in the flow-duration curve definition, which is defined without rainfall dependence.
3.1.1 Flow-duration curve analysis
This analysis seeks to reconstruct a flow-duration curve for the Roize catchment, which should be optimized to represent the high flows (interesting sediment transport), i.e., occurring less than 30-50% of the years (curve QX vs X – Fig. 4, X non-exceedance frequency and QX quantile of probability X). It is based on a simple model using the remaining eight discharge stations that cover a relatively large range of watershed surface (10.2-63.5 km²). The daily discharge data Q [m³/s] were divided by the station catchment area A [km²] using a power equation in order to de-trend the effect of the catchment size on the run-off:
Q¿=Q / Aa (1)
Q* [m³/s.km2a] is hereafter refer to as the pseudo-specific discharge. The power coefficient a is usually set to 1 when studying the mean annual flows, leading to the so-called specific-discharge [m³/s.km2]. It has been demonstrated that for flood discharge, a is lower than 1, usually statistically determined between 0.7 and 0.8 (Mathys et al. 2013).
A value of a=0.75 has been found as optimally collapsing the pseudo-specific flow-duration curves

Title of the conference
(Fig. 4a), though it is likely not perfectly adapted to the probabilities close to 0.5. With a larger amount of data, it would have been possible to quantity the evolution of a from 1 to 0.7-0.8 with the increasing quantile probability from 0.5 to ~1.
FLOODrisk 2016 - 3rd European Conference on Flood Risk Management 6
Figure 3. Map of the discharge and rain gauge stations used in the regional analysis, background color figures the annual rainfall

FLOODrisk 2016 - 3rd European Conference on Flood Risk Management 7
A study of the discharge inter-annual variability has been performed to estimate the temporal variability of the flow-duration curves. The Vence catchment, which is located very close to the Roize (Fig. 3) has been taken as reference. The flow-duration curves of each of the 25 years of data have been computed, i.e., 25 quantile Q*X per X-value, i.e., non-exceedance frequency.
We defined "Dry" or "Wet" years with 10-yrs return time as the 10% and 90% quantiles of each of these 25-Q*X sample ([Q*X]Y%, with Y=10% and 90%). The relative difference between the mean flow-duration curve and these dry and wet flow-duration curves is transformed in specific discharge and allow defining mean, Dry and Wet years pseudo-specific flow-duration curves. One can observe on Fig. 4b that the Dry and Wet curves envelop the Albane and Gresse stations' curves (lower and higher Q* on Fig. 4a). It means that the inter-annual variability in one station, here the Vence, is here more pronounced than the inter-station variability of the mean curve: the temporal variability of Q* in one station is thus higher than the geographical mean Q* variation.
Figure 4: Pseudo-specific flow-duration curve: a) data from the 8 small mountain stream stations (number between brackets are
the station catchment surface A in km²) and Regional Mean value and; b) Enveloppe of the Vence pseudo-specific dis-
charge, Regional Mean curve, correction for Wet and Dry years (empirical quantiles [Q*X]Y%, with Y=10% and 90%) and
pseudo-specific discharge of the Albane and Gresse stations: lower and larger pseudo-specific discharges: the inter-annual
variability is higher than the inter-station variability
3.1.2 Flood scenarios
In order to compute event sediment production, flood hydrographs must be defined. A classical flood-hydrology study has been undertaken to define the best regional correlation between the rain gauge data (daily rainfalls) representative of each discharge station and the flood discharges (instantaneous peak discharges) of the 10 stations (8 stations retained for the flow-duration curves + 2 bigger wetter catchments that are also located in the Chartreuse massif). The SPEED method has been used (Carré and Fretti 2010, Carre and Cayla 2012, Mathys et al. 2013):
For each discharge station, the sample of rain gauges located in the vicinity of the catchment has been selected. Each rain gauge statistical distribution has been determined. A catchment-representative trend has then been empirically determined based on considerations of altitude, orientation and distance between the catchment and the rain gauges (Carre and Cayla 2012). Daily rainfalls PT of time return T=5, 10, 30 and 100 years are thus estimated for each discharge station as well as for the Roize catchment. The resulting Roize daily rainfalls are: P5=96 mm; P10=120 mm; P30=159 mm and P100=201 mm.
For each station, the flood peak discharge of time return T-years, QT [m³/s] has been extracted from the Banque Hydro database and eventually extrapolated using the Gradex theory (CFGB 1994) within the SPEED method. Peak discharges QT have been transformed using the same pseudo-specific discharge method and the correlation with PT of the same time return is analyzed under the form (Carré and Fretti 2010):
QT¿ =QT / A0.75=
PT−P0
12(2)
with P0 [mm] the parameter to estimate by the analysis. P0 is found to be quite consistent in the 3 discharge stations of the Chatreuse massif with a value of 97±4 mm. Out of the Chartreuse massif, P0 is lower (58-86 mm), consistently with Carré and Fretti (2010) mean value of ~60 mm in crystalline massifs and a bit higher on calcareous areas. The specifically high value of P0 in the Chartreuse is likely to be related to the particularly high karst influence, a result that has been ever been observed elsewhere (Carré and Fretti 2010). Using Eq. 2 and the preliminary estimated PT, it is possible to estimate peak discharge of the Roize at different points of the catchment.
Hydrographs have been constructed using equation (MA 1982):
QT ( t )=QT , peak 2( 2 t3 D )
4
/1+( 2t3 D )
8
(3)
With t [h] the time during the flood and D [h] an hydrograph characteristic time duration. The equation is built such that Q(t) > 0.5Qpeak during a duration D. An existing flood hazard study (RTM38 2006) retained three scenario of flood duration. Using such short, mean and long flood durations is equivalent to fix D at 1.0, 3.5 and

E3S Web of Conferences 8
6.7 hrs leading to 3 possible hydrographs for each QT (e.g. Fig. 5).
Figure 5: Example for the Upper Roize catchment (A=4.7 km²) of flood hydrographs built using Eqs. 2 and 3, hereafter referred to as short/mean/long floods
3.2 Sediment transport computation
3.2.1 Sediment transport equation
Computing sediment transport in mountain rivers remains a challenge. In order to compute bedload for the Roize, a special attention has been paid to armoring effect on gravel bed river transport capacity. Recking et al. (2016) highlighted the feedback from the river morphology on the sediment transport capacity and proposes recommendations in computation approaches. A specific procedure has been developed by Piton and Recking (in prep.) for heavily paved and stable channels, transporting “travelling” bedload, which are sediments finer than the bed sediments, and travelling downstream from the upstream production zone, with marginal interaction with the bed (no morphological response)
The solid transport equations that has been used ever proved to perform well for a large range of river morphology (Recking 2013a, 2013b, Recking et al. 2016):
Φ=14 τ ¿2.5/1+( τm¿
τ ¿ )4
(4)
τ m¿ =1.5 S0.75 (5)
where S designates the slope [m/m], * the Shields stress and the dimensionless solid transport, that are computed using:τ ¿=dS/(❑s/−1)Dbedload (6)
Φ=Qsv /W √g (❑s /−1)Dbedload3 (7)
where d is the water depth [m], s [kg/m3] the sediment density, [kg/m3] the water density, Dbedload a characteristic diameter representative of the transported material, Qsv is the volumetric solid discharge [m3/s] and W the river width [m].
3.2.2 Friction law equation
Because discharge and not depth is available, the hydraulics has been computed with Eq. 8, derived from the flow resistance equation proposed by Rickenmann
and Recking (2011) for all flow ranges, including steep slopes streams.
d=0.015 D84bs
q¿2 p
p2.5 (8)
where q¿=Q /W √gS D84 BedSurface3 and p=0.24 if
q*< 100 and p=0.31 otherwise, Q is the water discharge [m³/s] and D84BedSurface is the bed surface D84 [m].
The specificity of the present method is very simple: it merely consists in considering two grain sizes in a paved bed - as in the Roize torrent - rather than one as usually done in alluvial gravel-bed rivers. Namely, one characteristic grain size is defined from the bed channel and is a proxy the roughness that account for the friction losses that drive the hydraulics and water depth–discharge relationship (Eq. 8); while the other is measured on transported sediment and is characteristic of the nonlinear response of bedload to shear stresses (Eq. 4-7). In other words, we considered that, on one hand, the hydraulics, i.e., the water depth, should be computed using the bed surface grain size which is eventually quite coarse in mountain streams. While, on the other hand, the sediment transport equations should be used with the representative diameter of the transported-bed-load, called "travelling bed-load" (sensu. Yu et al. 2009). The method has been validated with independent data sets (Piton and Recking, in prep.).
3.2.3 Grain size measurement method
Both diameters were measured with the standard Wolman (1954) surface counts technique; the first in the main channel of the torrent, on the step-pools in the case of the Roize (values in Fig. 1); the travelling bed-load diameter was measured in an area of nearly total deposit of the really-transported bed-load, in our case inside the sediment trap (D84,Travelling Bed-Load=112 mm).
3.2.4 Location of measurement reaches
Two measurement reaches have been considered (Fig. 1). Reach A is located few distances upstream of the confluence and is only submitted to the influence of the Upper Roize catchment. Conversely, Reach B is located few distances upstream of the sediment trap, downstream of the Roize-Roizette confluence. In each reach, three transversal geometry profiles were measured and one computation was done for each of them. The variability between these profile transport capacity, where the slope and the grain sizes are the same, give an idea of the uncertainty of the result related to the stream width.
4 Results
Both the classical sediment transport computation method using a unique value for both D84BedSurface and D84bedload (using the bed surface measurement as reference); and the new method with grain size distribution distinction were applied; this for mean annual sediment transport using the flow-duration curves

FLOODrisk 2016 - 3rd European Conference on Flood Risk Management 9
(Dry/Mean/Wet years - Fig. 4) and for event-related transport using the hydrographs (short/mean/long hydrograph durations - Fig. 5). The transported volumes VS are reported in Figure 6.
Figure 6: Transported volumes and empirical estimations from dredging and archives: a) annual transport computed with flow-duration curves, b) 5-yrs flood hydrographs, c) 10-yrs flood, d) 30-yrs flood and e) 100-yrs flood. Uncertainties lines have been arbitrarily defined as the empirical estimations /3 & *3 (meth-
ods resulting in estimations falling in this quite large uncertainty range are considered as showing good results regarding the gen-eral tendency of bed-load transport formula to show deviations -
over and under prediction - of several orders of magnitude - (Recking et al. 2012b, 2013)
4.1 Classical method VS travelling bed-load method
When using the classical computation method with the unique bed grain size, i.e., D84Travelling Bed-Loade= D84BedSurface (Fig. 6 – Left hand side results), all computed transported volumes VS, annuals (VS,ann) as well as events-related (VS,Qx), are strongly underestimated, generally by several order of magnitudes. This results was expected since torrent heavily paved-beds are not equilibrated alluvial formations (sensu. Lane 1955), i.e. having balanced slopes and grain sizes with their water and sediment supplies. The beds are steeper than this equilibrium profiles and structural bed material are rarely moved.
Computations using the new method (Fig. 6 – Right hand side results), with different values for D84Travelling Bed-
Loade and D84BedSurface, show better agreements with the empirical estimations deduced from dredging and archive analysis.
In the next parts, only the new method results are analyzed since the classical method using a unique grain size is now considered unsuitable for paved torrent beds' solid transport capacity assessment.
4.2 Influence of the measurement reach location
VS estimations in Reach A are generally of better agreement with the empirical data, than in Reach B. Reach A is located at the outlet section of the gorges, downstream of 3.3 km of a natural bed with very low sediment and water input from tributaries. The sediment transport along these 3.3-km gorges has time to equilibrate sediment transport capacity with supply of water and sediment. This reach is thus likely the best location to represent the equilibrium that exists between bed structure resistance and torrent sediment transport capacity and supply.
On the contrary, Reach B is located downstream of an important water input (The Roizette), the catchment area being tripled between Reach A and B. The channel of Reach B adapted its morphology with a gentler slope (SA=0.11; SB=0.085) and a coarser bed surface (D84BedSurface,A=238 mm; D84BedSurface,B=426 mm). But, overall, we suspect this relatively short reach (~200 m) not to be long enough to adapt perfectly its morphology to the supply conditions. In addition, floods do not necessarily occur at the same time in both upper sub-catchments, resulting in storage and releases near the confluence depending on the activated sub-catchment. Overall, the heavier armoring and the massive water input introduce an overestimation in the method.
4.3 Annual transport

E3S Web of Conferences 10
VS,ann is generally overestimated, except using the equivalent Dry year flow-duration curve (clear grey dots). As seen in Fig. 3b, the driest stations mean annual flow-duration curve (L'Albane station) is higher than the Dry year flow-duration curve. Consequently, using another station as reference to determine the flow-duration curve would have resulted in an equivalent overestimation.
Reach A results, with the Regional Mean flow-duration curve, VS,ann =1,500±300 m³/yr (mean ± standard deviation, standard deviation defined on the three profiles per reach) only slightly overestimated the 820±1,100 m³/yr empirical estimation. In addition, both the Wet year and Dry year computations (VS,ann,Wet = 3,600±700 m³/yr and VS,ann,Dry = 410±90 m³/yr respectively) still fall in the range of uncertainties (350-4000 m³/yr) which correspond more or less to the inter-annual variability in the catchment sediment production (0-4000 m³/yr - Fig. 2).
In sum, natural variability in the sediment hillslope production are not necessary to explain the one order magnitude inter-annual variability in sediment transport: the variability in the hydrology - exemplified by the Dry/Mean/Wet flow-duration curves - is sufficient. It highlight the importance of qualifying the inter-annual variability of discharges when using discharge data in sediment transport computation: non linearity effects make quite small discharge variabilities (±50%) transforming in one order of magnitude variabilities on the transported volumes.
4.4 Event-related transport
As a first remark and from a general point of view, the event transported volume VS,Qx are dramatically related to the hydrograph duration (e.g., VS,Q100,Long ~ 2 VS,Q100,Mean ~7 VS,Q100,Short), nearly as much as to the peak discharge (e.g., VS,Q100,Long ~2 VS,Q30,Long ~11 VS,Q10,Long). Consequently, methods aiming at determining mountain torrents flood durations are as much necessary as methods aiming at qualifying the flood peak discharge.
When comparing computation results with empirical data, the VS,Qx, event-related estimations still shows overestimation from Reach B results while results from Reach A more tend to underestimate the empirical estimations. Interestingly, both estimations are improved with the increasing magnitude of the flood, e.g., quite high over and under-prediction of VS,Q5yrs while reasonable over and under-prediction of VS,Q100yrs. The sediment transport prediction in Reach B for a mean 100-years flood (VS,Q100yrs,Mean = 73,000±2,000 m³) is even in good agreement with the 1971's flood transport (50,000-100,000 m³).
It has been previously detailed why only Reach A transport estimations - representative of the main sediment source branch - can be considered as correct for annual transport. Conversely, flood event transport capacity may be considered in-between Reach A and Reach B estimations, which may explain the good agreement between the last 1971's extreme flood and our estimation of a high magnitude flood, e.g., VS,Q100yrs. The
authors consider that it is the print of sediment recruitment downstream of the Roize-Roizette confluence: for average annual flows, the Roize does not
overflow its quite large active bed, some gravel and cobbles patches are rearranged, local preferential paths move and banks are sometimes eroded but overall, the 1.5 km that separate the confluence from the fan show weak erosion. The sediment transport is related to the transport capacity of the 3-km gorges located upstream of that reach as explained before. There is no significant sediment recruitment downstream of the confluence and the sediment transport is driven by the upper Roize basin.
During high floods, the geomorphic adaptations downstream of the confluence can be huge:o Water discharge significantly increase due to the
water input from relatively large Roizette catchment;
o The sediment transport capacity increases thus considerably;
o Small material mobilization may destabilize big boulders by scouring (Recking et al. 2012a);
o Increases in shear stresses and flow velocities possibly induce step-pools and armor breaking (Recking 2014);
o Old woody debris jams that constitute natural sediment transport barriers (Heede 1985, Buffington and Montgomery 1999) are suddenly removed, freeing their trapped sediment stocks;
o Stand trees topple in the bed, generating woody debris jam, diverting flows toward banks and promoting erosion and avulsion (Mazzorana et al. 2009, 2011).
All these effects are strongly related to the flood magnitude and may create sort of threshold effects in flood hazards.
Actually, very strong geomorphic adjustment occurred specifically between the Roizette confluence and the fan apex during the 1971's flood (Fig. 7) and the Roizette activity is known to have been strong during the flood (Jail and Martin 1971).

FLOODrisk 2016 - 3rd European Conference on Flood Risk Management 11
Figure 7: Effects on the Roize bed morphology of the 1971's flood illustrated by aerial photos (©IGN-geoportail.fr): a) 1970: vegetated channel, nearly undiscernible in the riparian woods; b) 1973: 2 years after the flood, the channel is still highly visi-ble, its width increased in some places by a factor 5 (Jail and
Martin 1971) and; c) 2000: sediment trap basin and downstream vegetation has nearly recovered its former state
We thus consider as normal that the sediment transport estimations are either under or overestimated depending on the reference reach :it is related to the more or less strong sediment recruitment in the reach downstream of the confluence: if erosion and sediment recruitment is possible downstream of the confluence – as in 1971 – the sediment transport should approach Reach B estimations; conversely if measures prevents such sediment recruitment, Reach A estimations are closer from the upper-basin sediment supply.
In sum, the results are quite consistent with the empirical estimations and the historical flood and geomorphic effects; and the authors assume that it is an indirect proof of the correct assessment of the hydrology in this poor quality data environment, typical of small mountain torrential catchment.
5 Conclusion
Mountain stream hydrology studies are always challenging. The influence of relief on rainfalls, of land use, topography, geology on run-off and the co-existence of several possible flow types (debris-flows, bed-load laden flows, clear water floods) make discharge assessment complicated. In addition, the aggressive environment and destructive power of floods in these relatively low potential-damage areas (compared to lowland rivers threatening entire cities), make monitoring efforts too scarce and there is consequently a chronic lack of data concerning torrent hydrology (Poncet 1975).
On the contrary sediment traps and dredging operations are regularly implemented in torrential catchments. The measurements of dredged volumes may be used as an indirect proxy of the flood and annual high-flows hydrology.
An historical analysis has first been performed to gather as much data as possible concerning the past flood events in the catchment. A key step (D’Agostino 2013) that resulted in empirical estimation of sediment transports and in a better understanding of the 1971's extreme flood event features.
A geomorphology study of the whole catchment resulted in the choice of the measurement reaches: in the lower part of the main active branch (Reach A) and upstream of the sediment trap where the hydrology is strongly influence by the Roizette branch (Reach B). Profile geometry, slopes and grain size measurement have been done during this field survey.
A classical regional hydrology study has been performed in a third step to quantify: i) the annual high flows through flow-duration curves, paying attention to the natural geographic (inter-stations) and temporal (inter-annual) variabilities of discharges; and ii) floods peaks through a rainfalls-peak discharge regional
correlation, and finally iii) flood events using various flood durations and an equation to reconstruct complete hydrographs.
In a last step, sediment transport has been computed for all scenarios (Dry/Mean/Wet years, floods of 5/10/30/100-years' time return, with short/mean/long hydrograph duration). Two bedload computation methods have been used, based on recently developed methods (Recking 2013; Recking et al. 2016; Piton and Recking in prep.). It results in a confirmation that the bed armoring play a key role in sediment transport capacity and that this feature, quite typical in mountain torrents, must absolutely be taken into account. Using a simple method specifically dedicated to paved bed, the computed bed-load transport volumes are in a quite good agreement with the empirical estimations: which lead us to conclude to an indirect validation of the hydrology through the sediment transport data.
Acknowledgments
This study was funded by Irstea and the federative research structure VOR (Vulnératiblité des Ouvrages aux Risques) through the project " Le transit de la charge de fond dans les ouvrages torrentiels : quelles interactions entre barrages et flux sédimentaires?"' granted to EDYTEM (UMR 5204 CNRS) & IRSTEA. The authors would like to thank Elie LAMAND and Segolène MEJEAN who performed the field works and preliminary analysis, as well as the Isère ONF-RTM service for providing archive data.
6 References
Baldassarre, G. D., and A. Montanari. 2009. Uncertainty in river discharge observations: a quantitative analysis. Hydrology and Earth System Sciences 13:913–921.
Buffington, J. M., and D. R. Montgomery. 1999. Effects of hydraulic roughness on surface textures of gravel-bed rivers. Water Resources Research 35:3507–3521.
Carre, J., and O. Cayla. 2012. Analyse probabilistique régionale de la pluviométrie extrème en France métropolitaine. Pages 1–8 in SHF, editor. Congrès SHF : «Evènements extrêmes fluviaux et maritimes» Conf. Proc. SOGREAH, Paris.
Carré, J., and B. Fretti. 2010. Analyse et critique de la méthode Speed (Système probabiliste d’étude par évènements discrets). . SOGREAH.
CFGB. 1994. Les crues de projet des barrages: mèthode du GRADEX-Design flood determination by the GRADEX method. Bulletin du Comitè Français des Grands Barrages-18e Congrès CIGB/ICOLD:1–78.
Costa de Bastelica, M. 1874. Les torrents : leurs lois, leurs causes, leurs effets, moyens de les réprimer et de les utiliser, leur action géologique universelle. (J. Baudry, Ed.). . Librairie Polytechnique, Paris.
Culman, K. 1865. Rapport au Conseil Fédéral sur les torrents des Alpes Suisses inspectés en 1858 - 1859

E3S Web of Conferences 12
- 1860 et 1863. Page 590. . Impremrie L. Corbaz Co.
D’Agostino, V. 2013. Advances in Global Change Research. Pages 131–146 in M. Schneuwly-Bollschweiler, M. Stoffel, and F. Rudolf-Miklau, editors. Dating Torrential Processes on Fans and Cones. . Springer Netherlands.
Eaux et Forêts. 1911. Restauration et conservation des terrains en montagne. Restauration et conservation des terrains en montagne. Deuxième partie, Description sommaire des périmètres de restauration, Région des Alpes. (M. de l’agriculture - Direction générale des eaux et forêts, Ed.). . Imprimerie Nationale.
Fabre, J.-A. 1797. Essai sur la théorie des torrens et des rivières [Dissertation on the torrents and rivers theory]. (-, Ed.). . chez Bidault Libraire.
Gras, S. 1857. Etudes sur les torrents des Alpes [Dissertation on the Alps’ torrents]. Page 108 (Victor Dalmont, Ed.). . F.Savy, Paris.
Heede, B. H. 1985. Channel adjustments to the removal of log steps: an experiment in a mountain stream. Environmental Management 9:427–432.
Jail, M., and N. Martin. 1971. La trombe d’eau du 5 juillet 1971 dans la basse vallée de l’Isère. Revue de géographie alpine 59:593–600.
Kaitna, R., and J. Hübl. 2013. Advances in Global Change Research. Pages 111–130 in M. Schneuwly-Bollschweiler, M. Stoffel, and F. Rudolf-Miklau, editors. Dating Torrential Processes on Fans and Cones. . Springer Netherlands.
Lamand, E., G. Piton, and A. Recking. 2015. Hydrologie et hydraulique torrentielle, étude d’un cas pratique: la Roize. . IRSTEA.
Lane, E. W. 1955. Importance of fluvial morphology in hydraulic engineering. Journal of the Hydraulics Division of the American Society of Civil Engineers 81:1–17.
MA. 1982. Synthèse nationale sur les crues des petits bassins versants - fascicule 4 - étude des caractéristiques averses-crues. Ministère de l’Agriculture.
Mathys, N., M. Lang, E. Sauquet, T. Cipriani, and C. Peteuil. 2013. Torrents et Rivières de Montagne: dynamique et aménagement. Pages 81–138 in G. D. D. Richard A. Recking, editor. QUAE, Antony.
Mazzorana, B., J. Hübl, A. Zischg, and A. Largiader. 2011. Modelling woody material transport and deposition in alpine rivers. Natural Hazards 56:425–449.
Mazzorana, B., A. Zischg, A. Largiader, and J. Hübl. 2009. Hazard index maps for woody material recruitment and transport in alpine catchments. Natural Hazards and Earth System Science 9:197–209.
Melton, M. A. 1965. The geomorphic and paleoclimatic significance of alluvial deposits in southern Arizona. The Journal of Geology:1–38.
Montgomery, D. R., and J. M. Buffington. 1997. Channel-reach morphology in mountain drainage
basins. Geological Society of America Bulletin 109:596–611.
Peteuil, C., F. Liébault, and O. Marco. 2012. ECsTREM, a practical approach for predicting the sediment yield in torrents of the French Alps [ECsTREM, une approche pratique pour predire la production sedimentaire des torrents des Alpes Françaises]. Pages 293–304 INTERPRAEVENT Conference Proceedings.
Pilot, J. J. A. 1856. Recherches sur les inondations dans le vallée de l’Isère depuis 1219 jusqu’à nos jours. . Maisonville, Grenoble.
Pinhas. 1987. Etude de l’activité torrentielle de la Roize. . Office National des Forêts - Service Restauration des Terrains de Montagne - Service RTM de l’Isère.
Piton, G., and A. Recking. The concept of “travelling bedload” and its consequences for bedload computation of mountain streams: example of the Roize torrent. in prep.
Poncet, A. 1975. Réflexions sur la restauration des terrains en montagne pour une meilleure programmation. Revue Forestière Française XXVII:362–370.
Recking, A. 2013a. Simple method for calculating reach-averaged bed-load transport. Journal of Hydraulic Engineering 139:70–75.
Recking, A. 2013b. An analysis of nonlinearity effects on bed load transport prediction. Journal of Geophysical Research: Earth Surface 118:1–18.
Recking, A. 2014. Relations between bed recharge and magnitude of mountain streams erosions. Journal of Hydro-Environment Research 8:143–152.
Recking, A., G. Degoutte, B. Camenen, and P. Frey. 2013. Torrents et rivières de montagne: Dynamique et aménagement. Pages 126–192 in A. Recking, D. Richard, and G. Degoutte, editors. Editions Quae, Antony.
Recking, A., P. Leduc, F. Liébault, and M. Church. 2012a. A field investigation of the influence of sediment supply on step-pool morphology and stability. Geomorphology 139-140:53–66.
Recking, A., F. Liébault, C. Peteuil, and T. Jolimet. 2012b. Testing bedload transport equations with consideration of time scales. Earth Surface Processes and Landforms 37:774–789.
Recking, A., G. Piton, D. Vázquez-Tarrío, and G. Parker. 2016. Quantifying the morphological print of bedload transport. Earth Surface Processes and Landforms.
Rickenmann, D. 2001. Comparison of bed load transport in torrents and gravel bed streams. Water resources research 37:3295–3305.
Rickenmann, D., A. Badoux, and L. Hunzinger. 2015. Significance of sediment transport processes during piedmont floods: The 2005 flood events in Switzerland. Earth Surface Processes and Landforms.
Rickenmann, D., and A. Koschni. 2010. Sediment loads due to fluvial transport and debris flows during the 2005 flood events in Switzerland. Hydrological Processes 24:993–1007.

FLOODrisk 2016 - 3rd European Conference on Flood Risk Management 13
Rickenmann, D., and A. Recking. 2011. Evaluation of flow resistance in gravel-bed rivers through a large field data set. Water Resources Research 47:1–22.
RTM38. 2006. Commune de Voreppe - torrent de la Roize - analyse des risques liés aux transports solides par charriage dans la traversée de Voreppe. . Office National des Forêts - Service Restauration des Terrains de Montagne - Service RTM de l’Isère.
RTM38. 2009. Torrent de la Roize - Division domaniale de Voreppe / Pommiers la Placette. . Office National des Forêts - Service Restauration des Terrains de Montagne - Service RTM de l’Isère.
Wohl, E. 2006. Human impacts to mountain streams. Geomorphology 79:217–248.
Wolman, M. G. 1954. A method of sampling coarse bed material. Transactions of American Geophysical Union 35:951–956.
Yu, G., Z. -y. Wang, K. Zhang, T. -c. Chang, and H. Liu. 2009. Effect of incoming sediment on the transport rate of bed load in mountain streams. International Journal of Sediment Research 24:260–273.