this research is intended to provide more data, in conjunction … · · 2018-02-07overview of...
TRANSCRIPT

1
1. Introduction
1.1 Ammonia Issues in the Chesapeake Bay
The Clean Water Act of 1977 requires the Environmental Protection Agency
(EPA) to publish water quality criteria that reflect the latest scientific knowledge on the
effects of pollutants in a body of water. Fulfilling this requirement, the EPA published the
Ambient Aquatic Life Water Quality Criteria for Ammonia (Saltwater) – 1989 [1], herein
referred to simply as the Criteria. This document proposes criteria to be used as a guide in
assisting the states in setting discharge standards. Two standards are presented in the
Criteria: 1) The acute criterion, which is the one-hour average concentration not to be
exceeded more than once every three years. 2) The chronic criterion, which is a four-day
average concentration not to be exceeded more than once every three years. The
procedures for deriving these criteria are described in “Guidelines for Deriving Water
Quality Criteria for the Protection of Aquatic Organisms and Their Uses” [2], herein
referred to as the Guidelines.
The acute criterion was established at 0.233 mg/L as unionized ammonia. It is
based on 21 species from 18 genera (See Table 4.2). The Genus Mean Acute Value
(GMAV) for the four most sensitive species was used to calculate the acute criterion. The
chronic criterion was established at 0.035 mg/L as unionized ammonia. It is based on
acute-chronic ratios for two marine and four saltwater organisms (See Table 4.3). At the
time the Criteria was published, chronic data for saltwater species were only available for
the Mysid Shrimp and Inland Silverside.
2
This research is intended to provide more data, in conjunction with research
performed by Li [3] and Hudgins [4], so that the criteria may be reevaluated.
1.2 Ammonia in Recirculating Aquaculture
Aquaculture has gained importance in recent years as traditional fishing grounds
have become depleted due to overfishing. In recirculating aquaculture, the water is
constantly being recycled through some type of treatment process, often filtration,
aeration, settling, or biological filtering [5]. Recirculating aquaculture offers many
advantages over flow-through systems. First, it uses much less water, so sites that don’t
have an adequate supply of water for a flow-through system can be used. Second, energy
savings could be significant if the water supply must be treated (e.g. heating) [5]. Even
though the water is treated, ammonia can build up in a recirculating system and cause
toxicity [5]. Ammonia is a by-product of the metabolic processes of the organisms being
cultured and of the breakdown of organic nitrogen [5]. Toxicity data can be used to
establish guidelines of acceptable ammonia concentrations in aquaculture.
2. Overview of Ammonia in the Aquatic Environment
2.1 The Nitrogen Cycle
The Nitrogen Cycle is one of the major biogeochemical cycles of the biosphere
[6]. Earth’s atmosphere is almost 80% nitrogen gas (N2), however plants can’t use it in
this form. Therefore, the nitrogen cycle is critical to life on earth. The major processes are
illustrated in Figure 2.1 and are described below. They are:
3
-Fixation
-Ammonification
-Nitrification
-Denitrification
-Assimilation
Fixation occurs by free-living bacteria, symbiotic bacteria in the root nodules of
legumes (Rhizobium), blue-green algae in the aquatic environment, and by industry,
especially fertilizer producers [6]. Nitrogen fixation is especially important since most
plants and all animals can’t use it in its molecular form (N2). However, excess fixation
and concentration of fixed nitrogen can have deleterious environmental effects such as
accelerated ammonia toxicity, which is discussed in this report, and eutrophication of
lakes [6]. Fixation requires energy. The reduction of one molecule of N2 to NH3 requires
about the same amount of energy that is released by the reduction of an atom of organic
carbon to CO2 [7]. On a global scale, nitrogen fixation roughly balances production of N2
by denitrification and fluxes amount to approximately 2% of the total cycling of nitrogen
through the biosphere [7].
Ammonification is the process by which organic nitrogen is decomposed back to
ammonia (NH3). It is carried out by many species of bacteria and eukaryotes [6]. During
ammonification the energy potential of the nitrogen atom doesn’t change [7].
Nitrification is the process by which nitrogen is oxidized from ammonia to nitrite
(NO2) and nitrite is oxidized from nitrite to nitrate (NO3) [7]. Both steps release much of
the potential chemical energy stored in the nitrogen atom [7]. The transformation from
ammonia to nitrite is carried out by Nitrosomonas in the soil and freshwater systems and

4
by Nitrosococcus in marine systems [7]. The transformation from nitrite to nitrate is
carried out by Nitrobacter in the soil and freshwater systems and by Nitrosococcus in
marine systems [7].
Denitrification occurs in anoxic environments. In these environments, where
oxygen is not present to serve as an electron acceptor, nitrate and nitrite may become
electron acceptors [7]. When nitrate is the electron acceptor, it forms nitrite. When nitrite
is the electron acceptor, it forms nitric oxide (NO) which is then transformed to nitrogen
gas by physical processes [7]. Bacteria such as Pseudomonas denitrificans accomplish
the denitrification reactions
Assimilation is the process by which nitrate is reduced to organic nitrogen.
Assimilation requires energy, however, it is required for many organic molecules [6].
Animals can not assimilate nitrate to organic nitrogen and must eat plants to acquire their
organic nitrogen [6].
Figure 2.1- The Nitrogen Cycle
Denitrification
NitrificationNitrsomonasNitroscoccus
Nitrogen FixationRhizobium, AzobacterBlue-green Algae and Industry
Nitrate
Ammonia
NitriteOrganic-N
AtmosphericN
Assimilation
Denitrification
Ammonification
NitrificationNitrsosbacterNitroscoccus

5
2.2 Ammonia Chemistry in Water
Ammonia is present in the aqueous environment in two forms, unionized
ammonia (NH3), and ionized ammonium (NH4+). They exist in equilibrium represented
by the equation:
NH4+ + H2O ↔ NH3 + H3O
+ Eq. 2.1
It is important to know the relative amounts of NH3 and NH4+ because they
exhibit different toxicities, with NH3 being much more toxic [8]. In fact, current ammonia
regulations are written in terms of NH3 [1]. It is necessary to know the physical
parameters that determine the relative proportions of NH3 and NH4+ because current
measurement techniques only measure total ammonia [9]. This section will discuss the
major physical parameters that determine these proportions; pH, temperature, and
salinity, and will briefly discuss other parameters that have minor effects; carbon dioxide,
dissolved oxygen, and alkalinity.
2.2.1 pH
At 250C and no salinity, the ionization constant is given as:
Ka= ][NH
]][H[NH
4
3+
+
= 10-9.2 Eq. 2.2 [1]
As can be seen from equation 2.2, the hydrogen ion concentration and thus the pH
determine the proportion of NH3. As the pH increases, the hydrogen ion concentration
decreases, and the proportion of unionized ammonia increases. From equation 2.2, the
equation for the percent of total ammonia in the unionized form can be derived as;
%-unionized ammonia = 100/(1+antilog (pKa-pH)) Eq. 2.3

6
At the pHs acceptable to most aquatic life, 6.5-8.5, a small increase in pH can
greatly affect the %-unionized ammonia as seen in Table 2.1.
Table 2.1 - %-unionized ammonia at 250C at various pHs
pH 6.5 7.0 7.5 8.0 8.5%-unionized ammonia 0.180 0.566 1.77 5.38 15.3
From this data, it can be seen that an increase of pH by 1 unit roughly corresponds to
a ten-fold increase in the %-unionized ammonia. The strong dependence of %-unionized
ammonia on pH has two important consequences:
1. The pH of the receiving stream is extremely important when discussing ammonia
effects in the environment.
2. Strict pH control of experimental bioassays must be exercised to obtain useful data.
2.2.2 Temperature
Emerson et al. [10] determined temperature effects the ionization constant for
aqueous ammonia follows the equation:
pKa = 0.0918 + 2729.92/T Eq. 2.4
Where T is degrees Kelvin.
From this equation, it is apparent that an increase in temperature will increase the
%-unionized ammonia. Table 2.2 lists the values for the ionization constant and the %-
unionized ammonia at several different temperatures
7
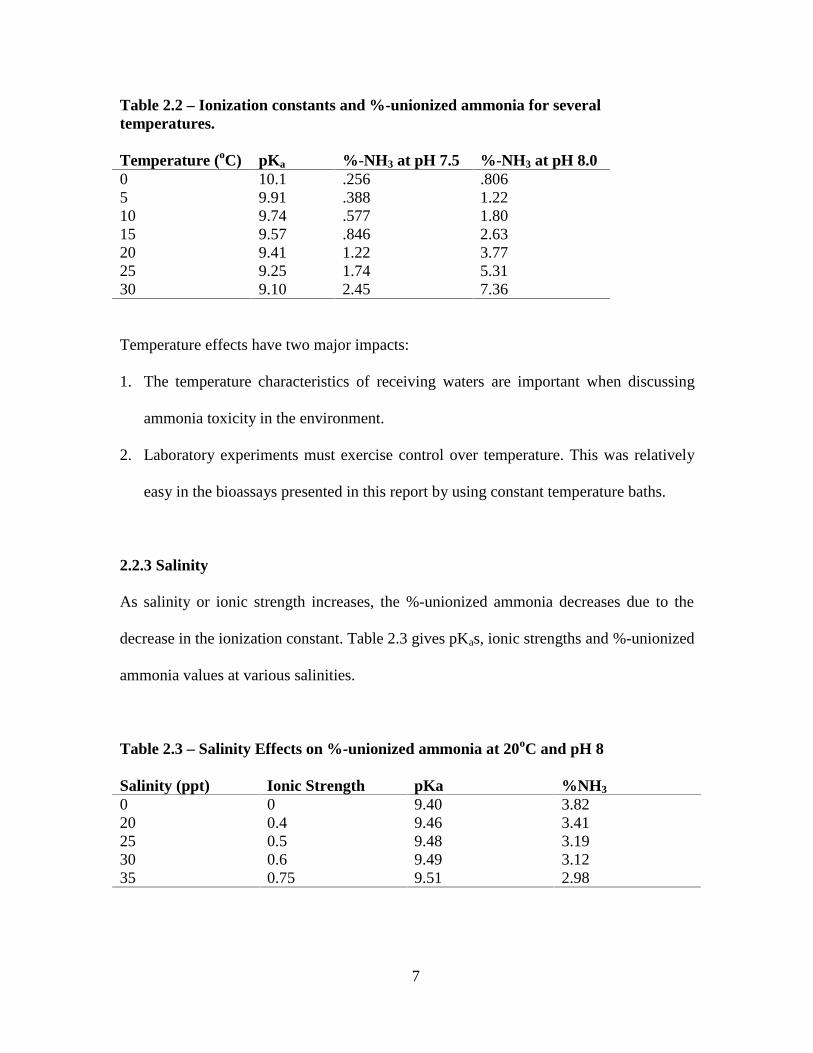
Table 2.2 – Ionization constants and %-unionized ammonia for severaltemperatures.
Temperature (oC) pK a %-NH 3 at pH 7.5 %-NH3 at pH 8.0051015202530
10.19.919.749.579.419.259.10
.256
.388
.577
.8461.221.742.45
.8061.221.802.633.775.317.36
Temperature effects have two major impacts:
1. The temperature characteristics of receiving waters are important when discussing
ammonia toxicity in the environment.
2. Laboratory experiments must exercise control over temperature. This was relatively
easy in the bioassays presented in this report by using constant temperature baths.
2.2.3 Salinity
As salinity or ionic strength increases, the %-unionized ammonia decreases due to the
decrease in the ionization constant. Table 2.3 gives pKas, ionic strengths and %-unionized
ammonia values at various salinities.
Table 2.3 – Salinity Effects on %-unionized ammonia at 20oC and pH 8
Salinity (ppt) Ionic Strength pKa %NH 3
020253035
00.40.50.60.75
9.409.469.489.499.51
3.823.413.193.122.98

8
As can be seen from the table, an increase in salinity by about 10 parts per
thousand (ppt) decreases the %-unionized ammonia by ~0.3%. Data on the salinity of
receiving waters is important when discussing the toxicity of ammonia in the
environment. In laboratory bioassay conditions, salinity is not a difficult to control,
however good records of salinity are important so that the %-unionized ammonia can be
accurately determined.
2.2.4 Other Factors (Carbon Dioxide, Dissolved Oxygen, and Alkalinity)
Carbon dioxide, dissolved oxygen, and alkalinity are minor factors that influence
the %-unionized ammonia. Alkalinity and carbon dioxide affect the %-unionized
ammonia indirectly by affecting the pH of the water. Increasing the concentration of
carbon dioxide in water increases the hydrogen concentration, which decreases the %-
unionized ammonia. Alkalinity works in conjunction with carbon dioxide in determining
pH. An increase in dissolved oxygen may increase the toxicity of ammonia. This is
related to the fact that one of the acute effects of ammonia intoxication is hypoxia.
Alabaster et al. [11] showed that at dissolved oxygen levels 50% below saturation,
survival times were reduced for several fish species exposed to lethal doses of ammonia.
However, no work has been done to study the affects of dissolved oxygen on sublethal
concentrations of ammonia.

9
3 Ammonia Toxicity
3.1 National Criteria
Two different criteria are present in the criteria; the acute criterion and the chronic
criterion. Methods for determining the data are presented in the Guidelines [2]. The
method for determining each is discussed below followed by what each criterion means
and then how effluent limits are determined based on the criterion. Figure 3.1 offers a
schematic representation of how the endpoints are used to derive each criterion.
Figure 3.1 Schematic Representation of Derivation of the Acute and Chronic Criteria
96-hr LC50 48-hr LC50 7-day NOEC 7-day LOEC
Acute valueSpecies MeanAcute Value
Acute criterion
Chronic Value
Acute-chronic ratio
Chronic criterion
Final Acute Value
10
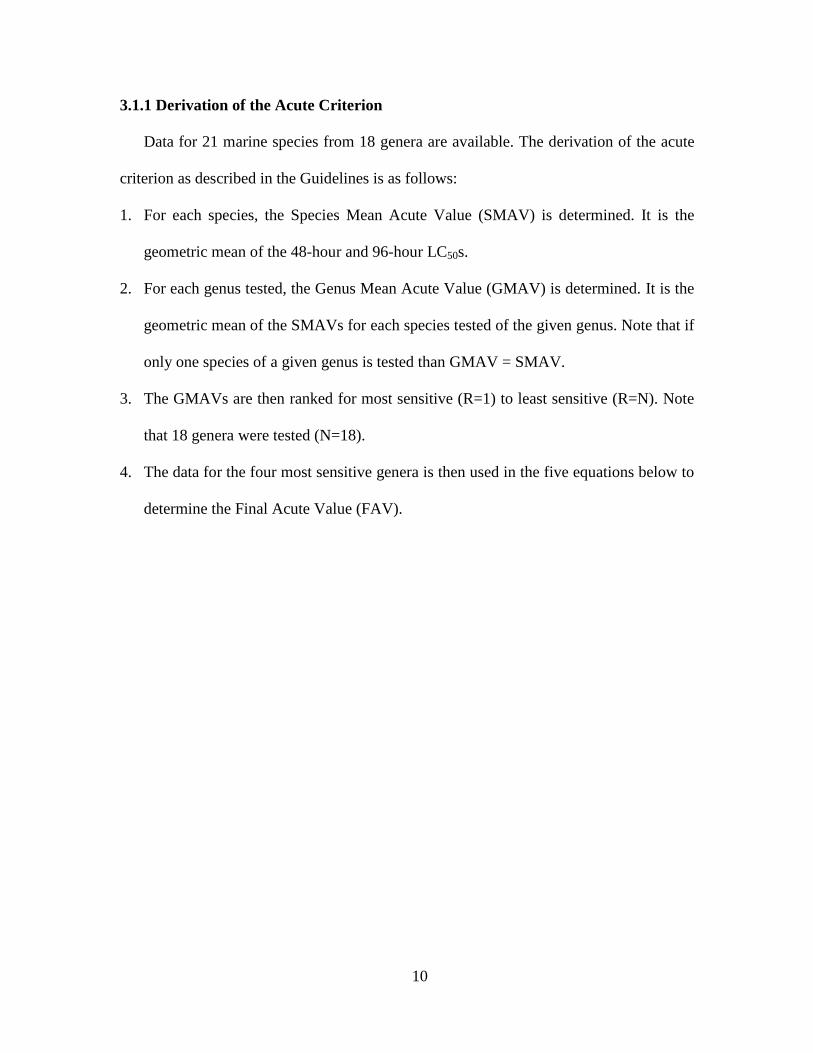
3.1.1 Derivation of the Acute Criterion
Data for 21 marine species from 18 genera are available. The derivation of the acute
criterion as described in the Guidelines is as follows:
1. For each species, the Species Mean Acute Value (SMAV) is determined. It is the
geometric mean of the 48-hour and 96-hour LC50s.
2. For each genus tested, the Genus Mean Acute Value (GMAV) is determined. It is the
geometric mean of the SMAVs for each species tested of the given genus. Note that if
only one species of a given genus is tested than GMAV = SMAV.
3. The GMAVs are then ranked for most sensitive (R=1) to least sensitive (R=N). Note
that 18 genera were tested (N=18).
4. The data for the four most sensitive genera is then used in the five equations below to
determine the Final Acute Value (FAV).

11
P = R/(N+1) Eq. 3.1
∑ ∑∑ ∑
−−
=/4))P((P
/4)(ln(GMAV))())((ln(GMAV)S
22 Eq. 3.2
4
)P(S((ln(GMAV))(L ∑ ∑−
= Eq. 3.3
L)0.05S(A += Eq. 3.4
AeFAV = Eq. 3.5
Table 3.1 Calculations for each of the terms to determine the acute criterion
Species GMAV ln(GMAV) ln(GMAV)2 R P PWinter Flounder 0.492 -0.709 0.503 1 0.053 0.229Red Drum 0.545 -0.607 0.368 2 0.105 0.324Sargassum Shrimp 0.773 -0.257 0.066 3 0.158 0.397Prawn 0.777 -0.252 0.064 4 0.211 0.459Σ -1.83 1.00 0.526 1.41
∑ ∑∑ ∑
−−
=/4))P((P
/4)(ln(GMAV))())((ln(GMAV)S
22 = 5.74 Eq. 3.6
4
)P(S((ln(GMAV))(L ∑ ∑−
= = -1.30 Eq. 3.7
L)0.05S(A += = -0.765 Eq. 3.8
AeFAV = =0.465 Eq. 3.9
5. Finally, the acute criterion is FAV/2, which yields a value of 0.233 mg/L (unionized
ammonia).

12
3.1.2 Derivation of the Chronic Criterion
Acute-chronic ratios are used to define the chronic criterion. The acute-chronic ratio
is determined in the following way [2]:
1. The geometric mean of the chronic no observed effect concentration (NOEC) and the
lowest observed effect concentration (LOEC) is calculated. This is the chronic value.
2. The acute-chronic ratio is the ratio of the 48-hour LC50, also known as the acute
value, and the chronic value.
At the time the criteria were published, acute-chronic ratios were available for two
saltwater (Inland silverside Menidia berrylina, and the Mysid, Mysidopsis bahia.) and ten
freshwater species [1]. The chronic criterion was developed based on the two saltwater
species as well as four freshwater species due to the limited data on saltwater species.
U.S.EPA developed the chronic criterion based on the following three conclusions that it
made [1]:
1. Acute-chronic ratios of freshwater species appear to increase with decrease in pH.
2. Data on the effects of temperature on the ratios are lacking.
3. Acute-chronic ratios for the most acutely and chronically sensitive species are
technically more applicable when trying to define concentrations chronically
acceptable to acutely sensitive species.
Based on these conclusions, mean acute-chronic ratios were selected from freshwater
tests whose chronic sensitivity was less than or equal to the median conducted at pH less
than 7.7. Toxicity data for the species used to derive the chronic criterion is listed in
Table 3.2.

13
Table 3.2 Toxicity data of species used to determine saltwater chronic criterion.
Acute Value(mg/L)
Chronic Value(mg/L)
Acute-ChronicRatio
Saltwater species
MysidMysidopsis bahiaInland SilversideMenidia beryllina
1.70
1.30
0.232
0.061
7.2
21.3
Freshwater Species
Channel CatfishIctalurus punctatusFathead MinnowPimephales promelasBluegill SunfishLepomis marchirudRainbow TroutSalmo gairdneri
-*
2.55
1.08
0.422
-*
0.13
0.926
0.0311
10.0*
20
12
14
* Acute-chronic ratio is a composite of several studies.
To derive the chronic criterion, the final acute value, 0.465 mg/L is divided by the
geometric mean of these six acute-chronic ratios, 13.1, which yields a chronic criterion of
0.035 mg/L.
3.1.3 Regulatory implications of the acute and chronic criterion
The acute criterion is defined as the one-hour average concentration that should
not be exceeded more than once every three years and the chronic criterion is defined as
the four-day average concentration that cannot be exceeded more than once every three
years. For a specific site, the total ammonia discharged is related to the 90th percentile pH
and temperature and the average salinity. Site-specific numbers can then be determined
for the purpose of NPDES permitting.

14
3.2 Routes of Exposure and Mechanisms of Ammonia Toxicity
Hudgins [4] previously presented detailed analysis of existing data concerning the
routes of exposure and mechanisms of ammonia toxicity. This section will summarize his
analysis and highlight some studies that have occurred since his theses.
3.2.1 Routes of Entry, Absorption, and Excretion
Unionized ammonia is the toxic form of ammonia to aquatic life because it can
most readily gain entry to aquatic organisms. The predominant route of entry for
ammonia is the gills for both vertebrates and invertebrates. This is because the un-ionized
ammonia molecules can readily pass through the cell membranes at the gill surface. The
neutral form is soluble in the lipid segments of the cell membrane and need only rely on
diffusion. [12]. Diffusion of ionized ammonia is extremely slow through cell membranes
due to its charge. It occurs as a large hydrated and charged entity, which can not pass
through the charge-lined micropores of the hydrophobic membrane components. Several
active transport mechanisms have been proposed to transport ammonium through the cell
membrane. Ammonium is transported into the cell at the binding site of ionized
potassium (K+) because it has the same ionic radius. However, even with these active
transport mechanisms, passive diffusion of unionized ammonia is the dominant route of
entry [13].
In most fish, ammonia is the major form of nitrogen excretion. It’s mainly
excreted from the gills. Goldstein et al. [14] found that ammonia was excreted chiefly in
the ionized form. They postulated that ammonium is excreted by NH4+-Na+ exchange
mechanisms.
15
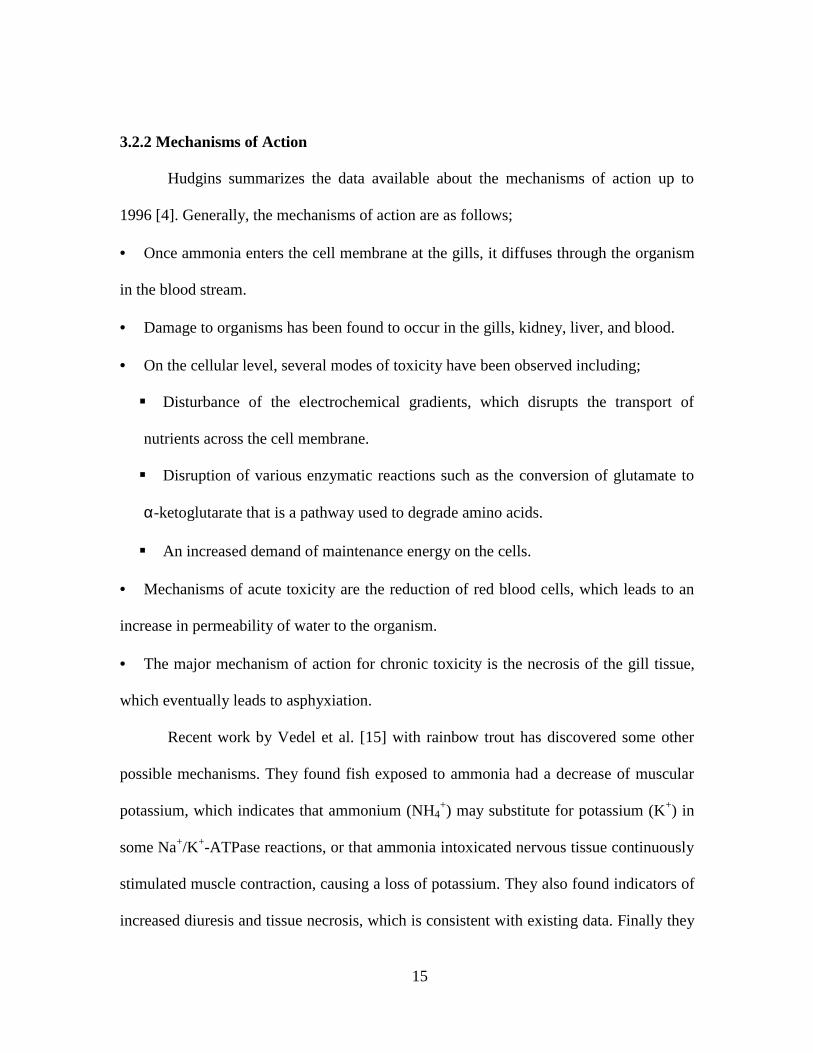
3.2.2 Mechanisms of Action
Hudgins summarizes the data available about the mechanisms of action up to
1996 [4]. Generally, the mechanisms of action are as follows;
• Once ammonia enters the cell membrane at the gills, it diffuses through the organism
in the blood stream.
• Damage to organisms has been found to occur in the gills, kidney, liver, and blood.
• On the cellular level, several modes of toxicity have been observed including;
� Disturbance of the electrochemical gradients, which disrupts the transport of
nutrients across the cell membrane.
� Disruption of various enzymatic reactions such as the conversion of glutamate to
α-ketoglutarate that is a pathway used to degrade amino acids.
� An increased demand of maintenance energy on the cells.
• Mechanisms of acute toxicity are the reduction of red blood cells, which leads to an
increase in permeability of water to the organism.
• The major mechanism of action for chronic toxicity is the necrosis of the gill tissue,
which eventually leads to asphyxiation.
Recent work by Vedel et al. [15] with rainbow trout has discovered some other
possible mechanisms. They found fish exposed to ammonia had a decrease of muscular
potassium, which indicates that ammonium (NH4+) may substitute for potassium (K+) in
some Na+/K+-ATPase reactions, or that ammonia intoxicated nervous tissue continuously
stimulated muscle contraction, causing a loss of potassium. They also found indicators of
increased diuresis and tissue necrosis, which is consistent with existing data. Finally they

16
found an increase in glutamine concentration and a decrease of glutamate concentration
in the brain. This was thought to be due to the detoxification reaction:
++ ++→++ HADPGlutamineATPNHGlutamate 4
The resulting decrease of brain glutamate may be a problem for fish because it is
thought to be a neurotransmitter in the brain.
4 Previous Toxicity Tests
Li [3] and Hudgins [4] reviewed the literature on acute and chronic toxicity tests
published up to 1996. This section will summarize their reviews, add their data into the
review and add literature published since 1996 and up to the present. More freshwater
than saltwater species have been tested in every category, acute vertebrate and
invertebrate tests and chronic vertebrate and invertebrate tests. The current criteria for
ammonia in marine environments are currently based on saltwater and freshwater
organisms because of the lack of data for saltwater organisms. This summary will consist
of the following sections:
Acute Toxicity Data in Freshwater and Saltwater Species
Chronic Toxicity Data in Freshwater and Saltwater Species
Comparisons with Freshwater and Saltwater Species
4.1 Acute Toxicity Data in Freshwater and Saltwater Species
Li’s thesis summarizes the results of 60 freshwater and 21 saltwater species that
had been tested up to her thesis. Since then, no other acute data is available except Li [3]

17
and Hudgins [4] on marine organisms. One study was done on the freshwater Pale Chub
(Zacco Platypus) [16], however this organism is native only to waters of Japan, Korea
and China and the endpoints they used were not standard 96-hour and 48-hour LC50s, so
they are excluded.
4.1.1 Freshwater Fish and Invertebrates
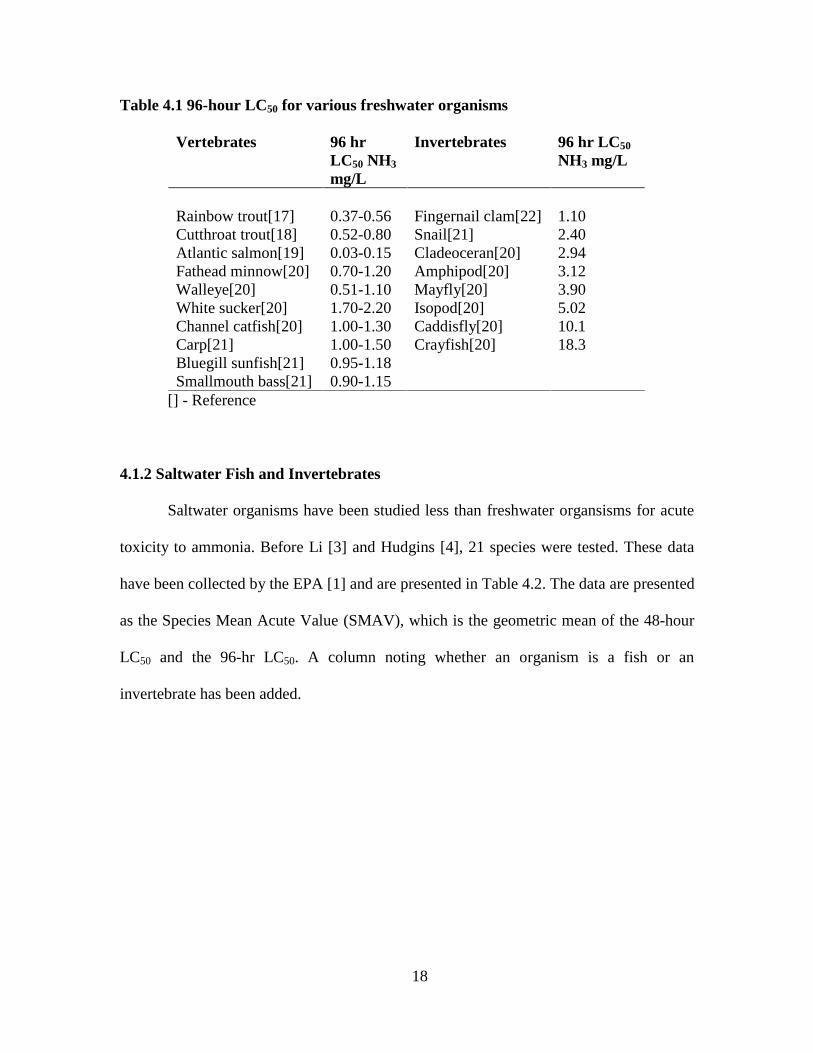
Table 4.1 lists 96-hour acute LC50s for several vertebrates and invertebrates with
references listed in brackets. The data are given in terms of mg/L of unionized ammonia.
Several generalizations can be made about the acute toxicity of ammonia to freshwater
organisms:
• Salmonids are the most sensitive (salmon and trout), while cyprinid fish ( carp,
minnow and dace are the least sensitive fish.
• Of the fresh water invertebrates, crayfish are the most sensitive and clams are the
most tolerant.
• Invertebrates are more tolerant that vertebrates by a factor of about 2-3. For this
reason, the freshwater regulations are based on fish.
• Sensitivity to ammonia is greater in egg and larval stages of fish than in saltwater
organisms.
18
Table 4.1 96-hour LC50 for various freshwater organisms
Vertebrates 96 hrLC50 NH3
mg/L
Invertebrates 96 hr LC50
NH3 mg/L
Rainbow trout[17]Cutthroat trout[18]Atlantic salmon[19]Fathead minnow[20]Walleye[20]White sucker[20]Channel catfish[20]Carp[21]Bluegill sunfish[21]Smallmouth bass[21]
0.37-0.560.52-0.800.03-0.150.70-1.200.51-1.101.70-2.201.00-1.301.00-1.500.95-1.180.90-1.15
Fingernail clam[22]Snail[21]Cladeoceran[20]Amphipod[20]Mayfly[20]Isopod[20]Caddisfly[20]Crayfish[20]
1.102.402.943.123.905.0210.118.3
[] - Reference
4.1.2 Saltwater Fish and Invertebrates
Saltwater organisms have been studied less than freshwater organsisms for acute
toxicity to ammonia. Before Li [3] and Hudgins [4], 21 species were tested. These data
have been collected by the EPA [1] and are presented in Table 4.2. The data are presented
as the Species Mean Acute Value (SMAV), which is the geometric mean of the 48-hour
LC50 and the 96-hr LC50. A column noting whether an organism is a fish or an
invertebrate has been added.

19
Table 4.2 Acute data for saltwater fish and invertebrates [1]Rank Fish (F)/
Invert.(I)
Species SMAV(mg/L)
pHRange
Temp.Range(oC)
Salinity(ppt)
1
2
3
4
5
6
7
8
9
10
11
12
13
14
15
16
17
18
19
20
21
F
F
F
I
I
I
F
I
I
F
F
F
F
I
F
I
F
F
I
I
I
Striped Bass (Moronesaxatilis)Winter Flounder (Pseudo-pleuronectes americanus)Red Drum (Sciaenopsocellatus)Sargassum Shrimp(Latreutes fucorum)Prawn (Macro-brachiumrosenbergii)Copepod (Eucalanuspileatus)Planehead filefish(Monocanthus hispidus)Copepod (Eucalanuselongatus)Mysid* (Mysidopsisbahia)Spot (Leiostomusxanthurus)Atlantic Silverside*(Menidia menidia) Inland Silverside(Menidia beryllina)Striped Mullet (Mugilcephalus)Ghost Shrimp*(Palaemonetes pugio)White Perch (Moroneamericana)Lobster (Homarusamericanus)Sheepshead Minnow*(Cyprinodon variegatus)Three-spined stickleback(Gasterosteus aculeatus)Brackish water clam(Rangia cuneata)Quahog Clam(Mercenaria mercenaria)Eastern Oyster(Crassostrea virginica)
0.481
0.492
0.545
0.773
0.777
0.793
0.826
0.867
1.02
1.04
1.05
1.32
1.54
1.65
2.13
2.21
2.73
2.93
3.08
5.36
19.1
7.2-8.1
7.9-8.1
8.0-8.2
8.07
6.8-8.3
8.2
8.07
8.0
7.0-9.2
7.92
7.0-9.0
7.1-9.1
7.99
7.9-8.1
8.0
8.1
7.6-8.1
7.6
7.95
7.7-8.2
8.0
15-23
7.5
25-26
23.4
28
20.5
23.4
20.3
19-26
20.4
11-25
18-26
21
19-20
16
21.9
10-33
15-23
20.2
20
20
5-34
31
28-30
28
12
34
28
34
10-31
9.3
10-30
11-33
10
10-28
14
33.4
10-33
11-34
9.2
27
27
* Additional work performed by Hudgins and Li
20
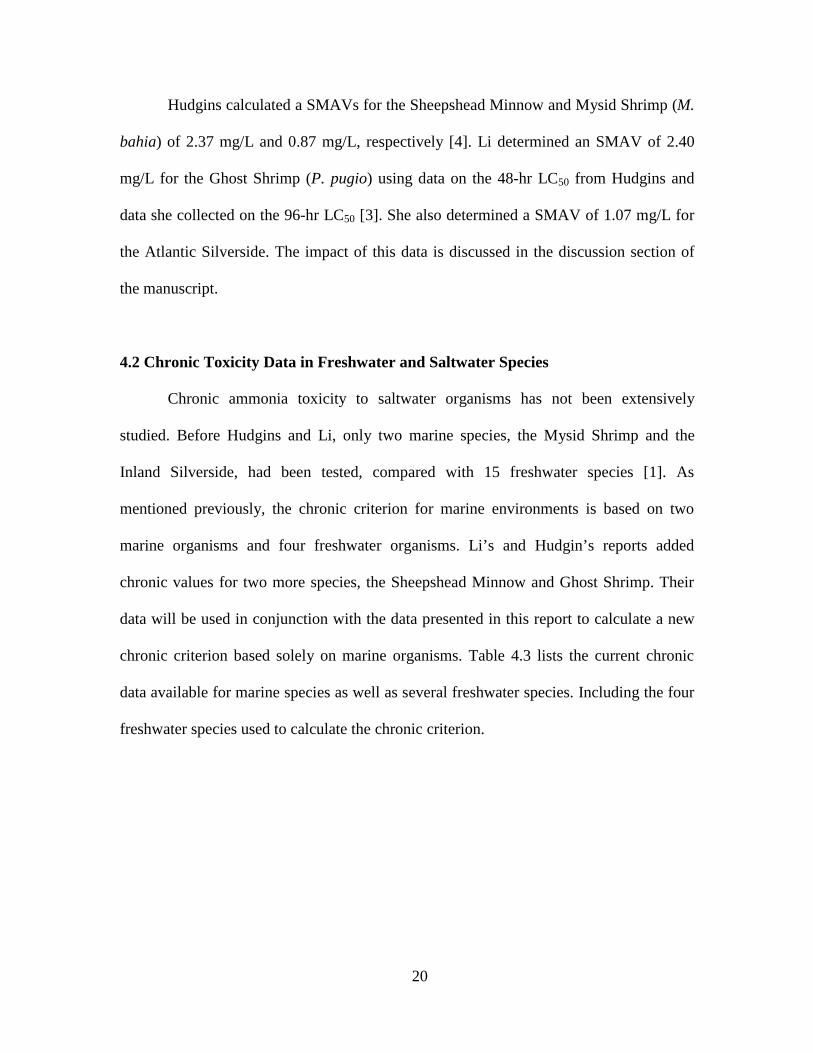
Hudgins calculated a SMAVs for the Sheepshead Minnow and Mysid Shrimp (M.
bahia) of 2.37 mg/L and 0.87 mg/L, respectively [4]. Li determined an SMAV of 2.40
mg/L for the Ghost Shrimp (P. pugio) using data on the 48-hr LC50 from Hudgins and
data she collected on the 96-hr LC50 [3]. She also determined a SMAV of 1.07 mg/L for
the Atlantic Silverside. The impact of this data is discussed in the discussion section of
the manuscript.
4.2 Chronic Toxicity Data in Freshwater and Saltwater Species
Chronic ammonia toxicity to saltwater organisms has not been extensively
studied. Before Hudgins and Li, only two marine species, the Mysid Shrimp and the
Inland Silverside, had been tested, compared with 15 freshwater species [1]. As
mentioned previously, the chronic criterion for marine environments is based on two
marine organisms and four freshwater organisms. Li’s and Hudgin’s reports added
chronic values for two more species, the Sheepshead Minnow and Ghost Shrimp. Their
data will be used in conjunction with the data presented in this report to calculate a new
chronic criterion based solely on marine organisms. Table 4.3 lists the current chronic
data available for marine species as well as several freshwater species. Including the four
freshwater species used to calculate the chronic criterion.

21
Table 4.3 – Chronic values for various saltwater and freshwater organisms
Freshwater speciesChronic valuemg/L NH3 Saltwater Species
Chronic valuemg/L NH3
Channel Catfish a
(Ictalurus punctatus)Fathead Minnow a
(Pimephales promelas)Bluegill Sunfish a
(Lepomis macrchirud)Rainbow Trout a (Salmogairdneri)
0.25
0.13
0.09
0.03
Mysid a (Mysidopsisbahia)Inland Silverside a
(Meninidia berillina)Sheephead Minnow b
(Cyprinodonvariegatus)Ghost Shrimp c
(Paleomentes pugio)
0.23
0.06
0.39
0.46
a Species used to determine chronic criterion by EPA [1]b Additional work by Hudgins [4]c Additional work performed by Li [3]
In addition to their data, Person-Le Ruyet et al. [23] studied the chronic toxicity of
ammonia to juvenile turbot, Scophthalmus maximus. They did not, however, present their
data in terms of standard endpoints so it is difficult to integrate it into the chronic criteria.
Nevertheless, the data is useful to review. Juvenile turbots of three sizes were observed
for 4-6 weeks to determine the effects of ammonia on survival, growth, feeding, and
physiological status. 28-day LC50s were observed to be 0.8 mg/L, 1 mg/L, and 1.1 mg/L
for 13 g, 22 g, and 104 g fish, respectively. For growth, the larger turbot were more
sensitive. The 14-day Lowest Observed Effect Concentration (LOEC) were 0.21 mg/L
and 0.40 mg/L for 23 g and 14 g fish, respectively. The 34-day LOEC for 104 g fish was
0.09 mg/L. Food uptake experiments indicated that consumption decreased with
increased ammonia concentration, however food usage efficiency was not affected.
Physiologically, large turbot were more sensitive that small ones.
22
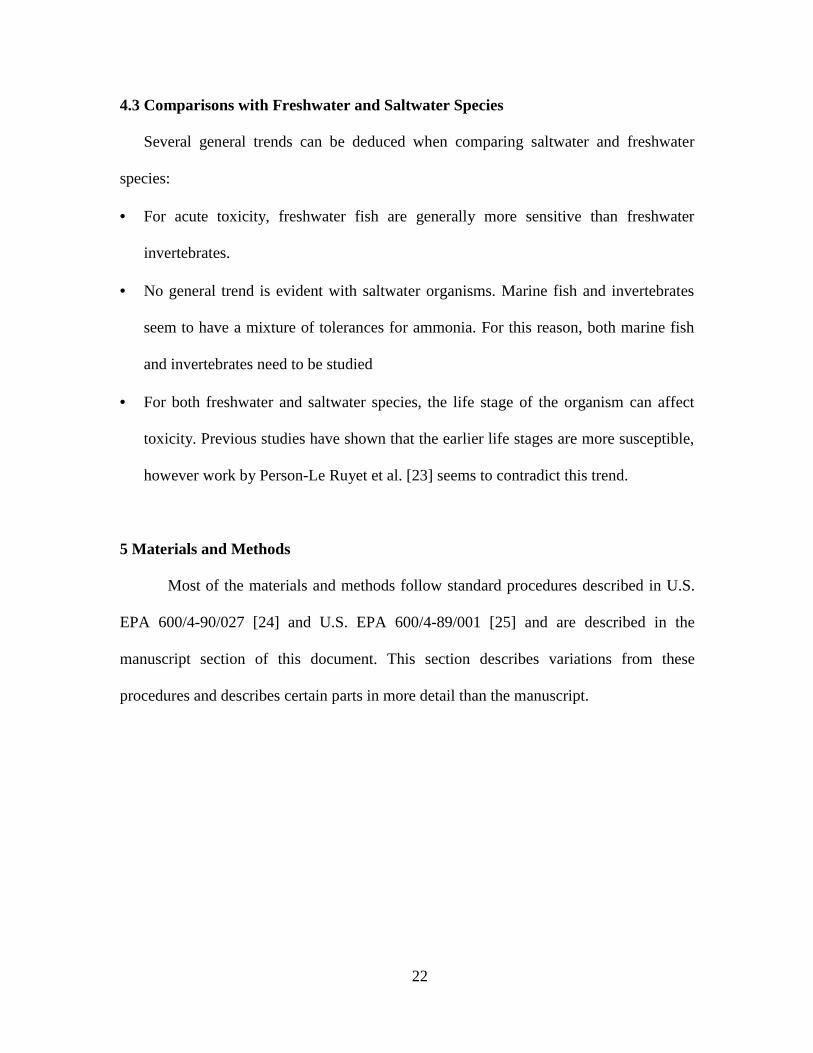
4.3 Comparisons with Freshwater and Saltwater Species
Several general trends can be deduced when comparing saltwater and freshwater
species:
• For acute toxicity, freshwater fish are generally more sensitive than freshwater
invertebrates.
• No general trend is evident with saltwater organisms. Marine fish and invertebrates
seem to have a mixture of tolerances for ammonia. For this reason, both marine fish
and invertebrates need to be studied
• For both freshwater and saltwater species, the life stage of the organism can affect
toxicity. Previous studies have shown that the earlier life stages are more susceptible,
however work by Person-Le Ruyet et al. [23] seems to contradict this trend.
5 Materials and Methods
Most of the materials and methods follow standard procedures described in U.S.
EPA 600/4-90/027 [24] and U.S. EPA 600/4-89/001 [25] and are described in the
manuscript section of this document. This section describes variations from these
procedures and describes certain parts in more detail than the manuscript.

23
5.1 Morphology, taxonomy and life history of test organisms
5.1.1 Quahog Clam
The Quahog Clam, Mercinaria mercenaria, ranges from the Gulf of Mexico to
Cape Cod. It inhabits intertidal to sub-tidal zones down to 60 feet. Its habitat varies from
sandy to muddy sand bottoms. It is usually found at salinities above 15 ppt.
The shell of M. mercenaria is thick, strong, and broadly oval and its beaks are
shifted forward. It is distinguished by a purple stain on the inside of its shell, which is
mostly white and by external sculpting that changes with age. The young have sharply
raised concentric ridges, which are mostly gone in older clams. M. mercenaria grows
quickly, but may live 20- 25 years. Adults range from 4 to 6 inches [26]. Quahogs are an
important commercial clam. They are still harvested in the wild, although they are
increasingly being aquacultured. The most common method of aquaculturing them is to
fertilize the eggs by mixing with sperm in seawater and the raise them in tanks on
phytoplankton until they finish their free swimming stage and settle. They are then
transported to leased areas where they feed in the wild until they harvesting [27].
M. mercenaria has several common names. In New England it is called the
Quahog Clam. Farther south it is called the Round Clam or Hardshell Clam. Commercial
names are based on it size. Below 1.5 inches in shell length it is called the Littleneck
Clam. Between 1.5 and 2 inches it is referred to as the Cherrystone Clam. Above 2 inches
it is called the Chowder Clam. Its scientific name, mercenaria, comes from the shells use
by Native Americans to make currency or wampum [26].

24
5.1.2 The morphology of the Summer Flounder (Paralichthys dentatus)
The Summer Flounder (Paralichthys dentatus) ranges from the southern Gulf of
Maine to South Carolina [27]. It is an important commercial and recreational fish in the
Mid-Atlantic (Cape Cod to Cape Hatteras). It spawns during an offshore migration to the
outer continental shelf during autumn and winter. The larvae are transported by water
currents to coastal areas. Development of the post-larvae and juveniles occurs in bays and
estuarine areas, including the Chesapeake Bay [27].
The Summer Flounder is a member of the family, Bothidae. Bothidae are known
as Lefteye Flounders, because both eyes migrate to the left side of the head. Other
distinguishing characteristics include a round or oblong body, an asymmetrical mouth
with a slightly prominent protractile lower jaw, the ability to change color to match
surroundings and the ability to raise and move both eyes independently. All Flounder are
carnivorous [28]. Usually, they lay camouflaged and partially buried on the bottom and
wait for unsuspecting prey to wander by. Their typical prey includes shrimp and small
fish. This large family has 37 genera and 212 species [28]. Data indicate that females
may live up to 20 years and grow up to 11.8 kg (26 lbs.). However males rarely live
more than 7 years [27].
Figure 5.1 – Adult Summer Flounder [27]

25
5.1.3 Morphology of Atlantic Silverside (Menidia menidia)
The Atlantic Silverside, Menidia menidia, is found in estuaries from Maine to
Northern Florida. It occurs at salinities from 12 to 30 ppt. This species is an important
forage fish for many commercial and recreational species including striped bass, bluefish
and spotted sea trout [24].
Adults usually grow to about 117 mm. Females are usually slightly larger than
males. They can be distinguished by the number of rays and spines on their fins. The first
dorsal fin usually has four to five spines. The second dorsal fin has one fin and eight or
nine rays. The anal fin has one spine and 19 to 29 rays. The pectoral fin has 12 to 16 rays
[29].
Figure 5.2 – Adult Atlantic Silverside [27]
26
5.2 Tests Performed
The manuscript section of this document does not differentiate which tests were
performed as part of the research for this thesis and which tests were performed by
Hudgins and Li. The following section describes which tests were performed as part of
this research. The intent of this section is to make it clear which work was performed by
the author and which work was performed by Hudgins and Li.
5.2.1 Acute Tests
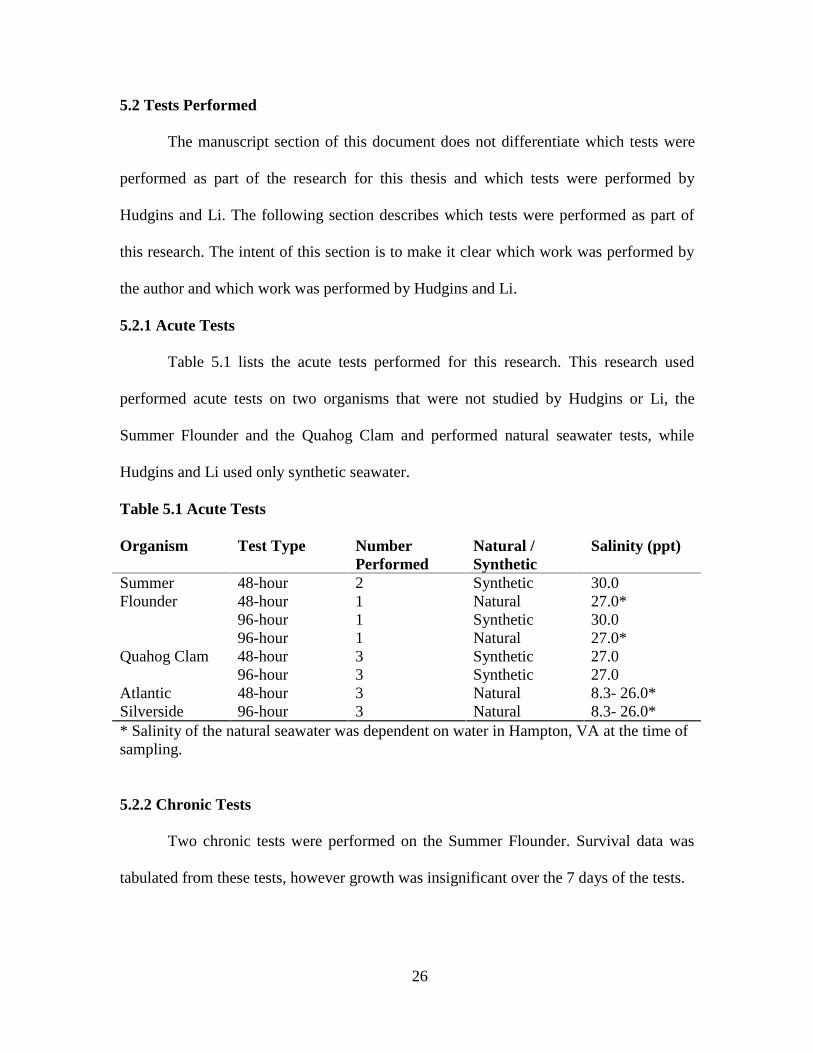
Table 5.1 lists the acute tests performed for this research. This research used
performed acute tests on two organisms that were not studied by Hudgins or Li, the
Summer Flounder and the Quahog Clam and performed natural seawater tests, while
Hudgins and Li used only synthetic seawater.
Table 5.1 Acute Tests
Organism Test Type NumberPerformed
Natural /Synthetic
Salinity (ppt)
SummerFlounder
48-hour48-hour96-hour96-hour
2111
SyntheticNaturalSyntheticNatural
30.027.0*30.027.0*
Quahog Clam 48-hour96-hour
33
SyntheticSynthetic
27.027.0
AtlanticSilverside
48-hour96-hour
33
NaturalNatural
8.3- 26.0*8.3- 26.0*
* Salinity of the natural seawater was dependent on water in Hampton, VA at the time ofsampling.
5.2.2 Chronic Tests
Two chronic tests were performed on the Summer Flounder. Survival data was
tabulated from these tests, however growth was insignificant over the 7 days of the tests.
27
5.3 Data Analysis
Data analysis is briefly explained in the manuscript section of this document,
however not in the detail required of a thesis. This section goes into more detail on the
data analysis.
After the tests were completed, the numbers of mortalities for the acute and
chronic tests were used to determine the LC50, NOEC, and LOEC for each test species.
The data were analyzed in two ways; each test’s data were analyzed individually and then
their endpoints were averaged together (multi-test method) and all the data for a specific
test on each organism were pooled together to come up with one set of endpoints (multi-
replicate method). Methods for analyzing mortality data to determine the LC50, NOEC,
and LOEC are presented in EPA 600/4-90/027 [24] for acute tests and EPA 600/4-89/001
[ 25] for a chronic test these methods are detailed below. These methods include manual
computation as well as computer programs such as Toxstat Version 3.3 and 3.4.
However, manual computational techniques were not necessary based upon the EPA
guidelines.
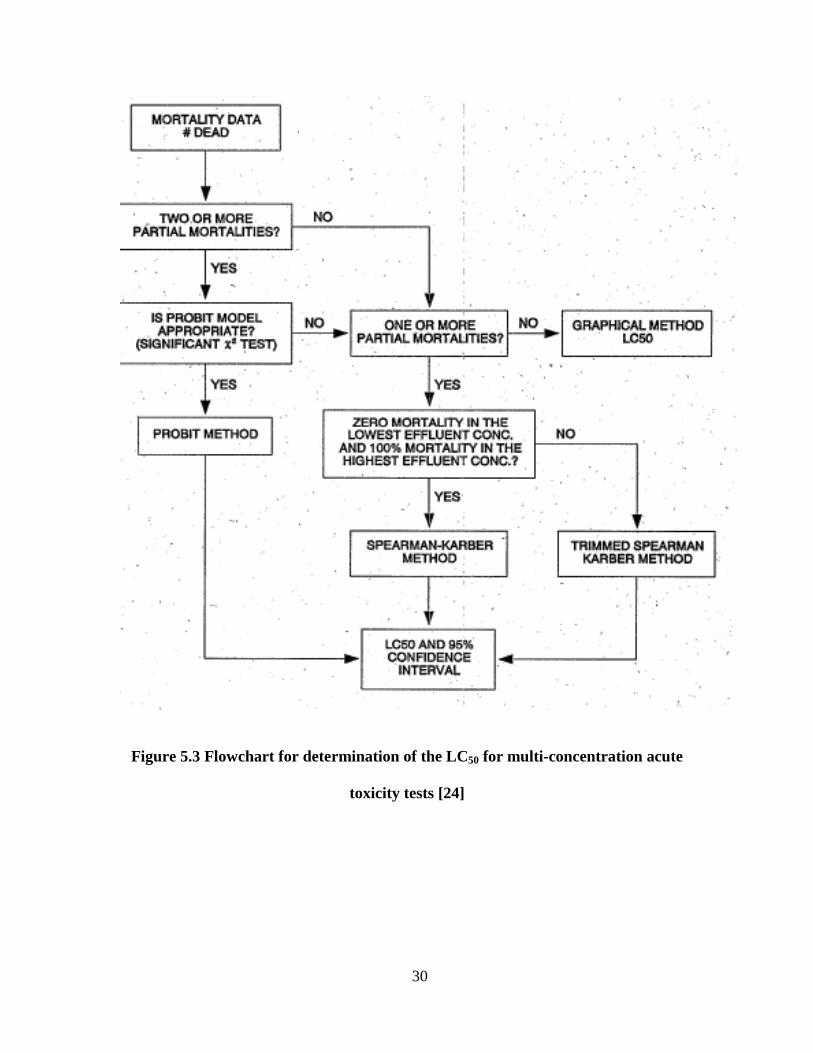
5.3.1 Acute Tests
In acute tests, the most useful data are LC50s and NOECs. EPA 600/4-90/027 [24]
describes four well-tested methods for determining the LC50 for multi-concentration acute
toxicity tests. These methods are the Graphical Method, the Spearman-Karber Method,
the Trimmed Spearman-Karber Method and the Probit Method. The analysis scheme is
suggested in EPA 600/4-90/027 and is presented in Figure5.3. Based on this scheme, the
Probit method was used for all of the acute tests to determine the LC50. For details of
these methods as well as the other ones outlined, refer to EPA 600/4-90/027.

28
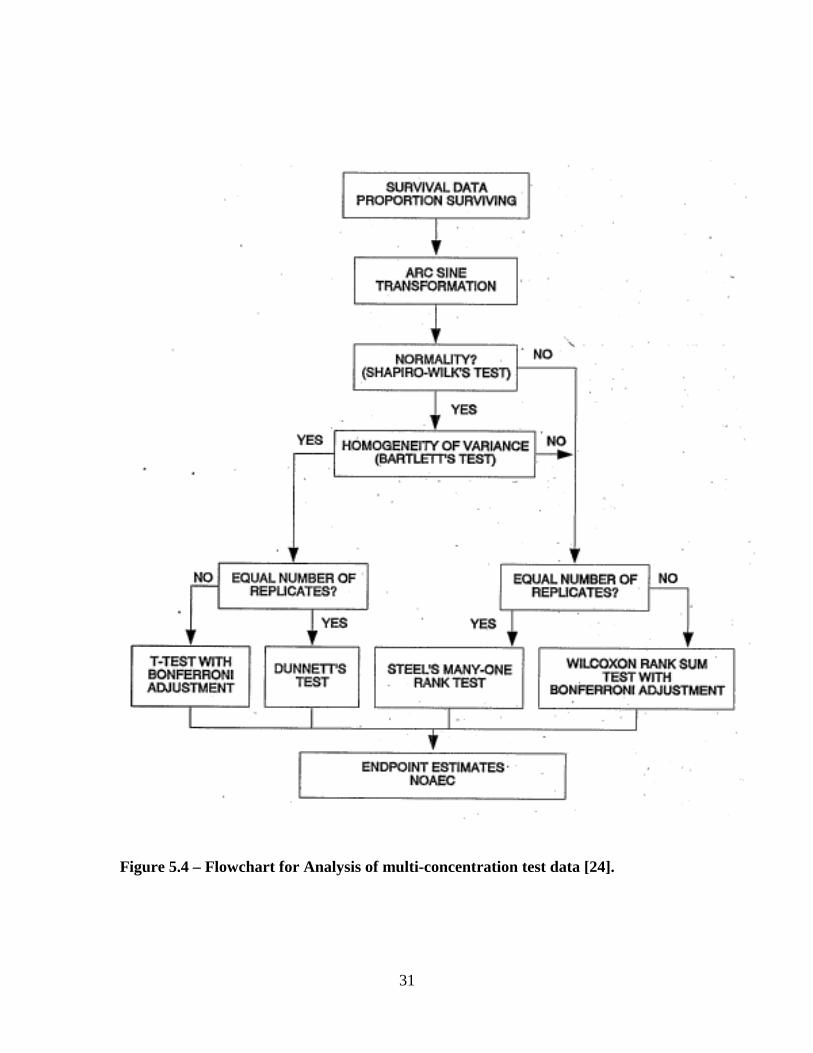
Determination of the NOEC is accomplished using hypothesis testing and is
outlined in EPA report 600/4-90/027 [24]. The first step in determining the NOEC is to
transform the data to the arc-sine-square-root transformation. For this, the mortality data
must be stated as a proportion surviving. This transformation is used to stabilize the
variance and satisfy the normality requirement. The normality assumption is tested by the
Shapiro-Wilk’s test. If the normality assumption is verified, the Bartlett’s test for equality
of variances was used to test the homogeneity of the variance assumption. If the data
satisfies both the normality and homogeneity of variance test, the Dunnett’s test was
used. If the data does not satisfy both of the assumptions, the Steel’s Many-One Rank
Test was used. Figure 5.4 shows a flowchart of this procedure to determine the NOEC.
Based on this scheme, the Steel’s Many-One Rank was used to determine the NOEC for
all of the acute tests.
5.3.2 Chronic Tests
The survival data were used to determine 7-day LC50, LOEC and NOEC values
based on 6 replicates of the Summer Flounder. The analysis scheme is outlined in EPA
600/4-89/001 [25]. The data were analyzed using Toxstat Version 3.4. To determine the
LC50 and NOEC, the same steps were used as described in section 5.3.1, except 7-day
mortality data were used. The LOEC is simply the next highest concentration after the
NOEC. Figures 5.3 and 5.4 can again be followed to determine which test is appropriate.
Based on this scheme, the probit method was used for all of the chronic tests to determine
LC50 and Steel’s Many One Rank was used for all chronic tests to determine the NOEC.
29
5.3.3 Natural Seawater Tests
To determine whether the 48-hour and 96-hour LC50s for tests involving natural
seawater were significantly different from tests using synthetic seawater, the values were
tested with a single-factor ANOVA analysis at α≤0.05. Differences between LC50 values
were considered significant if α≤0.05. For the Summer Flounder tests, the natural
seawater tests were compared with synthetic seawater contained in this research. For the
48-hour acute tests involving Atlantic Silverside, the natural seawater tests were
compared with 48-hour acute tests performed by Li [3]. For 96-hour acute tests involving
Atlantic Silverside, data were compared with data presented in the Criteria [1].
30
Figure 5.3 Flowchart for determination of the LC50 for multi-concentration acute
toxicity tests [24]
31
Figure 5.4 – Flowchart for Analysis of multi-concentration test data [24].

32
6 Manuscript
33
THE TOXICITY OF AMMONIA TO THREE MARINE FISH AND THREE MARINE1
INVERTEBRATES2
3
GREGORY D. BOARDMAN†, STEVEN M. STARBUCK†, DOUGLAS B. HUDGINS‡, XIAYOUN4
LI‡,5
†Civil and Environmental Enginering, Virginia Tech, Blacksburg, Virginia6
‡ Olver Laboratories, Incorporated, Blacksburg, Virginia7
8
Abstract - Laboratory toxicity tests were performed to obtain more data pertaining to the toxicity of9
ammonia to saltwater organisms. The standards for instream ammonia limits in marine environments are10
presently based on toxicity tests involving both freshwater and saltwater organisms. Acute tests (48-h and11
96-hour) were performed at 20 0C, and chronic tests (7-day) were performed at 25 0C. Synthetic seawater12
and natural seawater taken from the Chesapeake Bay were used. The results obtained are given below in13
terms of mg/L of unionized ammonia. For the Sheepshead Minnow (Age-1-14 days), the 48-h LC50 and the14
96-hour LC50 were 2.68 mg/L and 2.09 mg/L, respectively, and the 7-day NOEC (growth) was 0.34 mg/L.15
For the Summer Flounder (2 months), the 48 and 96-hour LC50s in synthetic seawater were 1.22 mg/L and16
1.08 mg/L, respectively, and the 7-day NOEC (mortality) was 0.34 mg/L. In Chesapeake Bay water, the 4817
and 96-hour LC50s were 1.09 mg/L and 0.889 mg/L, respectively. For the Atlantic Silverside (14 days), the18
48-h LC50 in synthetic seawater at salinities 14, 22, and 30 ppt were 1.50 mg/L, 1.17 mg/L and 1.08 mg/L,19
respectively. The 7-day NOEC (growth) was 0.48 mg/L. In Chesapeake Bay water, the 48 and 96-h LC50s20
were 1.45 mg/L and 1.08 mg/L, respectively. For the Mysid Shrimp (<2 days), the 48 and 96-h LC50s were21
1.00 mg/L and 0.76 mg/L, respectively. For the Ghost Shrimp (10 days), the 48 and 96-h LC50s were 3.4822
mg/L and 1.97 mg/L, respectively, and the 7-day NOEC (growth) was 1.08 mg/L. For the Quahog Clam23
(5mm shell height), the 48 and 96-h LC50s were 216 mg/L and 36.6 mg/L. Based on these results, it appears24
the chronic criterion for ammonia in marine environments can be increased from 0.035 mg/L (unionized25
ammonia) to 0.081 mg/L.26
27

34
Keywords: ammonia, acute toxicity, chronic toxicity, salinity effects, Chesapeake Bay, bioassays28
29
6.1 Introduction30
31
In order to reevaluate the in-stream ammonia limit in the Chesapeake Bay32
watershed, toxicity tests were performed on three fish, the Sheepshead Minnow33
(Cyprindon variegatus), Summer Flounder (Paralichthys dentatus), and Atlantic34
Silverside (Menidia menidia) and three invertebrates, the Ghost Shrimp (Palaemonetes35
pugio), Mysid Shrimp (Mysidopsis bahia), and Quahog Clam (Mercenaria mercenaria).36
Effluent standards for specific chemicals are based primarily on toxicity tests.37
One such effluent standard is the national criteria set for the discharge of ammonia into38
saltwater. However, due to a lack of data on the toxicity of ammonia to saltwater39
organisms, the current saltwater criteria are based on freshwater and saltwater organisms.40
These criteria can be found in “Ambient Aquatic Life Water Quality Criteria for41
Ammonia (Saltwater)-1989” [1]. Two criteria are presented in this document: the acute42
criterion, a one-hour average concentration not to be exceeded more than once every43
three years and the chronic criterion, a four-day average concentration not to be exceeded44
more than once every three years. The acute criterion is calculated using species mean45
acute values (SMAVs), which are the geometric means of the 48-h LC50 and the 96-h46
LC50. The chronic criterion is derived from acute-chronic ratios. Procedures for47
developing these criteria are described in “Guidelines for Deriving Numerical National48
Water Quality Criteria for the Protection of Aquatic Organisms and Their Uses” and49
“Ambient Water Quality Criteria for Ammonia” (1984) [2,3]. The acute criterion was50
developed based on 21 species from 18 genera and the chronic criterion was developed51

35
based on two saltwater and four freshwater species [1]. Currently, the acute criterion for52
ammonia in saltwater is 0.233 mg/L as unionized ammonia, whereas the chronic criterion53
is 0.035 mg/L as unionized ammonia [1].54
Another motivation for this research was to provide toxicity data to aquaculturists55
involved in the recirculating aquaculture of Summer Flounder, Paralichthys dentatus.56
Although relatively new, aquaculture of Summer Flounder has been undertaken by57
several private companies and universities in the past several years [4-6]. For example,58
the Virginia Tech Seafood Research and Extension Unit has begun researching59
recirculating aquaculture of Summer Flounder. Ammonia toxicity data is very important60
in recirculating aquaculture systems because ammonia is a natural by-product of the61
cultured organism’s metabolism and can build up in a recirculating system [7].62
Unionized ammonia is the toxic form of ammonia to aquatic life because it can63
most readily gain entry to aquatic organisms. The predominant route of entry for both64
vertebrates and invertebrates is the gills. This is because the unionized ammonia65
molecules can readily pass through cell membranes at the gill surface [8]. In most66
organisms, ammonia is the predominant form of nitrogen excreted. The gills of the67
organisms rapidly eliminate ammonia [9]. Several modes of action have been suggested68
for ammonia toxicity. These include disturbance of electrochemical gradients [10-12],69
cerebral effects caused by a depletion of the cerebral energy in the form of ATP [12-14],70
acid-base disturbance in the body of the organism [15] and a decrease in glutamate, a71
potential neurotransmitter, in the brains of fish [16].72
Because unionized ammonia is the toxic form of ammonia, it is important to73
understand the physical parameters that affect the proportion of total ammonia that is in74

36
the unionized state. Ammonia is present in water in two forms, unionized ammonia75
(NH3) and ionized ammonium (NH4+). They exist in equilibrium represented by the76
equation;77
78
++ +↔+ OHNHOHNH 3324 Eq. 6.179
80
The ionization constant for this reaction at 250 C and no salinity is;81
82
9.2
4
3a 10
][NH
]][H[NHK −
+
+
== Eq. 6.283
84
The three major parameters that affect the proportion of unionized ammonia are85
pH, temperature, and salinity. These factors affect the proportion of unionized ammonia86
in the following ways; increase in pH increases the proportion of unionized ammonia,87
increasing temperature increases the proportion of unionized ammonia, and increasing88
salinity decreases the proportion of unionized ammonia. Greater discussion of these89
effects can be found in USEPA 1989 [1], Emerson et al. [17], and Whitfield et al. [18].90
Salinity is an important factor that should be considered during ammonia toxicity91
tests with marine species. Atlantic salmon and Chinook salmon were found to be less92
sensitive to ammonia in saltwater that in freshwater [19,20]. However, the effect of93
different salinity levels on ammonia toxicity is not well known. Therefore, tests were94
performed with the Atlantic Silverside to further investigate the relationship of ammonia95
toxicity and salinity.96

37
Tests were also performed on two fish, the Atlantic Silverside and Summer97
Flounder, to determine if interactions of ammonia with natural seawater taken from the98
Chesapeake Bay were important (e.g. synergistic or antagonistic).99
100
6.2 Materials and Methods101
6.2.1 Organism source and care102
The Summer Flounder were purchased from GreatBay Aquafarms of Portsmouth,103
New Hampshire. The flounder were approximately two months old and post104
metamorphosis. This age group was chosen because this is approximately the age when105
they are switched from a flow-through system to a recirculating system and from live106
food to chow. They were fed both Artemia cultured in the lab and chow provided by107
GreatBay twice daily.108
The Sheepshead Minnow were purchased from Cosper Environmental Services109
Inc. of Bohemia, New York. The minnows arrived less than five days old and were fed110
both Artemia and Tetrimin flakes twice daily.111
The Atlantic Silverside and Ghost Shrimp were supplied by Sea Plantations (SP),112
Inc., of Salem, Massachusetts. The larval stages of both species were used in this study113
based on the belief that the younger organisms are, the more sensitive to ammonia they114
will be. The Atlantic Silversides were 13-15 days old, and the Ghost Shrimp were 9-11115
days old. The average lengths of the Atlantic Silverside and the Ghost Shrimp were116
approximately 11.15-± 0.25 mm and 9.23 ± 0.16 mm, respectively.117
The Mysid shrimp were purchased from Cosper Environmental Services of118
Bohemia, New York. They were cultured in 10-gallon tanks at salinities between 25 and119
38
28 ppt. Before each test, young less than two days old were acquired by collecting adult120
females bearing brood pouches and isolating them in a separate 4-liter tank. These121
females were placed in a large (10 cm by 15 cm) standard fish transfer net for two days122
that allowed the juveniles to pass through while keeping the females inside to avoid123
predation. The young were then collected with a fine mesh net for use in testing. These124
procedures follow EPA document no. 600/4-90-027 [21]. In order to verify the health of125
the culture, standard 48-h acute reference tests were conducted each month. The standard126
toxicant was an EPA-certified solution of cadmium (CdCl2). The LC50 was determined to127
be appropriate based on work performed by Burton and Fisher [22].128
The quahog clams (Mercenaria mercenaria) were purchased from Cherrystone129
Aquafarms in Cheriton, VA. They were approximately 5 mm in shell height and 9130
months old at test initiation.131
6.2.2 Dilution water132
Synthetic seawater used as dilution water was made up with deionized water and133
Forty Fathoms as recommended by the EPA [21]. Newly prepared synthetic seawater134
was kept at saturation by means of aeration, and the water was aged at least 24 hours to135
assure complete dissolution of the salts before use.136
Natural seawater was collected from the Chesapeake Bay at Hampton, Virginia. It137
was kept refrigerated at 4 0C until 24 hours prior to use when it was brought to room138
temperature and aerated to bring dissolved oxygen to saturation. All water used in testing139
was less than two weeks old , as suggested by EPA [24].140
141

39
6.2.3 Experimental verification of ammonia dose142
The total ammonia concentration of each dilution for all tests were measured143
according to Method-4500 B. and C., as detailed in Standard Methods for the144
Examination of Water and Wastewater [23]. Samples taken at initiation and the end of145
each test were preserved in 6M H2SO4 and stored at 40C for no longer that two weeks.146
The samples were analyzed with distillation followed by titration. The average of the147
initial and final measured ammonia concentrations were used in the calculation of the148
LC50, LOEC, and NOEC.149
It was found that no significant loss of total ammonia was observed through a 48-150
h acute test. Thus, for the chronic tests with 24-hr renewals, it was decided that samples151
need not be taken each day. Total ammonia was measured to three significant figures as152
specified for the analytical method. The unionized ammonia was calculated based on pH,153
temperature and salinity. The resulting values to three significant figures were used in154
this report.155
6.2.4 Test Conditions156
All tests were conducted according to EPA guidelines; specifically the acute157
methods are presented “Methods for Measuring the Acute Toxicity of Effluents and158
Receiving Waters to Freshwater and Marine Organisms” [21] and the chronic methods159
are presented in “Short-term Methods for Estimating the Chronic Toxicity of Effluents160
and Receiving Waters to Freshwater and Marine Organisms” [24]. These experiments161
were performed at Olver Laboratories, Incorporated. All tests were conducted as static162
experiments with 10 organisms per replicate, and a light regime of 16 hours light/ 8 hours163
darkness. The pH was kept at 8.2 ± 0.1 using 0.1 N NaHCO3 and Na2CO3. The164
40
temperatures for acute and chronic tests were 20 0C and 25 0C, respectively. The165
dissolved oxygen for all tests remained above 4.0 mg/L. All 48-h acute tests were non-166
renewal; all 96-h acute tests were renewed once after 48 hours; and, all 7-day chronic167
tests were renewed once a day during the test duration. Other test conditions are168
summarized in Table 1.169
6.2.5 pH Control170
The pH had to be carefully controlled because small changes in pH can greatly171
affect the proportion of ammonia that is unionized. Previous research [25-27] and the172
ammonia criteria published by EPA [1] indicated that a pH change would be significant173
at >± 0.1 units. Therefore, these tests were kept at pH variation <± 0.1 and in most cases174
<± 0.05 pH units. The ammonium salt (NH4Cl) used has a slow dissociation and is175
slightly acidic [1], so pH tended to drift down. Sodium carbonate (Na2CO3) and sodium176
bicarbonate (NaHCO3) were used to adjust pH. In all tests, the pH was checked and177
adjusted when appropriate every four hours during the daytime, with, at most, an eight178
hour gap in the evening. All new solutions were adjusted to pH 8.2 prior to use.179
6.2.6 Statistical Analysis180
After tests were completed, survival data and, where appropriate, growth data,181
were analyzed to determine the LC50, NOEC, and LOEC for each species. The data were182
analyzed in two ways: each test’s data were analyzed individually and then their183
endpoints were averaged together (multi-test method); and, all the data for a specific test184
on each organism were pooled together to come up with one set of endpoints (multi-185
replicate method). The data were then analyzed using Toxstat versions 3.3 and 3.4,186
following guidelines provided in EPA reports 600/4-90/027 [21] and 600/4-89/001 [24]187

41
for the determination of the LC50, NOEC, and LOEC. The average pH was determined by188
averaging the upper and lower hydrogen ion concentrations for a final average pH, which189
was used in determining the unionized ammonia LC50, 95% confidence intervals and190
NOEC for both the acute and chronic toxicity tests. The endpoints determined from the191
“multi-replicate method” were then used to calculate the species mean acute value192
(SMAV), chronic values, and acute-chronic ratios, as described in “Guidelines for193
Deriving Numerical National Water Quality Criteria for the Protection of Aquatic194
Organisms and Their Uses” [2]. From these data, proposed, revised acute and chronic195
criterion were calculated again following procedures described in “Guidelines for196
Deriving Numerical National Water Quality Criteria for the Protection of Aquatic197
Organisms and Their Uses”.198
To determine whether the LC50 values at the three levels of salinity were199
significantly different from each other, a group of three LC50 values at each level of200
salinity was tested with a single-factor ANOVA analysis at α≤0.05. Differences between201
LC50 values were considered significant if α≤0.05, but not at α>0.05.202
To determine if the LC50s determined in the natural seawater testing were203
significantly different, single-factor ANOVA analysis at α≤0.05 was again employed.204
The natural seawater tests involving the Summer Flounder were compared with synthetic205
seawater tests presented in this research. The 48-h acute tests involving the Atlantic206
Silverside were compared with each of the three different salinity levels of 48-h tests207
presented in this report. The 96-h tests involving the Atlantic Silverside were compared208
with data presented in the Criteria [1].209

42
210
6.3 Results211
6.3.1 Acute Results212
Table 2 summarizes the acute results based on the “multi-test method” “multi-213
replicate method” for synthetic seawater testing at normal test conditions.214
Eight 48-h and four 96-h acute tests were performed with Sheepshead Minnow.215
The LC50s for these tests are similar to those presented in the literature for unionized216
ammonia. Miller et. al. [28] also worked with Sheepshead Minnow, but they used a flow-217
through system and their temperature and salinity were 250C and 30 ppt, respectively, as218
compared to 200C and 25-ppt in these tests. They also conducted their tests with four219
replicates as compared to the sixteen replicates in this research. The data in this research220
falls below their value of 2.79 mg/L as unionized ammonia [28]. The SMAV for the221
Sheepshead Minnow was determined to be 2.37 mg/L, which is reasonable considering222
that EPA indicates that the SMAV for Sheepshead Minnow is 2.74 mg/L [1].223
Two 48-h and two 96-h acute tests (two replicates each) were performed on the224
Summer Flounder. No previous research with ammonia has been performed with the225
Summer Flounder. Research was performed by Cardin [29] on the Winter Flounder226
(Pseudopleuronectes americanus), which is in a different genus. Cardin reported 48-h227
LC50s from 0.44-0.53 mg/L (unionized ammonia), about 50% of the 48-h LC50228
determined in this research. When compared to organisms reported in the Criteria [1], its229
sensitivity ranks near the middle. It is less sensitive than 10 of the 21 organisms reported.230
Eight 48-h (2 replicates each) and four 96-h static renewal tests (4 replicates each)231
were analyzed to determine the LC50 and NOEC for the Mysid Shrimp. The final LC50232

43
and NOEC for both the 48-h and 96-h tests were determined by the multi-test and multi-233
replicate methods. There was some mortality in the controls, although it wasn’t234
significant. This mortality appeared to be from the cannibalistic behavior of the juvenile235
Mysids, since the carcasses in the controls had completely disappeared. Therefore, for236
future testing of the Mysid, additional surface area (approximately 20 in.2 of mesh237
netting) should be added to the test beakers to reduce mortality in the controls. The 48-h238
LC50 value tabulated in this research is lower than the 96-h LC50 values determined by239
Miller et al. [28] of 1.3-1.9 mg/L. One would expect that the 96-h LC50 would be lower240
than the 48-h LC50. Experiments conducted by Miller et al. were at 250C and 30-ppt241
salinity, as compared to 200C and 25-ppt for this research. However, these variations in242
the conditions do not explain the large discrepancies in the unionized ammonia LC50. The243
96-h LC50 derived from this research is also below the 96-h range presented by Miller et244
al. [28] for unionized ammonia. Again, experiments conducted by Miller et al. were at245
250C and 30-ppt salinity, as compared to 200C and 25-ppt for this research. This variation246
in temperature and salinity should affect only the total ammonia LC50. However, some247
data presented by the EPA [1] suggest that the 96-h LC50 is similar to the data reported in248
this document. The EPA lists 96-h LC50s ranging from 0.7-1.2 mg/L.249
A total of eight 48-h static nonrenewal (2 replicates per test) and three 96-h static250
renewal (4 replicates per test) were analyzed to determine the LC50 and NOEC for the251
Ghost Shrimp. The 48-h LC50 for this research is above the value presented by the EPA252
of 2.57 mg/L as unionized ammonia [1]. The conditions for the 48-h ghost shrimp tests253
listed in EPA [1] were similar to the conditions in this research except for the size (age)254
of the shrimp. The size of the shrimp used in EPA testing was 10-20 mm, but the size of255

44
the shrimp used in this research was 15-30 mm. This difference in size (age) of the test256
organisms was possibly the reason for the discrepancies in the test data. As the aquatic257
organisms mature, they may become more tolerant to ammonia. The 96-h LC50 calculated258
in this research falls within the range reported by EPA of 1.06-2.57 mg/L [1].259
A total of three 48-h static nonrenewal (2 replicates per test) and three 96-h static260
renewal (2 replicates per test) were analyzed to determine the LC50 and NOEC for the261
Quahog Clam. The SMAV of 88.9 mg/L as unionized ammonia is about 4.5 times greater262
than the least sensitive organism reported in the Criteria [1] (Eastern Oyster SMAV of263
19.1 mg/L). It was apparent from observations of the test organisms that they were able264
to securely close their shells to avoid the high levels of ammonia. A more appropriate265
method would be to measure food uptake, such as performed by Epifano and Srna [30].266
They determined an SMAV of 5.36 mg/L as unionized ammonia based on Effective267
Concentration- 50% (EC50) measurements.268
6.3.2 Salinity Results269
The 48-h LC50 values for the Atlantic Silverside at three salinity levels are listed270
in Table 3. Table 3 gives the LC50 and NOEC values as total and unionized ammonia. For271
each experiment, 95% confidence intervals (C.I.) are given in parentheses, the LC50272
values found in the literature for each species are listed for comparison. The 48-h LC50273
values at each salinity (in terms of unionized ammonia concentrations) were 1.50 mg/L at274
14 ppt, 1.17 mg/L at 22 ppt, and 1.08 mg/L at 30 ppt. Among these three values, two fall275
in the range of 1.03 to 1.47 mg/L listed in the literature [31]. One of these, the LC50 at 14276
ppt, exceeds the range by 2%. The LC50 of 1.47 mg/L in the literature was obtained under277
the conditions of pH 8.5 and salinity 10 ppt [31], which were different from the278

45
conditions in this work. In addition, these results indicated that the 48-h LC50 values279
decreased as salinity increased. The results of the ANOVA analysis are shown in Table 4.280
These results indicated that the LC50 at salinity of 14 ppt was significantly greater than at281
salinity 22 and 30 ppt. While the LC50 at 22 ppt was higher than at 30 ppt, it was not282
statistically significant.283
6.3.3 Natural seawater testing results284
One 48-h acute and one 96-h acute test were analyzed to determine if ammonia285
exhibits different toxicity in natural seawater than it does in synthetic seawater for286
Summer Flounder. The 48-h LC50 of 1.09 mg/L, in the natural seawater was significantly287
less than the 48-h LC50 in the synthetic seawater of 1.22 mg/L (See table 6.5 for α288
values.). The 96-h LC50 of 0.889 mg/L was less than in the synthetic seawater (1.08289
mg/L), but not statistically significant.290
Three 48-h acute and three 96-h acute test were analyzed to determine if ammonia291
exhibits different toxicity in natural seawater than it does in synthetic seawater for292
Atlantic Silverside. The 48-h LC50 of the natural seawater (1.52 mg/L) was significantly293
less than the LC50 determined for salinities of 22 ppt and 30 ppt, 1.17 mg/L and 1.09294
mg/L, respectively. However, it wasn’t significantly different than the 48-h LC50 for 14295
ppt of 1.51 mg/L. The 96-h LC50 in natural seawater determined in this research of 1.18296
mg/L was greater than the 96-h LC50 presented in the Criteria [1] of 0.97 mg/L, but not297
significantly different.298
6.3.4 Chronic Results299
Prior to this research, the chronic toxicity of ammonia had only been tested with300
two marine organisms, the Mysid Shrimp and Inland Silverside [1]. The 7-day chronic301
46
tests were performed with the Sheepshead Minnow, Atlantic Silverside, Summer302
Flounder and Ghost Shrimp in order to expand the data base for the chronic effects of303
ammonia to common saltwater organisms. Of the organisms tested, the Sheepshead304
Minnow was the most sensitive, followed by the Summer Flounder, Atlantic Silverside,305
and Ghost Shrimp. The acute-chronic ratios for the Atlantic Silverside, Summer306
Flounder, and Sheepshead Minnow of 1.77, 2.27 and 6.95 are all less than the acute-307
chronic ratios presented in the literature (21.3 for the Inland Silverside and 7.2 for the308
Mysid). However, the chronic test for the Inland Silverside was conducted over a 28-day309
period, so it was expected that the acute-chronic ratio would be greater than for the other310
tests which were performed over seven days. The acute-chronic ratio of 7.57 for the311
Ghost Shrimp falls in between the values for the Mysid and Inland Silverside.312
6.4 Discussion313
6.4.1 Acute Testing and the Acute Criterion314
While the results of the acute tests are useful in other areas, they have little impact315
on refining the acute criterion. The acute criterion is based on the four most acutely316
sensitive species tested, the Winter Flounder (Pseudopleuronectes americanus), Red317
Drum (Sciaenops ocellatus), Sargassum Shrimp (Latreutes fucorum) and Prawn (Macro-318
brachium rosenbergii). Their SMAVs range from 0.492 mg/L to 0.777 mg/L. The most319
sensitive species tested was the Mysid, with a SMAV of 0.87 mg/L. The Criteria note that320
while freshwater fish are generally more sensitive than freshwater invertebrates, no trend321
is apparent when comparing marine fish with marine invertebrates. This research agrees322
with that trend. Of the species tested, an invertebrate (Mysid) was the most sensitive323
followed by a three fish (Atlantic Silverside, Sheepshead Minnow and Summer324

47
Flounder), and two invertebrates (Ghost Shrimp and Quahog Clam). The Criteria also325
note that mollusks are the most tolerant. The acute data on the Quahog Clam agree with326
that.327
The results of the salinity testing with the Atlantic Silverside yielded some328
interesting results. Previous studies by Alabaster et al. [19], Herbert and Shurben [32],329
and Miller et al. [28] indicated that ammonia toxicity decreased as salinity increased.330
They all hypothesized that the decrease in toxicity was due to a decrease in osmotic stress331
on the organisms. The results of this research showed that the 48-h LC50 values of332
unionized ammonia for M. menidia decreased with an increasing pH, although values333
between 22 ppt and 30 ppt were not significantly different. One of the interpretations for334
this result is that unionized ammonia might not be the only toxic form of ammonia. Both335
unionized ammonia and ionized ammonia may play an important role in ammonia336
toxicity. In addition, the activity of ammonia and biological behavior of test organisms337
may affect the toxicity of ammonia.338
The results of the natural seawater testing also yield interesting results. Ammonia339
toxicity appeared to be greater in the natural seawater for the Summer Flounder. This340
could be due to interactions with substances in the water, although no mortalities were341
observed in the controls. The Atlantic Silverside were more tolerant in the natural342
seawater than at 22 or 30 ppt, but were almost exactly as sensitive as the 14 ppt water.343
Interestingly, the average salinity of the natural seawater was 14.2 ppt. The results of the344
natural seawater testing may have an important impact on the recirculating aquaculture of345
marine organisms. If the aquaculture systems water supply is a nearby natural source,346
than the toxicity of ammonia may depend somewhat on water characteristics other than347

48
pH, temperature and salinity. The results of the salinity and natural seawater tests also348
suggest that at different salinities, ammonia may exhibit very different toxicities. This349
implies that site-specific guidelines may be necessary.350
6.4.2 Chronic Testing and the Chronic Criterion351
The chronic results provide important additional data. The Criteria use two352
saltwater and four freshwater organisms to determine the chronic criterion. The353
freshwater organisms were used because no other data were available on the chronic354
toxicity of ammonia to saltwater organisms. However, this document presents chronic355
data for four more saltwater organisms. The chronic criterion is determined by dividing356
the final acute value (FAV) by the geometric mean of the acute-chronic ratios of the357
appropriate organisms for which chronic data are available [2]. The FAV for ammonia in358
saltwater is 0.465 mg/L. The six organisms used to calculate the current chronic criterion359
are; the Mysid, Inland Silverside, Channel Catfish, Fathead Minnow, Bluegill Sunfish,360
and Rainbow Trout, with acute-chronic ratios of 7.2, 21.3, 10.0, 20, 12, and 14,361
respectively [1]. The geometric mean of these six acute-chronic ratios is 13.1. The four362
organisms considered in this research were: the Atlantic Silverside, Sheepshead Minnow,363
Summer Flounder and Ghost Shrimp, with acute-chronic ratios of 1.77, 6.95, 2.54, and364
7.57, respectively. The geometric mean of these four acute-chronic ratios and the two365
saltwater organisms (Mysid and Inland Silverside) is 5.75. The chronic criterion based on366
this result is 0.081 mg/L, significantly greater than the current chronic criterion of 0.035367
mg/L.368

49
6.5 Conclusions369
In this research the acute toxicity of ammonia to three marine fish and three370
marine invertebrates and the chronic toxicity of ammonia to three marine fish and one371
marine invertebrate were studied. The acute criterion for ammonia in saltwater remains372
unchanged based on these results. The revised chronic criterion based on the Mysid373
Shrimp, Inland Silverside, Summer Flounder, Atlantic Silverside, Ghost Shrimp, and374
Sheepshead Minnow is 0.081 mg/L (unionized ammonia), significantly greater than the375
current chronic criterion of 0.035 mg/L. The toxicity of ammonia to Atlantic Silverside376
significantly increases with an increase in salinity (14ppt-22ppt). The sensitivity of377
Atlantic Silverside to ammonia in natural seawater and in synthetic seawater of the same378
salinity was similar. However, Summer Flounder were more sensitive to ammonia in379
natural seawater from the Chesapeake Bay than in the synthetic seawater.380

50
6.6 Manuscript References381
382
1. US EPA (1989). Ambient Water Quality Criteria for Ammonia (Saltwater)-1989.383
EPA 440/5-88-004 Office of Water Regulations and Standards, Criteria and384
Standards, Washington, D.C., USA.385
386
2. Stephan, C.E., D.I. Mount, D.J. Hansen, J.H. Gentile, G.A. Chapman, and W.A.387
Brungs (1985). Guidelines for Deriving Numerical National Water Quality Criteria388
for the Protection of Aquatic Organisms and Their Uses. NTIS#PB85-227049.389
National Technical Information Service, Springfield, VA.390
391
3. US EPA (1984). Ambient Water Quality Criteria for Ammonia - 1984 NTIS #PB85-392
227114. National Technical Information Service, Springfield, VA.393
394
4. Bengston, D.A., G. Bisbal, H. Iken, and R.P. Athanas. 1994. Culture of Summer395
Flounder Paralichthys dentatus: Research on hatchery and growout phases. Journal396
of Shellfish Research 13: 312.397
398
5. Bengston, D.A., G. Nardi. 1995. Summer Flounder culture: An update on research399
and the development of an industry. Journal of Shellfish Research 14: 239.400
401
6. Nardi, G. 1996. Culture of Summer Flounder, Paralichthys dentatus, at GreatBay402
Aquafarms. Journal of Shellfish Research. 15: 458.403

51
404
7. Alzieu, C. 1989. Water – The Medium of Culture. In Barnabé, G., eds. Aquaculture,405
2nd ed., Vol. 1. Ellis Horwood Limited, Chichester, West Sussex, England, pp. 37- 62.406
407
8. Hampson, B.L. 1976. Ammonia concentration in relation to ammonia toxicity during408
a rainbow trout rearing experiment in a closed freshwater-seawater system.409
Aquaculture. 9: 61-70.410
411
9. Goldstein, L., J.B. Claiborne, D.E. Evans. 1982. Rapid communication – ammonia412
excretion by the gills of two marine teleost fish: the importance of NH4+ permeance.413
Journal of Experimental Zoology. 219: 395-397.414
415
10. Smart, W.A.. 1981. Investigations of the toxic mechanisms of ammonia to fish gas416
exchange in Rainbow Trout (Salmo gairdneri) exposed to acutely lethal417
concentrations. Journal of Fish Biology. 12: 93-104.418
419
11. Hawkins, R.A., A.L. Miller, R.C. Nielsen, and R.L. Veech. 1973. The Acute420
Actions of Ammonia on Rat Brain Metabolism in Vivo. Biochemical Journal. 134:421
1001- 1008.422
423
12. Arillo, A., C. Margiocco, F. Melodia, P. Mensi, and G. Schenone 1981. Ammonia424
Toxicity Mechanism in Fish: studies on Rainbow Trout (Salmo gairdnedi R.).425
Ecotoxicology and Environmental Safety. 5: 316-328.426
52
427
13. National Resource Council 1979. Ammonia. University Park Press, Baltimore,428
Maryland, USA.429
430
14. Slack, A.V. and G.R. James 1973 Ammonia- Part 1. Marcel Dekker, Inc., New431
York, New York, USA.432
433
15. Twitchen, I.D. and F.B. Eddy 1994. Effects of Ammonia on Sodium Balance in434
Juvenile Rainbow Trout Oncorhynchus Mykiss Walbaum. Aquatic Toxicology. 30:435
27-45.436
437
16. Vedel, N.E., B. Korsgaard, and F.B. Jensen 1998. Isolated and combined exposure438
to ammonia and nitrite in rainbow trout (Oncorhynchus mykiss): effects on electrolyte439
status, blood respiratory properties and brain glutamine/ glutamate concentrations.440
Aquatic Toxicology. 41: 325-342.441
442
17. Emerson, K., R.C. Russo, R.E. Lund, and R.V. Thurston 1975. Aqueous ammonia443
equilibrium calculations: effect of pH and temperature. Journal of Fisheries Research444
Board of Canada. 32: 2379-2383.445
446
18. Whitfield, M., R.A. Butler, and AQ.K. Covington 1985. The determination of pH447
in estuarine waters. I. Definition of pH scales ant the selection of buffers.448
Oceanologica Acta. 8(4): 423-432.449
53
450
19. Alabaster, J.S., D.G. Shurben, and G. Knowles 1979. The effect of dissolved451
oxygen and salinity on the toxicity of ammonia to smolts of salmon, Salmo salar.452
Journal of Fish Biology. 5: 705-712.453
454
20. Harader, R.J., and G. Allen 1983. Ammonia Toxicity to Chinook salmon parr:455
Reduction in saline water. Transactions of the American Fisheries Society. 112: 834-456
837.457
458
21. US EPA 1991. Methods for Measuring the Acute Toxicity of Effluents and Receiving459
Waters to Freshwater and Marine Organisms. EPA 600/4-90/027. Office of Research460
and Development, U.S. EPA, Cincinnati, OH, USA.461
462
22. Burton, D.T., and D.J. Fisher 1990. Acute toxicity of cadmium, copper, zinc,463
ammonia, 3,3’-dichlorobenzidine, 2,6-dichloro-4-nitroaniline, methylene chloride,464
and 2,4,6-trichlorophenol to juvenile grass shrimp and killifish. Bull. Environ.465
Contam. Toxicol. 44: 776-783.466
467
23. American Public Health Association, American Water Works Association, and468
Water Pollution Control Federation 1995. Standard Methods for the Examination469
of Water and Wastewater. 19th ed., American Public Health Association, Washington470
DC., USA.471
472

54
24. US EPA 1989. Short-term Methods for Estimating the Chronic Toxicity of Effluents473
and Receiving Waters to Freshwater and Marine Organisms. EPA 600/4-89/001.474
Office of Research and Development, U.S. EPA, Cincinnati, OH, USA.475
476
25. Hansen, D.J. 1984. Utility of Toxicity Tests to Measure Effects of Substances on477
Marine Organisms. In H. White, eds. Concepts in Marine Pollution Measurement,478
Maryland Sea Grant College, University of Maryland, College Park, Maryland, USA.479
480
26. Schimmel, S.C. 1986. Memorandum to David J. Hansen. US EPA, Narragansett,481
Rhode Island, USA.482
483
27. Knoph, M.B. 1992. Acute Toxicity of Ammonia to Atlantic Salmon (Salmo salar)484
parr. Comprehensive Biochemistry and Physiology. 101C (2): 275-282.485
486
28. Miller, D.C., S. Poucher, J.A. Cardin and D. Hansen 1990. The Acute and Chronic487
Toxicity of Ammonia to a Marine Fish and a Mysid. Archives of Environmental488
Contamination and Toxicology. 19 (40-48).489
490
29. Cardin, J.A. 1996. Memorandum to David Hansen. U.S. EPA, Narragansett, Rhode491
Island, USA.492
493

55
30. Epifano, E.C. and R.F. Srna 1975. Toxicity of Ammonia, Nitrite Ion, Nitrate Ion,494
and Orthophosphate to Mercenaria mercenaria and Crassostrea virginica. Marine495
Biology 33 (3): 241-246.496
497
31. EA Eng. (EA Engineering, Science, and Technology, Inc.) 1986. Proposed498
modified effluent limitations for Ammonia. E.A. Report BET54E. Prepared for499
Bethlehem Steel Corporation, Sparrows Point, Maryland, USA.500
501
32. Herbert, D.W.M. and D.G. Shurben 1965. The susceptibility of salmonid fish to502
poisons under estuarine conditions. International Journal of Air and Water Pollution.503
9, 89-91. 504

56
Table 6.1 – Summary of Test Conditions505
Sheepshead Minnow Atlantic Silverside Summer Flounder48 hour 96 hour 7day 48 hour 96 hour 7day 48 hour 96 hour 7day
Endpoint Surv. Surv. Surv./
Growth
Surv. Surv. Surv./
Growth
Surv. Surv. Surv.
Replicates 2 4 4 2 2 3 2 2 3
Beaker Size
(mL)
600 600 600 1000 1000 1000 2000 2000 2000
Test Sol. (mL) 250 250 250 500 500 500 2000 2000 2000
Age < 10days,
24 hr
range
< 10days,
24 hr
range
1-14 days,
24 hr
range
14 days 14 days 14 days 2 months 2 months 2 months
Feeding
Regime
none Artemia
2x/ day
Artemia
2x/ day
none Artemia
2x/ day
Artemia
2x/ day
None Flakes 2x/
day
Flakes 2x/
day
Salinity (ppt) 25 25 25 14,22,30 30 30 30 30 30
Dilution water Syn. Syn. Syn. Syn./Nat. Syn./Nat. Syn. Syn./Nat. Syn./Nat. Syn.

57
Table 6.1 Continued506
Mysid Shrimp Ghost Shrimp Quahog Clam
48 hour 96 hour 48 hour 96 hour 7day 48 hour 96 hour
Endpoint Surv. Surv. Surv. Surv. Surv./Growth Surv. Surv.
Replicates 2 4 2 4 4 2 2
Beaker Size (mL) 600 600 1000 1000 1000 500 500
Test Sol. (mL) 250 250 1000 500 500 500 500
Age < 2 days,
24 hr range
< 2 days,
24 hr range
1-2 months 10 days 10 days 1-2 months 1-2 months
Feeding Regime none Artemia 2x/
day
none Artemia 2x/
day
Artemia 2x/
day
none None
Salinity 25 25 25 25 25 30 30
Dilution water Syn. Syn. Syn. Syn. Syn. Syn. Syn.

58
Table 6.2 – Acute Results of Synthetic Seawater Testsa507
Sheepshead
Minnow
Atlantic
Silverside
Summer
Flounder
Ghost
Shrimp
Mysid
Shrimp
Quahog
Clam
48-h
LC 50b
2.69
(2.52-2.89)
1.08c
(0.92-1.19)
1.22
(1.09-1.35)
3.49
(3.22-3.80)
1.03
(0.85-1.24)
218
(165-271)
48-h
NOEC
2.3 0.92c 0.93 2.7 0.69 38
96-h
LC 50 b
2.07
(1.84-2.32)
- 1.08
(0.94-1.22)
1.66
(1.52-1.82)
0.76
(0.62-0.92)
37.9
(26.7-49.1)
“multi-
test
method”
96-h
NOEC
1.3 - 0.73 1.38 0.22 9.6
48-h
LC 50 b
2.68
(2.61-2.77)
1.09c
(0.95-1.19)
1.22
(1.13-1.31)
3.48
(3.37-3.59)
1.00
(0.94-1.08)
216
(186-246)
48-h
NOEC
1.9 0.92c 0.93 2.34 0.45 37
96-h
LC 50 b
2.09
(1.97-2.23)
- 1.07(0.968-
1.17)
1.67
(1.60-1.75)
0.76
(0.69-0.83)
36.6
(30.5-42.8)
96-h
NOEC
1.3 - 0.47 1.38 0.22 9.3
“multi-
replicate
method”
SMAV 2.37 0.92c 1.14 2.41 0.87 88.9
aAll data in terms of mg/L of unionized ammonia.508b 95% Confidence Intervals in Parentheses509cData for Atlantic Silverside tests performed at salinity 30 ppt.510

59
Table 6.3 - 48-h LC50s and NOECs based on 6 replicates for the Atlantic Silverside511
(Menidia menidia) and three salinity levels512
Salinity
(ppt)
Total
ammonia
LC50(mg/L)a
Unionized
ammonia
LC50 (mg/L)s
Total
ammonia
NOEC(mg/L)
Unionized
ammonia
NOEC(mg/L)
Literature
unionized
LC50(mg/L)
14 28.0
(25.5-29.5)
1.51
(1.38-1.59)
20.0 1.08
22 25.0
(23.0-26.5)
1.17
(1.08-1.25)
20.0 0.900 1.03-1.47b
30 23.6
(20.8-24.3)
1.09
(0.950-1.19)
20.0 0.920
a 95% confidence intervals in parentheses513
b From EPA [1].514
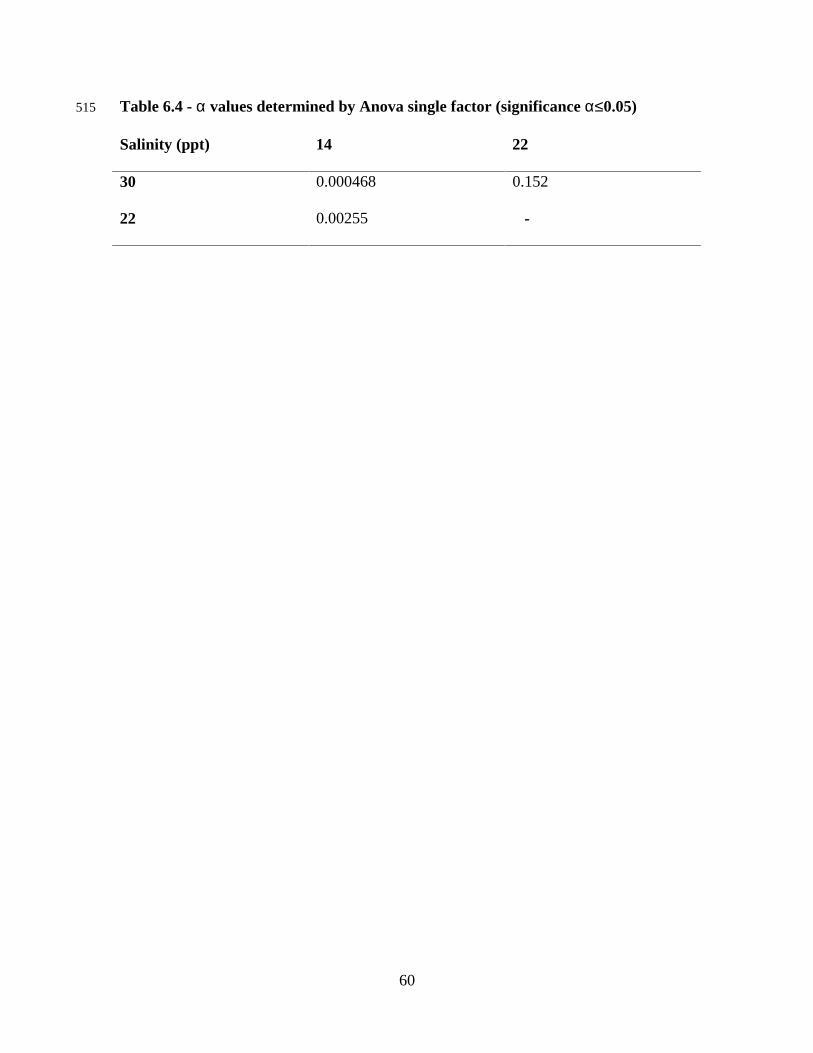
60
Table 6.4 - α values determined by Anova single factor (significance α≤0.05)515
Salinity (ppt) 14 22
30 0.000468 0.152
22 0.00255 -

61
Table 6.5 - Natural seawater results compared with synthetic resultsa516
Summer Flounder Atlantic Silverside
48-h LC50 96-h LC50 48-h LC50 96-h LC50
Synthetic
seawater
1.22
(1.13-1.31)
1.07
(0.968-1.17)
1.09
(0.950-1.19)
0.97b
Natural
seawater
1.09
(0.954-1.23)
0.889
(0.776-1.00)
1.52
(1.41-1.63)
1.18
(1.08-1.28)
α value 0.0408 0.114 See below 0.208
a 95% confidence intervals in parentheses517
bFrom EPA [1].518
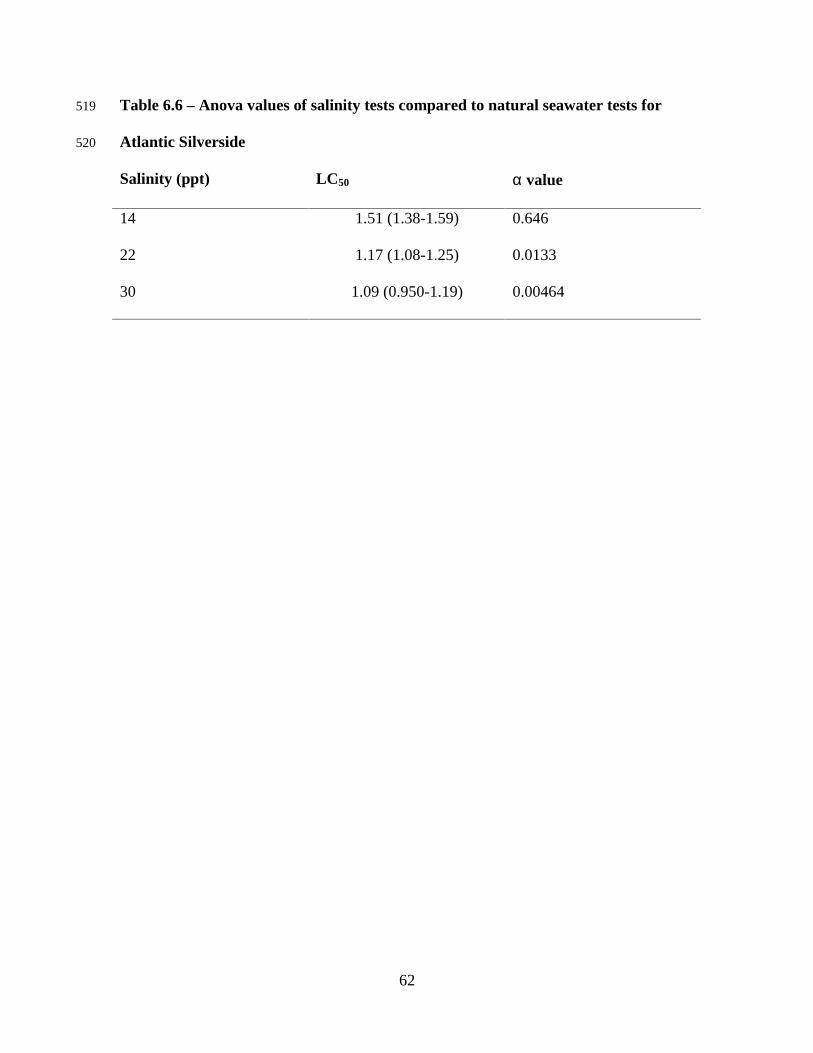
62
Table 6.6 – Anova values of salinity tests compared to natural seawater tests for519
Atlantic Silverside520
Salinity (ppt) LC 50 α value
14 1.51 (1.38-1.59) 0.646
22 1.17 (1.08-1.25) 0.0133
30 1.09 (0.950-1.19) 0.00464

63
Table 6.7 – Chronic Results521
Sheepshead
Minnow
Atlantic
Silverside
Summer
Flounder
Ghost
Shrimp
7-day LC50a 1.74
(1.61-1.89)
1.20
(1.08-1.24)
1.37
(1.20-1.54)
1.45
(1.32-1.60)
NOEC (surv) 1.3 0.63 0.25 0.99
NOEC (growth) 0.45 0.63 - 0.49
“multi-
test
method”
LOEC (growth) 0.95 0.51b 0.83
7-day LC50a 1.74
(1.66-1.83)
1.16
(1.10-1.21)
1.37
(1.25-1.49)
1.43
(1.33-1.54)
NOEC (surv.) 1.3 0.63 0.34 0.99
NOEC (growth) 0.34 0.48 - 0.33
LOEC (growth) 0.45 0.79 0.68b 0.66
Chronic Value 0.39 0.62 0.48 0.46
“multi-
replicate
method”
Acute-chronic
ratio
6.95 1.77 2.27 7.57
b 95% confidence intervals in parentheses522
aLOEC for survival.523

64
7 Engineering Significance
The ammonia limit is especially important because it will determine how much
ammonia is allowed in a National Pollutant Discharge Elimination System (NPDES)
permit. This limit will then be an important factor in determining the treatment system
that is used. This limit is especially important to companies in Virginia that have
previously been unregulated. These include seafood-processing companies whose
wastewater discharges are often characterized as low flow, but contain high organic
loads. Total ammonia concentrations in crab processing water, for example, average
about 200 mg/L, but can reach as high as 1000 mg/L, if allowed to anaerobically digest
[30]. Research on the treatment of these by McVeigh [30], Diz [31], and Wolfe [32]. The
high concentration of ammonia in these wastewaters makes the possibility of an ammonia
limit especially important.
Another significant implication of ammonia toxicity is in recirculating aquaculture.
This is especially true for the relatively recent aquaculture of Summer Flounder.
GreatBay Aquafarms in Portsmouth, New Hampshire recently became the first company
in the country to commercially spawn Summer Flounder [33,34,35]. The Virginia Tech
Seafood Research and Extension Center in Hampton, Virginia recently began researching
the recirculating aquaculture of Summer Flounder. Because it is a new species to be
aquacultured, the ammonia limits that are acceptable for the Summer Flounder are not
known. The addition of this data will help set guidelines for this organism.

65
References
1. US EPA (1989). Ambient Water Quality Criteria for Ammonia (Saltwater)-1989.EPA 440/5-88-004 Office of Water Regulations and Standards, Criteria andStandards, Washington, D.C., USA.
2. Stephan, C.E., D.I. Mount, D.J. Hansen, J.H. Gentile, G.A. Chapman, and W.A.Brungs (1985). Guidelines for Deriving Numerical National Water Quality Criteriafor the Protection of Aquatic Organisms and Their Uses. NTIS#PB85-227049.National Technical Information Service, Springfield, VA.
3. Li, X. 1997. The Toxicity of Ammonia to Atlantic Silverside (Menidia menidia) andGhost Shrimp (Palaemonetes pugio). M.S. Thesis, Virginia Polytechnic Institute andState University, Blacksburg, Virginia, USA.
4. Hudgins, D.B.. 1996. The Toxicity of Ammonia to the Marine Organisms,Sheepshead Minnow (Cyprinodon variegatus), Mysid (Mysidopsis bahia) and GrassShrimp (Palaemonetes pugio). M.S. Thesis, Virginia Polytechnic Institute and StateUniversity, Blacksburg, Virginia, USA.
5. Barnabe, G. 1990. Aquaculture, Vol. 1, Ellis Horwood Limited, Chichester, WestSussex, England.
6. Campbell, N.A. 1993. Biology, 3 ed. Benjamin/Cummings Publishing Company,Inc., Redwood City, California, USA.
7. Ricklefs, R.E. 1993. The Economy of Nature, 3 ed. W.H. Freeman and Company,New York, New York, USA.
8. Wuhrmann, K., and H. Woker 1948. Experimentelle Untersuchungen uber dieZyanidlosungen mit verschiedener Sauerstoffspannung und Temperatauf Fische (anEnglish interpretation). Schweizeriche Zeitschrift fuer Hudrologie. 15 (235-260).
9. American Public Health Association, American Water Works Association, andWater Pollution Control Federation 1995. Standard Methods for the Examinationof Water and Wastewater. 19th ed., American Public Health Association, WashingtonDC., USA.
10. Emerson, K., R.C. Russo, R.E. Lund, and R.V. Thurston 1975. Aqueous ammoniaequilibrium calculations: effect of pH and temperature. Journal of the FisheriesResearch Board of Canada 32: 2379- 2383.
11. Alabaster, J.S., D.G. Shurben, and G. Knowles 1979. The effect of dissolvedoxygen and salinity on the toxicity of ammonia to smolts of salmon, Salmo salar.Journal of Fish Biology. 5: 705-712.

66
12. Hampson, B.L. 1976. Ammonia concentration in relation to ammonia toxicity duringa rainbow trout rearing experiment in a closed freshwater-seawater system.Aquaculture. 9: 61-70.
13. Martinelle, K., and L. Haggstrom 1993. Mechanisms of Ammonia and AmmoniumIon Toxicity in Animal Cells: Transport Across Cell Membranes. Journal ofBiotechnology 30 (339-350).
14. Goldstein, L., J.B. Claiborne, D.E. Evans. 1982. Rapid communication – ammoniaexcretion by the gills of two marine teleost fish: the importance of NH4
+ permeance.Journal of Experimental Zoology. 219: 395-397.
15. Vedel, N.E., B. Korsgaard, and F.B. Jensen 1998. Isolated and combined exposureto ammonia and nitrite in rainbow trout (Oncorhynchus mykiss): effects on electrolytestatus, blood respiratory properties and brain glutamine/ glutamate concentrations.Aquatic Toxicology. 41: 325-342.
16. Kawabata, Z., T. Yoshida and H. Nakagawa 1997. Effects of Ammonia on theSurvival of Zacco platypus (Temmick and Schlegel) at Each Developmental Stage.Environmental Pollution 95 (2) 213-218.
17. Thurston, R.V., R.C. Russo, and G.A. Vinogradov 1981. Ammonia Toxicity toFishes. Effect of pH on the Toxicity of the Un-ionized Ammonia Species.Environmental Science and Technology 15 (7) 837- 840.
18. Thurston, R.V., R.C. Russo, and C.E. Smith 1978. Acute Toxicity of Ammoniaand Nitrite to Cutthroat Trout Fry. Transactions of the American Fisheries Society.107 (2) 361-368.
19. Knoph, M.B. 1992. Acute Toxicity of Ammonia to Atlantic Salmon (Salmo salar)parr. Comprehensive Biochemistry and Physiology. 101C (2): 275-282.
20. Arthur, J.W., C.W. West, K.N. Allen, and S.F. Hedtke 1987. Seasonal Toxicity ofAmmonia to Five Fish and Nine Invertebrate Species. Bulletin of EnvironmentalContamination and Toxicology. 38 (324-331).
21. Mayes, M.A., H.C. Alexander, and D.L. Hopkins 1986. Acute and ChronicToxicity of Ammonia to Freshwater Fish: A Site-Specific Study. EnvironmentalToxicology and Chemistry 5 (437-442).
22. Gerish, F.M., and D.L. Hopkins 1986. Site-Specific Acute and Chronic Toxicity ofAmmonia to Daphnia magna straus. Environmental Toxicology and Chemistry. 5(443-447).

67
23. Person-Le Ruyet, J., R. Galland, A. LeRoux, and H. Chartois 1997. ChronicAmmonia Toxicity in Juvenile Turbot (Scophthalmus maximus). Aquaculture 154(155-171).
24. US EPA 1991. Methods for Measuring the Acute Toxicity of Effluents and ReceivingWaters to Freshwater and Marine Organisms. EPA 600/4-90/027. Office of Researchand Development, U.S. EPA, Cincinnati, OH, USA.
25. US EPA 1989. Short-term Methods for Estimating the Chronic Toxicity of Effluentsand Receiving Waters to Freshwater and Marine Organisms. EPA 600/4-89/001.Office of Research and Development, U.S. EPA, Cincinnati, OH, USA.
26. Gosner, K.L. 1979. A Field Guide to the Atlantic Seashore. Houghton- MifflinCompany, Boston, Massachusetts, USA.
27. Northeast Fisheries Science Center [Unknown] Available:http://gopher.wh.whoi.edu [9/8/97].
28. Scott, W.B., and M.G. Scott 1988. Atlantic Fishes of Canada, University of TorontoPress, Toronto, Ontario, Canada.
29. Martin, F.D. and G.E. Drewry 1978. Development of Fishes of the Mid-AtlanticBight: An Atlas of Egg, Larval, and Juvenile Stages. Vol. VI- Stromateidae throughOgcocephalidae, 3 ed. Biological Services Program, Fish and Wildlife Service, U.S.Department of the Interior. FWS/OBS-78/12.
30. McVeigh, P.J. 1995. Treatment of Blue Crab Processing Wastewater Using UpflowAnaerobic Sludge Blanket (UASB) and Air Stripping Technologies. M.S. Thesis,Virginia Polytechnic Institute and State University, Blacksburg, Virginia, USA.
31. Diz, H.R. 1994. Anaerobic/Aoerobic Pretreatment of Blue Crab (Callinectes sapidus)Cooker Wastewater. M.S. Thesis, Virginia Polytechnic Institute and State University,Blacksburg, Virginia, USA.
32. Wolfe, C.L. 1993. Biological and Physical Treatment of Crab Processing IndustryWastewater. M.S. Thesis, Virginia Polytechnic Institute and State University,Blacksburg, Virginia, USA.
33. Bengston, D.A., G. Bisbal, H. Iken, and R.P. Athanas. 1994. Culture of SummerFlounder Paralichthys dentatus: Research on hatchery and growout phases. Journalof Shellfish Research 13: 312.
34. Bengston, D.A., G. Nardi. 1995. Summer Flounder culture: An update on research
and the development of an industry. Journal of Shellfish Research 14: 239.

68
35. Nardi, G. 1996. Culture of Summer Flounder, Paralichthys dentatus, at GreatBayAquafarms. Journal of Shellfish Research 15: 458.
69
Additional References
Gilbert, R.O. 1987. Statistical Methods for Environmental Pollution Monitoring. VanNostrand Reinhold, New York, New York, USA.
Klassen, C.D. 1996. Casarett and Doull’s Toxicology: The Basic Science of Poisons. 5ed. McGraw-Hill Companies, Inc. New York, New York, USA.
Snoeyink, V.L. and D. Jenkins 1980. Water Chemistry. John Wiley & Sons, NewYork, New York, USA.

70
Appendix A
% Unionized Ammonia as a Function of pH, Temperature, and Salinity
Salinity = 18-22 ppt
pHTemp(0C) pKa 7.5 7.6 7.7 7.8 7.9 8.0 8.1 8.2 8.3 8.4
0 10.1 0.251 0.315 0.397 0.499 0.627 0.788 0.990 1.24 1.56 1.965 9.94 0.362 0.455 0.572 0.719 0.904 1.14 1.42 1.79 2.24 2.8010 9.78 0.522 0.656 0.825 1.04 1.30 1.63 2.05 2.56 3.21 4.0015 9.61 0.770 0.968 1.22 1.53 1.91 2.40 3.00 3.74 4.67 5.8120 9.45 1.11 1.39 1.75 2.19 2.74 3.43 4.28 5.32 6.61 8.1825 9.29 1.60 2.00 2.51 3.13 3.91 4.88 6.06 7.52 9.28 11.4
Salinity = 23-27 ppt
pHTemp(0C) pKa 7.5 7.6 7.7 7.8 7.9 8.0 8.1 8.2 8.3 8.4
0 10.13 0.234 0.294 0.370 0.466 0.585 0.736 0.925 1.16 1.46 1.835 9.97 0.338 0.425 0.534 0.672 0.844 1.06 1.33 1.67 2.09 2.6210 9.81 0.487 0.613 0.770 0.968 1.22 1.53 1.91 2.40 3.00 3.7415 9.64 0.719 0.904 1.14 1.42 1.79 2.24 2.80 3.50 4.37 5.4420 9.48 1.04 1.30 1.63 2.05 2.56 3.21 4.00 4.99 6.20 7.6825 9.32 1.49 1.87 2.34 2.93 3.66 4.57 5.68 7.05 8.72 10.7
Salinity = 28-31 ppt
pHTemp(0C) pKa 7.5 7.6 7.7 7.8 7.9 8.0 8.1 8.2 8.3 8.4
0 10.14 0.229 0.288 0.362 0.455 0.572 0.719 0.904 1.14 1.42 1.795 9.98 0.330 0.415 0.522 0.656 0.825 1.04 1.30 1.63 2.05 2.5610 9.82 0.476 0.599 0.753 0.946 1.19 1.49 1.87 2.34 2.93 3.6615 9.65 0.703 0.883 1.11 1.39 1.75 2.19 2.74 3.43 4.28 5.3220 9.49 1.01 1.27 1.60 2.00 2.51 3.13 3.91 4.88 6.06 7.5225 9.33 1.46 1.83 2.29 2.87 3.58 4.47 5.56 6.90 8.54 10.5

71
Salinity = 32-40 ppt.
pHTemp(0C) pKa 7.5 7.6 7.7 7.8 7.9 8.0 8.1 8.2 8.3 8.4
0 10.2 0.218 0.275 0.346 0.435 0.547 0.687 0.863 1.08 1.36 1.715 10.0 0.315 0.397 0.499 0.627 0.788 0.990 1.24 1.56 1.96 2.4510 9.84 0.455 0.572 0.719 0.904 1.14 1.42 1.79 2.24 2.80 3.5015 9.67 0.672 0.844 1.06 1.33 1.67 2.09 2.62 3.28 4.09 5.1020 9.51 0.968 1.22 1.53 1.91 2.40 3.00 3.74 4.67 5.81 7.2025 9.35 1.39 1.75 2.19 2.74 3.43 4.28 5.32 6.61 8.18 10.1

72
Appendix B
Results of Individual Tests
Individual 48-Hour Acute Test Results for Summer Flounder
Date Water
TotalLC50
(mg/L)
TotalNOEC(mg/L)
Avg.pH Sal.
Un-ion.LC50
(mg/L)
Un-ion.NOEC(mg/L)
9/12/96 Syn. 26.7(24.0-29.4)
20.0 8.17 30 1.22(1.10-1.34)
0.914
2/14/97 Syn. 25.7(22.7-28.6)
20.0 8.19 30 1.23(1.09-1.37)
0.955
Avg. - 26.2(23.4-29.0
20.0 8.19 30 1.22(1.09-1.35)
0.934
4-rep. - 26.2(24.2-28.2)
20.0 8.18 30 1.22(1.13-1.31)
0.934
10/8/97 Nat. 22.9(20.0-25.9)
10.0 8.18 27 1.09(0.954-1.23)
0.477
Individual 96-Hour Acute Test Results for Summer Flounder
Date Water
TotalLC50
(mg/L)
TotalNOEC(mg/L)
Avg.pH
Sal. Un-ion.LC50
(mg/L)
Un-ion.NOEC(mg/L)
10/10/97 Syn. 22.3(19.2-25.3)
10 8.18 27 1.06(0.916-1.21)
0.477
10/14/97 Syn. 22.6(19.9-25.3)
20 8.19 27 1.10(0.973-1.23)
0.976
Avg. - 22.4(19.6-25.3)
15.0 8.19 27 1.08(0.944-1.22)
0.726
4 Rep. - 22.4(20.3-24.6)
10 8.19 27 1.07(0.968-1.17)
0.477
10/11/97 Nat. 18.6(16.2-21.0)
10 8.18 27.3 0.889(0.776-1.00)
0.477

73
Individual 48-Hour Acute Test Results for Atlantic Silverside.
Date
TotalLC50
(mg/L)
TotalNOEC(mg/L)
Avg.pH Sal.
Un-ion.LC50
(mg/L)
Un-ion.NOEC(mg/L)
12/11/97 28.8(26.3-31.3)
20 8.20 26 1.44(1.31-1.56)
0.997
2/19/98 28.9(25.6-32.2)
10 8.20 8.3 1.68(1.48-1.87)
0.581
2/25/98 26.4(22.0-30.9)
10 8.19 8.3 1.50(1.25-1.75)
0.568
Avg. 28.0(24.6-31.4)
13.3 8.20 14.2 1.54(1.35-1.73)
0.715
6-rep. 27.9(25.8-29.9)
10 8.20 14.2 1.52(1.41-1.63)
0.544
Individual 96-Hour Acute Test Results for Atlantic Silverside.
Date
TotalLC50
(mg/L)
TotalNOEC(mg/L)
Avg.pH Sal.
Un-ion.LC50
(mg/L)
Un-ion.NOEC(mg/L)
12/13/97 21.5(18.2-24.8)
10 8.20 26 1.07(0.908-1.24)
0.499
2/19/98 21.2(18.3-24.2)
20 8.20 8.3 1.23(1.06-1.40)
1.16
2/25/98 22.2(19.0-25.4)
10 8.19 8.3 1.26(1.08-1.44)
0.568
Avg. 21.7(18.5-24.8)
13.3 8.20 14.2 1.19(1.02-1.36)
0.743
6-rep. 21.6(19.8-23.5)
20 8.20 14.2 1.18(1.08-1.28)
1.09

74
Individual 48-Hour Acute Test Results for Quahog Clam (Salinity=30 ppt)
Date
TotalLC50
(mg/L)
TotalNOEC(mg/L)
Avg.pH
Un-ion.LC50
(mg/L)
Un-ion.NOEC(mg/L)
8/18/97 4895(3552-6237)
800 8.18 229(166-291)
37.4
8/19/97 4532(3586-5479)
800 8.18 212(167-256)
37.4
8/23/97 4473(3362-5584)
800 8.19 213(160-267)
38.2
Avg. 4633(3500-5767)
800 8.18 218(165-271)
37.6
6-rep. 4619(3975-5262)
800 8.18 216(186-246)
37.4
Individual 96-Hour Acute Test Results for Quahog Clam
Date
TotalLC50
(mg/L)
TotalNOEC(mg/L)
Avg.pH
Un-ion.LC50
(mg/L)
Un-ion.NOEC(mg/L)
8/11/97 802(529-1075)
200 8.2 39.1(25.8-52.4)
9.76
8/13/97 905(670-1140)
200 8.2 44.1(32.7-55.6)
9.76
8/23/97 652(465-838)
200 8.18 30.4(21.7-39.1)
9.34
Avg. 786(555-1017)
200 8.19 37.9(26.7-49.1)
9.62
6-rep. 784(652-917)
200 8.18 36.6(30.5-42.8)
9.34

75
Individual 7-day Chronic Test Results for Summer Flounder (Salinity=30ppt)
Date
TotalLC50
(mg/L)
TotalNOEC(mg/L)
TotalLOEC(mg/L)
Avg.pH
Un-ion.LC50
(mg/L)
Un-ion.NOEC(mg/L)
Un-ion.LOEC(mg/L)
9/14/96 20.3(17.5-23.2)
2.5 5 8.19 1.37(1.18-1.57)
0.169 0.338
2/17/97 20.2(18.0-22.4)
5 10 8.19 1.37(1.22-1.52)
0.338 0.676
Avg. 20.3(17.7-22.8)
3.75 7.5 8.19 1.37(1.20-1.54)
0.253 0.507
6-rep. 20.3(18.4-22.1)
5 10 8.19 1.37(1.25-1.49)
0.338 0.676

76
Appendix CResults of Single Factor ANOVA Analysis
Flounder 48-hour Acute Tests48 syn 48 nat1.22 1.091.23
Anova: Single Factor
SUMMARYGroups Count Sum Average Variance48 syn 2 2.45 1.225 5E-0548 nat 1 1.09 1.09 #DIV/0!
ANOVASource ofVariation
SS df MS F P-value F crit
BetweenGroups
0.01215 1 0.01215 243 0.040783 161.4462
WithinGroups
5E-05 1 5E-05
Total 0.0122 2
Flounder 96-hour Acute Tests96 syn 96 nat1.06 0.8891.10
Anova: Single Factor
SUMMARYGroups Count Sum Average Variance96 syn 2 2.16 1.08 0.000896 nat 1 0.889 0.889 #DIV/0!
ANOVASource ofVariation
SS df MS F P-value F crit
BetweenGroups
0.024321 1 0.024321 30.40083 0.11422 161.4462
WithinGroups
0.0008 1 0.0008
Total 0.025121 2

77
Atlantic Silverside 48-hour Acute Test v. 14 pptNatural 14 ppt
1.44 1.521.68 1.521.5 1.47
Anova: Single Factor
SUMMARYGroups Count Sum Average VarianceNatural 3 4.62 1.54 0.015614 ppt 3 4.51 1.503333 0.000833
ANOVASource ofVariation
SS df MS F P-value F crit
BetweenGroups
0.002017 1 0.002017 0.245436 0.646289 7.70865
WithinGroups
0.032867 4 0.008217
Total 0.034883 5
Atlantic Silverside 48-hour Acute Test v. 22 pptNatural 22 ppt
1.44 1.141.68 1.271.5 1.13
Anova: Single Factor
SUMMARYGroups Count Sum Average VarianceNatural 3 4.62 1.54 0.015622 ppt 3 3.54 1.18 0.0061
ANOVASource ofVariation
SS df MS F P-value F crit
BetweenGroups
0.1944 1 0.1944 17.91705 0.01334 7.70865
WithinGroups
0.0434 4 0.01085
Total 0.2378 5

78
Atlantic Silverside 48-hour Acute Test v. 30 pptNatural 30 ppt
1.44 1.151.68 1.031.5 1.05
Anova: Single Factor
SUMMARYGroups Count Sum Average VarianceNatural 3 4.62 1.54 0.015630 ppt 3 3.23 1.076667 0.004133
ANOVASource ofVariation
SS df MS F P-value F crit
BetweenGroups
0.322017 1 0.322017 32.63682 0.004644 7.70865
WithinGroups
0.039467 4 0.009867
Total 0.361483 5
Atlantic Silverside 96-hour Acute Test v. Literature Valuesnat water Lit.
1.07 0.971.231.26
Anova: Single Factor
SUMMARYGroups Count Sum Average Variance
nat water 3 3.56 1.186667 0.010433Other 1 0.97 0.97 #DIV/0!
ANOVASource ofVariation
SS df MS F P-value F crit
BetweenGroups
0.035208 1 0.035208 3.374601 0.207612 18.51276
WithinGroups
0.020867 2 0.010433
Total 0.056075 3

79
Appendix DOrganism Suppliers
GreatGay Aquafarms153 Gosling RoadPortsmouth, NH 03801(603) 430-8057
Sea Plantations, IncorporatedPO Box 848Salem, Massachusetts 01970(978) 745-4560
Cherrystone AquafarmsPO Box 347Cheriton, VA 23316(804) 331-1208