this project has received funding from the european -...
TRANSCRIPT


2
This project has received funding from the European Union’s Seventh Framework Programme for research, technological development and demonstration under grant agreement no 266800
Assessing China’s Economic and Financial Prospects
within the Context of Global Imbalances
Terry McKinley
Affiliations of author: SOAS, University of London
Abstract: This deliverable develops two medium-term projections for China’s economic and
financial development over the next ten years based on utilizing the CAM global macro-
econometric model. The first projection is a Baseline Scenario that assumes continuing global
imbalances in economic growth and current accounts among major countries and blocs (i.e.,
China, USA, the EU and Other East Asian High-Income Countries). The second projection is an
Alternative Policy Scenario that programs improvements in such global imbalances. In addition,
the deliverable discusses, in more detail, China’s international financial position and its domestic
financial conditions, especially the degree of different forms of indebtedness.
Key words: Economic Growth, Current Account Imbalances, Capital Account, Indebtedness.
Journal of Economic Literature classification ###, ###
Date of publication as FESSUD Working Paper: 144, 2016
Contact details: [email protected]
Acknowledgments:
The research leading to these results has received funding from the European Union Seventh
Framework Programme (FP7/2007-2013) under grant agreement n° 266800.
Website: www.fessud.eu
3
This project has received funding from the European Union’s Seventh Framework Programme for research, technological development and demonstration under grant agreement no 266800
I. Introduction This FESSUD Working Paper #144 first assesses the future economic and financial
prospects of the People‘s Republic of China within the current and projected global
context of slow economic growth and current-account imbalances. It then projects
China‘s prospects within an alternative scenario in which global imbalances in
economic growth and current-account balances are modified.
As is now widely recognized, global economic trends have worsened appreciably
since mid-2015. For example, in its April World Economic Outlook the IMF
downgraded its estimate of the global rate of economic growth for 2016 to 3.2% (IMF
2016). This estimate was a downgrading from its estimate of 3.4% published in
January 2016; and the January estimate was, in turn, a downgrading from its estimate
of 3.6% in its October 2015 World Economic Outlook. And in late July, in the wake of
the UK‘s Brexit vote, the IMF has downgraded its estimate of 2016 to just 3.1%.
Substantial current-account imbalances at the global level are also projected to persist.
The most prominent are between those countries such as the USA and the United
Kingdom that suffer from large current-account deficits, and those countries such as
China, Germany, Japan and other key East Asian economies that enjoy large current-
account surpluses.
Financial imbalances have also become an increasingly serious problem at the global
level. Some countries, such as the USA, have a large positive net external asset
position while others, such as Brazil, suffer from a large negative net external asset
position. Simply put, US citizens own many more foreign financial assets than
foreigners own US financial assets. And Brazil suffers from the opposite problem,
namely, foreigners own many more Brazilian domestic financial assets than Brazilians
own foreign financial assets.
This imbalance tends to put Brazil at a disadvantage because if it experiences
economic problems, such as slow or declining economic growth, foreigners are likely
to quickly disown its financial assets and move their funds out of the country.
However, such a rapid trend depends crucially on the proportion of short-term
Brazilian financial assets that foreigners own. Such assets are represented mostly by
portfolio investment or ‗other investment‘ e.g., bank lending.
This Working Paper starts its analysis by first describing the historical trends in GDP
growth and current-account balances across major countries and blocs of countries
between 2002 and 2016. Thereafter it uses a global macro-econometric model, the
CAM, to project the trends in these two variables through 2026. This is considered a
medium-term projection.

4
This project has received funding from the European Union’s Seventh Framework Programme for research, technological development and demonstration under grant agreement no 266800
The CAM model is distinctive in being a demand-led and stock-flow consistent model
that also does not assume general equilibrium (see Cripps, Izurieta and McKinley
2007 and Cripps and Godley 1976). The CAM relies on using a huge databank of UN
statistics stretching back to 1970 to depict historical trends. However, usually for the
two latest years—in this case 2015 and 2016—it is deliberately aligned with IMF
estimates (published in either its October or April World Economic Outlooks).
Thereafter the model‘s real strengths lie in projecting medium-term trends, such as
over the next 10-15 years. For this Working Paper we carry out projections over 10
years, namely, to 2026.
At the global level, this Working Paper focuses its analysis on China but compares its
trends to those in the United States of America, the European Union, and a major bloc
of countries is lablelled ‗Other East Asian High-Income Countries‘. This latter
grouping is dominated by Japan and the Republic of Korea. Together these four blocs
have accounted recently for at least 70% of global GDP.
II. Baseline Global Trends in Economic Growth
Our first objective is to utilize the CAM to produce projections for what we
customarily call a ‗Baseline‘ Scenario. Such a scenario projects forward, over the
medium term, established historical trends, such as of economic growth. Such a
Baseline Scenario would assume, at most, only minimal well-established changes in
policies. An example would be the €315 billion Juncker investment plan being
implemented in the European Union.
Later in this Working Paper, we will construct an ‗Alternative Policy Scenario‘. Such
a scenario will incorporate major policy changes into its programming and test the
results. For recent concrete examples of such scenario-building read the Policy Briefs
by Cozzi and McKinley 2015 and Cozzi, McKinley and Michell 2014.
We report first on the projected global trends in GDP growth that are generated by the
‗Baseline‘ Scenario. Table 1 reports on the historical trends (for 2002-2016) and the
projected trends (for 2017-2021 and 2022-2026) for average GDP growth. Note that
GDP is calculated by the CAM at market rates.
Table 1. Average GDP Growth (%)
Baseline Scenario
Historical Projections
2002-2006 2007-2011 2012-2016 2017-2021 2022-2026
China 10.7 10.7 7.1 6.5 6.5
United States 2.9 0.6 2.1 1.2 1.3
European Union 2.2 0.7 0.9 1.2 1.2
Other East Asia High Income 2.3 1.0 1.2 2.4 2.3

5
This project has received funding from the European Union’s Seventh Framework Programme for research, technological development and demonstration under grant agreement no 266800
Global 3.4 2.2 2.2 2.3 2.5
First we report on results for the global economy. Table 1 shows that global growth of
GDP (at market rates) has slowed from an average of 3.4% during 2002-2006 (before
the global crisis) to 2.2% during the most recent period of 2012-2016.
The CAM model projects that global economic growth would increase over the next
ten years though this increase would be very modest. The average GDP growth for the
period 2017-2021 would be 2.3% and for the period 2022-2026 still only 2.5%.
Hence, continuing economic stagnation appears to be the likeliest medium-term
outcome for the global economy.
What does such a prospect imply for China? China‘s growth has declined noticeably
over the last 15 years, from an average of 10.7% during 2002-2006 to 7.1% during
2012-2016. But a 7% average rate of economic growth is still impressive.
Moreover, the CAM projects that this average rate would decline only modestly over
the next ten years, i.e., between 2017 and 2026. It would still average 6.5%. Hence,
China‘s economic growth would still contrast sharply with the global context of
secular stagnation.
In contrast, ‗Other East Asia High-Income‘ countries (e.g., Japan and the Republic of
Korea) are projected to roughly mirror the modest rate of global economic growth
over the next ten years: the CAM projects that this bloc‘s average rate would remain at
about 2.3% to 2.4%.
However, such a rate of growth would represent an improvement. During the most
recent period of 2012-2016, this bloc had average GDP growth of only 1.2%
(primarily because of persistent stagnation in Japan, where economic growth has been
below 1%).
Both the European Union and the USA are projected to grow even more slowly than
the bloc of East Asian High-Income countries. During 2012-2016 the average
economic growth of the EU is reported to be only 0.9%. And over the next ten years,
this rate is projected to rise to only about 1.2%. Hence, such a low rate would
contribute to pulling down global economic growth.
Moreover, the vote for Brexit in the United Kingdom on June 23, 2016 is very likely
to lead to significantly lower economic growth in this country for the rest of this year
and beyond, and could well have knock-on effects on the rest of Europe.
The growth of GDP in the USA is projected to worsen over the next ten years. While
this country‘s economic growth achieved a credible average of 2.1% during 2012-
2016 (namely, a rate comparable to that of the global economy), this would drop to
only 1.2% to 1.3% during 2017-2026. This is an alarming prospect since the USA has
6
This project has received funding from the European Union’s Seventh Framework Programme for research, technological development and demonstration under grant agreement no 266800
been one of the few Developed Economies that has been helping to drive global
economic growth.
In other words, the USA would no longer be expected to function as an engine of
economic growth for the global economy. Instead, it would join the EU, as well as
Japan, in dragging down the rate of global growth. Only China represents the one clear
exception in our table (despite a modest projected slowdown): it is expected to
continue boosting global economic growth.
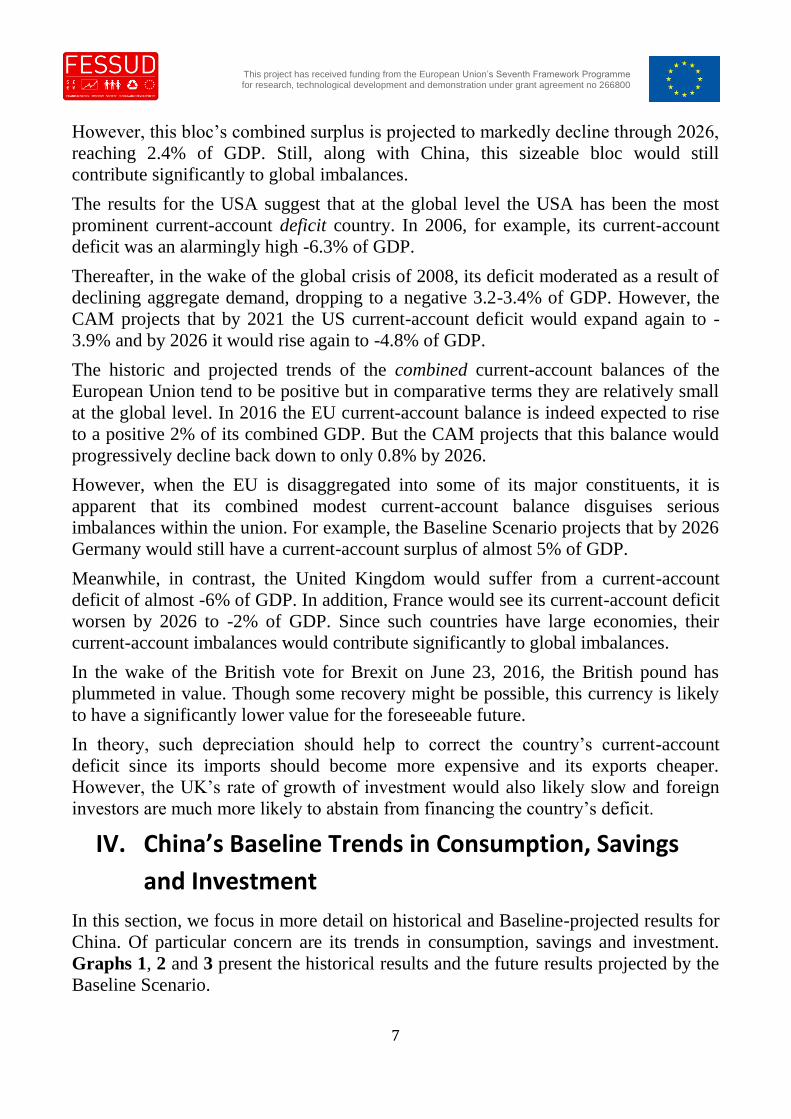
III. Baseline Global Trends in Current Accounts
In this section we focus our attention on current-account balances for China as well as
the USA, the European Union and East Asian High-Income countries. Table 2 reports
on the historical yearly averages and the yearly averages for our four global blocs of
countries projected by our baseline scenario. The historical data are provided for 2002,
2006, 2011 and 2016 (i.e., every five years). The projected data for the Baseline
Scenario are provided for 2021 and 2026.
The historical results suggest that while China‘s current-account surplus dipped from
the very high level of 7.9% of GDP in 2006 to only 1.6% in 2011 (in the aftermath of
the global financial crisis), it improved significantly thereafter, rising back up to 4.4%
of GDP in 2016.
The Baseline Scenario suggests that China would maintain a comparable current-
account surplus through 2021, and by 2026 this surplus would decline only marginally
to 3.9% of GDP. Hence, China would continue to play a major role in contributing to
global imbalances.
Table 2. The Current Account as % of GDP
Baseline Scenario
Historical Projections
2002 2006 2011 2016 2021 2026
China 2.7 7.9 1.6 4.4 4.6 3.9
United States -3.7 -6.3 -3.4 -3.2 -3.9 -4.8
European Union 0.9 0.2 0.5 2.0 1.1 0.8
Other East Asia High Income 3.3 3.9 2.8 5.2 2.7 2.4
The historical results for East Asian High-Income countries suggest that they have
rapidly expanded their current-account surplus in recent years. Between 2011 and
2016 this bloc-level surplus has risen back up from 2.8% of GDP to 5.2%, the latter
being even higher than the surplus achieved by China (i.e., 4.4%).
7
This project has received funding from the European Union’s Seventh Framework Programme for research, technological development and demonstration under grant agreement no 266800
However, this bloc‘s combined surplus is projected to markedly decline through 2026,
reaching 2.4% of GDP. Still, along with China, this sizeable bloc would still
contribute significantly to global imbalances.
The results for the USA suggest that at the global level the USA has been the most
prominent current-account deficit country. In 2006, for example, its current-account
deficit was an alarmingly high -6.3% of GDP.
Thereafter, in the wake of the global crisis of 2008, its deficit moderated as a result of
declining aggregate demand, dropping to a negative 3.2-3.4% of GDP. However, the
CAM projects that by 2021 the US current-account deficit would expand again to -
3.9% and by 2026 it would rise again to -4.8% of GDP.
The historic and projected trends of the combined current-account balances of the
European Union tend to be positive but in comparative terms they are relatively small
at the global level. In 2016 the EU current-account balance is indeed expected to rise
to a positive 2% of its combined GDP. But the CAM projects that this balance would
progressively decline back down to only 0.8% by 2026.
However, when the EU is disaggregated into some of its major constituents, it is
apparent that its combined modest current-account balance disguises serious
imbalances within the union. For example, the Baseline Scenario projects that by 2026
Germany would still have a current-account surplus of almost 5% of GDP.
Meanwhile, in contrast, the United Kingdom would suffer from a current-account
deficit of almost -6% of GDP. In addition, France would see its current-account deficit
worsen by 2026 to -2% of GDP. Since such countries have large economies, their
current-account imbalances would contribute significantly to global imbalances.
In the wake of the British vote for Brexit on June 23, 2016, the British pound has
plummeted in value. Though some recovery might be possible, this currency is likely
to have a significantly lower value for the foreseeable future.
In theory, such depreciation should help to correct the country‘s current-account
deficit since its imports should become more expensive and its exports cheaper.
However, the UK‘s rate of growth of investment would also likely slow and foreign
investors are much more likely to abstain from financing the country‘s deficit.
IV. China’s Baseline Trends in Consumption, Savings
and Investment
In this section, we focus in more detail on historical and Baseline-projected results for
China. Of particular concern are its trends in consumption, savings and investment.
Graphs 1, 2 and 3 present the historical results and the future results projected by the
Baseline Scenario.

8
This project has received funding from the European Union’s Seventh Framework Programme for research, technological development and demonstration under grant agreement no 266800
Graph 1 depicts the historical trend and the Baseline Projection for China‘s
consumption as a ratio to GDP. Consumption had already fallen substantially between
2000 and 2010, from 47.1% of GDP to 36.2%. Thereafter it began to reover, reaching
40.8% by 2016.
The Baseline Scenario projects that this percentage would continue rising sharply until
2018 and then begin to flatten out thereafter. By 2026, the last year of our projection,
consumption would reach 44.5% of GDP. This trend in consumption is consistent with
the projected decline in the current account as a % of GDP.
Graph 1. Consumption (% of GDP) in China
Baseline Scenario
Graph 2. Savings (% of GDP) in China
Baseline Scenario
0.00
10.00
20.00
30.00
40.00
50.00
60.00
19
80
19
82
19
84
19
86
19
88
19
90
19
92
19
94
19
96
19
98
20
00
20
02
20
04
20
06
20
08
20
10
20
12
20
14
20
16
20
18
20
20
20
22
20
24
20
26
% o
f G
DP
0
5
10
15
20
25
30
35
40
45
50
19
80
19
82
19
84
19
86
19
88
19
90
19
92
19
94
19
96
19
98
20
00
20
02
20
04
20
06
20
08
20
10
20
12
20
14
20
16
20
18
20
20
20
22
20
24
20
26
% o
f G
DP

9
This project has received funding from the European Union’s Seventh Framework Programme for research, technological development and demonstration under grant agreement no 266800
Graph 2 depicts how savings (as a % of GDP) has been falling markedly since 2008
(the onset of the global financial crisis). In 2008 this ratio was 46% but by 2016 it had
already fallen to 40.7%. Furthermore, the Baseline Scenario projects that savings
would decline further, namely to 32%, by 2026. This sharp downward trend is not
entirely consistent with the more restrained increase in consumption.
Graph 3. Investment (% of GDP) in China
Baseline Scenario
Graph 3 illustrates the trend in investment (as a % of GDP) in China. While in 2013 it
had been a little over 40%, it started falling significantly thereafter. The Baseline
Scenario projects that it would fall to 29.8% by 2020. Then it would start to level off,
dropping only to 29% by 2026. But this is still a relatively high level.
The three trends depicted above are consistent with an economy that is already
undergoing a structural transformation. Consumption would become a more important
factor in driving economic growth while investment would decline.
V. Framing an Alternative Policy Scenario
In order to improve the global economic outcomes over the next ten years, we have
programmed a set of policy changes that are focused on altering economic growth
rates and reining in current-account imbalances. We call this programming the
Alternative Policy Scenario.
Our focus in this Working Paper is on China. The results from our Baseline Scenario
suggest that the projected pace of its economic growth and the large size of its current-
0
5
10
15
20
25
30
35
40
45
19
80
19
82
19
84
19
86
19
88
19
90
19
92
19
94
19
96
19
98
20
00
20
02
20
04
20
06
20
08
20
10
20
12
20
14
20
16
20
18
20
20
20
22
20
24
20
26
% o
f G
DP

10
This project has received funding from the European Union’s Seventh Framework Programme for research, technological development and demonstration under grant agreement no 266800
account surpluses over the next ten years are likely to be unsustainable and contribute
to global economic instability.
In order to forestall such problems, our programming for China concentrated on
altering the relationship between savings and consumption. We explicitly programmed
a reduction in savings.
It was assumed that such an approach would increase consumption and thereby
increase imports. This increase in turn would reduce China‘s current-account surplus.
Such a strategy would be in line, for example, with China‘s long-term strategy of
shifting to more consumption-led economic growth.
A reduction in China‘s savings rate was already projected, in fact, by the Baseline
Scenario. As indicated in Graph 2, savings as a ratio to GDP dropped from about
41% in 2016 to about 32% in 2026. This trend was responsible, in part, for the
projected decline in China‘s current-account surplus to less than 4% of GDP.
As a complementary measure, we also programmed in our Alternative Scenario a
modest increase in China‘s real exchange rate as a further basis to narrow its current-
account surplus.
Most other countries face economic problems that are quite different from those for
China. For such countries, especially those in Europe, we programmed some increases
in both government income and expenditures. The primary intent of these changes was
to provide greater stimulus to their economies since continued austerity has dampened
their economic growth, especially through retarding investment.
The programming for the Alternative Policy Scenario also prioritised boosts to private
and public investment for countries in Europe and the USA. Generally, the targets for
investment as a ratio to GDP were 20-21% for the countries in Europe. But there was
a lower target for the USA and the United Kingdom, where investment has languished
well below 20%.
The principal objective of such programming was to have investment play the leading
role in reviving economic growth. This approach could be called an ‗Investment-Led‘
recovery strategy. For its rationale see, for example, the paper by Griffith-Jones and
Cozzi, ‗Investment-Led Growth: A Solution to the European Crisis‘ (Griffith-Jones
and Cozzi 2016).
However, there was no investment target for China since it has historically maintained
a relatively high rate, as illustrated previously in Graph 3. Moreover, since 2013,
China‘s investment has already been falling from its high plateau of about 40% of
GDP. By 2016 this ratio had declined to 36%. According to the projections of the
Baseline Scenario, this ratio would drop further to 29% of GDP by 2026.

11
This project has received funding from the European Union’s Seventh Framework Programme for research, technological development and demonstration under grant agreement no 266800
For Germany and the bloc of Other East Asian High Income Countries, which, like
China, run globally sizeable current-account surpluses, we also programmed increases
in their consumption.
By contrast, for the USA and the UK, which have run large current-account deficits,
we programmed modest decreases in their real exchange rates along with decreases in
their rate of consumption. However, their persistently large current-account deficits
proved to be particularly difficult to contain.
VI. The Policy Alternative: Trends in Economic Growth
Table 3 presents the results for GDP growth among our four global blocs and
countries as well as the world as a whole. It contrasts the results for what is called the
‗Baseline Scenario‘ (which assumes minimal changes in policy) to the results for the
scenario that is called the ‗Alternative Policy Scenario‘. The latter introduces the
alternative set of economic policies outlined above.
Based on the Alternative Policy Scenario‘s programmed reductions in savings and
appreciation of its real exchange rate, China‘s growth rate would decline to an average
of 5.6% during 2022-2026 while it would have remained 6.5% under the Baseline
Scenario (see Graph 4).
For the European Union as a whole, the Alternative Policy Scenario does provide a
greater initial boost to GDP growth. But the greatest contrast between the Baseline
Scenario and the Alternative Policy Scenario would occurs during 2017-2021, when
the European Union would grow at only 1.2% for the first scenario but 2.3% for the
second. Thereafter, however, it growth rate would decline, reaching the average of
1.5% during 2022-2026. In the wake of the recent Brexit vote by the United Kingdom,
this slow rate of economic growth is likely to drop even further.
Table 3. Average GDP Growth (%)
Alternative Policy Scenario
Projections Scenario 2017-2021 2022-2026
China 6.5 6.5 Baseline Scenario
5.3 5.6 Alternative Policy Scenario
United States 1.2 1.3 Baseline Scenario
1.8 2.0 Alternative Policy Scenario
European Union 1.2 1.2 Baseline Scenario
2.3 1.5 Alternative Policy Scenario
Other East Asia High Income 2.4 2.3 Baseline Scenario
3.5 3.1 Alternative Policy Scenario
Global 2.3 2.5 Baseline Scenario
2.8 2.9 Alternative Policy Scenario

12
This project has received funding from the European Union’s Seventh Framework Programme for research, technological development and demonstration under grant agreement no 266800
For the USA the contrast in GDP growth rates between the two scenarios is more
notable. During 2022-2026, for example, the USA would grow at only 1.3% under the
Baseline Scenario but it would achieve a 2.0% growth rate under the Alternative
Policy Scenario.
Under the Alternative Policy Scenario, the growth of GDP would improve in the bloc
of East Asian High-Income Countries (e.g., Japan and Republic of Korea), even
though there were only minimal policy changes, such as boosting consumption. While
this bloc‘s growth rate for 2022-2026 is projected to be 3.1% under the Alternative
Policy Scenario, it was only 2.3% under the Baseline Scenario.
Under the Alternative Policy Scenario, the programmed improvements in economic
growth in most of the blocs led to a global growth rate of GDP of 2.9% in 2022-2026.
This was only a moderate improvement over a 2.5% growth rate projected by the
Baseline Scenario for the same period. During 2012-2016, global economic growth
had been only 2.2%
Graph 4. Average GDP Growth of China
Baseline and Alternative Scenarios
Part of the reason for the restrained increase in global economic growth stimulated by
the Alternative Policy Scenario is that economic growth in China has been
programmed to slow down over the projected period. As already reported, during
0.00
2.00
4.00
6.00
8.00
10.00
12.00
14.00
16.00
%
Alternative Policy Scenario Baseline

13
This project has received funding from the European Union’s Seventh Framework Programme for research, technological development and demonstration under grant agreement no 266800
2022-2026 China‘s growth would decline to 5.6% under the Alternative Policy
Scenario. But it would have been maintained at a rate of 6.5% under the Baseline
Scenario.
VII. The Policy Alternative: Trends in Current Accounts
The Alternative Policy Scenario projects a sharp fall in China‘s current-account
surplus to 1.8% by 2026 (see Table 4). This contrasts sharply with the 3.9% surplus
projected by the Baseline Scenario in the same year—as well as China‘s surplus of
4.4% of GDP in 2016. Hence, the programmed declines in savings and the
corresponding increases in consumption had their intended effects.
Other East Asian High Income countries are also projected to experience a fall in their
combined current-account surplus. By 2026 their combined surplus would also be
1.8%. This contrasts with the 2.4% surplus projected by the Baseline Scenario for the
same year, and contrasts even more sharply with its 5.2% surplus in 2016.
It is striking, however, that under the Alternative Policy Scenario the current-account
deficit of the USA would still be -4% of GDP in 2026. For the Baseline Scenario it
was projected to be slightly worse, i.e., -4.8%. Yet it is worth noting that in 2016 the
US deficit is much smaller, at -3.2% of GDP.
Table 4. The Current Account as % of GDP
Alternative Policy Scenario
Projections Scenario 2021 2026
China
4.6 3.9 Baseline Scenario
2.7 1.8 Alternative Policy Scenario
United States
-3.9 -4.8 Baseline Scenario
-3.0 -4.0 Alternative Policy Scenario
European Union
1.1 0.8 Baseline Scenario
0.6 0.4 Alternative Policy Scenario
Other East Asia High Income
2.7 2.4 Baseline Scenario
2.3 1.8 Alternative Policy Scenario
So under either scenario the imbalance imparted to the global economy by the USA
would clearly worsen. It appears that while the USA remains the dominant reserve-
currency economy in the world, there would be great difficulty in fashioning a
progressive policy alternative that could substantially reduce its persistent structural
deficit.
The same logic applies to the United Kingdom within the European Union. Under the
Alternative Policy Scenario, for example, its deficit would still be -4.7% of GDP in

14
This project has received funding from the European Union’s Seventh Framework Programme for research, technological development and demonstration under grant agreement no 266800
2026. Given the Referendum result in late June 2016 and the consequent decline in the
value of the Pound, these projections would need to be modified.
As a bloc, however, the European Union would not contribute significantly to global
current-account imbalances. The Alternative Policy Scenario would reduce its small
overall surplus to only 0.4% of global GDP by 2026. This result would not be
significantly different from the 0.8% surplus expected under the Baseline Scenario.
VIII. China’s Alternative Trends in Consumption, Savings
and Investment
In this section we report the changes in Consumption, Savings and Investment in
China projected by our Alternative Policy Scenario through 2026. For these variables
Graphs 5, 6 and 7 present both the trends for the Baseline Scenario and those for the
Alternative Policy Scenario.
Graph 5. Consumption (% of GDP) in China
Comparing Baseline and Alternative Scenarios
Graph 5 illustrates that by 2026 our Alternative Policy Scenario would generate only
a modest rise in consumption in China relative to the level projected by the Baseline
Scenario. While consumption as a ratio to GDP would level off and stay at 44.5% by
2026 according to the Baseline Scenario, it would reach a plateau of 46.3% according
to the Alternative Policy Scenario.
0.00
10.00
20.00
30.00
40.00
50.00
60.00
19
80
19
82
19
84
19
86
19
88
19
90
19
92
19
94
19
96
19
98
20
00
20
02
20
04
20
06
20
08
20
10
20
12
20
14
20
16
20
18
20
20
20
22
20
24
20
26
% o
f G
DP
Alternative Policy Scenario Baseline Scenario

15
This project has received funding from the European Union’s Seventh Framework Programme for research, technological development and demonstration under grant agreement no 266800
Graph 6. Savings (% of GDP) in China
Comparing Baseline and Alternative Scenarios
Correspondingly Graph 6 shows that there would be a modest reduction in savings
(as % of GDP) in China between 2017 and 2026 under the Alternative Policy
Scenario. By 2026, the savings under the Baseline Scenario would drop to 32% of
GDP while under the Alternative Policy Scenario this variable would be somewhat
lower, namely, about 30%.
Graph 7. Investment (% of GDP) in China
Comparing Baseline and Alternative Scenarios
0
5
10
15
20
25
30
35
40
45
50
19
80
19
82
19
84
19
86
19
88
19
90
19
92
19
94
19
96
19
98
20
00
20
02
20
04
20
06
20
08
20
10
20
12
20
14
20
16
20
18
20
20
20
22
20
24
20
26
% o
f G
DP
Alternative Policy Scenario Baseline Scenario
0
5
10
15
20
25
30
35
40
45
19
80
19
82
19
84
19
86
19
88
19
90
19
92
19
94
19
96
19
98
20
00
20
02
20
04
20
06
20
08
20
10
20
12
20
14
20
16
20
18
20
20
20
22
20
24
20
26
% o
f G
DP
Alternative policy scenario Baseline
16
This project has received funding from the European Union’s Seventh Framework Programme for research, technological development and demonstration under grant agreement no 266800
Graph 7 shows that there would be virtually no difference between the Baseline
Scenario and the Alternative Policy Scenario with regard to investment. Both of them
project that investment would reach 29% of GDP by 2026. This is not surprising since
we did not program any boost to investment for this Scenario.
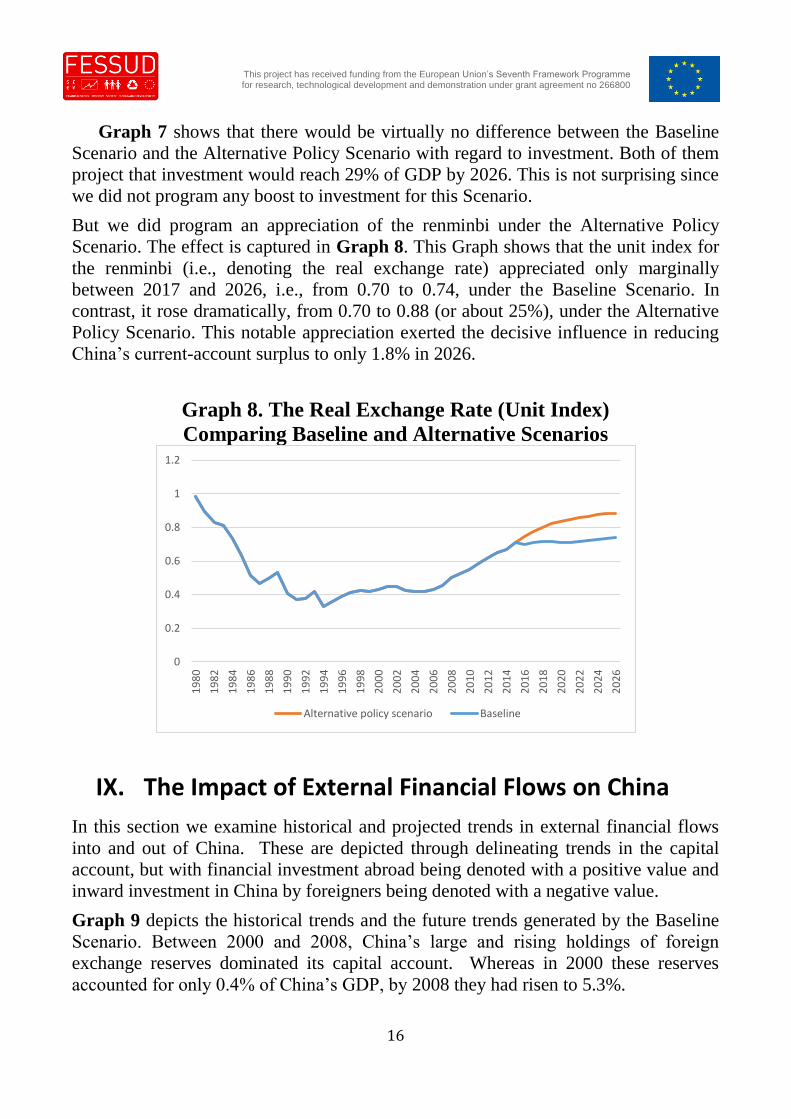
But we did program an appreciation of the renminbi under the Alternative Policy
Scenario. The effect is captured in Graph 8. This Graph shows that the unit index for
the renminbi (i.e., denoting the real exchange rate) appreciated only marginally
between 2017 and 2026, i.e., from 0.70 to 0.74, under the Baseline Scenario. In
contrast, it rose dramatically, from 0.70 to 0.88 (or about 25%), under the Alternative
Policy Scenario. This notable appreciation exerted the decisive influence in reducing
China‘s current-account surplus to only 1.8% in 2026.
Graph 8. The Real Exchange Rate (Unit Index)
Comparing Baseline and Alternative Scenarios
IX. The Impact of External Financial Flows on China
In this section we examine historical and projected trends in external financial flows
into and out of China. These are depicted through delineating trends in the capital
account, but with financial investment abroad being denoted with a positive value and
inward investment in China by foreigners being denoted with a negative value.
Graph 9 depicts the historical trends and the future trends generated by the Baseline
Scenario. Between 2000 and 2008, China‘s large and rising holdings of foreign
exchange reserves dominated its capital account. Whereas in 2000 these reserves
accounted for only 0.4% of China‘s GDP, by 2008 they had risen to 5.3%.
0
0.2
0.4
0.6
0.8
1
1.2
19
80
19
82
19
84
19
86
19
88
19
90
19
92
19
94
19
96
19
98
20
00
20
02
20
04
20
06
20
08
20
10
20
12
20
14
20
16
20
18
20
20
20
22
20
24
20
26
Alternative policy scenario Baseline

17
This project has received funding from the European Union’s Seventh Framework Programme for research, technological development and demonstration under grant agreement no 266800
Inward flows into China were dominated by Net Direct Investment (FDI), which
reached a peak of -1.8% of GDP in 2007. FDI continued to flow into China at a fairly
steady rate between 2008 and 2015. But net ‗other investment‘ (e.g., bank lending)
began to flow out of the country to a significant degree.
Graph 9. Capital Account (% of GDP) in China.
Baseline Scenario
As a result, the capital account began to increase (move in a positive direction)
beginning in 2013. This denoted that China was investing more abroad than foreigners
were investing in China. However, the projections by our Baseline Scenario suggest
that China‘s capital account stabilized around 3% to 3.5% of GDP throughout the
period 2017-2026.
The dominant outflow of capital was represented by the acquisition of foreign
exchange reserves. At the same time, ‗other investment‘ continued to be important,
though it exhibited a generally declining trend.
At the same time, capital inflows into China over this projected period were
dominated by Net Direct Investment though they amounted to only about 1% of GDP
per year. Under this scenario projected inward portfolio investment would remain
negligible.
-4.00
-3.00
-2.00
-1.00
0.00
1.00
2.00
3.00
4.00
5.00
6.00
7.00
20
00
20
01
20
02
20
03
20
04
20
05
20
06
20
07
20
08
20
09
20
10
20
11
20
12
20
13
20
14
20
15
20
16
20
17
20
18
20
19
20
20
20
21
20
22
20
23
20
24
20
25
20
26
% o
f G
DP
NET DIRECT INVESTMENT NET PORFOLIO INVESTMENT NET OTHER INVESTMENT
NET EXCHANGE RESERVES CAPITAL ACCOUNT

18
This project has received funding from the European Union’s Seventh Framework Programme for research, technological development and demonstration under grant agreement no 266800
Graph 10. Capital Account (% of GDP) in China.
Alternative Policy Scenario
Graph 10 depicts the results for the capital account that are generated by our
Alternative Policy Scenario. For this projection, the Net Capital Account would
remain below 3% of GDP and would progressively decline, dropping below 2% by
2024.
Even in 2016 Foreign Exchange Reserves would completely dominate the outflow of
capital from China. In that year they would represent 4.7% of GDP. However, the
relative size of these reserves would progressively decline over time, reaching about
3.1% of GDP by 2026.
The net inflow of capital into China would tend to remain below 1.5% of GDP. Net
Direct Investment would continue to dominate these inflows, accounting for 1% to
1.2% of GDP. Net Other Investment would supplement Net Direct Investment but the
former would not amount to more than about 0.5% of GDP over this period.
Hence, compared to many other major Emerging Economies, China is projected,
under our Alternative Policy Scenario, to have a fairly stable and positive capital
account, denoting, in this configuration, that its capital outflows (especially Foreign
Exchange Reserves) would far outweigh its capital inflows. Moreover, its capital
inflows would continue to be dominated by FDI, which tends to be more stable than
either Portfolio Investment or Net Other Investment.
-4.00
-3.00
-2.00
-1.00
0.00
1.00
2.00
3.00
4.00
5.00
6.00
7.00
20
00
20
01
20
02
20
03
20
04
20
05
20
06
20
07
20
08
20
09
20
10
20
11
20
12
20
13
20
14
20
15
20
16
20
17
20
18
20
19
20
20
20
21
20
22
20
23
20
24
20
25
20
26
% o
f G
DP
NET DIRECT INVESTMENT NET PORFOLIO INVESTMENT NET OTHER INVESTMENT
NET EXCHANGE RESERVES CAPITAL ACCOUNT

19
This project has received funding from the European Union’s Seventh Framework Programme for research, technological development and demonstration under grant agreement no 266800
The decline in the positive value of the capital account would mirror, in our
framework, the relative fall in China‘s current account. This would be reflected, in
particular, in the relative but slow decline in China‘s holdings of Foreign Exchange
Reserves.
X. Is China’s Rising Indebtedness Sustainable?
The projections produced by the CAM macro-econometric model for Working Paper
#141 provide useful scenarios for analysing the likely future external financial
trajectory of China. But data limitations do not allow this Working Paper to assess
historical trends in China‘s financial sector and to generate useful medium-term
projections of its trajectory.
Since the summer of 2015, there have been world-wide concerns about the financial
stability of the Chinese economy. On June 15, 2015, the value of China‘s stock market
suddenly tumbled and two major aftershocks followed soon afterwards, the first in late
July and the second in late August. During the second aftershock, China‘s Shanghai
Stock Exchange fell by about 8.5%, the largest drop since 2007. In response on
August 24th, major stock markets across the globe fell sharply, with the U.S. Dow
Jones index initially plummeting, for example, by 1000 points, its largest drop ever.
By December 2015 China‘s stock market appeared to have substantially recovered
from the sharp summer declines. But then in early January 2016 the stock market
plummeted again, this time by about 18%, and trading had to be halted. This apparent
meltdown triggered global financial instability. In response, the People‘s Bank of
China devalued the renminbi to its lowest level since 2011.
Given such China-induced financial instability between mid-2015 and mid-2016
(which has also been exacerbated recently by the United Kingdom‘s vote for Brexit),
this Working Paper devotes its last section to a more explicit examination of financial
trends in China. But in this endeavour it focuses its attention on China‘s debt
dynamics, which have emerged most recently as an overriding area of concern.
Data on the public debt of China‘s central government is certainly available to
international researchers but corresponding data on the various forms of private debt
(both for households and corporations) and even reliable data on local government
debt are not readily available. Various western institutions, including Moody‘s and
McKinsey, have attempted to produce estimates of such debt, especially since China
was shaken so badly by financial instability in late 2015 and early 2016 and this
instability threatened to have dire global repercussions.
For example, the McKinsey Global Institute has reported that China‘s total debt stood
at about 217% of GDP in 2014. By May 2016 Moody‘s raised this total to 280% of
GDP (McKinsey Global Institute 2015, Moody‘s 2016, Li 2016). Although dwarfed
by the debt levels of some Developed Economies, such as Japan and Singapore,

20
This project has received funding from the European Union’s Seventh Framework Programme for research, technological development and demonstration under grant agreement no 266800
China‘s level of total debt has been higher than that of almost all other emerging or
developing countries. Hence, the rapid rise in China‘s debt has alarmed many analysts.
However, within this total, China‘s external debt has remained fairly small. Moody‘s
has estimated that such debt represented no more than 9% of GDP in 2014 (Moody‘s
2016). Moreover, China does not appear to have any problems in servicing its external
obligations. Its net foreign asset position has remained solidly positive over recent
years.
At the end of 2015 China‘s public debt stood at about 40% of GDP, which represented
a fairly manageable level. Within this category, the share owed by China‘s central
government has remained fairly small, i.e., about 17% of GDP (Moody‘s 2016).
However, when all types of local government debt are also included, the estimate of
total public debt rises to about 60% (Prasad 2016).
Household debt is estimated to be relatively low—namely, less than 40% of GDP.
Most of this debt has taken the form of house mortgages. But, as is well known,
Chinese households have a fairly high savings rate so the probability of defaulting on
such mortgages is not high.
But the most troublesome form of debt in China appears to be corporate debt. Informal
estimates by the IMF suggest that this form of debt stood at about 160% of GDP
(Daniel, Garrido and Moretti 2016). But most of this corporate debt is owed by state-
owned enterprises and has taken the form of utilising domestic bank loans or bonds.
Moreover, since 2014 the Chinese government has been encouraging enterprises to
repay any foreign debt that they have incurred. The Bank of International Settlements
claims, for example, that this development partially explains the noticeable outflow of
capital from China in recent years (BIS 2016).
Although much of China‘s debt, both public and private, appears to be manageable, it
is still true that its total debt, as a ratio to GDP, has risen rapidly since the onset of the
global financial crisis in 2008. Some recent rough estimates claim, for example, that
just between 2008 and 2016 this ratio shot up from about 170% of GDP to even 280%.
In addition, there appears to be a significant share of non-performing loans in China‘s
corporate sector and local governments. For example, the IMF has warned recently
that about 15% of bank loans to Chinese corporations are at risk of not being repaid
(IMF 2016a). Also, many local governments probably do not have the revenue sources
that would enable them to repay their substantial public debts. Apparently, some of
them have already resorted, for example, to land sales in order to generate revenue for
this purpose.
However, by contrast, both governments and households appear to have sufficient
assets to enable them to effectively service their relatively manageable levels of debt.
Moreover, as the projections of Working Paper #141 suggest, China is likely to

21
This project has received funding from the European Union’s Seventh Framework Programme for research, technological development and demonstration under grant agreement no 266800
continue having a very large stockpile of foreign exchange reserves that it could
readily mobilize in order to meet any external debt obligations.
China‘s government also continues to have significant influence over the financial
activities of state-owned enterprises as well as state-owned banks. Also, the country‘s
banks appear to be fairly liquid and are financed mainly by deposits, which are
estimated to represent about 200% of GDP.
Moreover, China‘s capital account has not been completely liberalised. In fact, capital
controls were tightened in 2015 as private capital outflows began to increase.
Apparently in recent years many newly rich Chinese households have begun to buy
properties abroad, particularly in developed economies (Yang 2016).
In summary, China‘s total indebtedness—public and private as well as domestic and
foreign—appears to remain manageable. Both its high savings rate and the fiscal space
that its central government continues to command are potential shields against
financial instability.
In addition, its positive net external asset position, buttressed mainly by its sizeable
holdings of foreign exchange reserves as well as its rising trend of foreign investment,
could be mobilized in the event that its financial indebtedness (mainly by its ‗private‘
corporations and local governments) reached unsustainable levels.
XI. Concluding Remarks
This FESSUD Working Paper #144 has focused its attention on historical trends and
projections for the People‘s Republic of China. However, it has placed its focus on
China within a global historical and projected context within which differential growth
rates of GDP and current-account imbalances between major countries and blocs
would remain a major stumbling block to achieving global economic and financial
stability.
For example, under this Working Paper‘s Baseline Scenario for 2017-2026 that is
projected by the CAM global macroeconomic model, there would be sharp differences
in both rates of economic growth and current-account balances among four dominant
economic blocs or countries, i.e., China, the USA, the European Union and Other
East-Asian High Income countries.
For example, China is projected to grow at an average rate of 6.5% over 2017-2026.
However, both the United States and the European Union would experience much
slower average growth rates of GDP of only 1.2% to 1.3%.
Over this same projected period, China would achieve an average current-account
surplus of 3.9% to 4.6% while the USA would suffer from an average current-account
deficit of -3.9% to -4.8%. Other East Asia High Income countries (such as Japan and
the Republic of Korea) would also have average current-account surpluses of 2.4% to
2.7% of GDP over the projected period.

22
This project has received funding from the European Union’s Seventh Framework Programme for research, technological development and demonstration under grant agreement no 266800
While the European Union as a whole would not average current-account surpluses of
over 1.1% of GDP, the same could not be claimed for some of its large constituent
countries. For example, Germany would enjoy a current-account surplus of 5% of
GDP by 2026 while the United Kingdom would suffer from a deficit of -6%.
Hence, we have utilized the CAM global macroeconomic model in order to program
an Alternative Policy Scenario for 2017-2026 that is designed to narrow the sharp
global differences in rates of economic growth and current-account balances.
As a result, China‘s rate of economic growth would slow to an average of 5.3% to
5.6% over 2017-2026 while economic growth in the USA would rise from 1.8% to
2.0%. Over the same 10-year period economic growth would increase noticeably in
both the European Union and Other East Asian High Income.
As a result, global economic growth would be boosted—for example, to an average of
2.9% during 2022-2026, in contrast to only 2.5% under the Baseline Scenario.
The changes in China‘s rate of economic growth and its current-account balances
would stem from programmed changes in its savings and consumption and in its real
exchange rate. For example, its rate of savings is programmed to fall modestly and its
rate of consumption is programmed correspondingly to increase.
Combined with a pronounced drop in China‘s real exchange rate, this shift to a more-
consumption driven economy would lead to both a narrowing of its current-account
surplus and a relative slowdown in its economic growth—trends that are also likely to
be more sustainable and less detrimental, especially in terms of exacerbating global
imbalances.
The impact on the relative importance of different types of financial flows into and out
of China would also be noticeable under our Alternative Policy Scenario. China‘s
capital account would remain dominated by the outflow of its capital into holdings of
foreign exchange reserves. Additionally, the inflows of capital into China would
continue to be dominated by Direct Investment.
This kind of foreign investment is more stable and predictable than the erratic inflows
and outflows of both Portfolio Investment and Other Investment, which have
bedeviled many other major Emerging Economies. Both of these latter two forms of
financial inflows would remain fairly small in China over the ten-year period (2027-
2026) projected by our Alternative Policy Scenario.
Because of the periodic financial instabilities that China has experienced since mid-
2015, this Working Paper has also devoted a section to a review of trends in the
country‘s indebtedness, both domestic and external. While it is true that China has
confronted an alarming rise in instability in its stock markets, both in the summer of
2015 and early 2016, underlying financial trends in the country appear to more stable
than these events would suggest.

23
This project has received funding from the European Union’s Seventh Framework Programme for research, technological development and demonstration under grant agreement no 266800
The central Chinese government and the country‘s household sector appear to have
relatively manageable levels of debt. Moreover, despite experiencing a recent secular
rise in consumption and a corresponding decline in savings, China still has a
remarkably high rate of national savings, and this pool of savings is readily available
to the country‘s banking sector for the purposes of lending.
Where indebtedness remains a problem that still needs to be monitored and carefully
managed is in the corporate sector and in local government. But most of China‘s
corporate debt is held by state-owned enterprises and is domestically financed.
It is true that local government needs to be accorded greater latitude in raising its own
revenue so that it can contain the secular rise in its indebtedness. But since the
indebtedness of the central government has not reached serious proportions, public
debt as a whole should remain manageable.
What is crucial is that China‘s external debt, both public and private, is not large. In
addition, as discussed above, the CAM projections have indicated that the financial
flows on the country‘s capital account are very favourable, especially compared to
those of other major emerging economies, such as Brazil and Indonesia. China has
ample foreign exchange reserves on which it could call in order to stabilize its
exchange rate and capital inflows remain dominated by foreign direct investment,
which is much more stable and predictable than the erratic speculative flows
associated with the vagaries of short-term portfolio investment and ‗other‘ investment.
References Bank of International Settlements (2016). ―International Banking and Financial Markets
Developments‖, Quarterly Review, March, Basel.
Cozzi, Giovanni, and McKinley, Terry (2015). ―Addressing the Pressing Need to
Reduce Global and European Imbalances‖, FEPS Policy Brief, 15 July.
Cozzi, Giovanni, McKinley, Terry and Michell, Jo (2014). ―Can Conventional
Macroeconomic Policies Prevent Persistent Stagnation in the European Union?‖ FEPS
Policy Brief, 19 November.
Cripps, Francis, Izurieta, Alex, and McKinley, Terry (2007). ―Developing a Global
Model for Trade, Finance and Income Distribution.‖ Technical Paper #1, February,
International Poverty Centre, Brasilia.
Cripps, Francis and Godley, Wynne (1976). ―A Formal Analysis of the Cambridge
Economic Policy Group Model‖ Economica, New Series, Vol. 43, No. 172, November,
pp. 335-348.
Daniel, James, Garrido, José and Moretti, Marina (2016). ―Debt-Equity Conversion and
NPL Securitization in China: Some Initial Considerations‖, IMF, Technical Notes and
Manuals No. 2016/5, April.
24
This project has received funding from the European Union’s Seventh Framework Programme for research, technological development and demonstration under grant agreement no 266800
Griffith-Jones, Stephany and Cozzi, Giovanni (2016). ‗Investment-Led Growth: A
Solution to the European Crisis‘ in Mazzucato, Mariana and Jacobs, Michael (eds),
Rethinking Capitalism: Economics and Policy for Sustainable and Inclusive Growth.
London: Whiley.
IMF (2016a). Global Financial Stability Report, April, Washington DC.
IMF (2016b). World Economic Outlook, April, Washington DC.
IMF (2015). World Economic Outlook, October, Washington DC.
Li, Yefen (2016). ―Debt Dynamics in China – Serious Problems But An Imminent
Crisis Is Unlikely‖, South Centre, Policy Brief No. 26, June.
McKinsey Global Institute (2015). ―Debt and (not much) Deleveraging‖, February,
London.
Moody‘s (2016). ―Moody‘s Outlines Its Views on China‘s Contingent Liabilities‖,
Moody‘s Global Credit Research, 10 May.
Prasad, Eswar (2016). ―China‘s Economy and Financial Markets: Reforms and Risks‖,
Testimony before the U.S.-China Economic and Security Review Commission on the
status of market-oriented economic reforms in China. 27 April.
Yang, Yuan (2016). ―Beijing Clampdown Slows China Spending Spree on US
Property: Capital Outflows Curbs Expected to Ease Upward Pressure on Real Estate
Prices‖, Financial Times, May 16.

25
This project has received funding from the European Union’s Seventh Framework Programme for research, technological development and demonstration under grant agreement no 266800
Financialisation, Economy, Society and Sustainable Development (FESSUD) is a 10 million euro
project largely funded by a near 8 million euro grant from the European Commission under
Framework Programme 7 (contract number : 266800). The University of Leeds is the lead co-
ordinator for the research project with a budget of over 2 million euros.
THE ABSTRACT OF THE PROJECT IS:
The research programme will integrate diverse levels, methods and disciplinary traditions
with the aim of developing a comprehensive policy agenda for changing the role of the financial
system to help achieve a future which is sustainable in environmental, social and economic
terms. The programme involves an integrated and balanced consortium involving partners
from 14 countries that has unsurpassed experience of deploying diverse perspectives both
within economics and across disciplines inclusive of economics. The programme is
distinctively pluralistic, and aims to forge alliances across the social sciences, so as to
understand how finance can better serve economic, social and environmental needs. The
central issues addressed are the ways in which the growth and performance of economies in
the last 30 years have been dependent on the characteristics of the processes of
financialisation; how has financialisation impacted on the achievement of specific economic,
social, and environmental objectives?; the nature of the relationship between financialisation
and the sustainability of the financial system, economic development and the environment?;
the lessons to be drawn from the crisis about the nature and impacts of financialisation? ; what
are the requisites of a financial system able to support a process of sustainable development,
broadly conceived?’

26
This project has received funding from the European Union’s Seventh Framework Programme for research, technological development and demonstration under grant agreement no 266800
THE PARTNERS IN THE CONSORTIUM ARE:
Participant Number Participant organisation name Country
1 (Coordinator) University of Leeds UK
2 University of Siena Italy
3 School of Oriental and African Studies UK
4 Fondation Nationale des Sciences Politiques France
5 Pour la Solidarité, Brussels Belgium
6 Poznan University of Economics Poland
7 Tallin University of Technology Estonia
8 Berlin School of Economics and Law Germany
9 Centre for Social Studies, University of Coimbra Portugal
10 University of Pannonia, Veszprem Hungary
11 National and Kapodistrian University of Athens Greece
12 Middle East Technical University, Ankara Turkey
13 Lund University Sweden
14 University of Witwatersrand South Africa
15 University of the Basque Country, Bilbao Spain
The views expressed during the execution of the FESSUD project, in whatever form and or by whatever medium, are the sole responsibility of the authors. The European Union is not liable for any use that may be made of the information contained therein. Published in Leeds, U.K. on behalf of the FESSUD project.