this paper explores the dynamic effects of trade
TRANSCRIPT

econstorMake Your Publications Visible.
A Service of
zbwLeibniz-InformationszentrumWirtschaftLeibniz Information Centrefor Economics
Arezki, Rabah; Dama, Alou Adesse; Rota-Graziosi, Gregoire
Working Paper
Revisiting the Relationship between TradeLiberalization and Taxation
CESifo Working Paper, No. 9244
Provided in Cooperation with:Ifo Institute – Leibniz Institute for Economic Research at the University of Munich
Suggested Citation: Arezki, Rabah; Dama, Alou Adesse; Rota-Graziosi, Gregoire (2021) :Revisiting the Relationship between Trade Liberalization and Taxation, CESifo Working Paper,No. 9244, Center for Economic Studies and ifo Institute (CESifo), Munich
This Version is available at:http://hdl.handle.net/10419/245425
Standard-Nutzungsbedingungen:
Die Dokumente auf EconStor dürfen zu eigenen wissenschaftlichenZwecken und zum Privatgebrauch gespeichert und kopiert werden.
Sie dürfen die Dokumente nicht für öffentliche oder kommerzielleZwecke vervielfältigen, öffentlich ausstellen, öffentlich zugänglichmachen, vertreiben oder anderweitig nutzen.
Sofern die Verfasser die Dokumente unter Open-Content-Lizenzen(insbesondere CC-Lizenzen) zur Verfügung gestellt haben sollten,gelten abweichend von diesen Nutzungsbedingungen die in der dortgenannten Lizenz gewährten Nutzungsrechte.
Terms of use:
Documents in EconStor may be saved and copied for yourpersonal and scholarly purposes.
You are not to copy documents for public or commercialpurposes, to exhibit the documents publicly, to make thempublicly available on the internet, or to distribute or otherwiseuse the documents in public.
If the documents have been made available under an OpenContent Licence (especially Creative Commons Licences), youmay exercise further usage rights as specified in the indicatedlicence.
www.econstor.eu

9244 2021
August 2021
Revisiting the Relationship between Trade Liberalization and Taxation Rabah Arezki, Alou Adesse Dama, Gregoire Rota-Graziosi

Impressum:
CESifo Working Papers ISSN 2364-1428 (electronic version) Publisher and distributor: Munich Society for the Promotion of Economic Research - CESifo GmbH The international platform of Ludwigs-Maximilians University’s Center for Economic Studies and the ifo Institute Poschingerstr. 5, 81679 Munich, Germany Telephone +49 (0)89 2180-2740, Telefax +49 (0)89 2180-17845, email [email protected] Editor: Clemens Fuest https://www.cesifo.org/en/wp An electronic version of the paper may be downloaded · from the SSRN website: www.SSRN.com · from the RePEc website: www.RePEc.org · from the CESifo website: https://www.cesifo.org/en/wp

CESifo Working Paper No. 9244
Revisiting the Relationship between Trade Liberalization and Taxation
Abstract This paper explores the dynamic effects of trade liberalization on tax revenue using a worldwide panel dataset. Results point to statistically significant negative effect of liberalization on (non- resource) tax revenues in the short term and no significant effect in the medium term. Liberalization also alter the tax structure tilting revenues toward indirect taxes away from direct ones. Economies which have implemented value added taxes prior to liberalization have mitigated its negative effects on tax revenues. The evidence is supportive of the complementarity role of state capacity to reap the benefits of liberalization. JEL-Codes: H200, H870, F130. Keywords: tax, tax structure, openness, liberalization, natural resources.
Rabah Arezki African Development Bank
Abidjan / Ivory Coast [email protected]
Alou Adesse Dama
Centre d’Études et de Recherches sur le Développement International (CERDI) Université Clermont Auvergne / France
Gregoire Rota-Graziosi Centre d’Études et de Recherches sur le Développement International (CERDI) Université Clermont Auvergne / France
We thank Olivier Blanchard, Simeon Djankov, and Lemma Senbet for excellent suggestions and comments. We acknowledge the support received from the Agence Nationale de la Recherche of the French government through the program “Investissements d’avenir” (ANR-10-LABX-14-01). The findings, interpretations, and conclusions expressed in this paper do not necessarily reflect the views of the CERDI, World Bank or the African Development Bank or the governments they represent. The CERDI, World Bank and the African Development Bank do not guarantee the accuracy of data included in this work.

2
1. Introduction
Trade liberalization is expected to raise economic growth and welfare through more competition reducing domestic rents, raising the availability of capital and increased productivity. The empirical evidence between trade orientation and growth in developing countries is however ambiguous (Winters, 2004; Baldwin, 2003; Rodriguez and Rodrik, 2000).1 There are several possible reasons for why that is so. Trade liberalization has not done away with pervasive distortions to trade especially in developing countries including because of limited enforcement and implementation of trade policies (Atkin and Khandelwal, 2020). In turn these distortions might limit the expansion of trade and its effect on welfare and growth. Trade liberalization has also important distributional consequences raising income inequality (Goldberg and Pavcnik, 2004). Trade liberalization may have ambiguous effect on (aggregate) informality (Ulyssea, 2018). One important related question is how trade liberalization affect public finances. The public finance channel of trade liberalization has received less attention yet it may have important economic and distributional implications. In the present paper, we systematically study the dynamic effects of trade liberalization on taxation.
There are several mechanisms through which trade liberalization affect taxation. Trade liberalization could lower economic growth for some developing countries and hence limit the expansion of domestic tax revenues (Rodriguez and Rodrik, 2000). Notwithstanding the contention on the effect of trade liberalization on growth, tax revenue losses following trade liberalization can be hard to replace by domestic sources. In other words, the “tax transition”, that is the rebalancing away from tariff revenues toward domestic ones, is often incomplete. Indeed, structural factors such as natural resources dependence, informality and weak state capacity are particularly pervasive in developing countries in turn limiting domestic revenue mobilization (Besley and Persson, 2014). What is more is the decrease in the cost of international capital mobility has fueled intense tax competition in turn offering multiple opportunities for multinationals to shift profits in tax accommodating countries known as tax heaven (Dharmapala and Hines, 2009; Dharmapala, 2014 and 2019). The tax structure may also be impacted by trade
1 More generally, the empirical evidence linking trade and income vast. For instance, Frankel and Romer (1999) provide positive empirical evidence of the causal effect of trade on income though only moderately statistically significant.

3
liberalization.2 Tax coordination and enforcement at the international level are difficult (Rota-Graziosi, 2019).3 4 Developing countries are particularly vulnerable to trade mis-invoicing or profit shifting from multinational corporations following trade liberalization because of relatively weak state capacity.
This paper specifically focuses on the dynamic effect of trade liberalization on non-resource tax revenue using a combination of tax revenue data from Government Revenue Dataset (GRD) of the ICTD/UNIWIDER and the extended version of the Sachs and Warner indicator of liberalization by Wacziarg and Welch (2008) [hereafter SW/WW]. Results point to significant negative effect of liberalization on (non-resource) tax revenues in the short term and no significant effect in the medium term. Liberalization also alter the tax structure tilting revenues toward indirect taxes away from direct ones. Economies which have implemented value added taxes prior to liberalization have mitigated its negative effects on tax revenues. The evidence is supportive of the complementarity role of state capacity to reap the benefits of liberalization.
This paper is related to the literature on determinants of tax ratio and tax effort linked to the seminal work by Lotz and Morss (1970). The literature documents an average positive relationship between openness and tax revenues albeit the relationship appears weaker for poorer economies (Baunsgaard and Keen, 2010; Cage and Gadenne, 2014). Unlike the existing cross-country studies of trade orientation and taxation, we use a policy-based measure of trade orientation—allowing to pin down the exact timing of change in trade policy—instead of outcome measures of trade such as trade-to-GDP. Our results point to a lack of robustness of the positive association between outcome-based measure of liberalization and tax revenues. Instead of our results point a significant and robust negative effect of trade liberalization on tax revenues using policy-based measure
2 Hines and Summers (2009) find that countries with small open economies have relatively mobile tax bases; as a result, they rely much less heavily on corporate and personal income taxes than other countries. Martinez et al. (2011) show that over the past decades developing countries have experienced much lower ratios of direct over indirect taxes compared to advanced economies. The authors argue that this trend is driven by the willingness of developing countries to favor foreign direct investment and economic growth but also by considerations linked to state and administrative capacity. 3 On June 5th 2021, the Group of Seven has agreed to set a minimum global corporate tax rate of a minimum of 15 percent. Treasury Secretary Janet Yellen stated that the deal with end "30-year race to the bottom on corporate tax rates". Implementation and enforcement of such deal is however going to be challenging. 4 Egger et al. (2019) find a differential effect of higher trade and factor mobility on relative tax burdens in 1980–1993 versus 1994–2007 in the Organization for Economic Cooperation and Development.

4
of liberalization. In addition, the paper contributes to the literature by exploring more systematically the dynamic effect of trade liberalization and the evolution of tax structure.
This paper also distinguishes between tax revenue from natural resource versus tax collected outside the resource sector. The distinction between the two sources of revenue is important also because of large fluctuations in international prices in natural resources. Indeed, when using non-resource tax revenues as dependent variable instead of aggregate tax revenues, the positive association between the outcome-based measure of trade liberalization and tax revenues is no longer robust. Collier (2006) argues that governments in resource-rich countries tax less and face little scrutiny as revenue from natural resources transit directly through government coffers. Importantly, James (2015) provides empirical evidence that the behavior of US States is consistent with theory that in response to an exogenous increase in resource-based government revenue, a benevolent government will partially substitute away from taxing income. The literature on the so-called resource curse point to the key role of pre-existing institutions in determining the performance of resource rich economies relative to resource poor ones (see Robinson et al, 2006; Mehlum, et al., 2006). In this paper, we provide evidence that implementation of value added tax prior to trade liberalization help limit the negative effect of liberalization on tax revenues.
The remainder of the paper is as follows. Section 2 presents the data and the empirical framework. Section 3 presents our main results. Section 4 presents extensions. Section 5 concludes.
2. Data and Empirical Analysis
In this section, we present the data and the empirical framework used to explore the link between trade liberalization and tax revenues.
2.1. Data
In this sub-section we present the data used to construct the variables used in our empirical framework. Appendix Table A1 provides basic statistics related to the variable used in the analysis.
Government revenues and its composition are from GRD obtained from ICTD/UNUWIDER. We use GRD to construct non-resource tax revenues including as a ratio to non-resource GDP. Non-resource GDP is calculated using GDP in purchasing

5
power parity (PPP) minus the value of natural resource rents from the World Bank, World Development Indicators.5
Market orientation is proxied using the extended version of the Sachs and Warner indicator of liberalization by Wacziarg and Welch (2008) shown in Appendix A Table A2. The indicator covers 140 countries over 1950 to 2004. It is a dichotomic variable that classifies a country as open or not. In a given year, the indicator takes the value 1 if: i) the average tariff rate on imports is below 40%; ii) nontariff barriers cover less than 40% of imports; iii) the country is not a socialist economy; iv) the state does not hold a monopoly of the major exports; and v) the black-market premium is below 20%.
To address issue of endogeneity associated with trade liberalization, we use an instrument based on "learning from neighbors" derived from the reduced-form specification presented in Buera et al. (2011). The authors posit that countries learn from their neighbors and provides evidence that the choice of market orientation of a given country is associated with the fraction of neighboring countries opening up and whether they successfully perform following liberalization or status quo.
Specifically, !"#$!,#, the trade liberalization measure for country i at time t, is as follows:
#%!"#$!,#&. . ( = *$!"#$!,#%$ + *&#,!,#%$[.|!"#$ = 1] + *'#,!,#%$[.|!"#$ = 0] +*(!"#$),#%$3333333333333 (1)
where #,!,#%$[.|!"#$ = 1] and #,!,#%$[.|!"#$ = 0] are the distance weighted average growth rate over the previous 3 years respectively for open economies and closed economies, while !"#$),#%$3333333333333 is a distance weighted measure of neighbor trade liberalization.6
In addition to our policy-based measure of liberalization, we use an outcome-based measure of trade that is total trade to GDP measured as the sum of exports and imports over GDP. Trade to GDP data are obtained from World Bank, World Development Indicators. We also construct a non-resource trade variable as total goods trade excluding fuel, ores and metals export also obtained from World Bank, World Development Indicators.
5 Natural resource rents are implicitly valued in PPP because of their tradable nature and pricing in US dollars. 6 Data on distance to build the instrument for trade liberalization are obtained from CEPII.

6
Control variables included in the empirical analysis are obtained from World Bank, World Development Indicators. The variables are as follows:
• GDP growth measures the expansion of the economy hence of its tax base. GDP growth is expected to be positively related to tax revenues. Considering that trade liberalization may tend to increase tax revenues through higher growth, controlling for GDP growth allows to shut down that "growth channel".7
• The structure of the economy is proxied by the share of agriculture value added in total GDP. The share of agriculture is expected to be negatively related to tax revenues. Indeed, the primary sector, which many developing countries depend upon, is difficult to tax also because of the informal nature of the sector. What is more is that the primary sector is often largely tax exempt in developing countries. For instance, in most Sub-Saharan countries agriculture is either tax exempt or out-of-scope of the value added tax (VAT).8 In addition, governments often have a naïve approach to tax incidence on food products. Indeed, governments often assume that consumer prices would fully reflect tax exemption without any consideration related to elements of market structure—including producers and traders margins as discussed in Bergquist and Dinerstein, 2020.
• Inflation is measured as annual percent change in consumer prices. Inflation is expected to have a negative effect on tax revenue. Tanzi (1978) points to the key role of the initial tax burden and the lag with which tax revenue are collected. The author and subsequent analysis show that higher inflation is associated with higher revenue loss.9
• Development assistance and official aid are measured as a share of GDP.10 Aid is expected to have a negative effect on tax revenues. Aid is largely tax exempt and may also potentially lead to reduced domestic tax effort (Caldeira et al., 2020). The existing empirical evidence is however ambiguous.11
7 It is noteworthy that the coefficient associated with economic growth could be biased downward due to potential reverse causality. Indeed, lower taxes could stimulate investment and in turn economic growth including through tax incentives. 8 This particularly true in French speaking African countries. However, countries such as Nigeria or Ghana raise VAT on rice imports to protect their local production and achieve their self-sufficiency. These policies transform VAT into a quasi-tariff and trigger significant rice smuggling across borders--between Benin and Nigeria for instance. 9 See for Instance Crivelli and Gupta (2014). 10 Thereafter we use just “aid” in lieu of the phrase development assistance and official aid. 11 Morrissey (2015) provides a review of empirical literature linking development aid and tax revenues.

7
• The dates of introduction of VAT adoption are obtained from Seelkopf et al. (2019) and Genschel and Seelkopf (2019). The dates of introduction are presented in Appendix Table A2 alongside the dates of (first) trade liberalization episodes.
2.2. Empirical Framework
In this sub-section, we present our empirical framework to test the relationship between trade liberalization and tax revenues as well as the latter subcomponents. The main specification is as follows:
4!,# = 5!"#$!,#%$ + 67!#%$ + 8! + 9# + :!,# (2)
where 4!,# is tax revenues excluding social contribution and grant in percentage of GDP for country ; at time t as well as non-resource tax excluding social contribution in percentage of GDP. We also use as dependent the tax structure including the ratio between direct and indirect taxes. !"#$!,#%$ for country ; at time t-1 is a dummy that takes the value of 1 if the country is open, or zero otherwise, 7!#%$ is a set of control variables described above, 8! and 9# are respectively country and time fixed effects, and :!,# is the error term.
To explore the dynamic effect of liberalization on tax revenues we use the Local Projection Method (LP) developed by Jordà (2005) to estimate impulse responses. In the identification strategy, we rely on trade liberalization as an external shock. Local projection requires estimation of a series of regressions for each horizon ℎ. The model applied to our specification presented in (2) is as follows:
4!,#*+ = 5+!"#$!,#%$ + 6+7!#%$ + 8!,+ + 9#,+ + :!,#*+, ℎ = 0, 1, …, 10 (3)
To test for the heterogeneity of the effect of liberalization, we add an interaction term between trade liberalization and the adoption of VAT to the equation (2). VAT is relatively easier to collect as its collection is essentially delegated to the private sector. VAT has become an important part of domestic tax revenue mobilization.
3. Main Results
In this section, we present the results of our empirical framework exploring the relationship between trade liberalization and tax revenues.

8
3.1. Tax Revenues and Trade Liberalization
Table 1 presents the regression results using ordinary least square with tax revenues—including revenues related to natural resources—as a dependent variable and trade liberalization as an independent variable as well as a variety of control variables. The coefficients associated with trade liberalization are negative and statistically significant across all specifications. In Column (1) without control variable, the coefficient associated with trade liberalization is -0.641. The negative and statistically significant coefficient indicates that on average countries which have liberalized have experienced a decrease in tax revenues over the medium run. The result suggests that the loss of revenues from lower tariffs is not more than compensated by an increase in the tax base. When controlling for GDP growth, Column (2) shows that the coefficient associated with trade liberalization is -0.874. The increase in absolute value of the coefficient confirms that the counterfactual whereby the growth channel of trade liberalization would be shut down would worsen the effect of liberalization on tax revenues. The individual coefficient associated with GDP growth is indeed positive and statistically significant across all columns in Table 1.
Columns (3) in Table 1 shows that also controlling for the share of the agriculture sector leads to a decrease in absolute value of the coefficient associated with trade liberalization. Indeed, the coefficient associated with the agriculture sector is associated with lower tax revenues. Hence controlling for the size of the sector limits the negative effect of trade liberalization on tax revenues. Column (4) controls further for both inflation, development assistance and official aid lead to a decrease in the absolute value of the coefficient associated with trade liberalization. The individual coefficient associated with inflation is positive but not significant while the coefficient associated with development aid is negative and statistically significant. All in all, our main results show a robust and negative effect of liberalization on tax revenues.
Quantitatively, trade liberalization which implies a jump from zero to 1 for the dichotomous variable used in the regression suggests that the decrease in tax revenues ranges from 0.60 to 0.87 percent of GDP. Quantitatively, the decrease in tax revenue may appear relatively small also considering the results capture the medium run effect. Yet it is important to bear in mind that the effect of trade liberalization is firmly negative as opposed to positive as existing empirical evidence as pointed to. Trade liberalization is significantly associated with a decrease in tax revenues.

9
Table 1. Trade Liberalization and Aggregate Tax Revenues—Ordinary Least Square
Revenue excluding grants and social contributions to GDP (1) (2) (3) (4)
Sachs-Warner/Wacziarg-Welch index of liberalization (-1)
-0.641*** -0.874*** -0.729*** -0.555** (0.243) (0.250) (0.267) (0.266) Real GDP growth (Annual percent change) (-1) 0.042*** 0.032** 0.031* (0.014) (0.014) (0.016) Agriculture, value added (% of GDP) (-1) -0.193*** -0.134*** (0.019) (0.021) Inflation, consumer prices (annual %) (-1) 0.000 (0.000) Net official development assistance and official aid received (% of GDP) (-1)
-0.037** (0.017) Country FE Yes Yes Yes Yes Year FE Yes Yes Yes Yes Observations 2,710 2,578 2,229 1,595 Number of Country 136 136 129 96 R-squared 0.026 0.032 0.078 0.087 Notes: The table reports results for regressions with tax revenues excluding grants and social contributions to GDP as dependent variable with as independent variables SW/WW liberalization indicator as well as several controls. *** denotes significance at the1% level, ** at the 5% level, and * at the 10% level.
Table 2 confirms our main result using as dependent variables tax revenues excluding natural resources. Developing countries are often dependent on revenues from natural resources. Considering that natural resources are subject to exogenous price and quantity shocks, in the form of fluctuations in international prices and discoveries of resources, excluding receipts from natural resources from government tax revenues allows to capture tax mobilization efforts more appropriately. Column (1) in Table 2 shows that the coefficient associated with trade liberalization is -0.889 that is higher in absolute value than the coefficient reported in Column (1) in Table 1 suggesting that tax revenue mobilization is weaker when removing natural resources from tax revenues. When controlling for GDP growth in Column 2 of Table 2 the coefficients becomes larger in absolute values as expected. Adding more controls in Columns (3) and (4) confirms the negative association between trade liberalization and (non-resource) tax revenues.

10
Table 2. Trade Liberalization and Non-Resource Tax Revenues—Ordinary Least Square
Non-resource tax excluding social contributions to GDP (1) (2) (3) (4)
Sachs-Warner/Wacziarg-Welch index of liberalization (-1)
-0.889*** -1.005*** -0.382** -0.287 (0.167) (0.171) (0.178) (0.188) Real GDP growth (Annual percent change) (-1) 0.027*** 0.022** -0.002 (0.010) (0.010) (0.012) Agriculture, value added (% of GDP) (-1) -0.111*** -0.055*** (0.013) (0.015) Inflation, consumer prices (annual %) (-1) 0.001* (0.000) Net official development assistance and official aid received (% of GDP) (-1)
-0.026* (0.014) Country FE Yes Yes Yes Yes Year FE Yes Yes Yes Yes Observations 2,844 2,711 2,226 1,540 Number of Country 135 135 128 96 R-squared 0.024 0.030 0.061 0.064 Notes: The table reports results for regressions using as dependent variable non-resource tax revenues excluding grants and social contributions over GDP with as independent variables SW/WW liberalization indicator as well as other controls. *** denotes significance at the1% level, ** at the 5% level, and * at the 10% level.
Our main result is in stark contrast with existing evidence pointing to a positive and significant relationship between trade liberalization and tax revenues.12 The literature finding a positive association typically uses outcome base measures of trade liberalization while we use a measure based on policy changes. Interestingly, Cage and Gadenne (2014) find that trade liberalization led to larger and longer-lived declines in tax revenues in developing countries since 1970 than in today’s rich countries in the 19th and 20th centuries. Table 3 presents results using an outcome-based measure of trade liberalization—that is the sum of exports and imports of goods and services as a share of GDP. The sign of the coefficient associated with the outcome-based measure is positive and significant across all columns. Column 1 in Table 3 indicates that an increase in trade liberalization going from zero that is autarky to say 100 percent of GDP would lead to an
12 Baunsgaard and Keen (2010) find an average positive relationship between trade openness--proxied by the sum of exports and imports of goods and services over GDP--and tax revenues albeit the relationship appears weaker for poorer economies.

11
increase in tax revenues of 0.7 percent of GDP. Columns 2-4 in Table 3 confirm the positive and statistically significant association between trade orientation and tax revenue—with Column 4 in Table 3 pointing to a maximum effect of 2 percent of GDP increase in tax revenues following an increase from zero to 100 percent in trade orientation.
Table 3. Trade Liberalization and Aggregate Tax Revenues—Outcome based Measure of Liberalization
Revenue excluding grants and social contributions to GDP (1) (2) (3) (4)
Total trade % of GDP (-1) 0.007** 0.008*** 0.012*** 0.019*** (0.003) (0.003) (0.003) (0.004) Real GDP growth (Annual percent change) (-1)
0.023** 0.057*** 0.050*** (0.011) (0.013) (0.015) Agriculture, value added (% of GDP) (-1) -0.148*** -0.117*** (0.014) (0.015) Inflation, consumer prices (annual %) (-1) -0.000 (0.000) Net official development assistance and official aid received (% of GDP) (-1)
-0.010 (0.015) Country FE Yes Yes Yes Yes Year FE Yes Yes Yes Yes Observations 5,066 4,974 4,477 3,158 Number of Country 181 180 173 142 R-squared 0.075 0.083 0.114 0.150 Notes: The table reports results for regressions using as dependent variable tax revenues excluding social contributions over GDP with as independent variables an outcome based measure of liberalization that is the sum of exports and imports of goods and services over GDP as well as several controls. *** denotes significance at the1% level, ** at the 5% level, and * at the 10% level.
However, the evidence pointing to a positive association between trade orientation and tax revenues is not robust. When subtracting natural resource rents from tax revenues the results from the regression linking trade liberalization and tax revenues shown in Table 4 appear no longer statistically significant. Indeed, Table 4 shows that while the coefficients associated with trade liberalization are positive for Columns 1, 2 and 4 and negative in Column 3. The coefficients associated with the outcome-based measure of trade liberalization are not statistically significant for all columns. Non resource tax

12
revenues variable is a better proxy for tax revenue mobilization. Indeed, as mentioned earlier, developing countries are often subject to quantity and price shocks in the resource sector which tend to drive aggregate tax revenues. Hence policy-based measures of liberalization are better suited to capture the precise timing and actual impulse toward liberalization--doing away with the vagaries from the resource sector.
Table 4. Trade Liberalization and Non-Resource Tax Revenue—Outcome based Measure of Liberalization
Non-resource tax excluding social contributions to GDP (1) (2) (3) (4)
Total trade % of GDP (-1) 0.001 0.002 -0.002 0.002 (0.002) (0.002) (0.002) (0.002) Real GDP growth (Annual percent change) (-1) 0.008 0.028*** 0.010 (0.007) (0.009) (0.010) Agriculture, value added (% of GDP) (-1) -0.116*** -0.086*** (0.009) (0.010) Inflation, consumer prices (annual %) (-1) 0.001** (0.000) Net official development assistance and official aid received (% of GDP) (-1)
-0.014
(0.010) Country FE Yes Yes Yes Yes Year FE Yes Yes Yes Yes Observations 5,029 4,923 4,324 3,017 Number of Country 177 175 169 139 R-squared 0.088 0.093 0.155 0.213 Notes: The table reports results for regressions using as dependent variable non-resource tax revenues excluding grants and social contributions over GDP with as independent variables an outcome based measure of liberalization that is the sum of exports and imports of goods and services over GDP as well as several controls. *** denotes significance at the1% level, ** at the 5% level, and * at the 10% level.
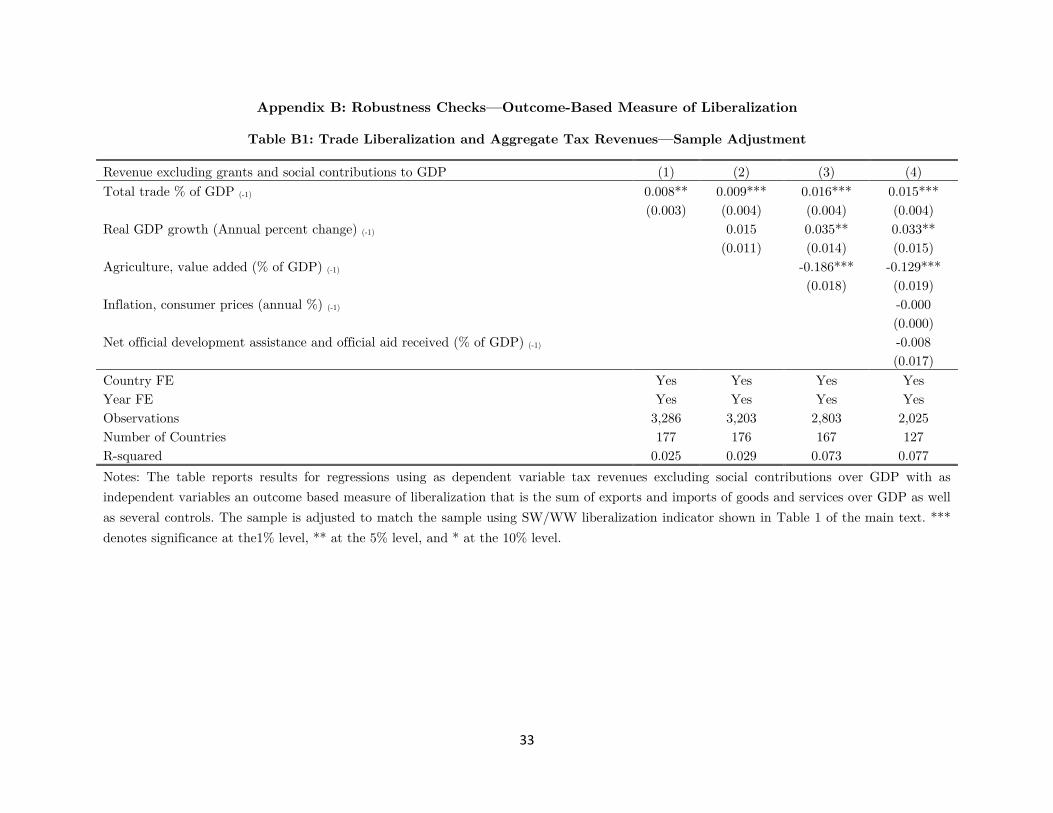
The non-robust nature of the relationship casts doubts on the existing evidence pointing to a positive relationship between tax revenues and trade liberalization albeit the existing evidence points to a weaker relationship for developing countries (see Baunsgaard and Keen, 2010). In Appendix B, we perform several checks around the relationship between trade orientation and tax revenues. Table B1 confirms the positive relationship between total tax revenues and trade orientation when using the same sample as our Table 1 in

13
the main text.13 But again, Table B2-- restricting the sample to the one available for Table 2 in the main text--shows that when using non-resource tax revenues as dependent variable the positive relationship between trade orientation and tax revenues is not robust.
In Appendix B, Tables B3 and B4 further explore the robustness of the relationship between tax revenues and the outcome-based measure of trade liberalization by subtracting natural resource exports from the trade orientation measure—that is the sum of exports and imports of goods and services as a share of GDP. Table B3 shows that the relationship between aggregate tax revenues and trade orientation is now negative and statistically significant. Table B4 uses as dependent non resource tax revenues and find that the relationship between the latter and non-resource trade orientation is not statistically significant and the sign oscillates between negative and positive. These results echo the main results of this paper that trade liberalization does not statistically significantly increase in tax revenues. The results presented in the paper go further and confirm the robustness of the negative relationship between our policy-based measure of trade liberalization and tax revenues.
3.2 Exploring the Dynamics
This sub-section explores the dynamics of the relationship between tax revenues and trade liberalization. We present impulse responses using local projection method following Jordà (2005). The identification strategy relies on trade liberalization as an external shock. LP allows to identify the effect of liberalization at different horizons.
Figure 1 shows that the negative effect of trade liberalization on aggregate tax revenues is negative and statistically significant for at least the first three years after liberalization. That result pointing to a negative effect of trade liberalization holds whether the regression does include or not control variable(s)--as shown in Panel A without inclusion of control variable or as shown in Panel B with inclusion of control variables. After three years, the effect of liberalization turns positive but is only statistically significant at 90 percent level after five years as shown in Panel A of Figure 1. When including control variables, the effect of trade liberalization on tax revenues become positive after seven years but is not statistically significant at conventional levels as shown in Panel B of Figure 1. These results confirm our main findings which point to a statistically significant and negative effect of trade liberalization on tax revenues shown in the previous sub-
13 The SW/WW trade liberalization measure used as our policy-based measure throughout the paper is available up to 2004 hence restricting the overall sample.

14
section. The earlier results should be understood as "averaging" the dynamic effects of liberalization over the medium run and are thus consistent with the dynamic effects presented in this sub-section distinguishing between the short and medium run.
The economic interpretation of the negative effect of liberalization in the short run is explained by a loss in tax revenues from tariff removal that is no compensated by increase in the tax base. Over the medium run, the effect of liberalization on tax revenues turn positive as the tax base gradually increase. Yet there are important sources of leakages both domestic and international that show in the weak statistical significance of the effects of liberalization over the medium run.
Figure 1: Dynamic Effects of Trade Liberalization on Aggregate Tax Revenues
Panel A. No control Panel B. With Controls
Notes: The graph shows impulse response functions. We regress government revenue excluding grants and social contributions to GDP on SW/WW liberalization indicator as well as several controls unless otherwise indicated. 95% / 90% error bands displayed. Panel A presents impulse responses with no control variable. Panel B presents impulse response with all control variables including real GDP growth, agriculture value added, inflation and net development aid and assistance.
To explore further whether our main result is robust we use as dependent non-resource tax revenues instead of aggregate tax revenues in estimating the dynamic effects of trade liberalization. Figure 2 confirms our earlier result pointing to a negative effect of trade liberalization which are statistically significant and longer lasting that in Figure 1. Indeed, the negative effect is statistically significant and lasts up to five years in Panel A of Figure 2 when no control variable is included. The negative effect of liberalization is statistically significant and lasts for over ten years when including control variables as shown in Panel B of Figure 2 albeit the effect become insignificant after eight years. These results confirm
-1-.5
0.5
1Pe
rcen
tage
poi
nt o
f GD
P
0 2 4 6 8 10Year

15
our main findings that trade liberalization has a negative effect over the short run and has no statistically significant effect over the medium run.
Figure 2: Dynamic Effects of Trade Liberalization on Non-Resource Tax Revenues
Panel A. Without Control Panel B. With Controls
Notes: The graph shows impulse response functions. We regress non resource tax revenues as share of GDP on SW/WW liberalization indicator as well as several controls unless otherwise indicated. 95% / 90% error bands are displayed. Panel A presents impulse responses with no control variable. Panel B presents impulse response with control variables including real GDP growth, agriculture value added, inflation and net development aid and assistance.
3.3 Addressing Endogeneity
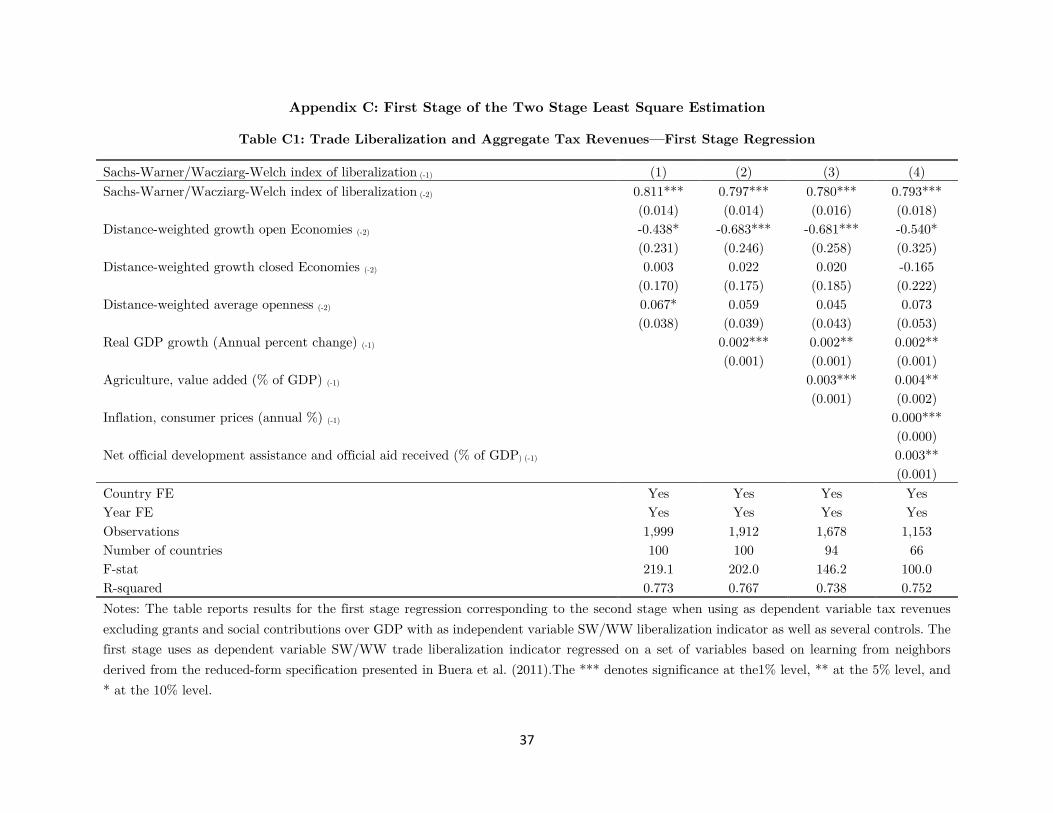
In this sub-section, we present our main results addressing the issue of endogeneity stemming from the reverse causality running from tax revenues to trade liberalization. That reverse causality may introduce a downward bias in the estimation of the coefficient associated with trade liberalization. As discussed earlier, to address issue of endogeneity associated with trade liberalization, we use an instrument based on learning from neighbors derived from the reduced-form specification presented in Buera et al. (2011). The instrument rest of the fact that a given country get influenced in terms of policy through observing neighbor’s policy actions or lack thereof and subsequent performance. In Appendix C, Tables C1 and C2 provide the first stage estimations of the regressions using respectively aggregate tax revenues and non-resource tax revenues. The F-statistics are above ten for all columns in both tables indicating that the instrument is strong.
Table 5 presents the results of the two-stage least square estimation using aggregate tax revenues as dependent variable. It shows that across all specifications the coefficients associated with trade liberalization in the second stage is negative and statistically
-1-.5
0.5
Perc
enta
ge p
oint
of G
DP
0 2 4 6 8 10Year

16
significant. Column 1 in Table 5 indicates that a jump from autarky to fully liberalized would increase tax revenues by minus 1 percent of GDP over the medium. The coefficients through Columns 1 to 4 are much larger in absolute value that we found in earlier results not addressing endogeneity. The coefficients in Column 2 is higher in absolute value than in Column 1. That is resulting from the shutting down of the growth channel of liberalization. Columns 4 and 5 also confirm the negative and statistically significant causal effect of trade liberalization on tax revenues.
Table 5: Trade Liberalization and Aggregate Tax Revenues—Two Stage Least Square Estimation
Revenue excluding grants and social contributions to GDP (1) (2) (3) (4)
Sachs-Warner/Wacziarg-Welch index of liberalization (-1)
-1.009*** -1.363*** -1.489*** -1.072*** (0.370) (0.390) (0.416) (0.414) Real GDP growth (Annual percent change) (-1) 0.039** 0.027 0.026 (0.018) (0.018) (0.021) Agriculture, value added (% of GDP) (-1) -0.242*** -0.193*** (0.025) (0.028) Inflation, consumer prices (annual %) (-1) 0.000 (0.000) Net official development assistance and official aid received (% of GDP) (-1)
-0.022
(0.024) Country FE Yes Yes Yes Yes Year FE Yes Yes Yes Yes Observations 1,999 1,912 1,678 1,153 Number of countries 100 100 94 66 R-squared 0.0302 0.0348 0.0884 0.117 Notes: The table reports the estimates of the second stage of a two stage least square regression with tax revenue excluding grants and social contributions to GDP as dependent variable and with SW/WW liberalization indicator as well as several controls as independent variables. For trade liberalization we use an instrument based on learning from neighbors derived from the reduced-form specification presented in Buera et al. (2011). *** denotes significance at the1% level, ** at the 5% level, and * at the 10% level.
We now turn to testing the robustness of our two-stage least square estimation using non resource tax revenues as dependent variable. Table 6 presents the results, which confirm the negative effect of trade liberalization for all Columns 1 to 4. Columns 1 and 2 are

17
statistically significant while Columns 3 and 4 are not. Column 1 indicates that an effort at fully liberalizing the economy would yield a decrease in non-resource tax revenues of about 1 percent of GDP over the medium run consistent with Table 5. Column 2 also shows the coefficients is higher after controlling for GDP growth. Columns 3-4 confirm the negative relationship between trade liberalization and non-resource tax revenues. Overall, these results confirm that trade liberalization causes no significant increase in tax revenues contrary to existing evidence.
Table 6: Trade Liberalization and Non-Resource Tax Revenues—Two Stage Least Square Estimation
Non-resource tax excluding social contributions to GDP (1) (2) (3) (4)
Sachs-Warner/Wacziarg-Welch index of liberalization (-1)
-0.977*** -1.058*** -0.314 -0.270 (0.248) (0.260) (0.268) (0.283) Real GDP growth (Annual percent change) (-1) 0.018 0.008 -0.016 (0.013) (0.012) (0.014) Agriculture, value added (% of GDP) (-1) -0.123*** -0.083*** (0.017) (0.020) Inflation, consumer prices (annual %) (-1) 0.001* (0.000) Net official development assistance and official aid received (% of GDP) (-1)
-0.025 (0.020) Country FE Yes Yes Yes Yes Year FE Yes Yes Yes Yes Observations 2,117 2,035 1,698 1,141 Number of countries 99 99 93 66 R-squared 0.0234 0.0252 0.0513 0.0712 Notes: The table reports the estimates of the second stage of a two stage least square regression with non-resource tax revenues over GDP as dependent variable and with SW/WW liberalization indicator as well as several controls as independent variables. For trade liberalization we use an instrument based on learning from neighbors derived from the reduced-form specification presented in Buera et al. (2011). *** denotes significance at the1% level, ** at the 5% level, and * at the 10% level.
4. Extensions
In this section we now turn to exploring two extensions. First, we explore the extent to which the structure of tax revenues is altered following trade liberalization. Second, we

18
test whether element of state capacity in the tax sector lead to heterogenous effect of liberalization on tax revenues. Specifically, we test whether the effect of trade liberalization on tax revenues differ depending on whether VAT has been implemented prior to liberalization.
4.1 Trade Liberalization and Tax Structure
This sub-section presents the results of the estimation of the effect of trade liberalization on tax structure. Table 7 shows that trade liberalization alter the tax structure tilting revenues toward indirect taxes and away from direct ones. Such shift in the structure reduces the redistributive capacity of national tax systems. Indeed, that is the case considering the Personal Income Tax (PIT) is typically progressive, while VAT being a consumption tax disproportionally affects relatively poor households. Columns 1-4 in Table 7 show that trade liberalization has a negative and statistically significant effect on direct taxes as share of total non-resource tax revenues. The coefficients are statistically significant across all these columns except Column 4. Columns 5-8 in Table 7 shows that indirect taxes as a share of total tax revenues increase following trade liberalization. The results are statistically significant across all these columns except Column 8. These results confirm that trade liberalization lead to a shift in the structure of taxation toward indirect taxes and away from direct ones.
To further explore the effect of trade liberalization on tax revenue structure, we estimate the effect of trade liberalization on direct tax revenue. Table 8 shows that corporate income tax decrease following trade liberalization. Columns 1-4 in Table 8 presents the results of the effect of trade liberalization on PIT as a share of GDP. Results appear not robust with sign flipping across specifications.14
Columns 5-8 in Table 8 presents the results of the effect of trade liberalization on Corporate Income Tax (CIT) as share of GDP. Results point to robust negative and statistically significant effect of trade liberalization on CIT revenues. Trade liberalization increases competition and welfare, which reduces rents and taxable income of domestic
14 The design of PIT has evolved following trade liberalization. It has switched from a comprehensive approach to income to a dual or semi-dual income approach. Initiated first in Scandinavian countries in 1990’s the dual income tax has considered the lower international mobility cost of capital with respect to labor. The dual income tax kept the progressivity of tax rate on wages only, while the other sources of income--portfolio, land ownership and profit—are taxed under a flat and generally lower rate except for profit, which is in line with the Corporate Income Tax rate. Such evolution has eroded the redistributive capacity of PIT.

19
corporations.15 , Trade liberalization also allows multinational companies to engage into more aggressive tax planning, which affects CIT revenues-- while being welfare worsening for the source country. The increase in capital mobility and the advent of tax havens make the technology of tax avoidance more pervasive. Issues of state capacity could make these matters matter worse through leakages in tax revenues following liberalization. We turn to the issue of state capacity in the tax area next.
15 For Auriol and Warlters (2005) argue that weak capacity in tax administration may explain why developing countries raise high entry costs through the presence of fees in order to reduce the number of formal firms, increase their market power and their taxable income, and consequently CIT revenue. However, Auriol and Warlters (2005) do not consider the potential leakages associated with the risk of tax avoidance.

20
Table 7: Trade Liberalization and Tax Structure--Non-Resource Tax Composition
Direct taxes excluding social contributions and resource revenue to non-resource tax excluding
social contributions
Non-resource component of Indirect tax to non-resource tax excluding social
contributions (1) (2) (3) (4) (5) (6) (7) (8) Sachs-Warner/Wacziarg-Welch index of liberalization (-1)
-2.467*** -1.738*** -1.431*** -0.773 2.457*** 1.654*** 1.696*** 0.631 (0.385) (0.384) (0.441) (0.535) (0.392) (0.391) (0.452) (0.546) Real GDP growth (Annual percent change) (-
1) -0.049** -0.039 -0.062* 0.085*** 0.083*** 0.108***
(0.022) (0.024) (0.032) (0.023) (0.025) (0.032) Agriculture, value added (% of GDP) (-1) -0.032 -0.046 0.036 0.064 (0.032) (0.041) (0.032) (0.042) Inflation, consumer prices (annual %) (-1) 0.002*** -0.003*** (0.001) (0.001) Net official development assistance and official aid received (% of GDP) (-1)
0.023 -0.016 (0.038) (0.038) Country FE Yes Yes Yes Yes Yes Yes Yes Yes Year FE Yes Yes Yes Yes Yes Yes Yes Yes Observations 2,562 2,454 2,013 1,411 2,519 2,412 1,968 1,386 Number of countries 132 132 125 93 130 130 123 92 R-squared 0.037 0.031 0.031 0.065 0.037 0.032 0.033 0.077 Notes: The table reports results from the regression as dependent variables: i) the ratio of direct taxes excluding social contributions and resource revenue over non-resource tax excluding social contributions; ii) the ratio non-resource component of Indirect tax over non-resource tax excluding social contributions. The independent variable of interest is SW/WW liberalization indicator as well as several controls. The country year observation Turkmenistan-2004 has been removed from the sample used in Columns (1) to (4) due to internal inconsistency in the GRD dataset. The following country-year observations have been removed from the sample used In Columns (5)-(8) due inconsistency in the GRD dataset. Bahamas-1989, Guinea-1985, Turkmenistan-2004, Vanuatu-1994, 1995, and 1996. *** denotes significance at the1% level, ** at the 5% level, and * at the 10% level.

21
Table 8: Trade Liberalization and Structure of Taxation—Direct Tax Composition
Personal income tax to non-resource tax excluding social contributions
Non-resource component of corporations and other enterprises tax to non-resource tax
excluding social contributions (1) (2) (3) (4) (5) (6) (7) (8) Sachs-Warner/Wacziarg-Welch index of liberalization (-1)
0.102 0.636* -0.092 -0.389 -3.052*** -2.808*** -2.360*** -1.184* (0.353) (0.341) (0.364) (0.390) (0.459) (0.467) (0.566) (0.626) Real GDP growth (Annual percent change) (-1)
0.014 0.020 -0.039* -0.087*** -0.088*** -0.038 (0.019) (0.019) (0.022) (0.026) (0.030) (0.034) Agriculture, value added (% of GDP) (-1) -0.041 -0.016 -0.058 -0.050 (0.026) (0.027) (0.040) (0.044) Inflation, consumer prices (annual %) (-1) -0.001 0.004*** (0.000) (0.001) Net official development assistance and official aid received (% of GDP) (-1)
-0.044* 0.122***
(0.025) (0.039) Country FE Yes Yes Yes Yes Yes Yes Yes Yes Year FE Yes Yes Yes Yes Yes Yes Yes Yes Observations 2,121 2,026 1,645 1,117 2,026 1,947 1,582 1,037 Number of countries 127 127 121 90 123 123 116 85 R-squared 0.012 0.015 0.018 0.027 0.037 0.044 0.040 0.080 Notes: The table reports results from regressions using as dependent variables: i) the ratio of personal income tax over non-resource tax excluding social contributions and ii) the ratio of non-resource component of corporations and other enterprises tax over non-resource tax excluding social contributions. The independent variable of interest is SW/WW liberalization indicator as well as several controls. The country year observation Botswana 1990 has been removed from the sample used in Columns (5) to (8) due to internal inconsistency in the GRD dataset. *** denotes significance at the1% level, ** at the 5% level, and * at the 10% level

22
4.2 Trade Liberalization and VAT
Since its introduction in 1954, VAT quickly became a major tax. VAT has been adopted by more than 160 countries. Keen and Lockwood (2010) estimated that VAT constitutes more than 20 percent of world’s tax revenue. In most countries over 50 percent of the VAT revenues are collected at the border, hence its importance in the analysis of trade liberalization. Importantly, the implementation of VAT also allows to capture the state capacity in the tax area.
In this sub-section we explore whether VAT mediates the relationship between trade liberalization and tax revenues. To do so we augment our main specification shown in equation (2) with an interaction term between trade liberalization episodes and VAT adoption as an additional independent variable. The interaction allows us to test specifically whether countries which have implemented VAT prior to liberalization have fared better in terms of tax revenue mobilization.
Tables 9 and 10 present the results using aggregate tax revenues and non-resource tax revenues respectively. In Table 9, the interaction is positive but not statistically significant across all Columns from 1 to 4. The positive sign indicates that the presence of VAT boosts revenue mobilization following liberalization albeit not significantly. In Table 10, the interaction is also positive and statistically significant across all Columns from (1) to (4).
When removing natural resource rents from aggregate tax revenues, VAT appears to play an important role in mediating the effect of liberalization on tax revenues. Regression results presented in Table 10 adjust tax revenues for natural resource rents. Across all columns the interaction terms associated between trade liberalization and VAT implementation are positive and significance pointing to important role of VAT in mitigating the negative effect of liberalization on tax revenues. Quantitatively, the interaction effect is large. Take two countries experiencing liberalization and differing only in whether they have implemented VAT prior to liberalization. According to the estimated coefficient presented in Column 1 in Table 10, the country without VAT would face a loss in tax revenues of minus 1.952 percent of GDP while the country with VAT will face a loss of (only) minus 0.371 percent of GDP (=-1.952 + 1.581). These results are in line with Ebrill et al. (2001) and Keen and Lockwood (2010) who suggest a revenue gain associated with the adoption of VAT. Our results here more specifically suggest that having implementing VAT prior to liberalization allows countries to perform better in

23
terms of tax revenue mobilization everything else being equal. An alternative explanation is that VAT, which remains heavily collected at the border, substitutes for tariffs. The issue of VAT credit refunds in developing countries reinforces this view of a VAT as a quasi-tariff in less developing countries (Cnossen, 2019).
In Appendix D, we probe these results further. We split countries according to whether they opened before or after the adoption of VAT. Tables D1 and D2 presents the results for aggregate tax revenues and non-resource tax revenues respectively. The results suggest that countries that did not have VAT before openness are the one suffering the most in term of revenue lost. In other word, setting up domestic tax sources may ease the revenue loss associated with liberalization. VAT implementation helps the domestic tax system “cope” with trade liberalization.16
16 In the context of World Bank’s programs, Rajaram (1994) argues that tariff reform aimed at reducing domestic protection holds the threat of widening the fiscal deficit by causing tariff revenue to decline. He further argues that because the success of an adjustment program depends critically on the correction of fiscal imbalances to achieve stabilization, tariff reforms must be coordinated with tax policy.

24
Table 1: Trade Liberalization and Aggregate Tax Revenues—VAT Adoption
Revenue excluding grants and social contributions to GDP (1) (2) (3) (4)
Sachs-Warner/Wacziarg-Welch index of liberalization (-1)
-1.050*** -1.142*** -0.907*** -0.768**
(0.315) (0.321) (0.346) (0.359) Sachs-Warner/Wacziarg-Welch index of liberalization (-1)
x Dummy VAT 0.632** 0.419 0.266 0.295
(0.308) (0.309) (0.325) (0.330) Real GDP growth (Annual percent change) (-1) 0.042*** 0.032** 0.031*
(0.014) (0.014) (0.016) Agriculture, value added (% of GDP) (-1) -0.192*** -0.133***
(0.019) (0.021) Inflation, consumer prices (annual %) (-1) 0.000
(0.000) Net official development assistance and official aid received (% of GDP) (-1)
-0.037**
(0.017) Country FE Yes Yes Yes Yes Year FE Yes Yes Yes Yes Observations 2,697 2,565 2,224 1,590 Number of countries 135 135 128 95 R-squared 0.027 0.032 0.078 0.087 Notes: The table reports results from the regressions using as dependent variable the ratio of government revenue excluding grants and social contributions over GDP with as independent variables SW/WW liberalization indicator plus an interaction term between the latter and the adoption of VAT as well as several controls. *** denotes significance at the1% level, ** at the 5% level, and * at the 10% level.

25
Table 2: Trade Liberalization and Non-Resource Tax Revenues—VAT Adoption
Non-resource tax excluding social contributions to GDP (1) (2) (3) (4)
Sachs-Warner/Wacziarg-Welch index of liberalization (-1)
-1.952*** -1.908*** -1.212*** -1.186*** (0.217) (0.221) (0.234) (0.270) Sachs-Warner/Wacziarg-Welch index of liberalization (-1)
x Dummy VAT 1.581*** 1.343*** 1.197*** 1.160***
(0.208) (0.210) (0.222) (0.251) Real GDP growth (Annual percent change) (-1) 0.027*** 0.023** -0.003 (0.010) (0.010) (0.011) Agriculture, value added (% of GDP) (-1) -0.105*** -0.054*** (0.013) (0.015) Inflation, consumer prices (annual %) (-1) 0.001* (0.000) Net official development assistance and official aid received (% of GDP) (-1)
-0.022 (0.014) Country FE Yes Yes Yes Yes Year FE Yes Yes Yes Yes Observations 2,831 2,698 2,221 1,552 Number of countries 134 134 127 95 R-squared 0.045 0.045 0.074 0.074 Notes: The table reports results from the regressions using as dependent variable the ratio of non-resource tax revenues to GDP with as independent variables SW/WW liberalization indicator plus an interaction term between the latter and the adoption of VAT as well as several controls. *** denotes significance at the1% level, ** at the 5% level, and * at the 10% level.

26
5. Conclusion
This paper explored the dynamic effects of trade liberalization on tax revenues using a worldwide panel dataset. Results point to significant negative effects of liberalization on (non-resource) tax revenues in the short term and no significant effect in the medium term. Liberalization also alter the tax structure tilting revenues toward indirect taxes away from direct ones. Economies which have implemented value added taxes prior to liberalization have mitigated its negative effects on tax revenues. The evidence is supportive of the complementarity role of state capacity to reap the benefits of liberalization.
Further research could look at the issue at tax spillovers stemming from belonging to custom and monetary unions. Indeed, many countries around the world belong to monetary and customs unions, which entails deeper economic integration and in turn leading to important spillover from tax policy. A network analysis of tax spillovers in these unions could allow the identification of weakest-links. That is countries which exposes all the other customs union members to risks of indirect or direct tax base erosion. This analysis would rely on the existence of tax treaties, which link these countries inside unions to tax havens.

27
References
Atkin, D., and Khandelwal, A. K. (2020). How distortions alter the impacts of international trade in developing countries. Annual Review of Economics, 12, 213-238.
Auriol, E. and Warlters, M. (2005). Taxation base in developing countries. Journal of Public Economics, 89(4), 625-646.
Baldwin, R. E. (2003). Openness and Growth: What's the Empirical Relationship?. NBER Working Paper, 9578, National Bureau of Economic Research
Baunsgaard, T., and Keen, M. (2010). Tax revenue and (or?) trade liberalization. Journal of Public Economics, 94(9-10), 563-577.
Bergquist, L. and Dinerstein, M. (2020). Competition and entry in agricultural markets: Experimental evidence from Kenya. American Economic Review, 110(2), 3705-46
Besley, T., and Persson, T. (2014). Why do developing countries tax so little?. Journal of Economic Perspectives, 28(4), 99-120.
Buera, F. J., Monge-Naranjo, A., and Primiceri, G. E. (2011). Learning the wealth of nations. Econometrica, 79(1), 1-45.
Caldeira, E., Geourjon, A.-M. and Rota-Graziosi, G. (2020). Taxing aid: The end of a paradox? International tax and Public Finance, 27, 240-250.
Cagé, J., and Gadenne, L. (2018). Tax revenues and the fiscal cost of trade liberalization, 1792–2006. Explorations in Economic History, 70, 1-24.
Cnossen, S., (2019). Modernizing VATs in Africa. Oxford University Press.
Collier, P. (2006). Is aid oil? An analysis of whether Africa can absorb more aid. World development, 34(9), 1482-1497.
Crivelli, E., and Gupta, S. (2014). Resource blessing, revenue curse? Domestic revenue effort in resource-rich countries. European Journal of Political Economy, 35, 88-101.
Dharmapala, D. (2014). What do we know about base erosion and profit shifting? A review of the empirical literature. Fiscal Studies, 35(4), 421-448.
Dharmapala, D. (2019, May). Profit shifting in a Globalized World. AEA Papers and Proceedings, 109, 488-92.

28
Dharmapala, D., and Hines Jr, J. R. (2009). Which countries become tax havens?. Journal of Public Economics, 93(9-10), 1058-1068.
Ebrill, M., Keen, M., and Perry, V. (2001). The modern VAT. International Monetary Fund.
Egger, P. H., Nigai, S., and Strecker, N. M. (2019). The taxing deed of globalization. American Economic Review, 109(2), 353-90.
Frankel, J. A., and Romer, D. H. (1999). Does trade cause growth?. American Economic Review, 89(3), 379-399.
Genschel, P., & Seelkopf, L. (2019). . Codebook – Tax Introduction Dataset (TID). Version May 2019.
Goldberg, P., and Pavcnik, N. (2004). Trade, Inequality, and Poverty: What Do We Know? Evidence from Recent Trade Liberalization Episodes in Developing Countries. NBER Working Paper, 10593, National Bureau of Economic Research.
Hines Jr, J. R., and Summers, L. H. (2009). How Globalization Affects Tax Design. Tax Policy and the Economy, 23(1), 123-158.
International Center for Tax and Development/The United Nations University World Institute for Development Economics Research (ICTD/UNI-WIDER) (2017). “Government Revenue Dataset.” https://www.wider.unu.edu/project/government-revenue-dataset.
James, A. (2015). US state fiscal policy and natural resources. American Economic Journal: Economic Policy, 7(3), 238-57.
Jordà, Ò. (2005). Estimation and inference of impulse responses by local projections. American Economic Review, 95(1), 161-182.
Keen, M., and Lockwood, B. (2010). The value added tax: Its causes and consequences. Journal of Development Economics, 92(2), 138-151.
Lotz, J. R., and Morss, E. R. (1970). A theory of tax level determinants for developing countries. Economic Development and Cultural Change, 18(3), 328-341.
Martinez-Vazquez, J., Vulovic, V., and Liu, Y. (2011). Direct versus indirect taxation: trends, theory, and economic significance In The Elgar guide to tax systems, Edward Elgar Publishing, pp.37-92.

29
Mehlum, H., Moene, K., and Torvik, R. (2006). Institutions and the resource curse. The Economic Journal, 116(508), 1-20.
Morrissey, O. (2015). Aid and government fiscal behavior: Assessing recent evidence. World Development, 69, 98-105.
Rajaram, A. (1994). Tariff and tax reforms-do World Bank recommendations integrate revenue and protection objectives?. The Economic Studies Quarterly, 45(4), 321-338.
Robinson, J. A., Torvik, R., and Verdier, T. (2006). Political foundations of the resource curse. Journal of Development Economics, 79(2), 447-468.
Rodriguez, F., and Rodrik, D. (2000). Trade policy and economic growth: a skeptic's guide to the cross-national evidence. NBER macroeconomics annual, 15, 261-325.
Rota-Graziosi, G. (2019). The supermodularity of the tax competition game. Journal of Mathematical Economics, 83, 25-35.
Seelkopf, L., Bubek, M., Eihmanis, E., Ganderson, J., Limberg, J., Mnaili, Y., Zuluaga, P., and Genschel, P. (2019). The rise of modern taxation: A new comprehensive dataset of tax introductions worldwide. The Review of International Organizations, 1-25.
Tanzi, V., 1978. Inflation, real tax revenue, and the case for inflationary finance: theory with an application to Argentina. Staff papers, 25(3), pp.417-451.
Ulyssea, G. (2018). Firms, informality, and development: Theory and evidence from Brazil. American Economic Review, 108(8), 2015-47.
Wacziarg, R., and Welch, K. H. (2008). Trade liberalization and growth: New evidence. The World Bank Economic Review, 22(2), 187-231.
Winters, L. A. (2004). Trade liberalisation and economic performance: an overview. The Economic Journal, 114(493), F4-F21.
World Bank, World Development Indicators: https://databank.worldbank.org/source/world-development-indicators

30
Appendix A. Data
Table A3: Summary Statistics
Obs. Mean Std. Dev. Min Max Sachs-Warner/Wacziarg-Welch index of liberalization 6268 0.44 0.50 0.00 1.00 Revenue excluding grants and social contributions 5789 22.98 11.12 0.68 109.04 Non-resource tax excluding social contributions 5689 16.32 7.81 0.00 56.92 Direct taxes excluding social contributions, including resource revenue 5017 6.56 5.08 0.00 34.71 Non-Resource Component of Indirect Tax 5114 10.10 4.82 0.02 45.40 Total trade % of GDP 5979 86.15 56.96 0.02 860.80 Real GDP growth (Annual percent change) 6553 3.50 6.52 -66.70 148.00 Agriculture, value added (% of GDP) 5392 16.62 14.75 0.00 93.98 Inflation, consumer prices (annual %) 7096 24.82 352.47 -60.50 23773.13 Net official development assistance and official aid received (% of GDP) 5524 7.09 10.63 -2.27 139.89 Notes: The table shows basic summary statistics for the variables used in this paper.

31
Table A1: VAT Introduction Year and (First) Liberalization Episode
Country
Year in which the economy has liberalized (if liberalized before 1950, use 1950 as year of opening)
Year in which VAT was introduced Country
Year in which the economy has liberalized (if liberalized before 1950, use 1950 as year of opening)
Year in which VAT was introduced
Albania 1992 1995 Japan 1964 1988 Argentina 1991 1975 Kazakhstan 2001 1992 Armenia 1995 1992 Kenya 1963 1990 Australia 1964 1999 Kyrgyz Republic 1994 1992 Austria 1960 1973 Korea, Rep. 1968 1976 Azerbaijan 1995 1992 Liberia 1998 Belgium 1959 1971 Sri Lanka 1950 2002 Benin 1990 1991 Lithuania 1993 1994 Burkina Faso 1998 1993 Luxembourg 1959 1970 Bangladesh 1996 1991 Latvia 1993 1992 Bulgaria 1991 1994 Morocco 1956 1985 Bolivia 1956 1973 Moldova 1994 1992 Brazil 1991 1966 Madagascar 1996 1994 Barbados 1966 1997 Mexico 1986 1980 Botswana 1979 2002 Macedonia, FYR 1994 2000 Canada 1952 1991 Mali 1988 1991 Switzerland 1950 1995 Mozambique 1995 1999 Chile 1976 1975 Mauritania 1995 1995 Cote d'Ivoire 1994 1992 Mauritius 1968 1998 Cameroon 1993 1999 Malawi 1997 1989 Congo, Dem. Rep. 2001 2010 Malaysia 1963 2014 Congo, Rep. 2002 1997 Niger 1994 1986 Colombia 1986 1975 Nigeria 2002 1994 Cabo Verde 1991 2002 Nicaragua 1950 1970 Costa Rica 1952 1975 Netherlands 1959 1969 Cyprus 1960 1990 Norway 1950 1970 Czech Republic 1993 1993 Nepal 1991 1997 Germany 1959 1968 New Zealand 1986 1986 Denmark 1959 1967 Pakistan 2001 1995

32
Dominican Republic 1992 1983 Panama 1996 1977 Ecuador 1950 1970 Peru 1950 1973 Egypt, Arab Rep. 1995 1991 Philippines 1988 1988 Spain 1959 1986 Papua New Guinea 1999 1999 Estonia 1999 1992 Poland 1990 1993 Ethiopia 1997 2003 Portugal 1950 1986 Finland 1960 1994 Paraguay 1989 1993 France 1959 1968 Romania 1992 1993 United Kingdom 1950 1973 Singapore 1965 1994 Georgia 1996 1992 Sierra Leone 2001 2009 Ghana 1985 1998 El Salvador 1950 1992 Guinea 1986 1996 Slovak Republic 1992 1993 Gambia, The 1985 2012 Slovenia 1991 1999 Guinea-Bissau 1987 Sweden 1960 1969 Greece 1959 1986 Syrian Arab Republic 1950 Guatemala 1950 1983 Thailand 1950 1991 Guyana 1988 2007 Tajikistan 1996 1992 Hong Kong SAR, China 1950 Trinidad and Tobago 1992 1990 Honduras 1950 1976 Tunisia 1989 1988 Croatia 2000 1995 Turkey 1950 1985 Haiti 1999 1982 Taiwan, China 1963 1986 Hungary 1990 1988 Tanzania 1995 1998 Indonesia 1970 1985 Uganda 1988 1996 India 1997 2017 Uruguay 1990 1968 Ireland 1966 1972 United States 1950 Israel 1985 1975 Venezuela, RB 1950 1993 Italy 1959 1973 Yemen, Rep. 1967 1999 Jamaica 1962 1991 South Africa 1991 1991 Jordan 1965 2001 Zambia 1993 1995
Sources: Tax Introduction Database for VAT introduction year (see Seelkopf et al. (2019) and Genschel and Seelkopf (2019). The (first) liberalization episodes are from Sachs and Warner/Wacziarg and Welch (2008) (SW/WW).
33
Appendix B: Robustness Checks—Outcome-Based Measure of Liberalization
Table B1: Trade Liberalization and Aggregate Tax Revenues—Sample Adjustment
Revenue excluding grants and social contributions to GDP (1) (2) (3) (4) Total trade % of GDP (-1) 0.008** 0.009*** 0.016*** 0.015*** (0.003) (0.004) (0.004) (0.004) Real GDP growth (Annual percent change) (-1) 0.015 0.035** 0.033** (0.011) (0.014) (0.015) Agriculture, value added (% of GDP) (-1) -0.186*** -0.129*** (0.018) (0.019) Inflation, consumer prices (annual %) (-1) -0.000 (0.000) Net official development assistance and official aid received (% of GDP) (-1) -0.008 (0.017) Country FE Yes Yes Yes Yes Year FE Yes Yes Yes Yes Observations 3,286 3,203 2,803 2,025 Number of Countries 177 176 167 127 R-squared 0.025 0.029 0.073 0.077 Notes: The table reports results for regressions using as dependent variable tax revenues excluding social contributions over GDP with as independent variables an outcome based measure of liberalization that is the sum of exports and imports of goods and services over GDP as well as several controls. The sample is adjusted to match the sample using SW/WW liberalization indicator shown in Table 1 of the main text. *** denotes significance at the1% level, ** at the 5% level, and * at the 10% level.

34
Table B2: Trade Liberalization and Non-Resource Tax Revenues—Sample Adjustment
Non-resource tax excluding social contributions to GDP (1) (2) (3) (4) Total trade % of GDP (-1) -0.004 -0.002 0.004 0.007** (0.002) (0.002) (0.003) (0.003) Real GDP growth (Annual percent change) (-1) -0.015** 0.022** -0.001 (0.007) (0.009) (0.010) Agriculture, value added (% of GDP) (-1) -0.125*** -0.063*** (0.012) (0.013) Inflation, consumer prices (annual %) (-1) 0.001* (0.000) Net official development assistance and official aid received (% of GDP) (-1) -0.012 (0.012) Country FE Yes Yes Yes Yes Year FE Yes Yes Yes Yes Observations 3,330 3,243 2,735 1,944 Number of Countries 174 172 163 125 R-squared 0.014 0.016 0.064 0.052 Notes: The table reports results for regressions using as dependent variable non-resource tax revenues excluding grants and social contributions over GDP with as independent variables an outcome based measure of liberalization that is the sum of exports and imports of goods and services over GDP as well as several controls. The sample is adjusted to match the availability of SW/WW liberalization indicator as shown in Table 2 of the main text. *** denotes significance at the1% level, ** at the 5% level, and * at the 10% level.

35
Table B3: Trade Liberalization and Aggregate Tax Revenues—Non-Resource Trade
Revenue excluding grants and social contributions to GDP (1) (2) (3) (4) Non-resource trade (% GDP) (-1) -0.009*** -0.010*** -0.023*** -0.022***
(0.003) (0.003) (0.004) (0.005) Real GDP growth (Annual percent change) (-1) 0.044*** 0.071*** 0.058***
(0.016) (0.016) (0.019) Agriculture, value added (% of GDP) (-1) -0.148*** -0.130***
(0.021) (0.022) Inflation, consumer prices (annual %) (-1) -0.001**
(0.000) Net official development assistance and official aid received (% of GDP) (-1) -0.004
(0.025) Country FE Yes Yes Yes Yes Year FE Yes Yes Yes Yes Observations 3,890 3,855 3,390 2,424 Number of countries 178 177 169 137 R-squared 0.071 0.076 0.120 0.140 Notes: The table reports results for regressions using as dependent variable tax revenues excluding grants and social contributions over GDP with as independent variables an outcome based measure of liberalization. The outcome measure is the difference between sum of exports and imports of merchandise excluding exports of natural resources over GDP as well as several controls. We use available data from World Bank, World Development Indicators on resource exports as a share of merchandise exports and merchandise exports and imports in US dollars to compute the outcome base measure. *** denotes significance at the1% level, ** at the 5% level, and * at the 10% level.

36
Table B4: Trade Liberalization and Non-Resource Tax Revenue—Non-Resource Trade
Non-resource tax excluding social contributions to GDP (1) (2) (3) (4) Non-resource trade (% GDP) (-1) -0.003 -0.003 -0.008*** 0.002
(0.002) (0.002) (0.003) (0.004) Real GDP growth (Annual percent change) (-1) 0.031*** 0.064*** 0.031**
(0.010) (0.012) (0.014) Agriculture, value added (% of GDP) (-1) -0.125*** -0.120***
(0.015) (0.016) Inflation, consumer prices (annual %) (-1) -0.001
(0.001) Net official development assistance and official aid received (% of GDP) (-1) -0.011
(0.019) Country FE Yes Yes Yes Yes Year FE Yes Yes Yes Yes Observations 3,918 3,875 3,323 2,344 Number of countries 175 173 165 134 R-squared 0.103 0.110 0.156 0.196 Notes: The table reports results for regressions using as dependent variable non-resource tax revenues excluding grants and social contributions over GDP with as independent variables an outcome based measure of liberalization that is the sum of exports and imports of goods and services excluding natural resource exports over GDP as well as several controls. *** denotes significance at the1% level, ** at the 5% level, and * at the 10% level.
37
Appendix C: First Stage of the Two Stage Least Square Estimation
Table C1: Trade Liberalization and Aggregate Tax Revenues—First Stage Regression
Sachs-Warner/Wacziarg-Welch index of liberalization (-1) (1) (2) (3) (4) Sachs-Warner/Wacziarg-Welch index of liberalization (-2) 0.811*** 0.797*** 0.780*** 0.793*** (0.014) (0.014) (0.016) (0.018) Distance-weighted growth open Economies (-2) -0.438* -0.683*** -0.681*** -0.540* (0.231) (0.246) (0.258) (0.325) Distance-weighted growth closed Economies (-2) 0.003 0.022 0.020 -0.165 (0.170) (0.175) (0.185) (0.222) Distance-weighted average openness (-2) 0.067* 0.059 0.045 0.073 (0.038) (0.039) (0.043) (0.053) Real GDP growth (Annual percent change) (-1) 0.002*** 0.002** 0.002** (0.001) (0.001) (0.001) Agriculture, value added (% of GDP) (-1) 0.003*** 0.004** (0.001) (0.002) Inflation, consumer prices (annual %) (-1) 0.000*** (0.000) Net official development assistance and official aid received (% of GDP) (-1) 0.003** (0.001) Country FE Yes Yes Yes Yes Year FE Yes Yes Yes Yes Observations 1,999 1,912 1,678 1,153 Number of countries 100 100 94 66 F-stat 219.1 202.0 146.2 100.0 R-squared 0.773 0.767 0.738 0.752 Notes: The table reports results for the first stage regression corresponding to the second stage when using as dependent variable tax revenues excluding grants and social contributions over GDP with as independent variable SW/WW liberalization indicator as well as several controls. The first stage uses as dependent variable SW/WW trade liberalization indicator regressed on a set of variables based on learning from neighbors derived from the reduced-form specification presented in Buera et al. (2011).The *** denotes significance at the1% level, ** at the 5% level, and * at the 10% level.

38
Table C2: Trade Liberalization and Non-Resource Tax Revenues—First Stage Regression
Sachs-Warner/Wacziarg-Welch index of liberalization (-1) (1) (2) (3) (4) Sachs-Warner/Wacziarg-Welch index of liberalization (-2) 0.803*** 0.789*** 0.778*** 0.782*** (0.013) (0.014) (0.016) (0.019) Distance-weighted growth open Economies (-2) -0.430* -0.663*** -0.528** -0.369 (0.234) (0.250) (0.267) (0.368) Distance-weighted growth closed Economies (-2) -0.032 -0.008 -0.079 -0.326 (0.168) (0.173) (0.185) (0.232) Distance-weighted average openness (-2) 0.113*** 0.117*** 0.111*** 0.111** (0.035) (0.036) (0.040) (0.052) Real GDP growth (Annual percent change) (-1) 0.002** 0.002** 0.001 (0.001) (0.001) (0.001) Agriculture, value added (% of GDP) (-1) 0.002* 0.004** (0.001) (0.002) Inflation, consumer prices (annual %) (-1) -0.000 (0.000) Net official development assistance and official aid received (% of GDP) (-1) 0.004** (0.002) Country FE Yes Yes Yes Yes Year FE Yes Yes Yes Yes Observations 2,117 2,035 1,698 1,141 Number of countries 99 99 93 66 F-stat 233.9 219.1 160.0 103.7 R-squared 0.773 0.769 0.753 0.761 Notes: The table reports results for the first stage regression corresponding to the second stage when using as dependent variable non-resource tax revenues excluding grants and social contributions over GDP with as independent variable SW/WW liberalization indicator as well as several controls. The first stage uses as dependent variable SW/WW trade liberalization indicator regressed on a set of variables based on learning from neighbors derived from the reduced-form specification presented in Buera et al. (2011). The *** denotes significance at the1% level, ** at the 5% level, and * at the 10% level.

39
Appendix D. Tax Revenues and Trade Liberalization—Before and After VAT Implementation
Table D1: Trade Liberalization and Aggregate Tax Revenue—VAT Adoption
Liberalization after VAT adoption Liberalization before VAT adoption Revenues excluding grants and social contributions to GDP (1) (2) (3) (4) (5) (6) (7) (8)
Sachs-Warner/Wacziarg-Welch index of liberalization (-1)
-0.285 -0.409 0.030 -0.775* -1.261*** -1.566*** -1.786*** -0.415 (0.549) (0.553) (0.528) (0.427) (0.300) (0.312) (0.364) (0.437) Real GDP growth (Annual percent change) (-1) 0.092** 0.069** 0.058* 0.081*** 0.075*** 0.022 (0.036) (0.034) (0.030) (0.020) (0.022) (0.028) Agriculture, value added (% of GDP) (-1) -0.213*** -0.152*** -0.155*** -0.052 (0.041) (0.038) (0.024) (0.032) Inflation, consumer prices (annual %) (-1) -0.000 -0.000 (0.001) (0.000) Net official development assistance and official aid received (% of GDP) (-1)
-0.067 -0.021
(0.044) (0.025) Country FE Yes Yes Yes Yes Yes Yes Yes Yes Year FE Yes Yes Yes Yes Yes Yes Yes Yes Observations 607 590 541 499 1,440 1,391 1,153 697 Number of countries 33 33 31 29 69 69 65 42 R-squared 0.123 0.137 0.163 0.133 0.053 0.058 0.089 0.076 Notes: The table reports results for regressions using as dependent variable tax revenues excluding grants and social contributions over GDP with as independent variable SW/WW liberalization indicator as well as several controls for observations including liberalization either prior to or following VAT adoption. *** denotes significance at the1% level, ** at the 5% level, and * at the 10% level.

40
Table D2: Trade Liberalization and Non-Resource Tax Revenue—VAT Adoption
Liberalization after VAT adoption Liberalization before VAT adoption Non-resource tax revenues excluding social contributions to GDP (1) (2) (3) (4) (5) (6) (7) (8)
Sachs-Warner/Wacziarg-Welch index of liberalization (-1)
-0.189 -0.200 0.184 -0.330 -1.606*** -1.882*** -1.684*** -0.651* (0.320) (0.326) (0.288) (0.270) (0.244) (0.250) (0.280) (0.352) Real GDP growth (Annual percent change) (-1) 0.030 0.013 -0.008 0.077*** 0.089*** 0.041* (0.020) (0.019) (0.019) (0.017) (0.017) (0.023) Agriculture, value added (% of GDP) (-1) -0.081*** -0.050** -0.144*** -0.055** (0.023) (0.024) (0.019) (0.026) Inflation, consumer prices (annual %) (-1) -0.000 0.002 (0.000) (0.002) Net official development assistance and official aid received (% of GDP) (-1)
-0.081*** 0.000
(0.029) (0.026) Country FE Yes Yes Yes Yes Yes Yes Yes Yes Year FE Yes Yes Yes Yes Yes Yes Yes Yes Observations 644 628 562 508 1,548 1,490 1,142 668 Number of countries 33 33 31 29 68 68 64 42 R-squared 0.072 0.079 0.072 0.064 0.066 0.077 0.139 0.166 Notes: The table reports results for regressions using as dependent variable non resource tax revenues excluding grants and social contributions over GDP with as independent variable SW/WW liberalization indicator as well as several controls for observations including liberalization either prior to or following VAT adoption. *** denotes significance at the1% level, ** at the 5% level, and * at the 10% level.