this is with host... your 100 200 300 400 500 relations and functions graphing linear equations...
TRANSCRIPT

THIS
IS

With
Host...
Your
100 100 100 100 100
200 200 200 200 200
300 300 300 300 300
400 400 400 400 400
500 500 500 500 500
Relations and
Functions
Graphing Linear
Equations
Random Slope and Intercept
Systems of Equations

What is the domain and range of this set of numbers? Is it a
function?
A 100
X Y
3 4
1 7
6 8
-1 11
4 13
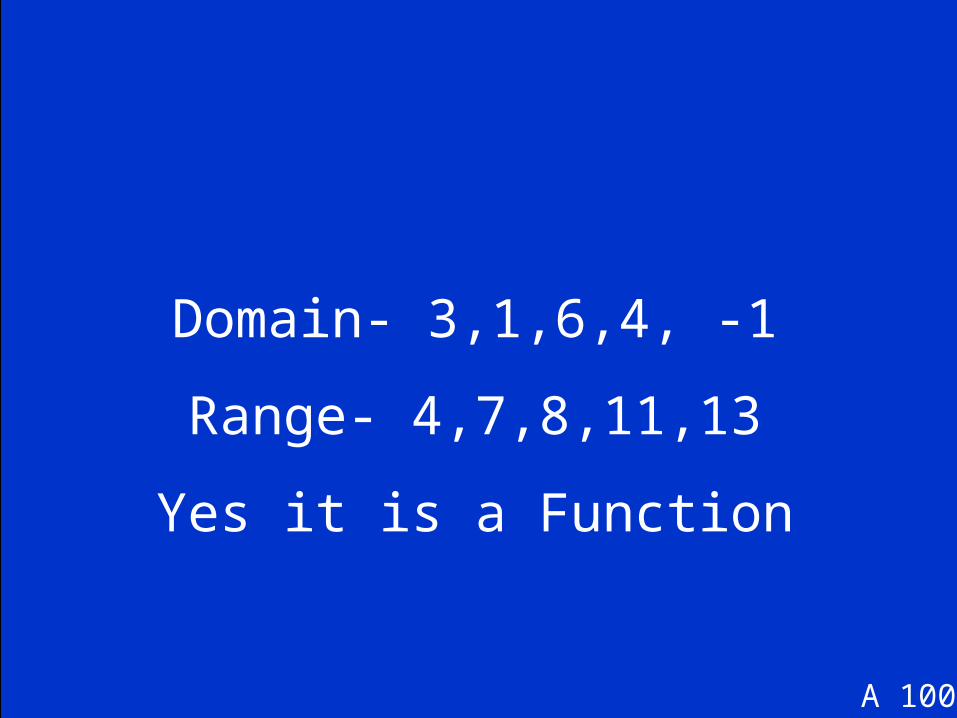
Domain- 3,1,6,4, -1
Range- 4,7,8,11,13
Yes it is a Function
A 100
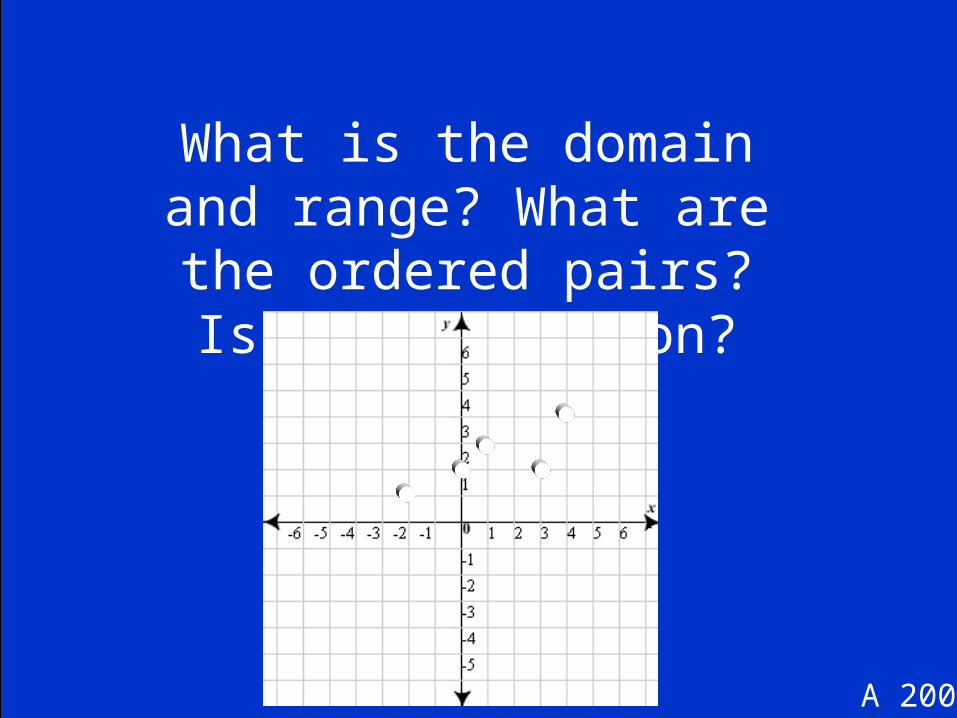
What is the domain and range? What are the ordered
pairs? Is it a function?
A 200
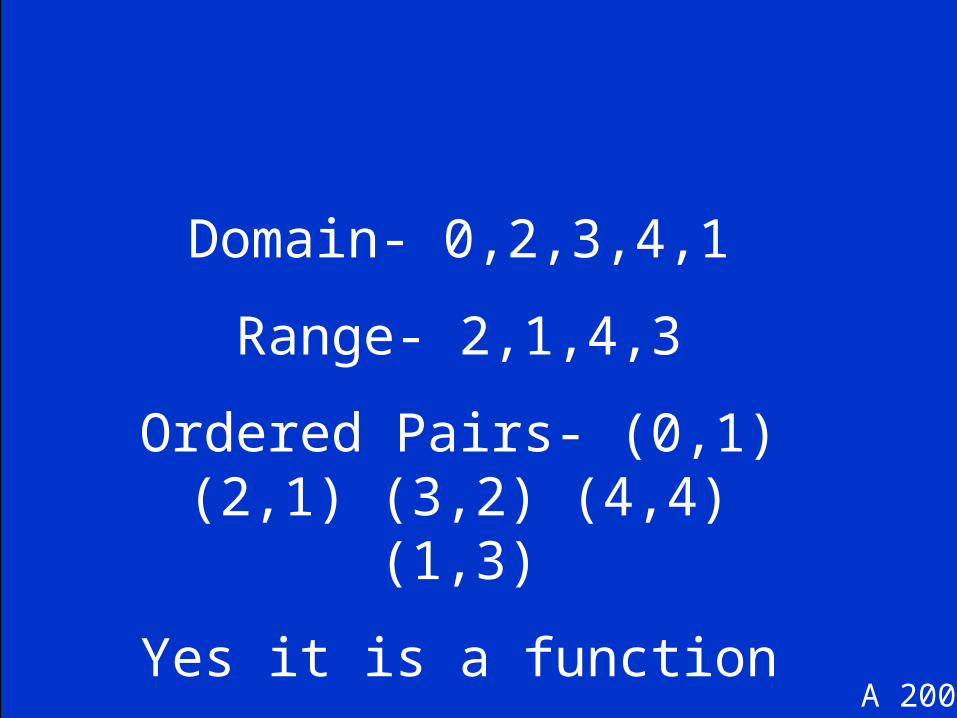
Domain- 0,2,3,4,1
Range- 2,1,4,3
Ordered Pairs- (0,1) (2,1) (3,2) (4,4) (1,3)
Yes it is a function
A 200

A 300
Is it a function?

Yes, it is a function
A 300

Is it a function?
A 400

No, it is not a function
A 400

Is it a function?
A 500

Yes, it is a function
A 500

Find three solutions for the equation. Write the solutions
as ordered pairs.
y = 2x
B 100
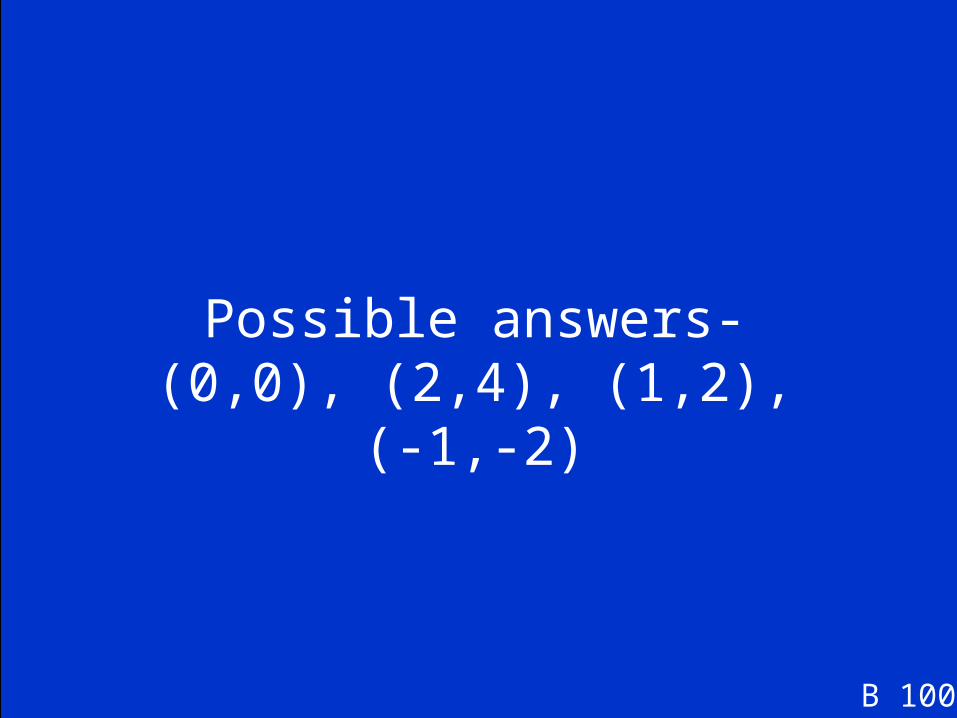
Possible answers- (0,0), (2,4), (1,2), (-1,-2)
B 100
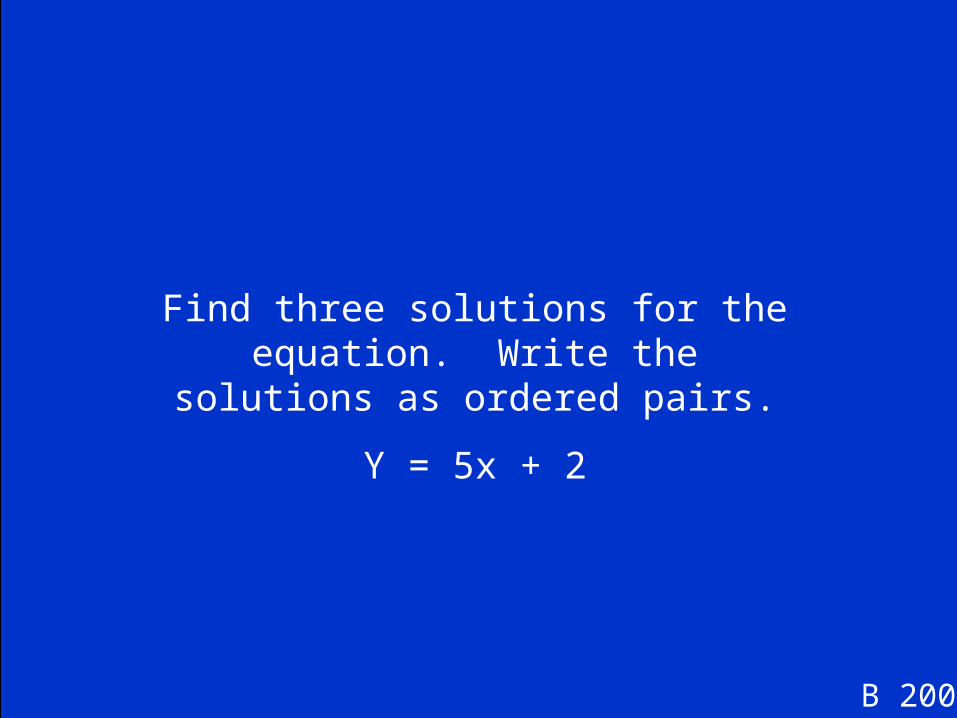
Find three solutions for the equation. Write the solutions as ordered pairs.
Y = 5x + 2
B 200
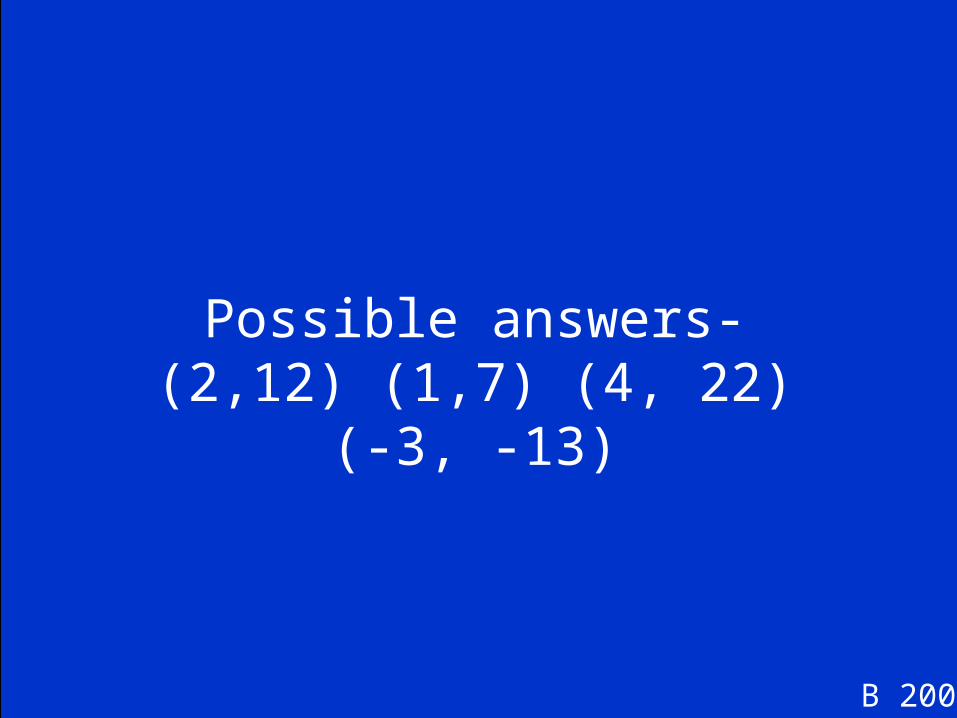
Possible answers- (2,12) (1,7) (4, 22) (-3, -13)
B 200

Find three solutions for the equation. Write the solutions as ordered pairs.
-2x + y = - 4
B 300

Possible answers- (0, -4) (3, 2) (-1, -6) (-4, -12)
B 300

Find three solutions for the equation. Write the solutions as ordered pairs.
X= -4
B 400
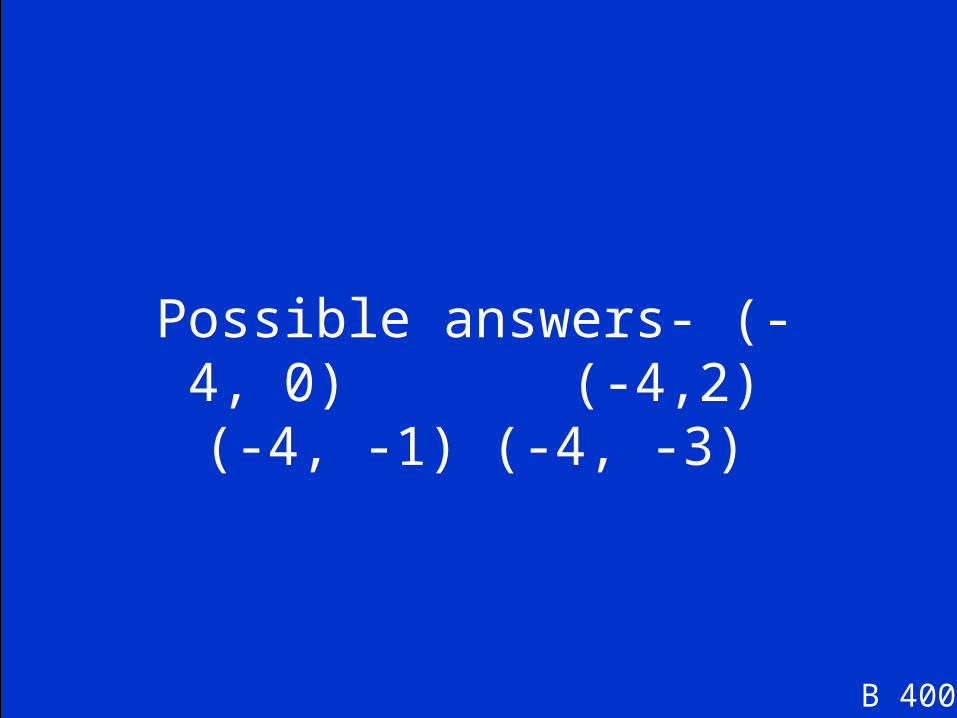
Possible answers- (-4, 0) (-4,2) (-4, -1) (-4, -3)
B 400

Find three solutions for the equation. Write the solutions as ordered pairs.
X - Y= 1
B 500

Possible answers:
( 1,0) (0,-1) (-1,-2)
B 500

What is the slope of the line representedby the equation below?
y = 2/3x + 3
C 100

The slope is 2/3
C 100
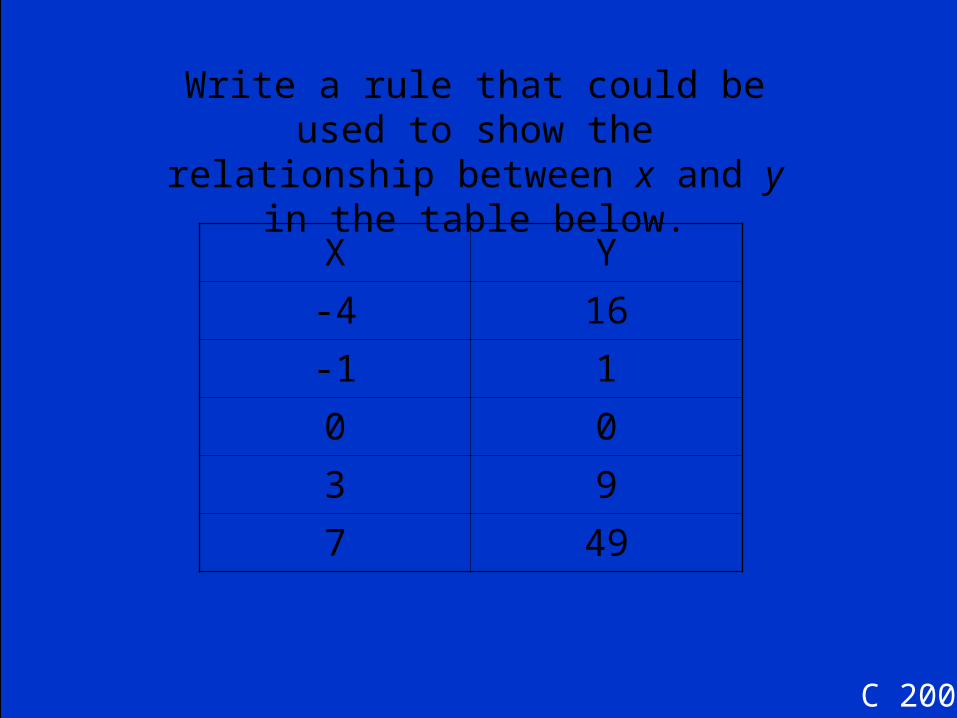
Write a rule that could be used to show the relationship between x and y in the table
below.
C 200
X Y
-4 16
-1 1
0 0
3 9
7 49

y = x2 (x squared)
C 200
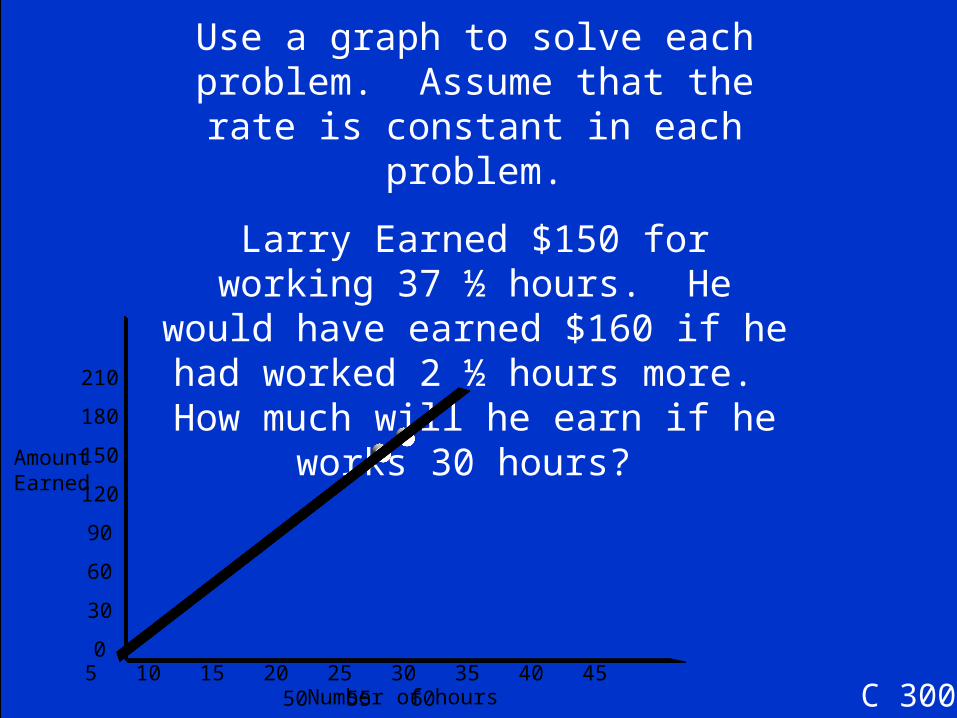
Use a graph to solve each problem. Assume that the rate is constant in each
problem.
Larry Earned $150 for working 37 ½ hours. He would have earned $160 if he had worked 2 ½ hours more. How much
will he earn if he works 30 hours?
C 300
Amount Earned
Number of hours
210
180
150
120
90
60
30
05 10 15 20 25 30 35 40 45 50 55 60

Correct Response Three C
C 300C 300
Amount Earned
Number of hours
210
180
150
120
90
60
30
05 10 15 20 25 30 35 40 45 50 55 60
The answer is $120

DAILY DOUBLE
C 400
DAILY DOUBLE
Place A Wager

Which statement best describes the slope of the line graphed above? A.The slope is −6.
B.The slope is − 2/3. C.The slope is 3/2
D.The slope is 4.
C 400

C.The slope is 3/2
C 400

Use a graph to solve each problem. Assume that the rate is constant in each problem.
During a storewide sale, a TV that usually sells for $450 is on sale $360. A stereo that usually sells for $600 is on sale for $480. What would the sale price be on a VCR that usually sells for
$500?
C 500
Sale Price
700
600
500
400
300
200
100
0
Regular Price200 400 600 800 1000 1200

C 500
The answer is $400
C 500
Sale Price
700
600
500
400
300
200
100
0
Regular Price200 400 600 800 1000 1200

What is the slope of the line representedby the table of values below?
D 100
X Y
0 - 20
1 - 10
2 0
3 10

The slope is 10
D 100

Which of the following lines appears to have the greatest slope? What line has a negative slope? A
positive slope? A 0 slope?
D 200
A. B
C D

A- 0 slope
B- greatest slope and positive slope
C- negative slope
D. Positive slope
D 200

Which of the following graphs best represents the equation below?
y = -1/2x +1
D 300
A
C
B
D

C.
D 300

Which of the following equations best represents the line in the graph shown below?
D 400
A.y = −2x + 3 B.y = −3x + 2 C.y = −2x − 3 D.y = −3x − 2
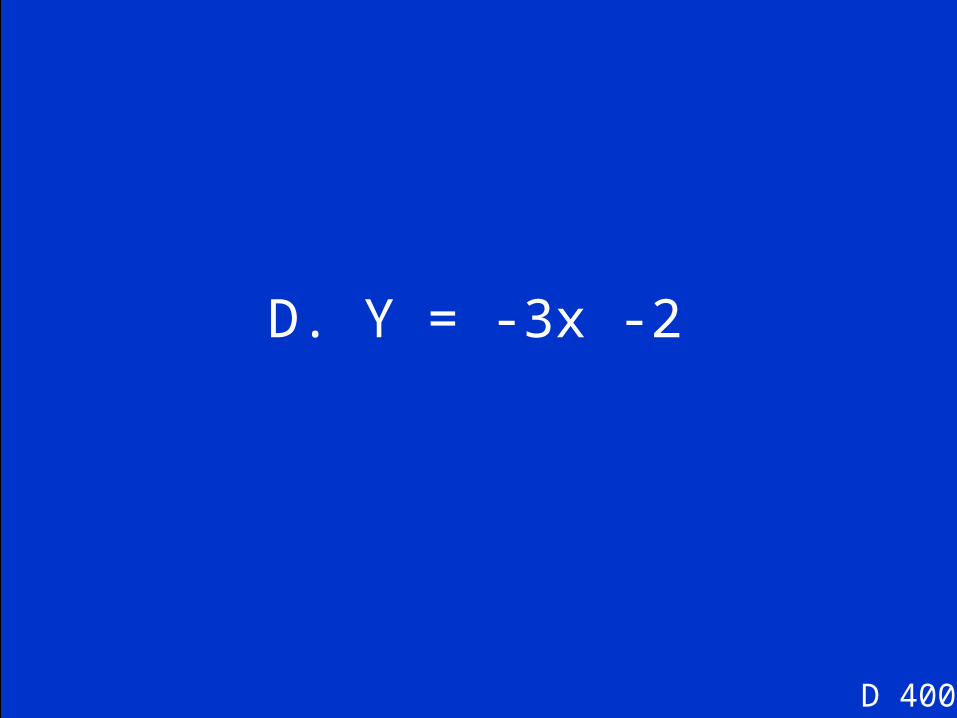
D. Y = -3x -2
D 400

The coordinate grid below shows the graphs of two lines: line l and line m.
D 500
A.The slope of line l is greater than the slope of line m.
B.The x-intercept of line m is greater than the x-intercept of line l.
C.The y-intercept of line m is greater than the y-intercept of line l.
D.The slope of line m is greater than the slope of line l.

B.The x-intercept of line m is greater than the x-intercept of line l.
D 500

What is the y-intercept of this equation?
Y = 2/3x + 9
E 100

Y intecept= 9
E 100

What is the x and y intercept of this equation
y = x - 2
E 200

X intercept- (2, 0)
Y Intercept- ( 0, -2)
E 200

Use a graph to solve the system of equation
Y= x +2
Y= -2x + 17
E 300

(5,7)
E 300

Graph. A line that passes through the point (-2, -6) slope= -1
E 400
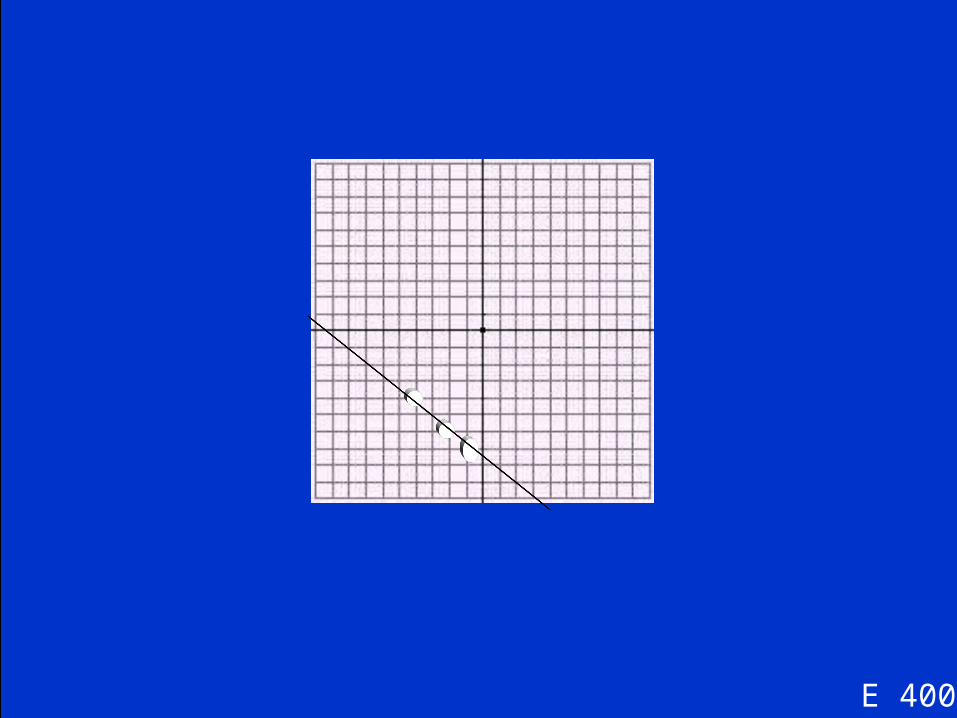
E 400

Use a graph to solve the system of equation
Y= -5x – 2
Y= 2x + 12
E 500

(-2, 8)
E 500

The classification of Mammals with pouches
F 100
What are Maruspials?
F 100

This second largest bird in the world is native to Australia
F 200

What is the ostrich?
F 200

Australia’s wild dogs
F 300

What are dingos?
F 300

This Australian island is the home of a devil and a wolf
F 400

What is Tasmania?
F 400

Although the National Bird of New Zealand, it is also indigenous to Australia
F 500

What is the Kiwi?
F 500

The Final Jeopardy Category is:
Graph an equation
Please record your wager.
Click on screen to begin

Graph this equation
y = −3x + 4?
Click on screen to continue

Click on screen to continue

Thank You for Playing Jeopardy!
Game Designed By C. Harr-MAIT