this is what learning looks like: using analytic tools to visualise classroom twitter conversations
TRANSCRIPT

This Is What Learning Looks Like:
Using Analytic Tools to Visualise Classroom Twitter
Conversations
Sharon Stoerger
Online Educa Berlin
Thursday, Dec. 1, 2011
Agenda• Twitter
• Information Visualisation
• Twitter +Infovis = TwInfoVis
• Visualising Learning
• The Future

What is Twitter?http://twitter.com
• Microblogging
• Easy-to-use
• Communication
• Broadcast
• Backchannel
• Relationships

Does tweeting feel like this?

VISUAL REPRESENTATION

What is information visualisation?
• Functions (Bertin, 1983)
• Communicate information
• Process information
• Record information
• It is not…
• Just about numbers
• Dry and boring

Q: WHY SHOULD I VISUALISE?
The world is complex, dynamic, multidimensional; the paper is static, flat. How are we to represent the rich visual world of experience and measurement on mere flatland?
-Edward Tufte (1990)

Not New – Chauvet Caves

Sensing Flowers
• Data…the new soil? (McCandless, 2010)
• The language of the eye (Norretranders, 1999)
• Vision > other senses (Medina, 2008)
http://www.brainrules.net/vision/?scene=2
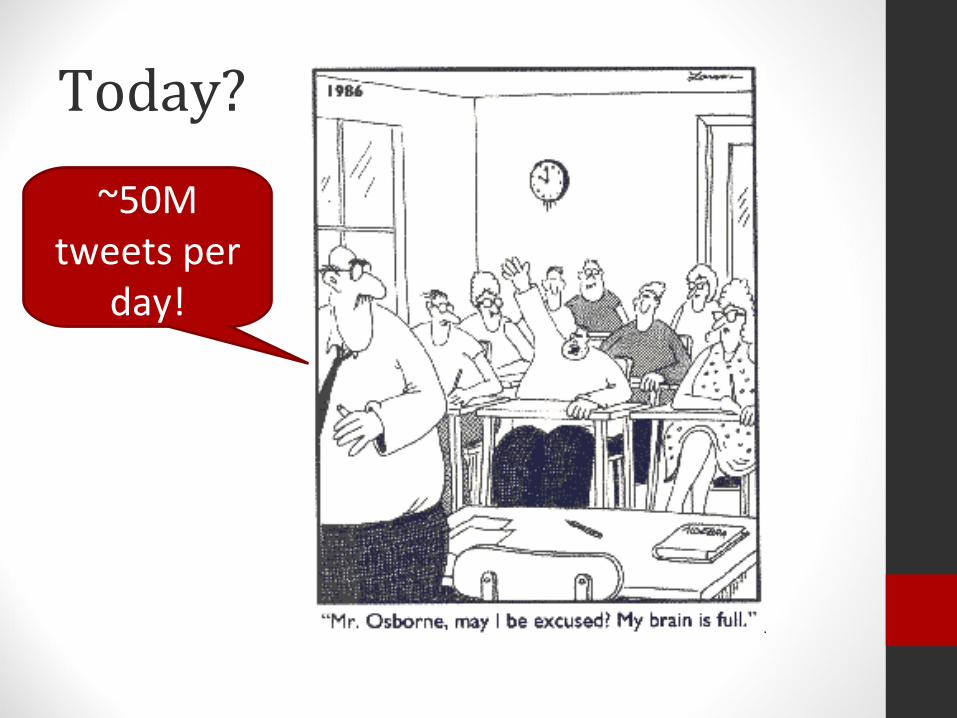
Today?
~50M tweets per
day!

When I tweet [paint], my object is to show what I have found and not what I am looking for.
-Picasso

Twitter Information Visualisation (TwInfoVis)
• Communication Visualisation
• Data Visualisation
• Statistical Visualisations
• Map & Geographic Visualisations
• Social Network Visualisations

COMMUNICATION VISUALISATIONS

Tweet Topic Explorerhttp://tweettopicexplorer.neoformix.com


DATA VISUALISATIONS

Word & Text CloudsWordle, Tagxedo, Many Eyes


STATISTICAL VISUALISATIONS


MAP & GEOGRAPHICAL VISUALISATIONS

Trendsmaphttp://trendsmap.com/
• “A real-time mapping of Twitter trends across the world.”


SOCIAL NETWORK VISUALISATIONS
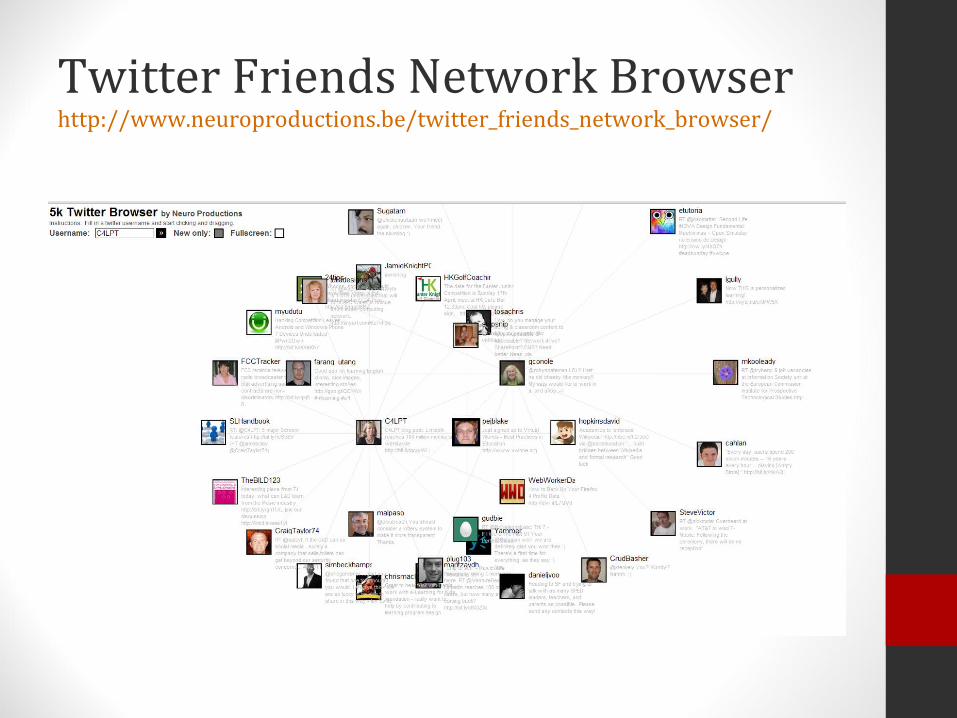
Twitter Friends Network Browserhttp://www.neuroproductions.be/twitter_friends_network_browser/


Visualisation Visual Literacy
• Capture discussions graphically
• Present & interact visually
• Show relationships
• Analyze visualisation tools (Manovich, 2008)
• See the story beneath the surface

Concerns? Information First!

What’s Next? A Visualisation
“Explosion”
Thank You!!!
Sharon Stoerger
Email: [email protected]
Twitter: @csoleil
More Information:
http://socialinfovis.wikispaces.com/