this is visual
TRANSCRIPT

This is VISUALdocumentation and analysis of service processes
SINTEF ICT
June 2016
This work by the VISUAL project is licensed under a Creative Commons Attribution-ShareAlike 4.0 International License

Content
• About VISUAL– Key facts
– Who can use this material?
– Project partners
– How to make diagrams?
• Introducing VISUAL– Modelling approach
– Customer journeys and touchpoint typology
– Overview of diagrams
• Symbols
• Customer journey diagram
• Swimlane diagram
• Customer experience in VISUAL
• More advanced use of VISUAL
2

Key facts• VISUAL is an innovation project financed by the Research council
of Norway from October 2012 to June 2016.
• The fundamental goal of VISUAL was to develop a formal language for specification and visualization of service processes.
• VISUAL consists of terminology, diagrams, methods and tools.
• VISUAL is particularly targeting service processes that are technology-driven, standardized, and repeated in high volumes.
• VISUAL is well suited for service processes extending over time, being mediated by different communication channels.
3
Customer Journey Modelling Language (CJML) is the formalized part of VISUAL. CJML is a domain specific language for detailed and unambiguous modelling of service processes.

Who can use this material?
• VISUAL should appeal to people working with service delivery or service innovation, independent of their role and background.
• You can use this material under the following conditions:
– It is licensed under the Common Creative license CC BY-SA 4.0 Creative Commons Attribution-ShareAlike4.0 International License.
– Read more about the project and download the Visio stencils here: www.visualproject.org
4

Project partners
• Halogen AS (project owner)– Halogen is Norway's leading consultancy in service design.
Please contact Halogen for any assistance with your customer journeys. Contact person: Lasse Pedersen (lasse.pedersen<at>halogen.no)
• SINTEF (R&D partner and project leader)– The development of VISUAL has been driven by SINTEF in close cooperation
with the project partners. The iterative development has been based on feedback collected through empirical case studies and evaluation activities. Contact person: Ragnhild Halvorsrud (ragnhild.Halvorsrud<at>sintef.no).
• Hafslund Strøm (industry partner)
• FINN.no (industry partner)
• DIPS ASA (industry partner)
• Linköping University, Sweden (R&D partner)
• Please visit www.visualproject.org for more information.
5

How to make diagrams?
• You can simply copy-paste the graphical elements in these slides and modify for your own use.
• The graphical elements are also available as a set of stencils in Visio and Omnigraffle.
• You can download the graphical elements, PowerPoints or stencils from the project web site: www.visualproject.org
6

VISUAL
Introducing VISUAL
7

8
VISUAL
• VISUAL targets only the part of the service process that can be encountered by the customer (or end user, consumer, citizen etc.)
• VISUAL addresses the detailed interactions between a customer and one or more service providers.
• VISUAL describes service processes both in its hypothetical state (planned journey) and as it is experienced in a real context (actual journey).
• VISUAL supports service processes involving more than one customer (e.g. C2C services), or a network of service providers.
• VISUAL differs from other diagrammatic languages in two principal ways:
– It models the service process from the customer's point of view
– It aims at being intuitive for all users, and does not require a technical background

The states of a service
The VISUAL language distinguishes two states of a service: The planned, hypothetical service process and the actual service process resulting when a user executes the service. The two states can also be distinguished as "theory versus reality" or "static versus dynamic."
The planned service process• as intended and implemented by the service
provider - regardless of whether it was deliberately designed or resulting from an ad-hoc development process
• can be described and modelled
• may branch into sub-journeys according to conditions, e.g. choice of alternative communication channel
The actual service process• always involve an end-user and results in an
individual experience
• may deviate from the planned service process
• results in an experience which is subjective, context dependent, and may change over time
"Services exist in two different states of being.." Lynn Shostack (1982). How to design a service. Eur. J. Marketing 16, 49-63.
9

What is a customer journey?
As a common method in service design, customer journey mapping is practiced in various ways. However, there are some common factors that can be identified across all approaches:
1. The journey is based on the customer's point of view2. The journey has a time dimension – or a process nature3. The journey is divided into steps
Note that a customer journey might involve both voluntary and/or mandatory aspects, and the outcome might or might not be desirable for the customer (e.g. tax reporting resulting in an additional tax payment is an example of a customer journey that is mandatory and with an undesirable outcome).
About customer journeysThe term customer journey is generally used as metaphor for taking a customer's (or a user's, consumer's, citizen's) perspective.
Customer journeys or customer journey mapping also denote a method in service design. The method is often used to express a service user's experience.
Although the method is commonly used in the service industry, it lacks a theoretical foundation and a formalization.
A customer journey is often divided into "before", "during" and "after" the service. Sometimes, the borders between these stages are not can be hard to define.
Customer journeyIn VISUAL, a customer journey is modelled as a sequence or constellation of touchpoints involved for a customer to achieve a specific goal or an outcome. The start and end of the journey must be seen in context with the purpose of the analysis.
The Customer Journey Modelling Language (CJML) is a domain specific language for modelling and visualizing a service process.
Examples
Customer journey representing a hospitality service: Going to the cinema to watch a movie. The service process comprises ordering and payment of the ticket, retrieval of the ticket, procedures at the movie theatre, and the movie itself.
Customer journey representing a health service: Having a knee surgery. The service process typically comprise a visit to the general practitioner, a MR scanning service, a consultation with a specialist, and finally the surgery. The customer has a relation to more than one service provider during this customer journey.
10

Who are involved in a customer journey?
11
Directly involved actorsThe actors on the left side are directly involved in delivering the service to the customer. They are responsible for (parts of) the customer's journey.
External actorsThe actors on the right side may influence the customer's journey, although they are not responsible for any part of the service delivery.
This could be the newspaper that made the customer aware of the film, or a friend who recommended the film.
In the cinema example, this is the cinema company. If they have outsourced the online ticketing system, a subcontractor is also directly involved.
Service provider
Sub-contractor
Friend
Newspaper
Customer
• Customer journeys involve complex combinations of products (tangibles), services (deeds), spaces, and information.
• The customer often see the set of service providers as "one entity," and does not distinguish (or care) about their interrelation.
Example, directly involved actors:
Example, external actors:

Touchpoints – the "atoms" of the journey
12
Service provider
Sub-contractor
Friend
Newspaper
Customer
TouchpointA customer journey is modelled as sequences of steps and events that we refer to as touchpoints. Communication points are a sub-class of touchpoints that represents instances of communication or interaction between the customer and other actors. The other sub-class of touchpoints are actions, which do not involve directed communication. Actions are not part of the illustration, but will be further described.
Communication pointsCommunication points are instances of communication or interaction between the customer and other actors. Communication points forms "the backbone" of a customer journey, and they are associated with
• a sender• a receiver• a communication channel

Touchpoints
13
Service provider
Sub-contractor
Friend
Newspaper
Customer
The customer sendsan e-mail to the service provider
The customer receivesan e-mail from the service provider
• The communication channel is represented by a symbol
• Touchpoints with external actors has a shaded background
A friend calls and recommends the movie
• The communication points make up the backbone of the service process, and has several important attributes that are codified in the visual notation.
• Both the direction of the communication, and the communication channel itself are made visually distinct. Communication points initiated by the customer have a different color compared to the ones initiated by the service provider.
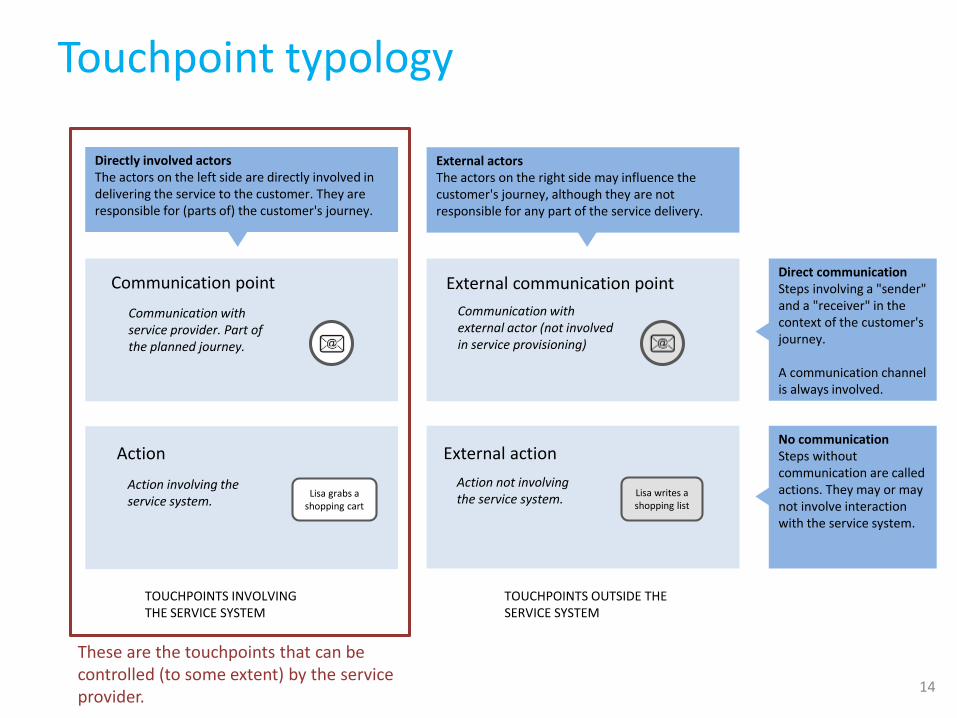
Touchpoint typology
Directly involved actorsThe actors on the left side are directly involved in delivering the service to the customer. They are responsible for (parts of) the customer's journey.
External actorsThe actors on the right side may influence the customer's journey, although they are not responsible for any part of the service delivery.
Communication with service provider. Part of the planned journey.
Action External action
Communication with external actor (not involved in service provisioning)
Lisa grabs a shopping cart
Lisa writes a shopping list
Communication point External communication point
Action involving the service system.
Action not involving the service system.
TOUCHPOINTS INVOLVING THE SERVICE SYSTEM
TOUCHPOINTS OUTSIDE THE SERVICE SYSTEM
Direct communication Steps involving a "sender" and a "receiver" in the context of the customer's journey.
A communication channel is always involved.
No communication Steps without communication are called actions. They may or may not involve interaction with the service system.
These are the touchpoints that can be controlled (to some extent) by the service provider.
14

Overview of VISUAL diagrams
Customer journey diagram Swimlane diagram
15
There are two main diagram types in VISUAL for describing service delivery:
Sequential diagram: for visualizing planned and actual customer journeys with few actors involved
Deviation diagram: for visualizing actual customer journeys
Swimlane diagram: for visualizing planned and actual customer journeys with many actors involved

VISUAL
Symbols
16

About the VISUAL symbols
• VISUAL contains a set of symbols to represent actors, communication points, and customer experience.
• The symbols of VISUAL serve different purposes.
– Communication point symbols represent the channel or device that carries the touchpoint. Fore some channels and devices we provide several symbols. The symbols chosen should be seen in connection to the use of symbols in the customer journey as a whole.
– Actor symbols represent the actors in a customer journey (customers, employees, service providers).
– Customer experience symbols represents the customer's subjective experience of a touchpoint, and are used only for actual journeys.
– Health care symbols are symbols related to the health domain (institutions, systems, patients, doctors, nurses, secretaries).
17

Overview of all VISUAL symbols
18
Communication points Health care
Service providers
Customers Customer experience

Communication point symbols (1 of 2)
19
telephone conversation
SMS
social media interaction/message
letter
face-to-face interaction
self-service machine
internet via PC
internet via tablet
internet via smartphone
invoice
payment

Communication points symbols (2 of 2)
20
chat
call centre
globe/internet
app on PC
app on tablet
app on smartphone
message service
telephone
fax
PC
tablet
smartphone
online shopping
shopping
shop counter
service desk
logistics
package
technician (visit)
unknown channel/device

Actor symbolscustomers, employees, service providers
service providers
bank
online bank
store
data system
customers
employees
21

Health care symbolsinstitutions, systems, patients, doctors, nurses, secretaries
patients
doctor - general practitioner
doctors
surgeons
anaesthesiologists
nurses
chief nurses
health secretaries
secretaries/receptionists
hospitals
medical practices
hospital post office
hospital computer system
patient medical record
22

VISUAL
Customer journey diagramVisual elements and syntax
23

Main diagram elements
start ofcustomer journey
end ofcustomer journey
communication point
connectors
action decision point
24

Customer journey
• A customer journey is modelled as a sequence of touchpoints involved for a customer to achieve a specific goal or an outcome.
• The scope of a customer journey should be defined in relation to the purpose of the journey mapping:– What is the start of the customer journey?
– What is the end of the customer journey?
Communication points are instances of communication or interaction between a customer and a service provider
Actions are non-communicative events or activities conducted by a customer or service provider as part of a customer journey
25

Communication point – basics • Communication points are represented as circles.
• The boundary style carries information about:
– the actor initiating the touchpoint
– the status of the touchpoint
• The symbol area holds information about which channel or device the communication point is carried through.
• The symbols are introduced in separate slides.
boundary
symbol area
26
service provider customer
completed missingactual journeys only
failingactual journeys only
Actor
Status
other actor
The colour of the boundary indicates the actor initiating the communication point:
• green: service provider
• orange: customer
• purple: other actor
The boundary style indicates the status of the communication point:
• solid boundary: completed
• dashed boundary: missing
• crossed touchpoint: failing
service provider sends an e-mail to customer
customer fails to retrieve ticket
Examples

Descriptions and identifiers
Descriptions may be added to provide a contextual explanation of the situation:• We recommend to keep the communication
point description relatively short
• When rich descriptions are needed, the diagram can be accompanied by a table holding the explanations and a reference to the communication point identifier
Description
Identifier T1
<Description of T2> <Description of T3> <Description of T4><Description of T1>
T2 T3 T4
Identifiers may be added for easy referral to specific communication points. The first letter reflects the status of the communication point:• Identifiers for planned journeys
– For planned journeys: T1, T2, T3, …
• Identifiers for actual journeys– Planned communication points: E1, E2, E3, …
– Ad-hoc communication points: A1, A2, A3, …
– Missing communication points: M1, M2, M2, …
– Failing communication points: F1, F2, F3, …
27

Actions
• Actions are touchpoints in the journey that do not involve communication.
• Actions are visually represented as rounded squares containing text. Actions differ from communication points by lacking the communicative aspect.
• Two types of actions may be distinguished in VISUAL:
– Actions that involve parts of the service system (e.g. grab a shopping cart at the store).
– External actions that do not involve the service system (e.g. writing a shopping list before visiting a store).
28
text description text description
External action (not involving the service system)
Action (involving service system)
text area
Action
External actiontext area

Actions - examples
29
Train ride
Reading the electricity meter
Visiting the store
Going to the movies
Doctor's appointment

Decision point
• Decision points are used for generic costumer journeys, and refer to points in time where a customer journey can be routed into different paths.
• Decision points are used when there are two or more path alternatives.
30
Does the customer want to receive information from the service provider by e-mail?
How does the customer want to receive information from the service provider?
Examples

Journey phase
• When convenient, a customer journey can be divided into journey phases.
• Journey phase can be used for all types of journeys.
• The journey phases can be based on e.g. the location where the touchpoints are initiated, periods or phases of the journey, or other convenient ways of dividing the journey into phases.
journey phase journey phase
• Example: air travel– Phase 1: Ordering ticket online and preparing for the trip
– Phase 2: Traveling to the airport
– Phase 3: At the airport for departure
– Phase 4: At the air plane
– Phase 5: At the airport of arrival
31
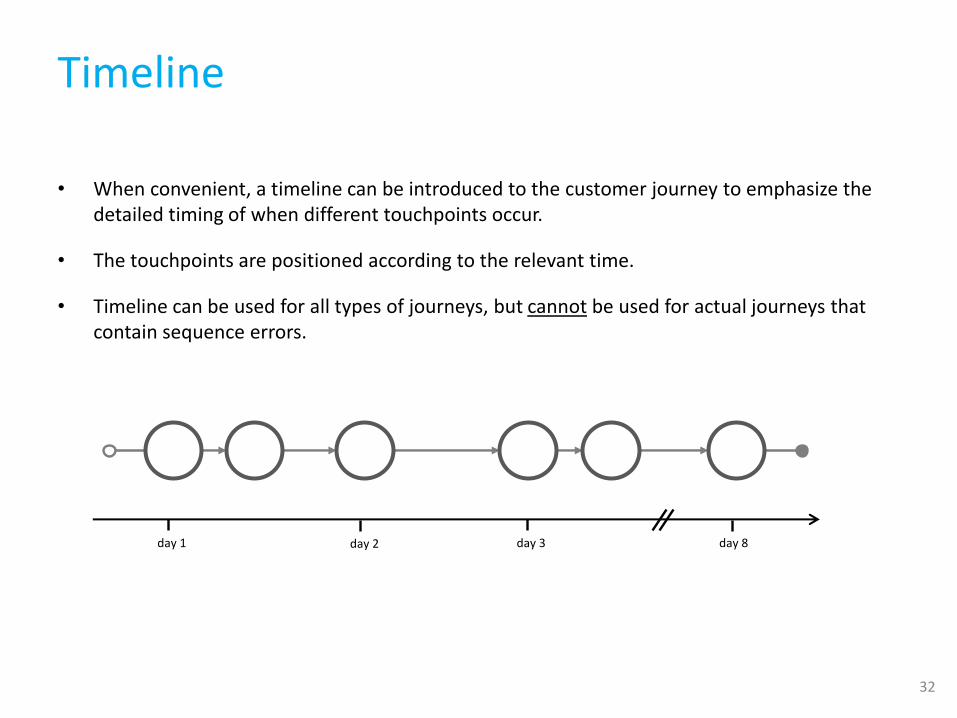
Timeline
• When convenient, a timeline can be introduced to the customer journey to emphasize the detailed timing of when different touchpoints occur.
• The touchpoints are positioned according to the relevant time.
• Timeline can be used for all types of journeys, but cannot be used for actual journeys that contain sequence errors.
day 1 day 3 day 8day 2
32

Example journey – "going to the movies"
33
• Throughout this document, the following example journey is often used to illustrate different forms and features of the customer journey diagram.
• The journey represents a simplified version of the service process for going to the movies.
• The journey involves a person ordering and paying ticket via web (T1), receiving confirmation of bought ticket via e-mail (T2) and SMS (T3), retrieving ticket at a self-service machine at the movie theatre (T4), and finally showing the ticket at the entrance (T5).

Sequential diagramexamples planned journey with features
Planned customer journey consisting of a sequence in chronological order, with a timeline
Planned customer journey consisting of a sequence in chronological order, with journey phase
Planned customer journey containing an unordered sequence (brackets)
34
planned journey

Sequential diagramexamples actual customer journey
Actual journey with timeline consisting of:
• three completed expected communication point (E1-E3)
• one missing communication point (M1)
• one failing communication point (F1)
• one ad-hoc communication point (A1)
Actual journey consisting of:
• four completed expected communication points (E1-E4)
• one failing communication point (F1)
• one ad-hoc communication point (A1)
failing communication point
ad-hoc communication point
missing communication point
failingcommunication point
ad-hoc communication point
35
actual journey

Deviation diagram – description
• Touchpoints are shown in two different layers. See descriptions in in figure.
36
E1
M1
E2 E3
F1
A1
All the expected elements are shown in the upper level
All the deviations (ad-hoc, missing and failing touchpoints) are shown in the lower level
Missing and failing communication points that are part of the planned journey appear as grey "ghost" symbols in the upper level
Missing and failing communication points that are part of the planned journey appear in the lower "deviations" level showing status and initiator
When a deviation follows as a direct consequence of an ad-hoc, missing, or failing element, it is displayed vertically below the touchpoint it originated from (as shown in this visualization)
When a deviation touchpoint follows an ad-hoc, missing, or failing touchpoint, but is not directly connected to the previous touchpoint, it is displayed horizontally beside this touchpoint
actual journey

Deviation diagram – example 1
• Customer journey consisting of expected communication points (E1-E4), with one failing communication point (F1) that in turn generates an ad-hoc communication point (A1).
37
actual journey

Deviation diagram – example 2
• Customer journey including sequence errors and one failing element (F1) that in turn generates an ad-hoc communication point (A1).
38
actual journey

VISUAL
Swimlane diagramVisual elements and syntax
39

• VISUALs swimlane diagram can be used to visualize planned and actual journeys with many actors involved.
• The diagram visualizes each actor's journey in separate swim lanes, containing the touchpoints.
• Time extends in the horizontal direction.
• Actors represented in the diagram can be people, organizations, or data systems. The actors should always represent an entity encountered by the customer.
40
About the VISUAL swimlane diagram

Swimlane diagram – visual elements• Touchpoints are represented as rounded squares.
– Communication points contain a symbol and a text field
– Actions contain a text field only
• A communication point appear as a "vertical pair" of boxes, each representing the sender and the receiver.– the sender's box has a dark background
– the receiver's box has a white background
– an arrow indicates the direction of the communication
41
Time flow
ActorsCommunication
pointAction
(no communication)Communication
pointCommunication
point
Communication point initiatorsymbol text area
Communication point receiversymbol text area
Actiontext area

Swimlane diagram - phases and comments
42
• Journey phases may be added to the diagram (top).• It may be convenient to add comments, clarifications, or notes
about simplifications in a separate field (bottom).
Patient
GP
Specialist
Sends notification about the appointment
Receives SMS-reminder about the appointment
Meets at specialist clinic for an examination
Examines the patient, decides for an operation
Comment
General pract it ioner 's off ice
Simplification: this is normally taken care of by a medical coordinator at the specialists clinique
W
A
I
T
I
N
G
T
I
M
E
Out-pat ient c l in ic
Medical examination of patient => need to consult a specialist
Meets at local medical center for an appointment with GP
GP prepares and sends an electronic referral to the specialist
Receives the referral and decide to call in the patient
Receives letter with date and time for appointment
Schedules and sends letter about appointment
Date/time Date/time

Deviations in actual customer journeys
• A swimlane diagram can also be used to represent actual customer journeys with deviations from the planned journey.
• The shape's boundary style carries information about its status, as illustrated to the right.
• When it is important to outline deviations in relation to a planned journey, a customer journey deviation diagram may be more suitable.
Completed
Missing
Failing
Ad-hoc
Sender Receiver
43

Swimlane diagram – Example planned journey (part 1)
Customer
Power supplier
Bank-related
Grid company
Tele-marketing
Calls the customer and offers electricity deal
Receives call from telemarketing and agrees to electricity deal
Sends request for agreement confirmation and meter reading
Receives request for agreement confirmation and meter reading
Sends agreement confirmation and meter reading
Receives agreement confirmation and meter reading
Sends info about the agreement being processed
Receives info about the agreement being processed
Customer info is sent to power supplier
Receives customer info
Readsthe meter
Planned journey of ordering electricity from a utility company.
44
planned journey

Swimlane diagram – Example planned journey (part 2)
Customer
Power supplier
Bank-related
Grid company
Tele-marketing
Calls customer for a welcome call
Receives welcome call
Sends notification for meter reading
Receives meter reading notification
Sends the meter
Receives the meter reading
Readsthe meter
Sends invoice to be forwarded to customer
Receives invoice to be forwarded to customer
Receives invoice
Pays invoice
Invoice ready for customer
Receives payment
Planned journey of ordering electricity from a utility company.
45
planned journey

Swimlane diagram – Example actual journey (part 1)
Customer
Power supplier
Bank-related
Grid company
Tele-marketing
Calls the customer and offers electricity deal
Receives call from telemarketing and agrees to electricity deal
Sends request for agreement confirmation and meter reading
Receives request for agreement confirmation and meter reading
Sends agreement confirmation and meter reading
Receives agreement confirmation and meter reading
Sends info about the agreement being processed
Receives info about the agreement being processed
Customer info is sent to power supplier
Receives customer info
Readsthe meter
Actual journey of ordering electricity from a utility company.
46
Missing communication point: The SMS about the agreement being processed is no received
actual journey

Swimlane diagram – Example actual journey (part 2)
Customer
Power supplier
Bank-related
Grid company
Tele-marketing
Calls customer for a welcome call
Receives welcome call
Sends notification for meter reading
Receives meter reading notification
Sends the meter
Receives the meter reading
Readsthe meter
Sends invoice to be forwarded to customer
Receives invoice to be forwarded to customer
Receives invoice
Pays invoice
Invoice ready for customer
Receives payment
Actual journey of ordering electricity from a utility company.
47
actual journey
Failing communication point: The customer fails to send the meter reading.

VISUAL
Customer experience
48

About customer experience in VISUAL
• In VISUAL, customer or user experience is conceptualized according to research from the human-computer interaction domain; as a subjective, dynamic and context-dependent phenomenon.
• Customer experience is thus associated with actual journeys only, based on self-reported input from the individual user.
• The visual notation allows textual excerpts of self-reported data, as well as assessments of the customer experience.
• Customer experience is visualized as call-outs containing the customer's subjective account of a given event.
49

Customer experience symbols• VISUAL conveys CX in two different ways:
– Textual description based on the customer's own formulation
– Symbols representing the customer's rating. Smiley symbols are used to visualize the customer's experience
• The symbols can be used to match both a 3-point and a 5-point Likert scale.
• The VISUAL language supports CX in customer journey diagrams (using callout or table), as shown in the following slides.
• The CX symbols may also be inserted directly into the diagram in the close vicinity of a touchpoint.
543
50
1 2
very satisfiedsatisfiedneutralvery unsatisfied unsatisfied
actual journey

Customer experience – callout• Customer experience collected from interviews, questionnaires, etc. can be visualized
using simple callout containing customers' statements.
• The example shows the use of callouts to express customer experience.
• The customer experience symbol relates to how the customer has rated a touchpoint.
51
It was easy to order the tickets. I just chose the movie I wanted to see, selected a seat, and put in my payment details.
Very satisfied
I don't understand why I get this information on SMS when I also received it on e-mail.
Unsatisfied
The queue for getting into the movie theatre was a bit long, but the person at the entrance was very friendly and helpful.
Satisfied
order and pay ticket via web
e-mail confirmation
SMS confirmation
retrieve ticket
ticket control at entrance
E1 E2 E3 E4 E5
actual journey

Customer experience – table
• The example shows the use of a table to express customer experience.
• Customer experience collected from interviews, questionnaires, etc. can be listed in a table.
• The table consists of the touchpoint identifier, touchpoint description, customer experience, and a touchpoint score provided by the customer.
52
Label Touchpoints Customer experience ScoreE1 Order and pay via web It was easy to order the tickets. I just chose the movie I wanted to see,
selected a seat, and put in my payment details.5
E2 E-mail confirmation It was nice to get an e-mail confirming my ticket purchase. 4
E3 SMS confirmation I don't understand why I get this information on SMS when I also received it on e-mail.
2
E4 Retrieve ticket I got a bit confused because the ticket machine was not so intuitive, but it went OK and I managed to retrieve my tickets. 3
E5 Ticket control at entrance
The queue for getting the tickets was a bit long, but the person at the service desk was very friendly and helpful. 4
actual journey
order and pay ticket via web
e-mail confirmation
SMS confirmation
retrieve ticket
ticket control at entrance
E1 E2 E3 E4 E5

VISUAL
Advanced features
53

Unordered touchpoint sequence
• An unordered touchpoint sequence is a group of touchpoints that can occur in an unfixed order.
• This notation is useful when visualizing customer journeys that include groups of touchpoints that occur with no pre-defined sequence.
• The notation can only be used for visualizing generic and planned journeys.
No connector between the unordered touchpoints
Brackets that group the unordered touchpoints
54

Sequence error• Sequence errors denotes situations where a touchpoint occur sooner or later than it was supposed to, as
anticipated in the planned journey.
• Main guidelines for connectors when sequence errors occur:– When the sequence error consists of a "jump forward" in the sequence, the connector should start from the bottom of the
touchpoint it originates from, and end at the bottom of the following touchpoint (see connector A in the figure)
– When the sequence error consists of a "jump" backwards in the expected sequence, the connector should start from the top of the touchpoint it originates from, and end at the bottom of the following touchpoint (see connector B in the figure)
– When the sequence error originates from an ad-hoc, missing, or failing touchpoint, the connector should start to the right of the touchpoint and end at the bottom of the following touchpoint when the sequence error consists of a "jump" forwards (see connector C in the figure), and at the top when the sequence error consists of a "jump" backwards in the expected sequence
• The actual sequence of touchpoints is revealed by following the connectors, while at the same time preserving the expected sequence.
ConnectorA
ConnectorB
55
actual journey

• When customer journeys include repeated sequences of touchpoints, a placeholder may be used to simplify the diagram.
• Example: A web-based marketplace that connects sellers of goods with potential buyers. The communication process between the seller and the different buyers may include the same sequence of touchpoints.
56
X
X
T1 T2 T3 T4 T5 T9
Touchpoints T2, T3, and T4 are collected in a bracket followed by an "X". Touchpoints T6, T7 and T8 are replaced by the "X", since this sequence is the same as for T2, T3, and T4.
T6 – T8
Placeholder for a repeated sequence of touchpoints

Concurrency
• In general, a customer journey may describe both sequential and concurrent communication points and actions.
• The UML fork/join notation is used for this purpose.
• In the example below, touchpoint T3 happens simultaneously as T4 and T5 is carried out.
• A typical situation is a telephone conversation (T3), where e-mails are being exchanges during the conversation (T4, T5).
• Concurrency can be used for all types of journeys.
The second heavy bar ("join") indicates end of concurrency
T3
T4
T1 T2 T6
The first heavy bar ("fork") indicates start of concurrent touchpoints
T5
57

Special situations: handling uncertainty
• In some service processes there are uncertainty in how a communication point is mediated or executed, or even if it occurs at all.
• Example: A web-based C2C-service that connects two consumers of a service. After the two actors are connected, their profile information is exchanged through the web portal. However it remains uncertain, from the service provider's perspective, who initiates the contact, the number of communications that occur between them, the communication channel, and if they communicate at all.
58
Uncertain initiator:
It might be uncertain who initiates the communication point.
?
Uncertain number of occurrences:
It might be uncertain how many instances of communication occur.
Uncertainty in occurrence:
It might be uncertain if a communication point occurs or not, hence the communication point can occur, but not necessarily.
Uncertainty in channel:
It might be uncertain in which channel the communication point is mediated.

VISUAL
THE END
59