this is the pre-print version of the article forthcoming in
TRANSCRIPT

This is the pre-print version of the article forthcoming in the Journal of Media Economics (Final accepted version, August 2012): Stanca L, Gui M. & Gallucci M. (in press), Attracted but Unsatisfied: The Effects of Sensational Content on Television Consumption Choices, Journal of Media Economics.
Attracted but Unsatisfied:
The Effects of Sensational Content on Television Consumption Choices
Luca Stanca♦, Marco Gui* and Marcello Gallucci♠
Abstract
This paper investigates experimentally the effects of sensational content on viewing choices
and satisfaction in television consumption. We find that the presence of verbal violence in
one program causes subjects to watch more of that program. However, subjects do not
experience higher satisfaction with the program. In addition, they report lower satisfaction
with the overall viewing experience. These findings are robust to the use of different program
types for the experimental manipulation. Overall, the results pose a challenge to the use of
audience figures as a measure of enjoyment or satisfaction.
Keywords: media consumption, television, satisfaction, decision making.
♦ Department of Economics, University of Milan Bicocca, Piazza dell'Ateneo Nuovo 1 (U6-367), 20126 Milan,
Italy. E-mail: [email protected].
* Department of Sociology, University of Milan Bicocca, Piazza dell'Ateneo Nuovo 1, 20126 Milan, Italy. E-
mail: [email protected]. ♠ Department of Psychology, University of Milan Bicocca, Piazza dell'Ateneo Nuovo 1, 20126 Milan, Italy. E-
mail: [email protected].

2
1. Introduction
In recent years, the existence of inconsistencies between consumption choices and
preferences has received increasing attention in economics. There is a growing body of
evidence indicating that consumers frequently “act against their own better judgment,
engaging in behavior that is often regretted after the fact and that would have been rejected
with adequate forethought” (Hoch and Loewenstein, 1991). Gruber and Mullainathan (2005),
for example, have shown how cigarette consumers are prone to overconsumption to the point
that many of them, when not influenced by the craving to smoke, say they would vote in
favor of raising taxes on tobacco. Cutler et al. (2003) and Shapiro (2005) have described
similar phenomena in food consumption. More generally, behavioral economics has indicated
that there are domains of consumption in which subjects are systematically dissatisfied with
their own choices (see e.g. Thaler and Mullainathan, 2001, for a review).
In media studies, research on television viewing has identified similar inconsistencies,
showing that audience figures and enjoyment measures are often unrelated, as viewers
commonly watch programs that they find of poor quality or do not appreciate ex-post (Gunter
and Wober, 1992; Morrison, 1986; Wober, 1990; Leggatt, 1996; Ishikawa, 1996; Weimann et
al., 1992). The main explanation of these phenomena is based on social desirability bias:1
when asked to report their viewing choices or appreciation for different programs, viewers
tend to under-report viewing or under-evaluate programs that are considered less socially
acceptable (Ang, 1985). This explanation is implicitly based on the notion that “people watch
what they like on television and like what they watch” (McQuail, 1997, p. 58). According to
1 Social desirability bias is the tendency of individuals to present themselves in the most
favorable manner relative to prevailing social norms and, more specifically, to answer
questions in a manner that will be viewed favorably by others (Nederhof, 1985, King and
Bruner, 2000).

3
the “uses and gratification” communication theory people use the media in ways that satisfy
their individual needs (Blumler and Katz, 1974). Viewers choose in their best interest, and if
a given content is preferred to others, it must lead to higher satisfaction. As a consequence,
any inconsistencies between viewers’ choices and satisfaction should be attributed to
inappropriate measurement of viewing or appreciation.
In this paper, we propose an alternative explanation of choice inconsistencies in
television viewing, based on the effects of specific program content. More specifically, we
focus on the effects of sensational content, broadly defined as “content intended to stimulate
senses and arouse curiosity, interest or emotional response in viewers” (Slattery et al., 2001,
Slattery and Hakanen, 1994; Grabe et al., 2001). In recent years, in the attempt to attract
viewers’ attention, TV producers have substantially increased the presence of sensational
features, such as violence, crime, accidents, disasters, sex, and misconduct (Hendrik Vettehen
et al., 2005, 2008; Uribe and Gunter, 2007; Hardy et al., 2010). There is ample evidence
indicating that the portrayal of sensational content may produce automatic attention and
increase resource allocation to the processing of television messages, irrespective of viewers’
enjoyment or satisfaction (Lang et al., 1995; Lang et al., 1999; Newhagen and Reeves, 1992;
Grabe et al., 2003). In this perspective, a given content may be preferred to others without
necessarily producing higher satisfaction. Inconsistencies between viewing choices and
satisfaction can therefore be attributed to the attractive power of sensational content.
In order to test this hypothesis, we carried out a laboratory experiment on the effects of
sensational content on viewers’ choices and satisfaction with viewing. We focused on verbal
violence as one of the most common types of content used to attract television viewers’
attention. Verbal violence, broadly defined as “noxious symbolic messages containing
criticism, insults, cursing, or a negative affective reaction” (Greenberg, 1980, p. 108), is a
common form of sensational content that is particularly widespread in talk shows (Wood,

4
2001, Rubin et al., 2003), where the setting is often intentionally organized in order to
spectacularize verbal confrontations (Hutchby, 2001; Luginbühl, 2007). In recent years, the
portrayal of verbal violence in television programs has increased substantially, while that of
physical violence has remained relatively unchanged (Potter and Vaughan, 1997, Gunter et
al., 2003). As a result, verbal violence has become one of the most common forms of violent
content on television (Potter, 1996, Potter and Warren, 1998). It has also been shown that
verbal violence is characterized by lower inhibition levels for imitation relative to physical
violence (Potter, 1999).
In our experiment, subjects are able to choose from a number of different programs
during a simulated viewing session. In the experimental treatment, one of the programs
portrays a violent verbal confrontation, whereas in the control treatment the same program
does not contain verbal violence. A post-experimental questionnaire is used to assess
subjects’ satisfaction with each program and with the viewing experience overall. This
experimental design allows us to test the causal effects of sensational content on both actual
viewing choices and satisfaction with viewing, in a setting where subjects can switch between
programs in real time. Since everything else is kept constant across treatments, discrepancies
between viewing choices and satisfaction cannot be explained by a social desirability bias.
We find that the presence of verbal violence in one program causes subjects to watch
more of that program. However, subjects do not experience higher satisfaction with the
program, while they experience lower satisfaction with viewing overall. These findings are
robust to the use of different program types for the experimental manipulation. Overall, the
results indicate that the presence of sensational content may be responsible for discrepancies
between viewers’ choices and their own satisfaction.
The remainder of the paper is organized as follows. Section 2 briefly reviews the related
literature. Section 3 describes the experimental design and procedures. Section 4 presents the

5
results. Section 5 concludes with a discussion of the results and their implications.
2. Related Literature
Despite the increasing diffusion of new media, television viewing is still the most important
leisure activity worldwide (IP Network, 2007). Given this prominent role, several recent
economic studies have investigated the effects of television consumption on well-being. Frey
et al. (2007) and Frey and Benesch (2008) show that the quantity of television viewing is
negatively related to life satisfaction. In these studies it is argued that people have
systematically imperfect foresight and control over their own viewing behavior, and tend to
overestimate the utility obtained from television viewing and underestimate its future costs.
Benesch et al. (2010) find that having a larger choice set of TV channels does not raise
people’s subjective well-being. Indeed, when exposed to more channels, heavy viewers report
lower life satisfaction. Bruni and Stanca (2008) find that high levels of television viewing
have a negative impact on volunteering activities and time spent with friends, which in turn
positively affect individual well-being. This recent economic literature on the effects of
television consumption, however, has generally focused on the quantity of television viewing.
Relatively little attention has been paid to the effects of specific program content.
In other fields, a large number of studies have analyzed how different content features
attract viewers’ attention. Experimental psychology, in particular, has measured selective
attention with different methods, from “eyes on screen” (Miller, 2006), to heart rate (Lang, et
al., 1999), secondary task reaction time (Basil, 1994), and tracking of alpha frequency of the
electroencephalogram (Simons et al., 2003). As far as content is concerned, examples of
features eliciting involuntary and automatic attention mostly coincide with those traditionally
used in studies on newsworthiness (see for example Chibnall, 1977, McQuail, 2005). Among
these, violence has been found to have the strongest power to elicit arousal and automatic
6
attention (Shupp et al., 2004).2
At the theoretical level, there are several explanations of why people are attracted by
violent content (Goldstein, 1998). The most prominent one is based on the idea that viewers
are motivated by a hedonically based drive towards emotional arousal (Bryant and Zillmann,
1994, Zuckerman, 1979). There is substantial evidence that the portrayal of violent content
increases arousal in viewers, as measured by heart rate and blood pressure (e.g. Zillmann,
1971, 1991). A second explanation of the attractive power of violence takes an evolutionary
perspective: through evolution, humans have become physiologically sensitive to information
about potentially threatening situations (Shoemaker, 1996; Davis and Mc Leod, 2003). A
third explanation relates to the voyeuristic effects of contents that are generally restricted or
socially disvalued (Bushman and Stack, 1996).
At the empirical level, recent studies indicate that viewing of media violence and
appreciation are weakly or negatively related (Krcmar and Kean, 2004, Weaver and Wilson,
2009). In a recent meta-analysis, Weaver (2011) shows that violence has a significant
positive effect on selective exposure and a significant negative effect on enjoyment. It should
be noted, however, that many of the studies reviewed measure selective exposure using
hypothetical scenarios, by asking participants how much they would like to watch a given
program. Consequently, social desirability biases cannot be ruled out. More generally, the
existing literature focuses on the effects of violent content on either viewing choices or
satisfaction with viewing, thus being unable to assess the consistency between the two.
2 Violence is commonly defined as “any overt depiction of a credible threat of physical
force or the actual use of such force intended to physically harm an animate being or group of
beings” (National Television Violence Study, 1998). More broadly, violence can be defined
as “any action that serves to diminish in some physical, social, or emotional manner […],
including verbal forms of aggression, not just physical forms” (Potter, 1999).

7
Regarding the definition of enjoyment, there is a wide range of uses of this concept in
the media entertainment literature. Most scholars agree that enjoyment is a pleasurable
response to media use (Raney, 2003; Vorderer et al., 2004; Zillmann and Bryant, 1994).
However, the concept of enjoyment is used interchangeably to indicate preference for and
response to media exposure (Tamborini et al., 2010). Tamborini et al. (2011) show that,
although the concept of enjoyment has usually addressed only the hedonic function of media
(arousal regulation and pleasure seeking), non-hedonic functions such as autonomy,
competence, and relatedness should also be considered. Oliver and Bartsch (2010) show how
the range of gratifications that audiences experience in film viewing is wide: gratifications
related to fun and suspense can be distinguished from those related to moving and thought-
provoking entertainment, although both are usually referred to with the concept of enjoyment.
A similar distinction between two dimensions of a consumption experience can be found in
marketing research. Using a sample of buyers in the consumer electronics market, Heitmann
et al. (2007) show that decision satisfaction and consumption satisfaction are clearly separate
constructs.
Overall, none of the existing studies has tested the consistency between television
viewing choices and satisfaction in a setting where viewers can choose from alternative
options and content is exogenously manipulated. The present work provides the first
experimental analysis of the effects of sensational content, in the form of verbal violence, on
both selective exposure and satisfaction with viewing.
3. Method
Our experiment is designed to test the effects of the portrayal of verbal violence on
viewing choices and satisfaction in television consumption. The experimental task,
implemented in a computerized laboratory, consists of watching television for a 10 minute
time span. Participants can choose from three programs: a serial, a talk show, and a

8
documentary (A, B, C, respectively). Choices are made in real time, so that participants can
switch at any time between the three programs during the viewing session. A post-
experimental questionnaire is used to assess participants’ satisfaction with the programs and
the overall viewing experience.
3.1. Experimental Design
The experiment is based on a 2x2 between-subjects design. The main experimental factor
is the content of program B. In the experimental condition (EC), program B portrays a violent
verbal confrontation between the participants to the talk show, in the form of arguments with
insults and intimidation. In the control condition (CC), program B is the same as in the
experimental condition, with no verbal violence. More specifically, in the control condition
program B is an excerpt from the same talk show and episode as in the experimental
condition, but it refers to an earlier part, when a neutral conversation takes place between the
participants. Programs A and C, used as benchmarks, are kept constant across conditions.
They were chosen as a benchmark since they represent different genres but do not portray
emotionally arousing content such as sex, violence, or conflict. More specifically, program A
is a TV serial set in the 18th century. Program C is a documentary about the social integration
of a young Moroccan immigrant in Italy.
The secondary experimental factor is aimed at assessing whether the effects of verbal
violence on viewing and satisfaction depend on the characteristics of the program.
Accordingly, the topic of the talk show for program B is varied orthogonally to the main
experimental factor. In one experimental condition (Low) program B is a relatively lowbrow
talk show, focusing on real-life stories, gossip and current affairs. In the particular episode
used in the experiment, guests discuss stalking episodes. In the other experimental condition
(High), program B is a relatively highbrow talk show, where guests discuss current political
issues. Official viewing figures indicate that the lowbrow talk show presents an audience
9
profile with a large percentage of low-education viewers. The highbrow talk show obtains a
high share among viewers with higher education. Given the characteristics of the audience,
the experimental context and the possible role played by social desirability, we expect higher
viewing share and satisfaction with program B in condition High relative to condition Low.
The manipulation of program topic allows us to assess whether the effects of sensational
content on viewing choices and satisfaction are related to the characteristics of the program.
3.2. Hypotheses
The experiment is designed to test the following hypotheses:
H1. Sensational content increases selective exposure. Under the assumption that
sensational content has attractive power, the share of viewing time for program B is expected
to be higher in EC than in CC.
H2. Sensational content does not affect satisfaction with program. Under the assumption
that viewers’ satisfaction with a given program is not related to the presence of sensational
content, satisfaction with program B is expected to be the same in EC and CC.
H3. Sensational content decreases satisfaction with program relative to exposure. Under
the joint hypothesis that people are attracted by sensational content and are not more satisfied
with it, the difference between satisfaction and viewing time for program B is expected to be
lower in EC than in CC.
Our design also aims at assessing the moderating role of program topic on the effects of
sensational content. We hypothesize that the highbrow topic produces higher viewing and
satisfaction than the lowbrow topic, but the effects of sensational content on viewing choices
and satisfaction do not depend on program topic. Therefore, although both program content
and program topic are expected to have significant main effects, no interaction is expected
between them.

10
3.3. Participants
The experiment was conducted in the Experimental Economics Laboratory of the
University of Milano-Bicocca. Participants were undergraduate and graduate students from
different backgrounds. We held 8 sessions, with 18 participants per session. Since two
sessions only had 16 participants, there were 140 participants in total. Two subjects were
eliminated from the sample since they did not watch program B, and one because of a limited
viewing time due to technical problems. The effective sample therefore includes 137
participants (49 females), attending 12 different university programs. The majority were
students of Economics (65%), Statistics (14.6%), and Information Technology (6.6%).
Average age was 23.0 years (SD=1.9). Participants were randomly assigned to the
experimental conditions, yielding 35 participants in condition CC-Low, 36 in CC-high, 32 in
EC-Low, and 34 in EC-High. The design was balanced with respect to gender (i.e.,
experimental factors are independent, χ2(1)=0.01, p=0.92 and conditionally independent of
gender, χ2(2)=0.24, p=0.88). Age was balanced across the four experimental groups
(F(3,134)=1.11, p=0.35). The university programs attended by the subjects were also
balanced across experimental factors (χ2(9)=8.25, p=0.51).3
3.4. Procedure
The experiment was computerized, with terminals connected through a network
controlled by the experimenter. Each participant was visually isolated from the others, so that
all participants had complete privacy with no one being able to see their screen during the
experiment. Participants used headphones, in order to be completely isolated from others.
The experiment was run with a fully anonymous protocol for both the viewing task and the
questionnaire, so that participants knew that their identity would not be known by other
3 In order to avoid cells with zero frequencies, university programs were grouped into four classes:
Economics, Statistics, Information Technology, Others.

11
participants and by the experimenter. Each participant was paid 10 euro for participating in
sessions lasting about 25 minutes.
In each session, participants were randomly assigned to a computer terminal at their
arrival. Instructions were presented on screen and read aloud. Participants went through two
phases: the viewing task and a questionnaire on viewing satisfaction and background
information. Participants were not informed at the beginning of the experiment that there
would be a questionnaire after the viewing task, in order not to influence their viewing
choices.
In the viewing task, a software interface simulating a TV set, written in Visual Basic,
allowed participants to simulate the task of watching television for 10 minutes, being able to
choose from three programs. Choices were made in real time, so that participants could
switch at any time between the three programs. The average duration of viewing spells was
38, 78 and 129 seconds for programs A, B, and C, respectively. Averaging across treatments,
viewing time shares were 0.15, 0.38 and 0.47 for programs A, B, and C, respectively.
At the end of the 10 minute viewing task, participants were asked to fill in a
questionnaire administered with the experimental software z-Tree (Fischbacher, 2007).
Following related research on television satisfaction (Perse and Ferguson, 1993; Ferguson
and Perse, 2004) we measured satisfaction using the questions “How satisfied are you with
program X (on a scale between 1 and 10)?” and “Overall, how satisfied are you with the
programs you have watched (on a scale between 1 and 10)?”. Subjects were also asked to rate
a number of specific attributes for each program, as detailed below (Table 2).
4. Results
We defined four dependent variables of the experiment. Share of viewing time is the
time spent viewing program B divided by the overall viewing time. Satisfaction with program
is defined as the self-reported satisfaction with program B as a percentage of the total

12
satisfaction with the three programs. We used this normalization in order to eliminate the
variability arising from differences between subjects in preferences for the viewing
experience. In addition, this normalization provides a measure of satisfaction that is directly
comparable with the measure of viewing time, since they are both defined as shares of total.
Relative satisfaction with program, used to test hypothesis 3, is defined as the difference
between satisfaction with program B and the corresponding share of viewing time. Overall
satisfaction is defined as the satisfaction with the viewing experience during the experiment,
on a scale between 1 and 10. This dependent variable allows us to assess whether the
asymmetric effects of sensational content on viewing choices and satisfaction for a given
program also result in lower satisfaction with the viewing experience as a whole. Table 1
provides a description of the dependent variables across content treatments.
[Table 1 about here]
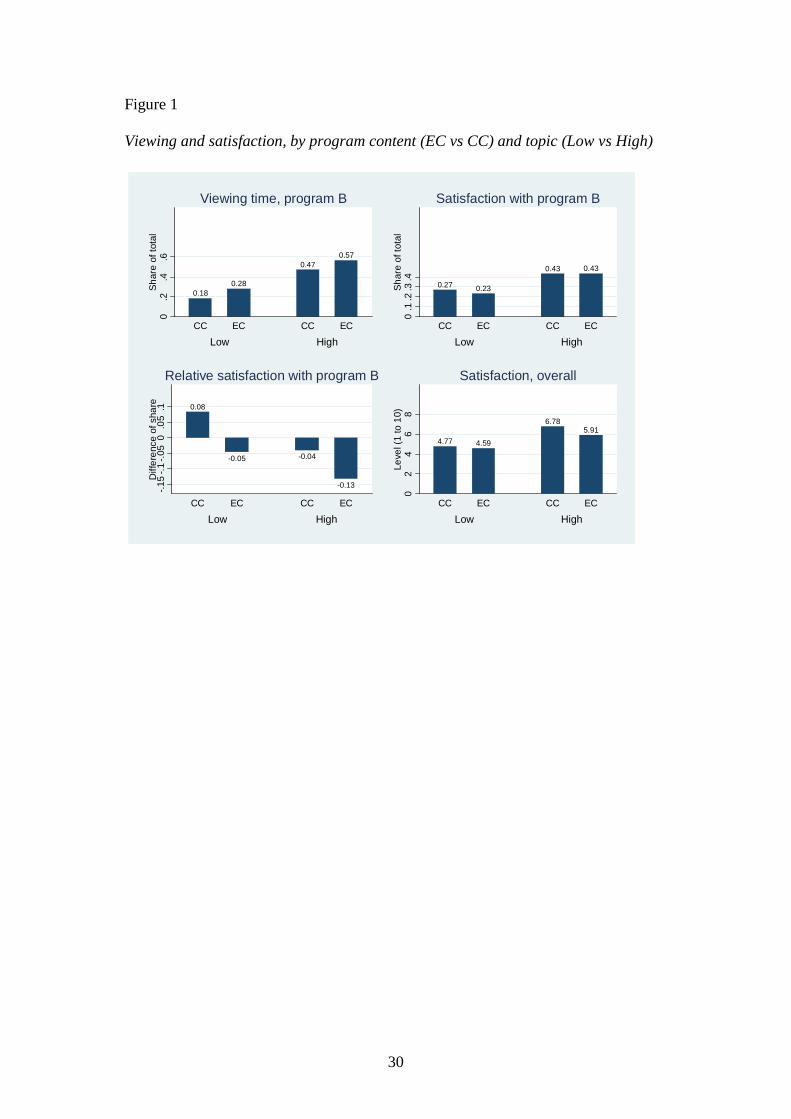
The main results are illustrated qualitatively in Figure 1. Program B was viewed for a
relatively longer time in the presence of verbal violence, in line with hypothesis 1, and this
treatment effect does not depend on the particular topic of the program. Satisfaction with
program B is indeed lower in EC than in CC and, as expected, higher in High than in Low
topic condition. Relative satisfaction with program B is lower in EC than in CC in both topic
conditions. Overall satisfaction with viewing is lower in EC than in CC, and this difference
does not depend on the program topic.
[Figure 1 about here]
4.1. Test of the hypotheses
Generalized Linear Models (GLM) were used to estimate the effects of the 2x2
experimental design, given that the dependent variables had different distributional
properties. In particular, the distribution of viewing time showed strong positive skewness.
We therefore modeled the GLM for this variable with a logarithmic link function and a

13
Tweedie distribution for the dependent variable (Jorgensen, 1987). All the other variables
were modeled with a linear link function and a normal distribution of errors. Consequently,
for the latter models the results are virtually identical to the ones obtained with ANOVA.
Distributional assumptions and link functions were evaluated also in term of Akaike
Information Criterion. None of the experimental effects showed an interaction with gender or
with age of participants, so these variables were dropped from the analyses.
Viewing time for program B, as a share of total, is 43 per cent in the presence of verbal
violence, as opposed to 33 per cent in the control condition. This treatment effect is
quantitatively relevant: the presence of verbal violence in a program increases its viewing
time share by a third. The effect is also statistically significant: the GLM yields a significant
main effect of content on share of viewing time (χ2(1)=3.88, p=0.048), a significant main
effect of topic (χ2(1)=29.25, p<0.01), and no interaction (χ2(1)=0.59, p=0.44). In short, the
presence of sensational content significantly increases exposure, and this effect does not
depend on program topic (Result 1). This result is consistent with the findings of previous
experimental studies indicating that media violence has a significant positive effect on
selective exposure (e.g., Oliver et al., 2007, Xie and Lee, 2008, Weaver, 2011).
Focusing on satisfaction with program content, the GLM provides a non-significant main
effect of program content (χ2(1)=1.23, p=0.27), a significant main effect of program topic
(χ2(1)=54.2, p<0.01), and no interaction between the two factors (χ2(1)=0.98, p=0.32).
Satisfaction with program is lower in the presence of verbal violence, consistently with
results of previous related experimental studies (Diener and Woody, 1981, Hansen and
Hansen, 1990, Weaver and Wilson, 2009), but the treatment effect is quantitatively small (-
0.02). The hypothesis that the presence of sensational content does not affect satisfaction with
program cannot be rejected (Result 2). Relative satisfaction with program B (the difference
between satisfaction and viewing time shares) is significantly lower in EC than in the CC

14
(χ2(1)=7.89, p<0.01), with no significant interaction with program topic (χ2(1)=0.19, p=0.65).
This indicates that sensational content significantly decreases relative satisfaction with
program, and the effect does not depend on program topic (Result 3). The main effect of
program content on overall satisfaction with viewing is significant at the 7 per cent level
(χ2(1)=3.21, p=0.07). GLM also indicates a significant main effect of program topic
(χ2(1)=32.60, p<0.01), and no interaction between the two experimental factors (χ2(1)=1.39,
p=0.24). We conclude that sensational content decreases overall satisfaction with viewing,
and this effect does not depend on program topic (Result 4).
4.2. Further evidence
Overall, the results indicate that subjects watch more of a given program when it contains
verbal violence, but they do so against their own interest, as they are not more satisfied with
the content of the program and are less satisfied with viewing overall. These findings are
robust to the use of different program topics (lowbrow vs highbrow) for the experimental
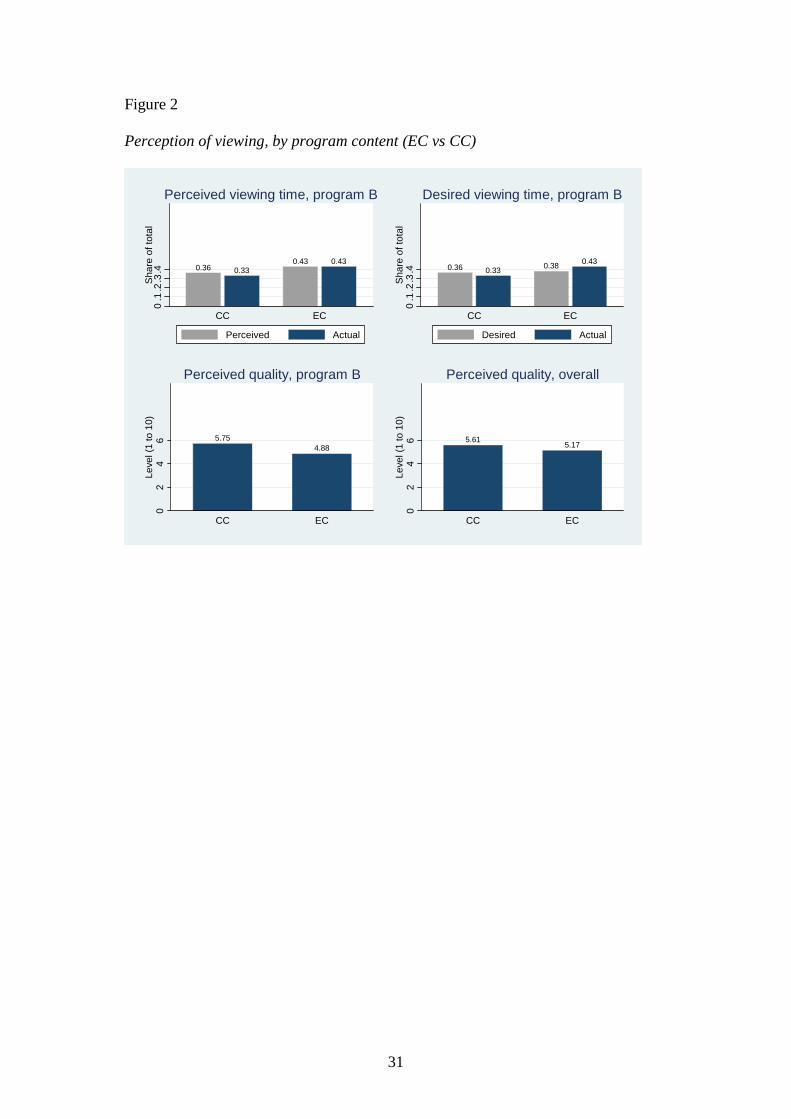
manipulation. In order to interpret these results, Figure 2 presents additional evidence on the
effects of sensational content.
[Figure 2 about here]
The first question we address is whether participants have a correct perception of the time
they have spent on each program. The answer is positive. When asked to estimate ex post the
share of viewing time for program B, participants report on average 0.36 and 0.43 per cent
for the CC and EC conditions, respectively. These figures are remarkably close to actual
viewing time shares (0.33 and 0.43 for CC and EC, respectively), indicating that participants
are well aware of the choices they have made.
Given that participants are aware of their own viewing choices, are they deliberately
choosing to watch a given program in the presence of verbal violence or are they unwillingly

15
attracted? In order to answer this question we compare actual viewing time with desired
viewing time, measured on the basis of the question “If at the end of the questionnaire you
were to watch the three programs for 10 additional minutes, what percentage of total time
would you want to spend on each program?”. Desired viewing time is virtually unchanged
across experimental conditions (0.36 and 0.38 in CC and EC, respectively, p=0.40). As a
result, excess consumption, defined as the difference between actual and desired viewing
time, is higher in EC relative to CC, and the difference is statistically significant (p<0.01).
This indicates that sensational content significantly increases excess consumption.
How do participants rate the quality of program B across treatments? The perceived quality
of program B, on a scale between 1 and 10, falls from 5.75 in CC to 4.88 in EC, and the
difference is statistically significant (p=0.03). This indicates that participants are aware that
they are watching more of a program they consider of lower quality. Next, consider the
perception of the viewing experience as a whole. When asked to rate the quality of viewing
overall, participants report marginally significant lower scores in EC (p=0.06).
Finally, Table 2 reports differences between EC and CC for self-reported assessments of
individual characteristics of program B. In EC, program B is perceived as significantly more
violent and vulgar (p=0.01 for both variables). This confirms the effectiveness of the
experimental manipulation. Program B is also perceived as less instructive (p=0.07), less
relaxing (p=0.07) and less suitable to a general public (p<0.01) in EC. These results indicate
that participants clearly perceive several negative features of violent content. On the other
hand, program B is reported to be significantly more amusing (p=0.02). Interestingly, this is
the only positive feature that can be associated to the increase in viewing time across
treatments.
[Table 2 about here]
16
5. Conclusions
Our results indicate that, in a setting of free choice between different TV programs, the
presence of verbal violence in one program causes subjects to watch more of the same
program, although they do not experience higher satisfaction with the program. In addition,
they report lower satisfaction with the overall viewing experience. Several issues need to be
considered in order to interpret these findings.
The first issue is the role played by social desirability. The lower satisfaction levels
reported in the presence of sensational content may reflect the tendency of participants to
reply in a manner that will be viewed favorably by others. We controlled for the effects of
social desirability by using an identical television program for the manipulation of the content
between subjects, while also keeping constant the two alternative benchmark programs.
Therefore, the experimental manipulation was not based on choosing from different sets of
programs, but from the same set of programs with different content in one of the programs. It
is also important to observe that in the experiment the presence of sensational content
produces a significant fall in overall satisfaction with viewing. This result cannot be
explained by the social desirability of the programs viewed, given that the set of three
programs is kept constant across treatments.
Alternatively, it could be argued that our experimental results are explained by the social
desirability of program content: subjects might have rated the more violent show in the
treatment condition lower because this is perceived as the correct thing to do, rather than
because they did not enjoy it. In order to minimize this potentially confounding effect of
social desirability, we implemented a fully anonymous protocol for data collection: in our
experiment, subjects were completely isolated from others and knew that their identity would
not be disclosed to other participants or to the experimenter. Full anonymity can be expected
to attenuate the effects of social desirability of program content. Subjects’ ex-post estimates
17
of their own exposure to program B are consistent with this hypothesis. The effect of social
desirability of program content should have led subjects to under-report viewing time for
program B in the experimental condition and/or over-report it in the control condition. Self-
reported viewing time is instead virtually identical to actual viewing time in both
experimental conditions.
The second issue is external validity. Since our sample is composed of university students,
there is limited variability in age and education. It is therefore difficult to assess if the effects
of sensational content on viewing and satisfaction extend to the general population and how
they might be affected by differences in socio-demographic characteristics. In our
experimental analysis, we find no significant interaction between sensational content and
gender. Nevertheless, it would be important to replicate the experiment with different target
audience types. External validity could also be hampered by the relatively short duration of
the viewing task (10 minutes), the limited number of programs available (three), and the
specific type of programs chosen for the experimental manipulation (talk show) and for the
benchmark (serial and documentary). Although there are no strong reasons a priori to expect
that the effects of sensational content would not be replicated in a different setting, the
robustness of the results to all these features needs to be assessed in future research.
The third issue is the measurement of viewers’ satisfaction. Following previous research on
television enjoyment, we measured viewers’ satisfaction by asking experimental subjects
about their satisfaction with individual programs and the overall viewing experience. As
discussed above, the consistency between actual and self-reported viewing times in both
experimental conditions provides an indirect indication that self-reported satisfaction was not
biased by social desirability. However, the concept of satisfaction is a complex one. Self-
reported satisfaction may be only partially capturing the different dimensions of enjoyment,
appreciation and liking of media experiences (Nabi and Krcmar, 2004).

18
Overall, the results presented in this study indicate that television consumption, given its
specific characteristics, may provide a major example of sub-optimal behavior. In television
viewing, consumption is virtually free, as it is paid for by advertising. Even in cable TV or
satellite TV, the cost of a single exposure is minimal. This makes TV consumption a low-cost
activity. In addition, television viewing is a leisure activity aimed at producing immediate
relaxation with low involvement. As a result of these specific features, impulse choices are
more likely to occur in television viewing than in other consumption domains.
More generally, our results pose a challenge to the use of audience figures as a measure of
appreciation or satisfaction, which is a widespread practice in the media market. As audience
ratings provide the basis for advertising revenues, commercial broadcasters tend to use
almost exclusively audience size figures as an indicator of program performance, while
neglecting measures of audience appreciation (Hagen, 1999). Consequently, in the public
discourse, audience size is commonly used as a proxy for appreciation (Bourdon, 1994). The
results of our experiment show that sensational content causes attentive reactions that can be
directed irrespective of, or even in contrast with, viewers’ satisfaction.

19
ACKNOWLEDGEMENTS
We are grateful to James Shanahan for useful comments and Roberto Reale for excellent
research assistance. We thank the Osservatorio di Pavia - Media Research and Telecom
Italia, for providing us with the audiovisual content used for the experiment. We
acknowledge financial support from CISEPS, University of Milan Bicocca. Marco Gui
gratefully acknowledges financial support from “Regione Lombardia” - European Social
Fund.

20
REFERENCES
Ang, I. (1985). Watching Dallas: Soap Opera and the Melodramatic Imagination. New York,
NJ: Methuen.
Basil, M. D. (1994). Secondary reaction time measures. In A. Lang (Ed.), Measuring
Psychological Responses to Media Messages (pp. 85-98). Hillsdale, NJ.
Benesch, C., Frey, B., & Stutzer, A. (2010). TV channels, self control and happiness. The
B.E. Journal of Economic Analysis & Policy, 10(1).
Blumler, J., & Katz E. (1974). The uses of mass communication. Thousand Oaks, CA: Sage.
Bourdon, J. (1994). Alone in the desert of 50 million viewers: audience ratings in French
television. Media, Culture & Society, 16, 375-394.
Bruni, L., & Stanca, L. (2008), Watching alone: Relational goods, television and happiness,
Journal of Economic Behavior and Organization, 65(3-4), 506-528.
Bryant, J., & Zillmann, D. (1994). Media effects: advances in theory and research. Hillsdale,
NJ: L. Erlbaum Associates.
Bushman, B. J., & Stack, A. D. (1996). Forbidden fruit versus tainted fruit: Effects of
warning labels on attraction to television violence. Journal of Experimental Psychology:
Applied, 2(3), 207–226.
Chibnall S. (1977), Law and order news: An analysis of crime reporting in the British press,
London: Tavistock Publications.
Cutler D. M., Glaeser E. L., & Shapiro J.M. (2003). Why Have Americans Become More
Obese?. Journal of Economic Perspectives, 17(3), 93-118.
Davis H., & McLeod S.L. (2003), Why humans value sensational news: An evolutionary
perspective, Evolution and Human Behavior, 24(3), 208–216.

21
Diener, E. & Woody, L. (1981). Television violence, conflict, realism, and action: A study in
viewer liking. Communication Research, 8(3), 281-306.
Ferguson, D., & Perse, E. (2004). Audience satisfaction among TiVo and replay users.
Journal of Interactive Advertising, 4(2), 1-8.
Fischbacher, U. (2007). z-Tree: Zurich toolbox for ready-made economic experiments.
Experimental Economics, 10(2), 171-178.
Frey, B., & Benesch, C. (2008). TV, Time and Happiness. Homo Oeconomicus, 25(3/4), 413-
424.
Frey, B., Benesch C., & Stutzer A. (2007). Does watching TV make us happy?. Journal of
Economic Psychology, 28(3), 283-313.
Goldstein, J. (1998), Why We Watch: The Attractions of Violent Entertainment. (Ed.), New
York/Oxford, Oxford University Press.
Grabe, M. E., Lang, A., & Zhao, X. (2003). News content and form. Communication
Research, 30(4), 387-414
Grabe, M. E., Zhou, S., & Barnett, B. (2001). Explicating sensationalism in television news:
Content and the bells and whistles of form. Journal of Broadcasting & Electronic Media,
45(4), 635-655.
Greenberg, B. S. (1980). Life on television: Content analyses of U.S. TV drama. Norwood,
NJ: Ablex.
Gruber, J., & Mullainathan S. (2005). Do cigarette taxes make smokers happier?. The B.E.
Journal of Economic Analysis & Policy, Berkeley Electronic Press, vol. 0(1), pages 4.
Gunter, B., & Wober M. (1992). The reactive viewer. London, UK: John Libbey and
Company.
Gunter, B., Harrison, J., & Wykes, M. (2003). Violence on television: distribution, form,
context, and themes, Hillsdale, NJ: Lawrence Erlbaum Associates.
22
Hagen, I. (1999). Slaves of the ratings tyranny: Media images of the audience. In P.
Alasuutari (Eds.), Rethinking the media audience: The new agenda (pp. 130-150).
London, UK: Sage.
Hansen, C.H. & Hansen, R.D. (1990). The Influence of Sex and Violence on the Appeal of
Rock Music Videos, Communication Research, 17(2), 212-234.
Hardy, A., De Swert, K., & Sadicaris, D. (2010). Does market-driven journalism lead to
sensationalism in television news? Explaining sensationalism in 11 countries. Paper
presented at the annual meeting of the International Communication Association, Suntec
Singapore International Convention & Exhibition Centre, Suntec City, Singapore Online.
Heitmann, M., Lehmann, D. R., & Herrmann, A. (2007). Choice goal attainment and decision
and consumption satisfaction. Journal of Marketing Research, 44(2), 234-250.
Hendrik Vettehen, P.G., Nuijten, C.M., & Beentjes, J.W. (2005). News in an age of
competition: Sensationalism in Dutch television news 1995-2001. Journal of Broadcasting
& Electronic Media, 49(3), 282-295.
Hendrik Vettehen, P., Nuijten, K., & Peeters, A. (2008). Explaining effects of sensationalism
on liking of television news stories: the role of emotional arousal. Communication
Research, 35(3), 319-338.
Hoch, S., & Loewenstein, G., (1991). Time-inconsistent preferences and consumer self-
control. Journal of Consumer Research, 17(4), 492-507.
Hutchby, I. (2001), Confrontation as Spectacle: The argumentative frame of the Ricki Lake
show. In A. Tolson (Ed.), Television Talk Shows: Discourse, Performance, Spectacle (pp.
155–172). Mahwah, NJ: Erlbaum.
IP Network (2007). Television 2007: International Keyfacts. IP Network.
Ishikawa, S. (1996). Quality assessment of television. Luton, UK: John Libbey Media.
Jorgensen, B. (1987). Exponential dispersion models. Journal of the Royal Statistical Society

23
B, 49, 127-162.
King, M., & Bruner, G. (2000). Social desirability bias: a neglected aspect of validity testing.
Psychology and Marketing, 17(2), 79–103.
Krcmar, M., & Kean, L. G. (2004). Uses and gratifications of media violence: Personality
correlates of viewing and liking violent genres. Media Psychology, 7(2), 399-420.
Lang, A., Dhillon, K., & Dong, Q. (1995). The effects of emotional arousal and valence on
television viewers’ cognitive capacity and memory. Journal of Broadcasting & Electronic
Media, 39(3), 313-327.
Lang, A., Bolls, P., Potter, R., & Kawahara, K. (1999). The effects of production pacing and
arousing content on the information processing of television messages. Journal of
Broadcasting & Electronic Media, 43(4), 451-475.
Leggatt, T. (1996). Identifying the undefinable: An essay on approaches to assessing quality
in television in the UK. In S. Ishikawa (Ed.), Quality assessment of television. Luton, UK:
John Libbey Media.
Luginbühl, M. (2007). Conversational violence in political TV debates: Forms and functions.
Journal of Pragmatics, 39(8): 1371–1387.
McQuail, D. (1997). Audience analysis. London, UK: Sage Publications.
McQuail, D. (2005), McQuail’s Mass Communication Theory. London, UK: Sage
Publications.
Miller, A. (2006). Watching viewers watch TV: Processing live, breaking, and emotional
news in a naturalistic setting. Journalism & Mass Communication Quarterly, 83(3), 511-
529.
Morrison, D. (1986). Invisible citizens: British public opinion and the future of broadcasting.
London, UK: Broadcasting Research Unit/John Libbey.
Nabi, R., & Krcmar, M. (2004) Conceptualizing Media Enjoyment as Attitude: Implications

24
for Mass Media Effects Research, Communication Theory, 14(4), 288–310.
National Television Violence Study (1998). Vol. 3. Thousand Oaks, CA: Sage.
Nederhof, A. (1985). Methods of coping with social desirability bias: a review. European
Journal of Social Psychology, 15(3), 263-280.
Newhagen, J.E., & Reeves, B. (1992). The evening’s bad news: Effects of compelling
negative television news images on memory. Journal of Communication, 42(2), 25-42.
Oliver, M.B., & Bartsch, A. (2010) Appreciation as Audience Response: Exploring
Entertainment Gratifications Beyond Hedonism. Human Communication Research, 36(1),
53-81
Oliver, M.B., Kalyanaraman, S., Mahood, C., & Ramasubramanian, S. (2007) Sexual and
Violent Imagery in Movie Previews: Effects on Viewers' Perceptions and Anticipated
Enjoyment. Journal of Broadcasting & Electronic Media, 51(4), 596-614.
Perse, E.M., & Ferguson, D.A. (1993). The impact of newer television technologies on
television satisfaction. Journalism Quarterly, 70(4), 843-853.
Potter, J. (1996). Representing Reality: Discourse, Rhetoric and Social Construction.
London, UK: Sage Publications.
Potter, J. (1999). On Media Violence. London, UK: Sage Publications.
Potter, W. J., & Vaughan, M. (1997). Aggression in television entertainment: Profiles and
trends. Communication Research Reports, 14, 116-124.
Potter, W. J., & Warren, R. (1998), Humor as camouflage of televised violence. Journal of
Communication, 48(2), 40-57.
Raney, A. A. (2003). Disposition-based theories of enjoyment. In J. Bryant, D. R. Roskos-
Ewoldsen & J. Cantor (Eds.), Communication and emotion: Essays in honor of Dolf
Zillmann (pp. 61–84). Mahwah, NJ: Erlbaum.
Rubin, A., Haridakis, P., & Eyal, K. (2003). Viewer Aggression and Attraction to Television
25
Talk Shows. Media Psychology, 5(4), 331-362.
Shapiro, J.M. (2005). Is there a daily discount rate? Evidence from the food stamp nutrition
cycle. Journal of Public Economics, 89(2-3), 303-325.
Shoemaker, P.J. (1996). Hardwired for news: Using biological and cultural evolution to
explain the surveillance function. Journal of Communication, 46(3), 32-47.
Simons, R.F., Detenber, B.H., Cuthbert, B.N., Schwartz, D., & Reiss, J.E. (2003), Attention
to television: Alpha power and its relationship to image motion and emotional content,
Media Psychology, 5(3), 283 - 301
Slattery, K.L., Doremus, M., & Marcus, L., (2001). Shifts in public affairs reporting on the
network evening news: A move toward the sensational. Journal of Broadcasting &
Electronic Media, 45(2), 290-302.
Slattery, K.L., & Hakanen, E. A. (1994). Sensationalism versus public affairs content of local
TV news: Pennsylvania revisited. Journal of Broadcasting & Electronic Media, 38(2),
205-216.
Schupp, H., Cuthbert, B., Bradley M., Hillman, C., Hamm, A. & Lang P. (2004), Brain
processes in emotional perception: Motivated attention. Cognition & Emotion, 18(5), 593-
611.
Tamborini, R., Bowman, N. D., Eden, A., Grizzard, M., & Organ, A. (2010). Defining media
enjoyment as the satisfaction of intrinsic needs. Journal of Communication, 60(4), 758–
777.
Tamborini, R., Grizzard, M., Bowman, N.D., Reinecke, L., Lewis R.J., & Eden A. (2011),
Media enjoyment as need satisfaction: the contribution of hedonic and nonhedonic needs,
Journal of Communication, 61(6), 1025-1042.
Thaler, R.H., & Mullainathan, S., (2001). Behavioral Economics. In International
Encyclopedia of the Social and Behavioral Sciences, New York, NY: Elsevier.
26
Uribe, R., & Gunter, B. (2007). Are ‘sensational’ news stories more likely to trigger viewers’
emotions than non-sensational news stories? A content analysis of British TV news.
European Journal of Communication, 22(2), 207-228.
Vorderer, P., Klimmt, C., & Ritterfield, U. (2004). Enjoyment: At the heart of media
entertainment. Communication Theory, 14(4), 388–408.
Weaver, A.J. (2011). A Meta-Analytical Review of Selective Exposure to and the Enjoyment
of Media Violence. Journal of Broadcasting & Electronic Media, 55(2), 232-250.
Weaver, A.J., & Wilson, B.J. (2009). The role of graphic and sanitized violence in the
enjoyment of television dramas. Human Communication Research, 35(3), 442-463.
Weimann, G., Brosius, H.B., & Wober, M. (1992). TV diets: Toward a typology of TV
viewership. European Journal of Communication, 7(4), 491-515.
Wober, J.M., (1990). The assessment of television quality: Some explorations of methods and
their results. London, UK: IBA Research Department.
Wood, H. (2001). “No, you rioted!”: The pursuit of conflict in the management of "Lay" and
"Expert" discourses in Kilroy’. In A. Tolson (ed.). Television Talk Shows: Discourse,
Performance, Spectacle, (pp. 65-88). Mahwah, NJ: Lawrence Erlbaum Associates.
Xie, G.X. & Lee, M.J. (2008). Anticipated violence, arousal, and enjoyment of movies:
viewers' reactions to violent previews based on arousal-seeking tendency. Journal of
Social Psychology, 148(3), 277-292.
Zillmann, D. (1971). Excitation transfer in communication-mediated aggressive behavior,
Journal of Experimental Social Psychology, 7(4), 419-434.
Zillmann, D. (1991). Television viewing and physiological arousal. In J. Bryant & D.
Zillmann (Eds.), Responding to the screens: Reception and reaction processes (pp. 103–
133). Hillsdale, NJ: Lawrence Erlbaum Associates.
Zillmann, D., & Bryant, J. (1994). Entertainment as media effect. In J. Bryant & D. Zillmann

27
(Eds.), Media effects: Advances in theory and research (pp. 437–461). Hillsdale, NJ:
Erlbaum.
Zuckerman, M., (1979). Sensation Seeking: Beyond the Optimal Level of Arousal. Hillsdale,
NJ: Lawrence Erlbaum.

28
Table 1
Dependent variables and participants’ characteristics, by program content
EC CC Difference p-value
Viewing time share for program B 0.43 0.33 0.10 0.05
Satisfaction with program B 0.34 0.35 -0.02 0.27
Relative satisfaction with program B 0.02 -0.09 -0.11 0.00
Overall satisfaction with viewing 5.27 5.79 -0.53 0.07
Note: EC: experimental condition; CC=control condition. Viewing time share is time spent
viewing a program divided by overall viewing time. Satisfaction with program is self-
reported satisfaction with a program divided by overall satisfaction with viewing. Relative
satisfaction with program is the difference between satisfaction and share of viewing time.
Overall satisfaction is satisfaction with the overall viewing experience, on a scale between 1
and 10. For each variable, the significance of treatment effects is evaluated with a GLM (see
Section 4). p-values are based on two-sided tests.

29
Table 2
Assessment of program B characteristics, by program content
CC EC Difference p-value
Amusing 3.55 4.52 0.97 0.02
Involving 5.38 5.26 -0.12 0.79
Instructive 5.46 4.71 -0.75 0.12
Relaxing 3.87 3.35 -0.52 0.17
Original 3.63 3.65 0.02 0.97
Well Done 4.99 4.39 -0.59 0.18
Suitable to all 4.75 3.83 -0.91 0.02
Vulgar 3.76 6.18 2.42 <0.01
Violent 2.41 4.77 2.36 <0.01
Useful 5.62 5.09 -0.53 0.31
Note: CC=control condition; EC: experimental condition. Viewers’ assessment of
program characteristics was based on the question “For each of the three programs, do
you agree with the following statement?” (e.g. “It is amusing”, etc.), with answers
ranging between 1 (strongly disagree) and 10 (strongly agree). For each variable, the
significance of content effects is evaluated with a rank sum test, p-values are based on
two-sided tests.
30
Figure 1
Viewing and satisfaction, by program content (EC vs CC) and topic (Low vs High)
0.180.28
0.470.57
0.2
.4.6
Sh
are
of to
tal
Low High
CC EC CC EC
Viewing time, program B
0.27 0.23
0.43 0.43
0.1
.2.3
.4S
har
e of
tota
l
Low High
CC EC CC EC
Satisfaction with program B
0.08
-0.05 -0.04
-0.13-.15
-.1
-.05
0.0
5.1
Diff
ere
nce
of s
hare
Low High
CC EC CC EC
Relative satisfaction with program B
4.77 4.59
6.785.91
02
46
8Le
vel (
1 to
10)
Low High
CC EC CC EC
Satisfaction, overall
31
Figure 2
Perception of viewing, by program content (EC vs CC)
0.36 0.330.43 0.43
0.1
.2.3
.4S
hare
of t
otal
CC EC
Perceived viewing time, program B
Perceived Actual
0.36 0.330.38 0.43
0.1
.2.3
.4S
hare
of t
otal
CC EC
Desired viewing time, program B
Desired Actual
5.754.88
02
46
Leve
l (1
to 1
0)
CC EC
Perceived quality, program B
5.615.17
02
46
Leve
l (1
to 1
0)
CC EC
Perceived quality, overall