this is an open access document downloaded from orca ...orca.cf.ac.uk/108442/1/m hartt development...
TRANSCRIPT

1
This is a pre-copy-editing, author-produced PDF of an article accepted following peer review for
publication in Town Planning Review.
The Development and Revitalisation of Shrinking Cities: A Twin City Comparison
Maxwell D. Hartt, University of Toronto
Joshua Warkentin, University of Waterloo
Abstract
The twin cities of Niagara Falls Ontario (ON) and New York (NY) share a natural wonder and an industrial
past; however, respective local economic and governance structures have led to a stark demographic
divergence between the two cities. Analysis reveals that the processes leading to the divergence between
the cities are predominantly external to the local scale. Local perceptions of and strategies to cope with
shrinkage and slow growth were comparable in both cities. The relative success of Niagara Falls, ON can
be largely attributed to provincial intervention.
2
Introduction
Post-industrial transformations, the decline of the manufacturing industry and other economic
fluctuations have contributed to diminishing populations and economic stagnation in cities all over the
globe (Hollander, 2011). Many of these cities are also experiencing the effects of a second demographic
transition, characterised by the accelerated ageing of populations and decreasing fertility rates (van de
Kaa, 2002). Often these patterns emerge within industrial or economic sectors where multiple
communities rely on similar economic activities. Geographically contiguous cities can also experience
economic instabilities as financial downturns and population losses are often felt at a regional level. The
twin cities of Niagara Falls Ontario (ON) and New York (NY) followed comparable economic and
demographic trajectories until the 1970s, after which they began to diverge. This paper examines the
demographic and socioeconomic changes that occurred through their respective histories and the keys to
the stark divergence between the cities.
Case Studies: Niagara Falls, ON and Niagara Falls, NY
Located between Lake Erie and Lake Ontario in the Great Lakes region of North America, Niagara
Falls is the joint name of three waterfalls (Horseshoe Falls, American Falls and Bridal Veil Falls) that
span the Canadian-American international border. Directly adjacent to these falls are the cities of Niagara
Falls, NY and Niagara Falls, ON. Despite sharing this natural wonder, each city has taken significantly
different development paths.
Niagara Falls, NY
Due to its central location in the Great Lakes region and access to cheap hydroelectric power, the
city became a significant industrial centre in the early 20th century. Although its image was associated

3
with the natural feature of the falls, industrial development was considered to be the key factor to the city’s
long-term success. In 1934, the editor of the Niagara Falls Gazette emphasised the importance of industrial
activities by noting that he would ‘be willing to see the falls dry up entirely if it would bring the wealth
and population that a dozen more factories would put in here’ (as cited in Strand, 2009, p. 175). During
this period of rapid industrial expansion, the population of Niagara Falls, NY increased from 5,500
residents in 1890 to more than 102,000 in 1960 (US Census Bureau, 2013).
The city’s rapid growth began to slow and eventually reverse in the late 1950s, starting with the
collapse of the Schoellkopf Power Station in 1956. Faced with a chronic power shortage, industrial
activities began moving their operations to other areas in the United States with lower wages and less
expensive power. Between 1956 and 1963, the city lost nearly 12,000 manufacturing jobs (Strand, 2009).
Mah (2012) notes that, for the next 40 years, the city’s industrial activity would continue to shrink as
tightening environmental regulations reduced profitability and the demand for its products disappeared
with the collapse of the region’s steel and auto manufacturing industries.
Concurrently, the city’s tourism industry suffered a series of setbacks. During the 1970s, two
energy crises made the cost of travel too expensive for many Americans (Strand, 2009). The city’s image
was also tarnished by the demolition of the Falls Street Downtown for a modernist urban renewal
development, significant environmental contamination (i.e. Love Canal in 1979) and the downtown
concentration of vacant land and failed urban renewal projects.

4
Figure 1: Municipal population of Niagara Falls, NY and Niagara Falls, ON. Source: Statistics Canada (2013) and US
Census Bureau (2013)
As a result of these events, the population of Niagara Falls, NY has declined continuously since
the late 1950s (Figure 1). The population of the city in 2012 was estimated to be 49,468, a decline of
approximately 52% from its peak in 1960 (US Census Bureau, 2013). Like many other industrialised
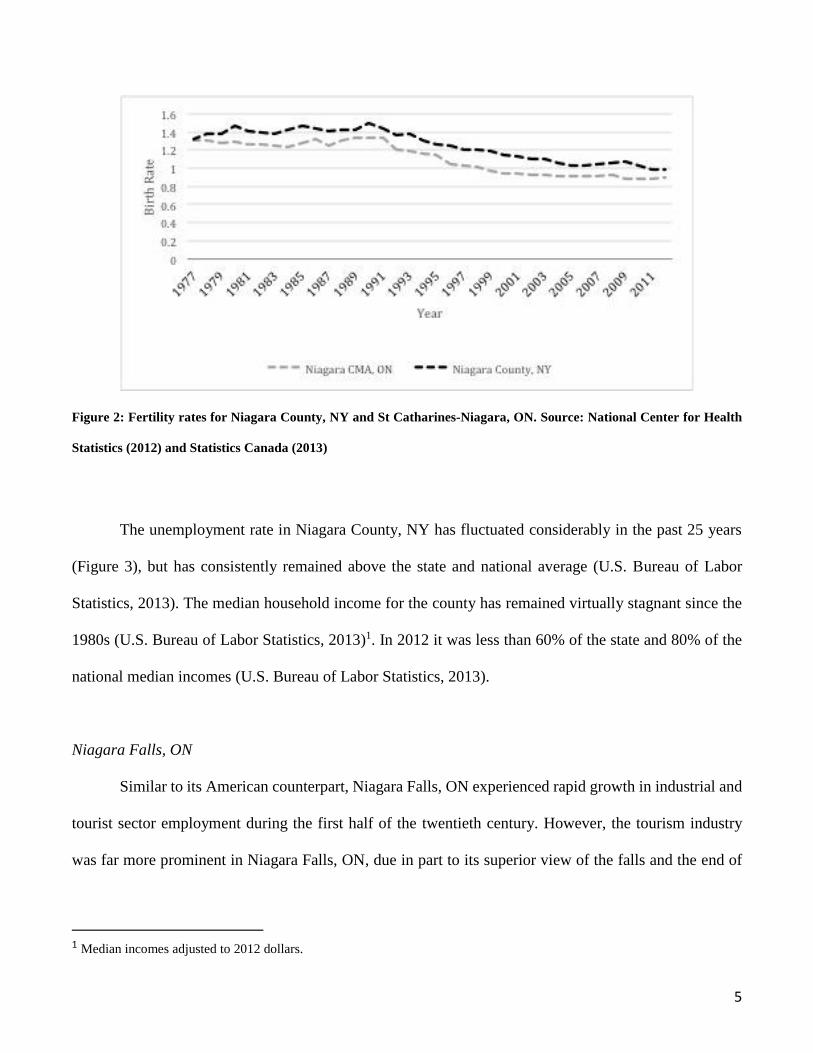
regions, the city’s shrinking population can be partially explained by low fertility rates. The fertility rate
for Niagara County, NY has been below the replacement rate of 2.1 for over 30 years (Figure 2). In 2011,
the fertility rate fell below 1 child per woman (National Center for Health Statistics, 2012).
5
Figure 2: Fertility rates for Niagara County, NY and St Catharines-Niagara, ON. Source: National Center for Health
Statistics (2012) and Statistics Canada (2013)
The unemployment rate in Niagara County, NY has fluctuated considerably in the past 25 years
(Figure 3), but has consistently remained above the state and national average (U.S. Bureau of Labor
Statistics, 2013). The median household income for the county has remained virtually stagnant since the
1980s (U.S. Bureau of Labor Statistics, 2013)1. In 2012 it was less than 60% of the state and 80% of the
national median incomes (U.S. Bureau of Labor Statistics, 2013).
Niagara Falls, ON
Similar to its American counterpart, Niagara Falls, ON experienced rapid growth in industrial and
tourist sector employment during the first half of the twentieth century. However, the tourism industry
was far more prominent in Niagara Falls, ON, due in part to its superior view of the falls and the end of
1 Median incomes adjusted to 2012 dollars.

6
prohibition in Canada. The lower amount of industrial activity also reflected the smaller market for goods
in Canada and the higher production costs due to tariffs between the US and Canada, as well as more
stringent environmental legislation and corporate responsibility from the Canadian government (Regional
Municipality of Niagara, 1970; Mah, 2012).
Since the 1960s, however, the city has experienced varying levels of growth and stagnation. Rising
labour and energy costs forced some of the city’s largest plants to close (Strand, 2009; Mah, 2012).
Moreover, the number of tourists dwindled as changing tastes favoured other North American, European
and the Caribbean destinations (Strand, 2009). Although the Province of Ontario amalgamated the city
with adjacent municipalities in 1970, residential and commercial development at the urban fringe, and in
nearby population centres, led to considerable decline and blight in the inner city (GSP Group, 2004).
Between 1971 and 2011, Niagara Falls grew by 24% (Statistics Canada, 2013). Despite faring
better than its American counterpart, the city grew at a much slower pace than the province as a whole,
which experienced 67% growth during the same period (Statistics Canada, 2013). The city’s population
has generally stagnated during periods of economic recession and expanded during periods of economic
growth (Statistics Canada, 2013). The construction of two casinos by the Province of Ontario (Casino
Niagara in 1996 and Fallsview Casino in 2004) fostered more than $2.5 billion (CAD) worth of private
sector development between 1996 and 2007 and led to a population increase of almost 20,000 (Fink, 2009;
Statistics Canada, 2013). Since then, growth has once again slowed, with only 0.9% population growth
between 2006 and 2011. The latest period of sluggish growth was attributed to the construction of new
casinos and tourist attractions north of Toronto and in Niagara Falls, NY, a strong Canadian dollar and
heightened border security regulations (Jayawardena, 2008; MacLaurin and Wolstenholme, 2008).

7
Figure 3: Relative unemployment in Niagara County, NY and St Catharine’s-Niagara CMA, ON. Source: Statistics
Canada (2013) and US Bureau of Labor Statistics (2013)
The cyclical nature of boom and bust in Niagara Falls and the greater Niagara region reflects falling
fertility rates, the continued decline in manufacturing employment and stagnation in the tourism industry.
Figure 3 demonstrates that the Canadian side was vulnerable to the same overarching economic trends
demonstrated on the American side - as the relative unemployment rates dip and peak almost in unison.
On both sides of the border, the median income in 2011 was lower than it was 30 years previously.
Paths to Divergence
While both Niagara Falls, ON and Niagara Falls, NY have been affected by forces external to their
communities (i.e. globalisation) and control (growing automation of manufacturing processes, declining
fertility rates), their respective development also reflects decisions made at the local, regional and
8
state/provincial level. Geographic, planning and governance factors all contributed to the demographic
divergence between the cities.
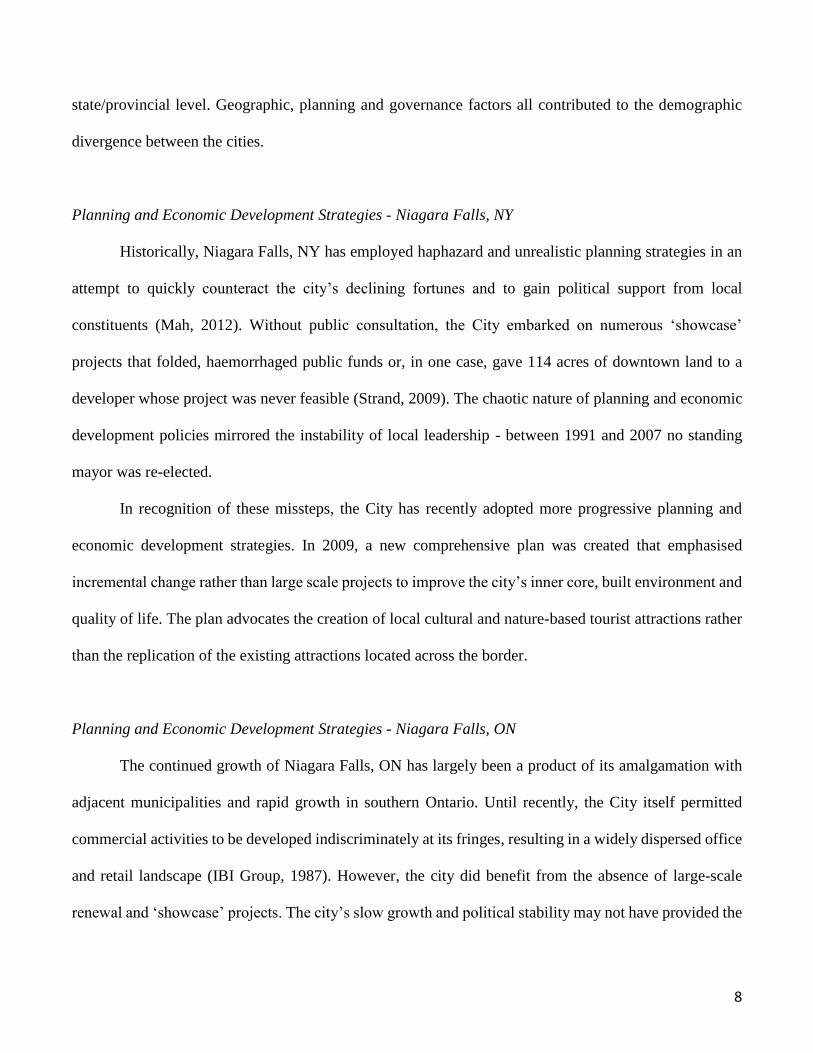
Planning and Economic Development Strategies - Niagara Falls, NY
Historically, Niagara Falls, NY has employed haphazard and unrealistic planning strategies in an
attempt to quickly counteract the city’s declining fortunes and to gain political support from local
constituents (Mah, 2012). Without public consultation, the City embarked on numerous ‘showcase’
projects that folded, haemorrhaged public funds or, in one case, gave 114 acres of downtown land to a
developer whose project was never feasible (Strand, 2009). The chaotic nature of planning and economic
development policies mirrored the instability of local leadership - between 1991 and 2007 no standing
mayor was re-elected.
In recognition of these missteps, the City has recently adopted more progressive planning and
economic development strategies. In 2009, a new comprehensive plan was created that emphasised
incremental change rather than large scale projects to improve the city’s inner core, built environment and
quality of life. The plan advocates the creation of local cultural and nature-based tourist attractions rather
than the replication of the existing attractions located across the border.
Planning and Economic Development Strategies - Niagara Falls, ON
The continued growth of Niagara Falls, ON has largely been a product of its amalgamation with
adjacent municipalities and rapid growth in southern Ontario. Until recently, the City itself permitted
commercial activities to be developed indiscriminately at its fringes, resulting in a widely dispersed office
and retail landscape (IBI Group, 1987). However, the city did benefit from the absence of large-scale
renewal and ‘showcase’ projects. The city’s slow growth and political stability may not have provided the

9
same sense of urgency for local leaders as their counterparts faced across the border. As a result, renewal
plans have generally attempted to stimulate private investment in existing and new projects through
strategic infrastructure and aesthetic improvements (e.g. streetscaping).
More recently, the City has acknowledged that it will experience slow growth for the foreseeable
future and has begun participating in regional economic development and tourism partnerships with the
regional government and other area municipalities. The intent of both partnerships is to stimulate
economic development by reducing competition, leveraging resources and attracting new investment. The
City is also discussing the implementation of a new Cultural Plan to help attract more Canadian and
international tourists (Law, 2015). While the importance of bi-national strategies related to economic
development, transportation infrastructure and tourism have been outlined at the local and regional level,
there have been few, if any strategies created from the numerous steering committees and task forces
created to examine this issue.
State Government Interventions and Policies – Niagara Falls, NY
The management of parklands adjacent to the falls in the late 1880s was among the earliest state
government interventions in Niagara Falls, NY. Influenced by Frederick Law Olmstead’s vision of the
falls as a naturalised area, New York created a series of state parks along the Niagara Gorge. While well
intentioned, this strategy would prove problematic in the twentieth century. Under the management of the
New York Office of Parks, Recreation and Historic Preservation, the parks in Niagara Falls, NY were
chronically underfunded as they competed with 37 other facilities in western New York. As a result, the
lack of upkeep and long-range planning contributed to their poor image, particularly in comparison to the
facilities in Canada across the gorge. The absence of local input also left Niagara Falls, NY without
recourse when State departments undertook activities that were harmful to the parks and the city itself.

10
Among the most deleterious was the construction of the Robert Moses Parkway in the 1960s, which
diverted visitors out of the central business district and separated the city from the state parks and gorge.
State activities also had a negative effect on the City’s financial health. The decision to replace
private hydroelectric companies with one tax-exempt facility in the 1960s depleted the City’s annual tax
revenues. More recently, a dispute between the State and the Seneca Nation resulted in the City collecting
no revenue from the new Seneca Nation casino between 2009 and 2013 and nearly drove the City to
bankruptcy (Klopott and Chappatta, 2013).
Nevertheless, Niagara Falls, NY is beginning to receive more positive support from the State. In
2001, the State created the USA Niagara Development Corporation to facilitate the redevelopment of the
historic downtown area through incremental projects such as the renovation of historic buildings and
streetscape improvements. The improved relationship between both governments has also led to the
removal of a portion of the Robert Moses Parkway, the redevelopment of the Rainbow Centre Mall and
improvements to the Niagara Falls State Park. In 2007, the New York State Power Authority entered into
a revenue sharing agreement that has helped ease some of the City’s financial problems.
Provincial Government Interventions and Policies – Niagara Falls, ON
In 1885, the Province of Ontario established the Niagara Parks Commission to manage the area
around the falls and gorge. The arm’s-length, self-financed corporation implemented long-range tourism
and land use strategies and has been aggressive in creating new, and renovating existing, attractions
(Healy, 2006). Local representation on the Commission’s board has also helped ensure strategic
coordination with local municipalities.
Provincial policies and decisions, such as the amalgamation of Niagara Falls with adjacent
municipalities, the legalisation of gambling and the construction of two casinos have led to a significant

11
increase in population and employment. Furthermore, the Province’s Places to Grow Act in 2005 forced
the City to implement progressive planning strategies in its Official Plan and zoning by-laws. This
included the creation of growth boundaries and the requirement that 40% of all future growth occur in the
existing built environment.
However, some actions by the provincial government have negatively impacted the city. The
replacement of distance-based electricity rates with a flat rate in the 1960s negated an important
comparative advantage held over other areas (Regional Municipality of Niagara, 1970). Recently, Niagara
Falls’ casinos have faced increased competition due to the construction of similar facilities near Toronto.
It is important to note that the difference in policy between the two cities reflects their respective
institutional frameworks. The greater oversight and influence of the provincial government is a result of
a number of factors, including the historical development of municipal-provincial/state government
relations and legislation, as well as cultural differences between the two nations. The emphasis on
individualism and orientation to market forces makes centralised planning and management more difficult
in the United States (Goldberg and Mercer, 1986; Rothblatt, 1994). Taylor (2014) postulates that the
historic tendency of the Canadian government to distance itself from municipal affairs and give greater
powers to the provinces explains the differences in state/provincial interventions between the two regions.
Shrinkage Perceptions and Strategies
The community perception of shrinkage plays a significant role in the development of planning
and economic strategies. Using the framework designed by Pallagst et al. (2016) (Figure 4), we examine
the correlation between shrinkage perception and strategy in Niagara Falls, NY and Niagara Falls, ON.

12
The framework is a blend of two existing typologies: Farke’s (2005) phases of perceptions of
shrinkage, and the classification of shrinkage strategies by Danielzyk et al. (2002). Farke differentiates
four phases of perception: (1) the ‘phase of ignoring’, where decline is considered temporary and
transitional, (2) ‘observation without acceptance’, where the phenomenon is acknowledged but is not
accepted, (3) ‘certain acceptance with or without limited public communication’, where public decision-
makers speculate on how to manage decline, and (4) ‘acceptance’, where traditional growth strategies are
no longer pursued.
Figure 4: Response strategies based on perception of shrinkage (Pallagst et al., 2016)
The first phase of the four-part classification of shrinkage strategies by Danielzyk et al. (2002),
‘decline as a vicious circle’, is considered passive in that the city does not introduce interventions but
rather relies on higher-level government support. In contrast, the other three strategy types actively initiate

13
policy to guide or influence the shrinkage process. The goal of the second strategy type, ‘expansive
strategy’, is to retain population while expanding residential areas. The third, ‘maintenance strategy’, is
characterised by the development of existing land to maintain attractiveness and spatial structure. The
final strategy type, ‘planning for decline’, aims to adapt and reduce infrastructure while developing the
unique qualities of the urban area.
Niagara Falls, NY
City officials viewed the exodus of manufacturing employment in the 1950s as temporary and used
traditional economic development and planning strategies to attract industrial capital to the city. While
some expansive strategies were used to retain residents, the city’s approach was predominantly passive
and can be categorised as ‘decline as a vicious circle’. By the 1960s it became apparent to city residents
and leaders that action was needed and the city entered a five decade-long ‘observation without
acceptance’ stage. In 1963 Mayor Lackey was elected and promised to bring back growth through
extensive urban renewal programmes and industrial expansion – re-establishing the city as a tourism and
industry capital (Dumych, 1998). By the end of Lackey’s tenure in 1975, these strategies had not only
failed to stem the city’s decline but had actually exacerbated it. Refusing to accept their economic and
demographic realities, the City embarked on a number of costly and unrealistic renewal projects. The City
also incorporated a passive expansion approach during this period, regularly petitioning the New York
State government to legalise gambling from the 1980s until the mid-2000s. City officials believed a casino
would quickly revitalise Niagara Falls.
Recently local officials have shifted their perception and have begun to accept that growth is not
likely to occur as it once did. The City’s 2009 Official Plan notes that its policies can ‘never produce the
same level of economic impact it did in the 1950s’ (City of Niagara Falls, 2009, p. 6) and accordingly

14
seeks to make incremental changes to improve its existing built environment and attract new economic
development to the city. The 2009 Official Plan highlights several maintenance strategies, including the
enhancement of the City’s cultural amenities, developing nature-oriented tourist activities, and actively
collaborating with adjacent municipalities and higher-level governments.
Niagara Falls, ON
The population of Niagara Falls, ON declined in the 1950s but has grown slowly ever since.
However, within the Canadian context of strong urban growth, research has shown that slow growth and
shrinking communities face many of the same challenges and stigmas (Hall, 2009). City officials in
Niagara Falls, ON ignored the population decline in the 1950s. From the 1960s until the mid-2000s they
observed its slow growth but did not accept or acknowledge its permanence. The rationale throughout was
to be flexible enough to accommodate ‘maximum growth’ (City of Niagara Falls, 1966; Regional
Municipality of Niagara, 1970). During the 1960s and 1970s the City and regional government employed
expansive strategies that involved the use of unrealistic population projections and actively planned for
new residential and industrial activities in greenfield areas.
As slow growth continued throughout the late 1970s and 1980s, the City continued using expansive
strategies but also began employing a greater number of maintenance strategies. City officials attempted
to retain residents by generating new commercial and residential developments while trying to revitalise
a number of blighted areas. City leaders failed to realise that revitalisation was not fiscally feasible without
diverting peripheral development funds into existing areas.
Only recently has there been acceptance of the city’s perennial slow growth. The change in
perception was the result of the 2007–2009 recession, which forced Niagara Falls and other municipal
leaders in the region to confront the economic realities impacting their communities. As a result, the City

15
is now planning for prolonged slow growth and has engaged in several regional partnerships in order to
optimise resources and minimise competition.
Discussion and Conclusion
Despite diverging population trajectories, the progression of perceptions of and strategies to cope
with shrinkage and slow growth over the past six decades in the twin cities of Niagara Falls have been
very similar (Figure 5). Both cities ignored the decline of the 1950s but by the 1960s actively undertook
expansive strategies to combat decline. For the next three decades both cities observed, but failed to
accept, their respective population trends and continued with expansive strategies. Niagara Falls, ON was
first to incorporate maintenance strategies; however, Niagara Falls, NY followed suit soon after.
Figure 4: Progression of perceptions of and strategies to cope with shrinkage and slow growth in Niagara Falls, ON and
Niagara Falls, NY

16
The similarity of perceptions and response strategies in the two cities reinforces the importance of
higher-level government intervention and policy. The city governments’ viewed and reacted to
comparable circumstances in much the same way, but experienced dissimilar outcomes. Niagara Falls,
ON benefitted greatly from the Province’s creation of the Parks Commission and development of casinos.
The trajectory of these two cities also demonstrates the increased vulnerability of industrial cities to global
shifts. The use of incremental planning strategies by Niagara Falls, ON allowed them to react more swiftly
to external changes, while being less susceptible to major losses.
Although the cities are still diverging demographically, their planning and development strategies
have become quite similar. A concentration on the downtown core – limiting deterioration, improving its
image and assets, encouraging internal investment – and a focus on the development of cultural and nature-
based tourist attractions have generated positive results for both sides of the falls. By concentrating on
developing their respective cultural assets (such as the Rainbow Centre’s redevelopment into a culinary
institute and the Niagara wine region), both cities hope to attract more tourists, more diverse investment
and younger populations to the Niagara Falls area.

17
References
CITY OF NIAGARA FALLS, ONTARIO (1966), Official Plans Office Consolidation, Niagara Falls,
ON, Planning Department.
CITY OF NIAGARA FALLS (2009), Comprehensive Plan for the City of Niagara Falls, New York,
Niagara Falls, NY, City of Niagara Falls.
DANIELZYK, R., MIELKE, B. and ZIMMER-HEGMANN, R. (2002), Demographische entwicklung –
schrumpfende stadt, Dortmund, Institut für Landes- und Stadtentwicklungsforschung des Landes
NordrheinWestfalen.
DUMYCH, D. (1998), Niagara Falls, Volume II, Mount Pleasant, SC, Arcadia Publishing.
FARKE, A. (2005), ‘Salzgitter will und wird nicht schrumpfen’, in C. Hannemann, S. Kabiasch and C.
Weiske (eds), Kommunikative Steuerung des Stadtumbaus. Interessensgegensätze, Koalitionen und
Entscheidungsstrukturen in schrumpfenden Städten, Wiesbaden,VS Verlag für
Sozialwissenschaften, 185-205.
FINK, J. (2009), ‘Building boom goes on in N.F., Ont.’, Buffalo Business First, 12 January,
http://www.bizjournals.com/buffalo/stories/2009/01/12/story6.html.
GSP GROUP (2004), Downtown Niagara Falls Community Improvement Plan, The City of Niagara
Falls, Canada.
GOLDBERG, G. and MERCER, J. (1986), The Myth of the North American City: Continentalism
Challenged, Vancouver, UBC Press.
HALL, H. (2009), ‘Slow growth and decline in Greater Sudbury: Challenges, opportunities, and
foundations for a new planning agenda’, Canadian Journal of Urban Research, 18, 1-26.
HEALY, R. (2006), ‘The commons problems and Canada’s Niagara Falls’, Annals of Tourist Research,
33, 525-44.

18
HOLLANDER, J. (2011), Sunburnt Cities, New York, Routledge.
IBI GROUP (1987), Executive Summary: City of Niagara Falls Commercial/Office Opportunities Study,
The City of Niagara Falls, Canada
JAYAWARDENA, C. (2008), ‘Tourism in Niagara: Identifying challenges and finding solutions’,
International Journal of Contemporary Hospitality Management, 20, 248-57.
KLOPOTT, F. and CHAPATTA, B. (2013), ‘Niagara Falls near junk as casino spat drains cash’,
Bloomberg, 2 June, http://www.bloomberg.com/news/articles/2013-06-03/niagara-falls-near-junk-
as-casino-spat-drains-cash.
LAW, J. (2015), ‘Niagara Falls Council to study city’s culture’, Niagara Falls Review. 14 September,
http://www.niagarafallsreview.ca/2015/09/14/niagara-falls-council-to-study-citys-culture.
MACLAURIN, D. and WOLSTENHOLME, S. (2008), ‘An analysis of the gaming industry in the
Niagara region’, International Journal of Contemporary Hospitality Management, 20, 320-31.
MAH, A. (2012), Industrial Ruination, Community and Place: Landscapes and Legacies of Urban
Decline, Toronto, University of Toronto Press.
NATIONAL CENTER FOR HEALTH STATISTICS (2012), US Birth Rates, Vital Statistics of the
United States: Natality.
PALLAGST, K., FLESCHURZ, R. and SAID, S. (2016), ‘Right Sizing the Shrinking City: Tales from
Two German Cases’, Industrial Heritage, 2, 54-60.
REGIONAL MUNICIPALITY OF NIAGARA (1970), Economic Base Research and Analysis, St
Catherines, ON.
ROTHBLATT, D. (1994), ‘North American Metropolitan Planning: Canadian and US
Perspectives’, Journal of the American Planning Association, 60, 501-20.
STATISTICS CANADA (2013), CANSIM, Ottawa.

19
STRAND, G. (2009), Inventing Niagara: Beauty, Power and Lies, New York City, Simon & Schuster.
TAYLOR, Z. (2014), ‘If different, then why?: Explaining the divergent political development of
Canadian and American local governance’, International Journal of Canadian Studies, 49, 53-79.
US BUREAU OF LABOR STATISTICS (2013), Unemployment, LAUCN36063000000003-6,
Washington.
US CENSUS BUREAU (2013), Annual Estimates of Population, Washington.
VAN DE KAA, D. J. (2002), ‘The idea of a second demographic transition in industrialized countries’,
Sixth Welfare Policy Seminar of the National Institute of Population and Social Security, 29
January, Tokyo, 1-34.