this funding impact statement sets out the sources of
TRANSCRIPT

CCC Draft Long Term Plan 2021-2031 1
Funding Impact Statement
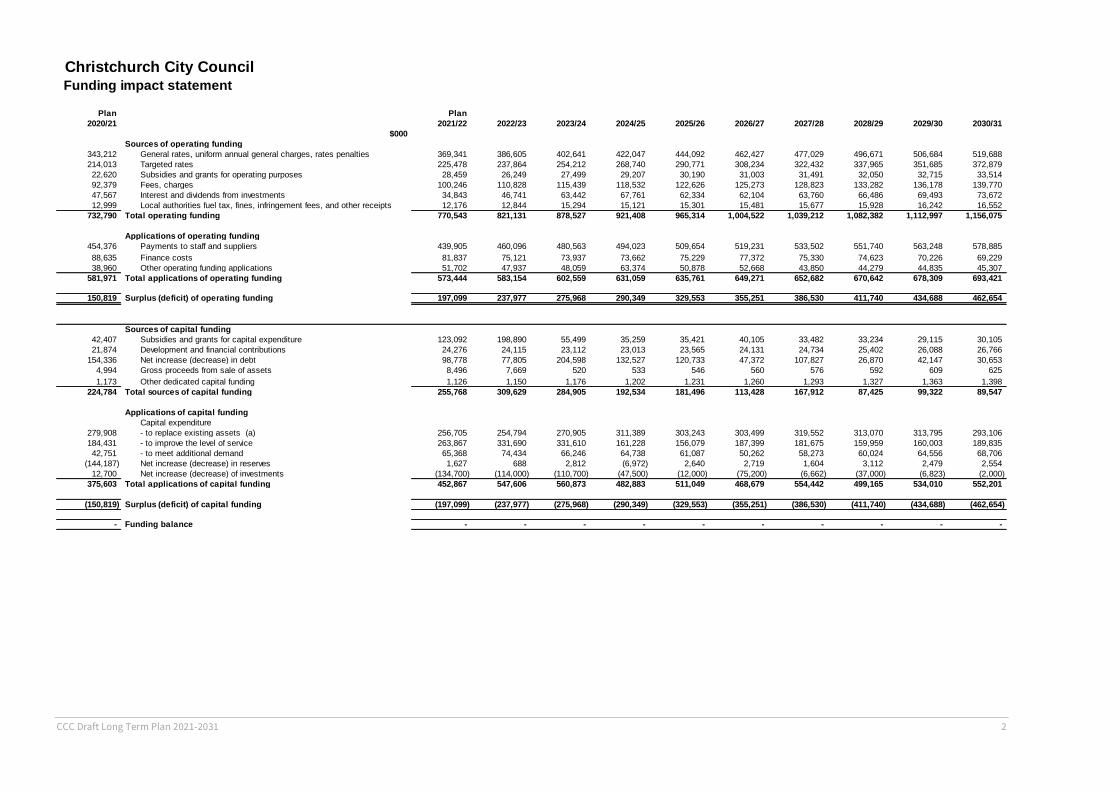
This Funding Impact Statement sets out the sources of operational and capital funding Council will use to fund its
activities over the period of the Draft Long Term Plan (LTP), and how these funds will be applied. These funding sources
were developed from an analysis of the Council activities and funding requirements which is set out in the Revenue and
Financing Policy.
CCC Draft Long Term Plan 2021-2031 2
Christchurch City CouncilFunding impact statement
Plan Plan
2020/21 2021/22 2022/23 2023/24 2024/25 2025/26 2026/27 2027/28 2028/29 2029/30 2030/31
$000
Sources of operating funding
343,212 General rates, uniform annual general charges, rates penalties 369,341 386,605 402,641 422,047 444,092 462,427 477,029 496,671 506,684 519,688
214,013 Targeted rates 225,478 237,864 254,212 268,740 290,771 308,234 322,432 337,965 351,685 372,879
22,620 Subsidies and grants for operating purposes 28,459 26,249 27,499 29,207 30,190 31,003 31,491 32,050 32,715 33,514
92,379 Fees, charges 100,246 110,828 115,439 118,532 122,626 125,273 128,823 133,282 136,178 139,770
47,567 Interest and dividends from investments 34,843 46,741 63,442 67,761 62,334 62,104 63,760 66,486 69,493 73,672
12,999 Local authorities fuel tax, fines, infringement fees, and other receipts 12,176 12,844 15,294 15,121 15,301 15,481 15,677 15,928 16,242 16,552
732,790 Total operating funding 770,543 821,131 878,527 921,408 965,314 1,004,522 1,039,212 1,082,382 1,112,997 1,156,075
Applications of operating funding
454,376 Payments to staff and suppliers 439,905 460,096 480,563 494,023 509,654 519,231 533,502 551,740 563,248 578,885
88,635 Finance costs 81,837 75,121 73,937 73,662 75,229 77,372 75,330 74,623 70,226 69,229
38,960 Other operating funding applications 51,702 47,937 48,059 63,374 50,878 52,668 43,850 44,279 44,835 45,307
581,971 Total applications of operating funding 573,444 583,154 602,559 631,059 635,761 649,271 652,682 670,642 678,309 693,421
150,819 Surplus (deficit) of operating funding 197,099 237,977 275,968 290,349 329,553 355,251 386,530 411,740 434,688 462,654
Sources of capital funding
42,407 Subsidies and grants for capital expenditure 123,092 198,890 55,499 35,259 35,421 40,105 33,482 33,234 29,115 30,105
21,874 Development and financial contributions 24,276 24,115 23,112 23,013 23,565 24,131 24,734 25,402 26,088 26,766
154,336 Net increase (decrease) in debt 98,778 77,805 204,598 132,527 120,733 47,372 107,827 26,870 42,147 30,653
4,994 Gross proceeds from sale of assets 8,496 7,669 520 533 546 560 576 592 609 625
1,173 Other dedicated capital funding 1,126 1,150 1,176 1,202 1,231 1,260 1,293 1,327 1,363 1,398
224,784 Total sources of capital funding 255,768 309,629 284,905 192,534 181,496 113,428 167,912 87,425 99,322 89,547
Applications of capital funding
Capital expenditure
279,908 - to replace existing assets (a) 256,705 254,794 270,905 311,389 303,243 303,499 319,552 313,070 313,795 293,106
184,431 - to improve the level of service 263,867 331,690 331,610 161,228 156,079 187,399 181,675 159,959 160,003 189,835
42,751 - to meet additional demand 65,368 74,434 66,246 64,738 61,087 50,262 58,273 60,024 64,556 68,706
(144,187) Net increase (decrease) in reserves 1,627 688 2,812 (6,972) 2,640 2,719 1,604 3,112 2,479 2,554
12,700 Net increase (decrease) of investments (134,700) (114,000) (110,700) (47,500) (12,000) (75,200) (6,662) (37,000) (6,823) (2,000)
375,603 Total applications of capital funding 452,867 547,606 560,873 482,883 511,049 468,679 554,442 499,165 534,010 552,201
(150,819) Surplus (deficit) of capital funding (197,099) (237,977) (275,968) (290,349) (329,553) (355,251) (386,530) (411,740) (434,688) (462,654)
- Funding balance - - - - - - - - - -
CCC Draft Long Term Plan 2021-2031 3
Where our funding will come from
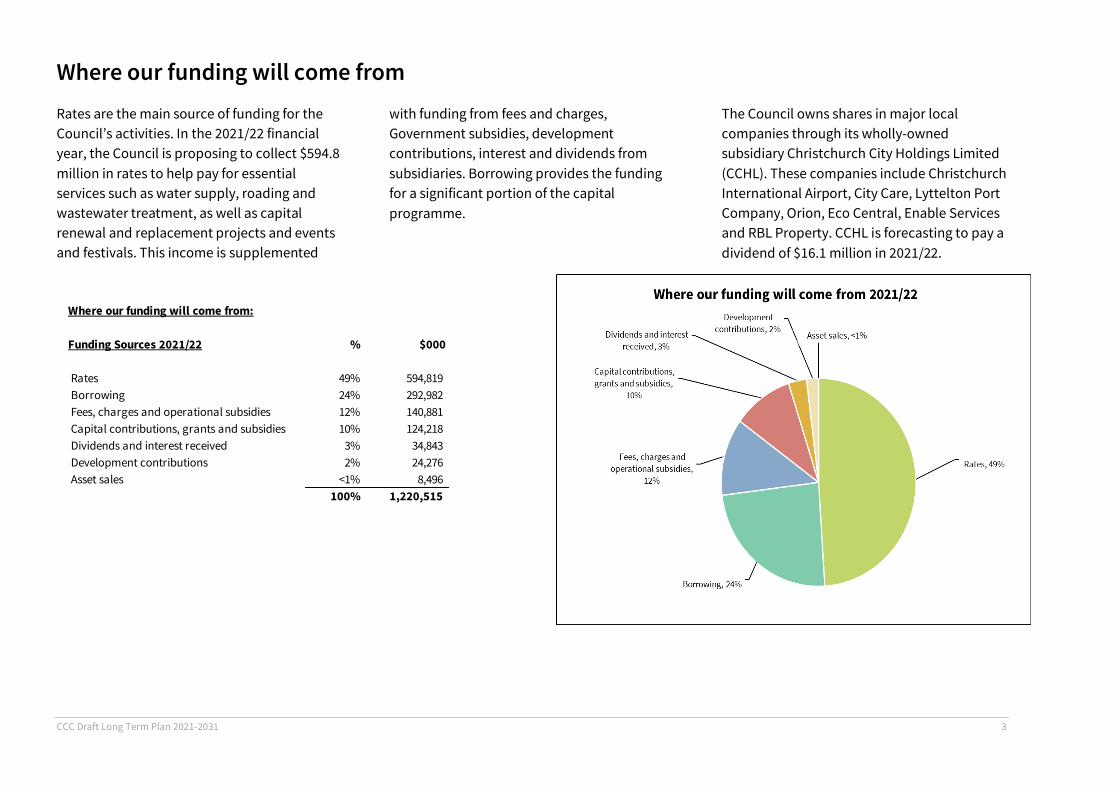
Rates are the main source of funding for the
Council’s activities. In the 2021/22 financial
year, the Council is proposing to collect $594.8
million in rates to help pay for essential
services such as water supply, roading and
wastewater treatment, as well as capital
renewal and replacement projects and events
and festivals. This income is supplemented
with funding from fees and charges,
Government subsidies, development
contributions, interest and dividends from
subsidiaries. Borrowing provides the funding
for a significant portion of the capital
programme.
The Council owns shares in major local
companies through its wholly-owned
subsidiary Christchurch City Holdings Limited
(CCHL). These companies include Christchurch
International Airport, City Care, Lyttelton Port
Company, Orion, Eco Central, Enable Services
and RBL Property. CCHL is forecasting to pay a
dividend of $16.1 million in 2021/22.
Where our funding will come from:
Funding Sources 2021/22 % $000
Rates 49% 594,819
Borrowing 24% 292,982
Fees, charges and operational subsidies 12% 140,881
Capital contributions, grants and subsidies 10% 124,218
Dividends and interest received 3% 34,843
Development contributions 2% 24,276
Asset sales <1% 8,496
100% 1,220,515

CCC Draft Long Term Plan 2021-2031 4
Where our funding will go
Much of the Council’s spending goes toward
providing essential services to keep the city
running smoothly. This includes maintaining
sewerage and drainage systems, water supply,
our roads and parks.
The table and graph below show where the
Council will spend the funding collected
during 2021/22. These include both day to day
operational expenditure and capital
expenditure.
The Other classification includes $61.4 million
of interest costs either externally recovered or
not allocated to Groups of Activities. Capital
expenditure for the Canterbury Multi Use
Arena, IT projects, and Performing Arts
Precinct are also included.
Where our funding will go
Planned Spend 2021/22 % $000
Three Waters 24% 298,737
Transportation 18% 212,398
Communities and Citizens:
- Recreation and Sport 8% 98,512
- Libraries 4% 46,309
- Communities and Citizens - other 2% 26,944
- Art Gallery / Museums 2% 19,763
Other 11% 137,868
Parks, Heritage & Coastal Environment 7% 85,744
Solid Waste & Resource Recovery 6% 74,869
Debt repayment 5% 59,504
Regulatory & Compliance 4% 43,576
Strategic Planning & Policy 4% 42,991
2020/21 capital carry forwards 3% 40,000
Governance 1% 16,131
Housing 1% 15,542
Transfer to Reserves <1% 1,627
100% 1,220,515

CCC Draft Long Term Plan 2021-2031 1
Rating Information
Income from Rates
We use rates to fund the balance of our costs
once all other funding sources are taken into
account.
The total rates required to be assessed for the
rating year beginning on 1 July 2021 is $586.1
million (excluding GST). Two items of rating
income are excluded from this figure, and
from the specific rates details provided on the
following pages:
Excess water rates – excluded because it is
dependent on actual volumes consumed
during the year. Excess water rates are
budgeted to be $6.2 million (excluding
GST) in 2021/22.
Late payment penalties and arrears
penalties – excluded because they are
dependent on actual late rates payments
occurring during the year, or arrears from
previous years remaining outstanding
during the year. Late payment penalties
and arrears penalties are budgeted to be
$2.6 million in 2021/22.
Income Collected from Rates (incl GST)
Rating Base
The rates assessed for the 1 July 2021 to 30
June 2022 year are based on the following
rating base:
As at 30
June 2021
Number of rating units 177,146
Number of Separately-Used
or Inhabited Parts (SUIPs) of
rating units
182,355
Total capital value of rating
units
$116.4
billion
Total land value of those
rating units
$50.6
billion
Valuation system used for rating
We set rates under Section 23 of the Local
Government (Rating) Act 2002.
Some of our rates are in the form of fixed
charges, but most are charged in proportion to
each rating unit’s rating valuation, where:
Rates Collected
2021/22
LTP
($000s)
General Rates:
Value-based General Rate 396,641
Uniform Annual General Charge 25,165
Targeted Rates:
Water Supply:
-- Normal Supply 74,921
-- Restricted Supply 172
-- Excess Supply 1 -
-- Fire Service Connection 132
Land Drainage 43,617
Sewerage 94,245
Waste Minimisation 33,472
Active Travel 3,649
Heritage 86
Special Heritage (Arts Centre) 230
Special Heritage (Cathedral) 1,190
Akaroa Health Centre 327
Central City Business Association 173
674,020
includes GST of 87,916
Total Excluding GST 586,1041 Excess Water depends on actual volumes consumed

CCC Draft Long Term Plan 2021-2031 2
A rating unit is the property which is liable
for rates (usually a separate property with
its own certificate of title), and
Rating valuations are set by independent
valuers, based on property market
conditions as at a specified date (currently
1 August 2019) – their purpose is to enable
councils to allocate rates equitably
between properties across the District;
they are not intended to be an indication
of current market value or cost of
construction.
We use capital value for rating purposes
(commonly thought of as the value of the land
plus any improvements).
Where parts of a rating unit can be allocated to
different categories (Standard, Business and
Remote Rural), we may apportion the rateable
value of that rating unit among those parts in
order to calculate the overall liability for the
rating unit.
Legislation requires that rating valuations be
updated at least every three years, so that the
distribution of value-based rates reasonably
reflects property market conditions. The 2019
valuations are used as the basis of rates
calculations from 1 July 2020 until 30 June
2023.
Valuation adjustments during the
rating year
Rating valuations must be adjusted whenever
there is a significant change to the property
(such as new building work or demolition),
but:
These adjustments must still be based on
2019 market prices, to maintain
consistency across the tax base; and
Rates charges cannot be changed to
reflect the adjusted valuation until the
next rating year (i.e. from 1 July)
Inspection of rates information
For every rating unit, information from the
District Valuation Roll and Rating Information
Database (including Capital Value and liability
for current-year rates) is available for
inspection on the Council’s Internet site
(www.ccc.govt.nz, under the heading
‘Services’, then ‘Rates and valuations’ then
‘Rates and valuation search’) or by enquiry at
any Council Service Centre.
Rates for 2021/22
All of the rates and amounts set out in this
document are proposed to apply to the rating
year commencing 1 July 2021 and ending 30
June 2022, and include GST of 15 percent.
Some of our rates are set as a uniform amount
per Separately Used or Inhabited Part of a
rating unit (SUIP). In such cases, a SUIP is
defined as a part which can be separately let
and permanently occupied. Where the
occupancy is an accessory to, or is ancillary to,
another property or part thereof, then no
separately used part exists. For example:
not separately used parts of a rating unit
include:
o a residential sleep-out or granny flat
without independent kitchen facilities;
o rooms in a hostel with a common
kitchen;
o a hotel room with or without kitchen
facilities;
o motel rooms with or without kitchen
facilities;
o individual storage garages/sheds/
partitioned areas of a warehouse;
o individual offices/premises of partners
in a partnership.
separately used parts of a rating unit
include:
o flats/apartments;
CCC Draft Long Term Plan 2021-2031 3
o flats which share kitchen/bathroom
facilities;
o separately leased commercial areas
even though they may share a
reception.
General rates
General rates are collected in the form of both
a value-based General Rate and a Uniform
Annual General Charge (UAGC). The value-
based General Rate is set on capital values on
a differential basis under the Local
Government (Rating) Act 2002.
Purpose of general rates:
General rates, including the UAGC, provide the
majority of our total rates requirement, and
are calculated as the net rate requirement
after targeted rates are determined. General
rates (including the UAGC) therefore fund all
our activities except to the extent they are
funded by targeted rates or by other sources
of funding.
Value-based General Rate Differentials
Differentials are applied to the value-based
General Rate. The objective of these
differentials is to collect more from identified
Business properties and less from identified
Remote Rural properties than would be the
case under an un-differentiated value-based
General Rate, in accordance with our Revenue
& Financing Policy.
The differential categories are defined as
follows:
Standard
Any rating unit which is:
(a) used for residential purposes (including
home-ownership flats); or
(b) a Council-operated utility network; or
(c) land not otherwise classified as Business
or Remote Rural.
Business
Any rating unit which is:
(a) used for a commercial or industrial
purpose (including travellers and special
purpose accommodation, offices and
administrative and associated functions,
commercially-owned and operated utility
networks, and quarrying operations); or
(b) land zoned Commercial or Industrial in the
District Plan, situated anywhere in the
district, except where the principal use is
residential.
Remote Rural
Any rating unit which is:
(a) zoned residential or rural in the District
Plan, and
(b) either
i. greater than 20 hectares in size; or
ii. situated outside the serviced area
defined for the Sewerage Targeted
rate (below), and
(c) either:
i. used solely or principally for
agricultural, horticultural, pastoral, or
forestry purposes or the keeping of
bees or poultry; or
ii. vacant land not otherwise used.
For the purpose of clarity the Remote Rural
category does not include any rating unit
which is:
(a) used principally for industrial (including
quarrying) or commercial purposes (as
defined in Business above); or
(b) used principally for residential purposes
(including home-ownership flats).
For the purpose of these differential sector
definitions, the District Plan means our
operative District Plan.
CCC Draft Long Term Plan 2021-2031 4
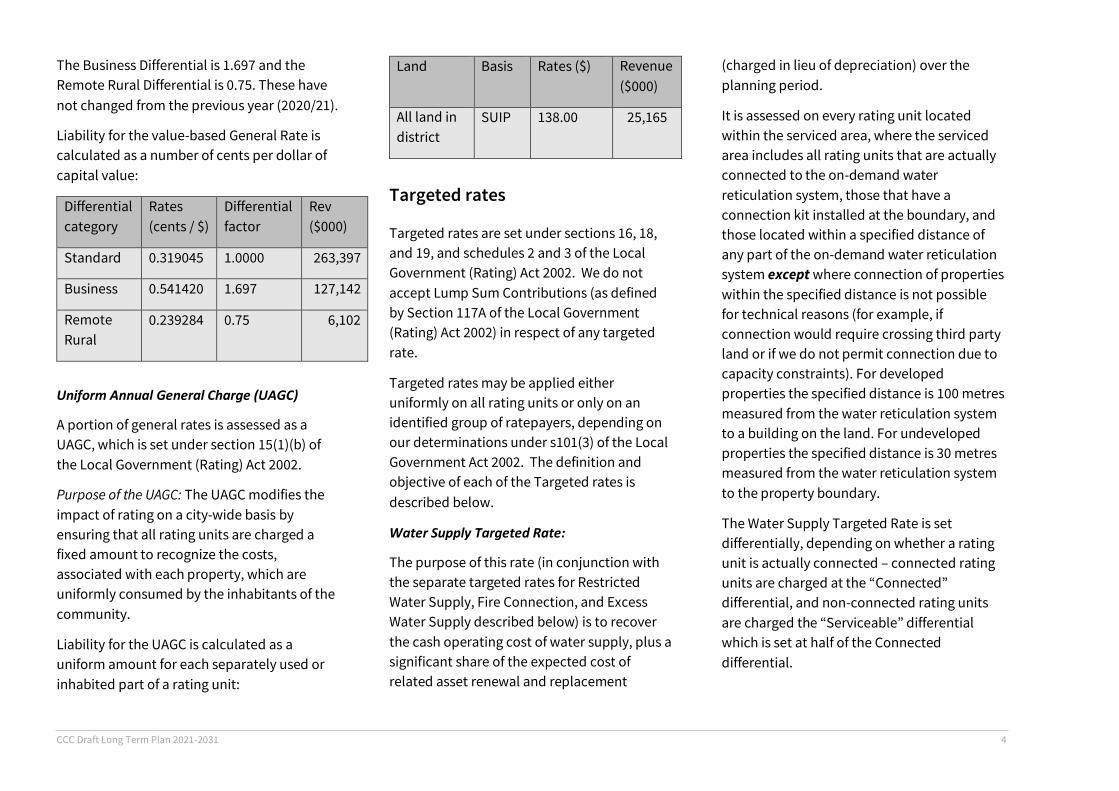
The Business Differential is 1.697 and the
Remote Rural Differential is 0.75. These have
not changed from the previous year (2020/21).
Liability for the value-based General Rate is
calculated as a number of cents per dollar of
capital value:
Differential
category
Rates
(cents / $)
Differential
factor
Rev
($000)
Standard 0.319045 1.0000 263,397
Business 0.541420 1.697 127,142
Remote
Rural
0.239284 0.75 6,102
Uniform Annual General Charge (UAGC)
A portion of general rates is assessed as a
UAGC, which is set under section 15(1)(b) of
the Local Government (Rating) Act 2002.
Purpose of the UAGC: The UAGC modifies the
impact of rating on a city-wide basis by
ensuring that all rating units are charged a
fixed amount to recognize the costs,
associated with each property, which are
uniformly consumed by the inhabitants of the
community.
Liability for the UAGC is calculated as a
uniform amount for each separately used or
inhabited part of a rating unit:
Land Basis Rates ($) Revenue
($000)
All land in
district
SUIP 138.00 25,165
Targeted rates
Targeted rates are set under sections 16, 18,
and 19, and schedules 2 and 3 of the Local
Government (Rating) Act 2002. We do not
accept Lump Sum Contributions (as defined
by Section 117A of the Local Government
(Rating) Act 2002) in respect of any targeted
rate.
Targeted rates may be applied either
uniformly on all rating units or only on an
identified group of ratepayers, depending on
our determinations under s101(3) of the Local
Government Act 2002. The definition and
objective of each of the Targeted rates is
described below.
Water Supply Targeted Rate:
The purpose of this rate (in conjunction with
the separate targeted rates for Restricted
Water Supply, Fire Connection, and Excess
Water Supply described below) is to recover
the cash operating cost of water supply, plus a
significant share of the expected cost of
related asset renewal and replacement
(charged in lieu of depreciation) over the
planning period.
It is assessed on every rating unit located
within the serviced area, where the serviced
area includes all rating units that are actually
connected to the on-demand water
reticulation system, those that have a
connection kit installed at the boundary, and
those located within a specified distance of
any part of the on-demand water reticulation
system except where connection of properties
within the specified distance is not possible
for technical reasons (for example, if
connection would require crossing third party
land or if we do not permit connection due to
capacity constraints). For developed
properties the specified distance is 100 metres
measured from the water reticulation system
to a building on the land. For undeveloped
properties the specified distance is 30 metres
measured from the water reticulation system
to the property boundary.
The Water Supply Targeted Rate is set
differentially, depending on whether a rating
unit is actually connected – connected rating
units are charged at the “Connected”
differential, and non-connected rating units
are charged the “Serviceable” differential
which is set at half of the Connected
differential.

CCC Draft Long Term Plan 2021-2031 5
Liability for the Water Supply Targeted Rate is
calculated as a number of cents per dollar of
capital value.
Categories Rates
(cents / $)
Different-
ial Factor
Rev
($000)
Connected 0.069575 1.00 74,114
Serviceable 0.034788 0.50 807
Restricted Water Supply Targeted Rate:
The purpose of this rate is to contribute to the
cost recovery of the activities described as
being funded by the Water Supply Targeted
Rate (above), by charging a uniform amount to
properties not located within the Water
Supply Targeted Rate serviced area but
receiving a restricted water supply. It is
assessed on every rating unit receiving the
standard level of restricted service (being
1,000 litres of water supplied per 24-hour
period). Where a rating unit receives multiple
levels of service, they will be assessed multiple
Restricted Water Supply Targeted Rates.
Liability for the Restricted Water Supply
Targeted Rate is calculated as a uniform
amount for each standard level of service
received by a rating unit.
Categories Rates ($) Revenue
($000)
Connected 236.78 172
Water Supply Fire Connection Rate
The purpose of the Water Supply Fire
Connection Rate is to contribute to the cost
recovery of the activities described as being
funded by the Water Supply Targeted Rate
(above), by charging a uniform amount to
properties benefitting from a fire service
connection. It is assessed on all rating units
connected to the service on a per-connection
basis.
Liability for the Water Supply Fire Connection
Rate is calculated as a uniform amount for
each connection:
Categories Rates ($) Revenue
($000)
Connected 122.27 132
Excess Water Supply Commercial Targeted Rate
The purpose of this targeted rate is for
commercial properties that place an unusually
high demand on the water supply system to
contribute an additional amount to the cost
recovery of the activities described as being
funded by the Water Supply Targeted Rate
(above).
It is set under section 19 of the Local
Government (Rating) Act 2002 and assessed as
the water meters are read on every liable
rating unit (see below), with invoices sent after
each reading.
Liability for the Excess Water Supply
Commercial Targeted Rate is calculated as a
number of cents per cubic metre of water
consumed in excess of the water supply
targeted rate allowance for that rating unit:
Categories Rates ($ per m3 of
excess water
supplied)
Revenue
($000)
Liable 1.16 4,786
This rate will be charged to all rating units
which receive a commercial water supply as
defined in the Water Supply, Wastewater and
Stormwater Bylaw 2014, plus:
(a) land under single ownership on a single
certificate of title and used for three or
more household residential units
(b) boarding houses
(c) motels
(d) rest homes

CCC Draft Long Term Plan 2021-2031 6
Each liable rating unit has a water supply
targeted rate allowance. Water used in excess
of this allowance will be charged at the stated
rate per cubic metre.
The water supply targeted rate allowance for
each property is effectively the amount of
water already paid for under the Water Supply
Targeted Rate – i.e. the total Water Supply
Targeted Rate payable, divided by the above
cubic-metre cost, then divided by 365 to give a
daily cubic metre allowance. The Excess Water
Supply Targeted Rate will be charged if actual
use exceeds this calculated daily allowance,
provided that all properties will be entitled to
a minimum allowance of 0.6986 cubic metres
per day.
For example, if a rating unit is assessed $1,000
for the Water Supply Targeted Rate, that rating
unit's water supply targeted rate allowance for
the year is 862 cubic metres ($1,000 divided by
$1.16/m3), which is 2.36 cubic metres per day.
If the meter readings are 91 days apart then
the allowance is 215 cubic metres for that
billing period (2.36 m3/day x 91 days). Liability
for the Excess Water Supply Commercial
Targeted Rate for that billing period is for any
consumption by that rating unit over 215 cubic
metres. So if 300 cubic metres were used in
that billing period, the liability for the Excess
Water Supply Commercial Targeted Rate for
that billing period would be $98.68 incl GST,
which is the excess usage of 85 cubic metres
(300m3 – 215m3) times the rate of $1.16/m3.
The annual rates assessment identifies those
ratepayers who are potentially liable for the
Excess Water Supply Commercial Targeted
Rate. It does not include the calculated
liability as the water reading does not coincide
with the assessment. Water meters are read
progressively throughout the year. Following
each reading, a water-excess charge invoice is
issued for those rating units which are liable.
The invoice will refer to the assessment and
will bill for the consumption for the period of
the reading.
The latest water supply targeted rate
allowance will be used, calculated on a daily
basis.
Excess Water Supply Residential Targeted Rate
This targeted rate also contributes to the cost
recovery of the activities described as being
funded by the Water Supply Targeted Rate
(above), by assessing additional charges on
those residential properties placing an
unusually high demand on the water supply
system.
It is set under section 19 of the Local
Government (Rating) Act 2002 and assessed as
the water meters are read on every liable
rating unit (see below), with invoices sent after
each reading.
Liability for the Excess Water Supply
Residential Targeted Rate is calculated as a
number of cents per cubic metre of water used
in excess of an allowance of 0.7 cubic metres
per day.
Categories Rates ($ per m3 of
excess water
supplied)
Revenue
($000)
Liable 1.35 2,300
This rate will be charged to all metered
residential rating units where the meter
records usage for a single separately used or
inhabited part (SUIP) of the rating unit.
The annual rates assessment identifies those
ratepayers who are potentially liable for the
Excess Water Supply Residential Targeted
Rate. It does not include the calculated
liability as the water reading does not coincide
with the assessment. Water meters are read
progressively throughout the year. Following
each reading, a water-excess charge invoice is
issued for those rating units which are liable.
The invoice will refer to the assessment and
will bill for the consumption for the period of
the reading.
Land Drainage Targeted Rate:
The purpose of this rate is to recover the cash
operating cost of the stormwater drainage,

CCC Draft Long Term Plan 2021-2031 7
and the flood protection and control works
groups of activities, plus a significant share of
the expected cost of related asset renewal and
replacement (charged in lieu of depreciation)
over the planning period. The rate is assessed
on all rating units in the District.
The Land Drainage Targeted Rate is set
differentially. A differential of 1 applies to
every rating unit which is within the historic
rated area (the area rated for land drainage
prior to 1 July 2021).
A differential of 0.33 applies for 2021/22 to all
other land (that is, every other rating unit in
the District). This differential will increase to
0.67 for 2022/23 and 1 for 2023/24 onwards.
The historic rated area and “all other land” are
identified on a map published on our website
at https://ccc.govt.nz/proposed-rates-
changes.
Liability for the Land Drainage Targeted Rate
is calculated as a number of cents per dollar of
capital value.
Differential
category
Rates
(cents / $)
Differential
factor
Rev
($000)
Historic
rated area
0.041218 1 43,055
All other
land in the
District
0.013602 0.33 562
Sewerage Targeted Rate:
The purpose of this rate is to recover the cash
operating cost of wastewater collection,
treatment and disposal, plus a significant
share of the expected cost of related asset
renewal and replacement (charged in lieu of
depreciation) over the planning period. It is
assessed on every rating unit located within
the serviced area, where the serviced area
includes all rating units that are actually
connected to the wastewater network, those
with a connection kit installed at the
boundary, and those located within a
specified distance of any part of the
wastewater network except where connection
of properties within the specified distance is
not possible for technical reasons (for
example, if connection would require crossing
third party land or if we do not permit
connection due to capacity constraints). For
developed properties, the specified distance is
100 metres, measured from the wastewater
network to a building on the land. For
undeveloped properties, the specified
distance is 30 metres measured from the
wastewater network to the property
boundary.
Liability for the Sewerage Targeted Rate is
calculated as a number of cents per dollar of
capital value.
Categories Rates
(cents / $)
Revenue
($000)
Within serviced area 0.085614 94,245
Active Travel Targeted Rate
The purpose of this rate is to contribute to the
operating cost of the Active Travel Programme
(including pedestrian networks and
cycleways). It is assessed on all rating units in
the District.
Liability for the Active Travel Targeted Rate is
calculated as a uniform amount for each
separately used or inhabited part of a rating
unit:
Land Basis Rates ($) Revenue
($000)
All land in
District
SUIP 20.00 3,649

CCC Draft Long Term Plan 2021-2031 8
Heritage Targeted Rate
The purpose of this rate is to fund:
a $23.7 million grant towards the
Canterbury Museum redevelopment
scheduled over 3 years from 2024/25.
planned capital expenditure of $42.1
million associated with preserving key
components of our own built heritage:
the Provincial Chambers, Old
Municipal Chambers and Robert
McDougall Gallery.
The rate will recover these costs over 30 years.
The rate is planned to cease in 2051/52. The
rate will be phased in over three years from
2021/22, so the rate will increase in 2022/23
and again in 2023/34 to reach a level
consistent with recovering the full capital
costs above (excluding interest).
It is assessed on all rating units in the District.
Liability for the Heritage Targeted Rate is
calculated as a number of cents per dollar of
capital value.
Categories Rates
(cents / $)
Revenue
($000)
All land in District 0.000079 86
Special Heritage (Arts Centre) Targeted Rate
The purpose of this rate is to fund a $5.5
million grant to the Arts Centre paid over three
years. The rate will recover this cost over 10
years.
The rate is planned to cease in 2031/32. The
rate will be phased in over two years from
2021/22, so the rate will increase in 2022/23 to
reach a level consistent with recovering the
full cost above (excluding interest).
It is assessed on all rating units in the District.
Liability for the Special Heritage (Arts Centre)
Targeted Rate is calculated as a number of
cents per dollar of capital value.
Categories Rates
(cents / $)
Revenue
($000)
All land in District 0.000212 230
Special Heritage (Cathedral) Targeted Rate
The purpose of this rate is to fund a $10
million grant supporting the restoration of the
Anglican Cathedral. It is assessed on all rating
units in the District and will cease on 30 June
2028.
Liability for the Special Heritage (Cathedral)
Targeted Rate is calculated as a uniform
amount for each separately used or inhabited
part of a rating unit:
Land Basis Rates ($) Revenue
($000)
All land in District SUIP 6.52 1,190
Akaroa Community Health Trust Targeted Rate
The purpose of this rate is to fund a grant of up
to $1.3 million plus GST to the Akaroa
Community Health Trust in June 2023. The
rate will cease on 30 June 2023. The grant
relates to the construction of a health centre
in Akaroa.
Liability for the Akaroa Community Health
Trust Targeted Rate is calculated as a uniform
amount for each separately used or inhabited
part of a rating unit within the eastern portion
of Banks Peninsula ward (defined as valuation
roll numbers 23890, 23900, 23910, 23920,
23930, 23940 and 23961):
Land Basis Rates ($) Revenue
($000)
All land in specified
valuation roll
numbers
SUIP 115.58 327

CCC Draft Long Term Plan 2021-2031 9
Waste Minimisation Targeted Rate:
The purpose of this rate is to recover the cash operating cost of the
collection and disposal of recycling and organic waste, plus a significant
share of the expected cost of related asset renewal and replacement
(charged in lieu of depreciation) over the planning period.
The Waste Minimisation Targeted Rate is set differentially, based on
location within or outside our kerbside collection area – rating units
located within this area are charged at the Full Charge differential, and
those located outside this area are charged at the Part Charge differential
which is set at 75 per cent of the Full Charge differential.
The Waste Minimisation Targeted Rate applies to all land within the
district except for:
Properties in the following CBD area that receive the inner city bag
collection service area (refer to map below):
land which does not have improvements recorded,
land with a storage shed only and the capital value is less than
$30,000.
Liability for the Waste Minimisation Targeted Rate is calculated as a fixed
dollar amount for each separately used or inhabited part of a rating unit
that is within the land described above and assessed for the UAGC.
Categories Basis Rates ($) Revenue
($000)
Full charge SUIP 196.96 33,208
Part charge SUIP 147.72 264
Inner City Bag Collection Area

CCC Draft Long Term Plan 2021-2031 10
Central City Business Association Targeted Rate
The purpose of this rate is to fund a $150,000 (plus GST if any) grant to the
Central City Business Association (CCBA) to support their activities.
It is assessed on all business rating units in the CCBA Area that have a land
value greater than or equal to $50,000.
The CCBA Area is the land within the red boundary defined shown in the
map.
Liability for the CCBA Targeted Rate is calculated as a uniform amount for
each rating unit.
Land Basis Rates
($)
Revenue
($000)
Business rating units within the
CCBA Area with a land value greater
than or equal to $50,000
Rating
Unit
276.89 173
CCBA Area

CCC Draft Long Term Plan 2021-2031 11
Indicative rates
The following tables show our rates for a range of property types and
values. Figures include 15% GST but exclude Ecan’s regional council
rates, late penalties, and any excess water charges.
The overall average rates increase to existing ratepayers this year is
5.56%. The rates increase experienced by each individual property will
differ from this overall average, depending on:
(a) The property's classification (whether it's a standard, business or
remote rural property).
(b) Which rates the property pays (for example, a property only pays the
sewer rate if it's within the sewer serviced area).
(c) The capital value of the property.
(d) How many 'separately used or inhabited parts' (SUIPs) the property
has. Fixed rates are paid based on the number of SUIPs. For example,
a property with two flats will pay two fixed charges. Most residential
properties have only one SUIP.
A detailed analysis of rates increases for particular groups of properties is
set out in the rates analysis section.
The tables below show the components of the overall rates payable in
2021/22 for a range of property values in each sector.
Standard properties (includes residential houses)
Around 156,600 properties pay the standard value-based General
Rate (mostly houses).
They typically pay the value-based General Rate (Standard), the
UAGC, and targeted rates for Water Supply (Connected), Land
Drainage, Sewerage, Heritage, Special Heritage (Arts Centre),
Waste Minimisation (Full Charge), Active Travel and Special
Heritage (Cathedral).
For properties classified by our valuation service provider as
residential dwellings and flats (excluding multi-unit properties
and vacant sections):
o The average Capital Value (CV) is $508,608
o Typical CCC rates on this average property are $2,984.59
Breakdown of 2021/22 annual rates ($) for a standard property:
Fixed rates ($) Value-based rates ($)
CV UAGC
Waste
Min.
(Full)
Active
Travel
Special
Heritage
(Cathedral)
All fixed
rates
General
Standard
Water
Connected
Land
DrainageSewerage Heritage
Special
Heritage
(Arts Centre)
All value-
based
rates
Total ($)
200,000 138.00 196.96 20.00 6.52 361.48 638.09 139.15 82.44 171.23 0.16 0.42 1,031.49 1,392.97
300,000 138.00 196.96 20.00 6.52 361.48 957.14 208.73 123.65 256.84 0.24 0.64 1,547.23 1,908.71
400,000 138.00 196.96 20.00 6.52 361.48 1,276.18 278.30 164.87 342.46 0.32 0.85 2,062.97 2,424.45
500,000 138.00 196.96 20.00 6.52 361.48 1,595.23 347.88 206.09 428.07 0.40 1.06 2,578.72 2,940.20
600,000 138.00 196.96 20.00 6.52 361.48 1,914.27 417.45 247.31 513.68 0.47 1.27 3,094.46 3,455.94
700,000 138.00 196.96 20.00 6.52 361.48 2,233.32 487.03 288.53 599.30 0.55 1.48 3,610.20 3,971.68
800,000 138.00 196.96 20.00 6.52 361.48 2,552.36 556.60 329.74 684.91 0.63 1.70 4,125.94 4,487.42
1,000,000 138.00 196.96 20.00 6.52 361.48 3,190.45 695.75 412.18 856.14 0.79 2.12 5,157.43 5,518.91
1,500,000 138.00 196.96 20.00 6.52 361.48 4,785.68 1,043.63 618.27 1,284.21 1.19 3.18 7,736.15 8,097.63
Average House
508,608 138.00 196.96 20.00 6.52 361.48 1,622.69 353.86 209.64 435.44 0.40 1.08 2,623.11 2,984.59
CCC Draft Long Term Plan 2021-2031 12
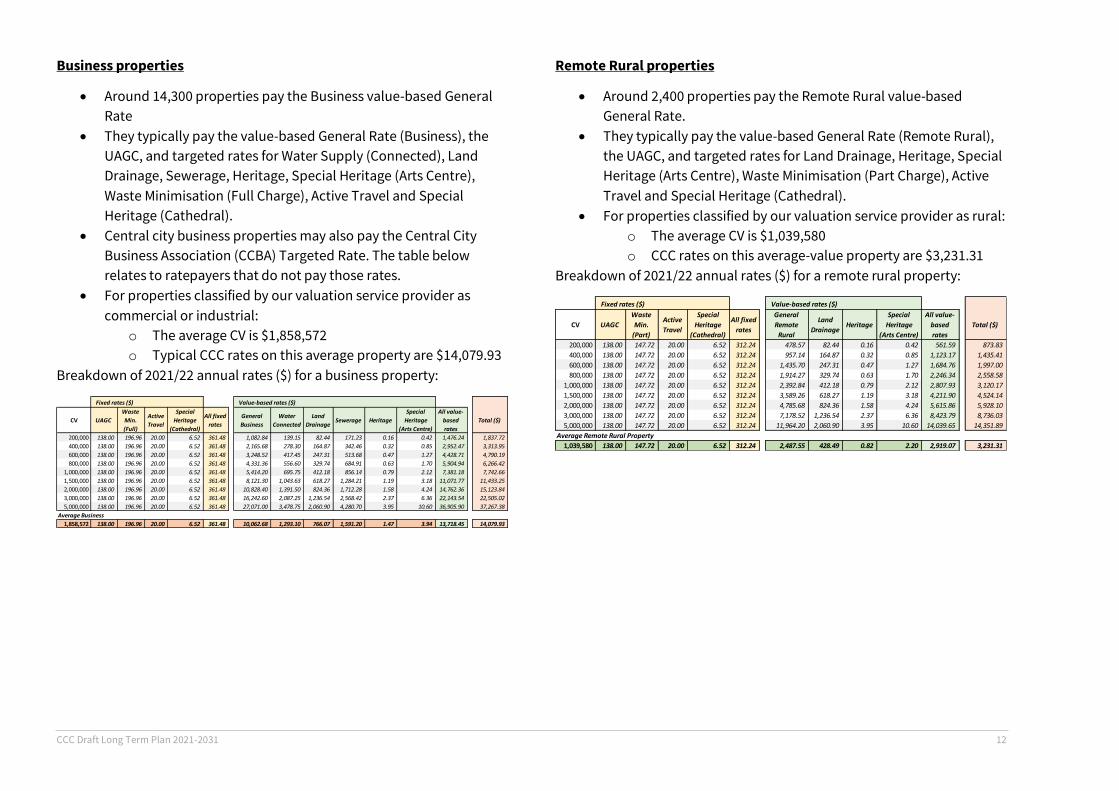
Business properties
Around 14,300 properties pay the Business value-based General
Rate
They typically pay the value-based General Rate (Business), the
UAGC, and targeted rates for Water Supply (Connected), Land
Drainage, Sewerage, Heritage, Special Heritage (Arts Centre),
Waste Minimisation (Full Charge), Active Travel and Special
Heritage (Cathedral).
Central city business properties may also pay the Central City
Business Association (CCBA) Targeted Rate. The table below
relates to ratepayers that do not pay those rates.
For properties classified by our valuation service provider as
commercial or industrial:
o The average CV is $1,858,572
o Typical CCC rates on this average property are $14,079.93
Breakdown of 2021/22 annual rates ($) for a business property:
Remote Rural properties
Around 2,400 properties pay the Remote Rural value-based
General Rate.
They typically pay the value-based General Rate (Remote Rural),
the UAGC, and targeted rates for Land Drainage, Heritage, Special
Heritage (Arts Centre), Waste Minimisation (Part Charge), Active
Travel and Special Heritage (Cathedral).
For properties classified by our valuation service provider as rural:
o The average CV is $1,039,580
o CCC rates on this average-value property are $3,231.31
Breakdown of 2021/22 annual rates ($) for a remote rural property:
Fixed rates ($) Value-based rates ($)
CV UAGC
Waste
Min.
(Full)
Active
Travel
Special
Heritage
(Cathedral)
All fixed
rates
General
Business
Water
Connected
Land
DrainageSewerage Heritage
Special
Heritage
(Arts Centre)
All value-
based
rates
Total ($)
200,000 138.00 196.96 20.00 6.52 361.48 1,082.84 139.15 82.44 171.23 0.16 0.42 1,476.24 1,837.72
400,000 138.00 196.96 20.00 6.52 361.48 2,165.68 278.30 164.87 342.46 0.32 0.85 2,952.47 3,313.95
600,000 138.00 196.96 20.00 6.52 361.48 3,248.52 417.45 247.31 513.68 0.47 1.27 4,428.71 4,790.19
800,000 138.00 196.96 20.00 6.52 361.48 4,331.36 556.60 329.74 684.91 0.63 1.70 5,904.94 6,266.42
1,000,000 138.00 196.96 20.00 6.52 361.48 5,414.20 695.75 412.18 856.14 0.79 2.12 7,381.18 7,742.66
1,500,000 138.00 196.96 20.00 6.52 361.48 8,121.30 1,043.63 618.27 1,284.21 1.19 3.18 11,071.77 11,433.25
2,000,000 138.00 196.96 20.00 6.52 361.48 10,828.40 1,391.50 824.36 1,712.28 1.58 4.24 14,762.36 15,123.84
3,000,000 138.00 196.96 20.00 6.52 361.48 16,242.60 2,087.25 1,236.54 2,568.42 2.37 6.36 22,143.54 22,505.02
5,000,000 138.00 196.96 20.00 6.52 361.48 27,071.00 3,478.75 2,060.90 4,280.70 3.95 10.60 36,905.90 37,267.38
Average Business
1,858,572 138.00 196.96 20.00 6.52 361.48 10,062.68 1,293.10 766.07 1,591.20 1.47 3.94 13,718.45 14,079.93
Fixed rates ($) Value-based rates ($)
CV UAGC
Waste
Min.
(Part)
Active
Travel
Special
Heritage
(Cathedral)
All fixed
rates
General
Remote
Rural
Land
DrainageHeritage
Special
Heritage
(Arts Centre)
All value-
based
rates
Total ($)
200,000 138.00 147.72 20.00 6.52 312.24 478.57 82.44 0.16 0.42 561.59 873.83
400,000 138.00 147.72 20.00 6.52 312.24 957.14 164.87 0.32 0.85 1,123.17 1,435.41
600,000 138.00 147.72 20.00 6.52 312.24 1,435.70 247.31 0.47 1.27 1,684.76 1,997.00
800,000 138.00 147.72 20.00 6.52 312.24 1,914.27 329.74 0.63 1.70 2,246.34 2,558.58
1,000,000 138.00 147.72 20.00 6.52 312.24 2,392.84 412.18 0.79 2.12 2,807.93 3,120.17
1,500,000 138.00 147.72 20.00 6.52 312.24 3,589.26 618.27 1.19 3.18 4,211.90 4,524.14
2,000,000 138.00 147.72 20.00 6.52 312.24 4,785.68 824.36 1.58 4.24 5,615.86 5,928.10
3,000,000 138.00 147.72 20.00 6.52 312.24 7,178.52 1,236.54 2.37 6.36 8,423.79 8,736.03
5,000,000 138.00 147.72 20.00 6.52 312.24 11,964.20 2,060.90 3.95 10.60 14,039.65 14,351.89
Average Remote Rural Property
1,039,580 138.00 147.72 20.00 6.52 312.24 2,487.55 428.49 0.82 2.20 2,919.07 3,231.31

CCC Draft Long Term Plan 2021-2031 13
Rates analysis
This analysis shows the increase in rates compared with the previous year
for typical ratepayers with different property values. The analysis is on a
GST-inclusive basis, and excludes Ecan rates, excess water charges and
penalties.
Typical houses
A typical house pays the following rates:
Value-based rates: general (standard), water connected, land
drainage, sewerage, heritage and special heritage (Arts Centre)
rates
Fixed rates: the uniform annual general charge (UAGC), waste
minimisation (full), active travel and special heritage (Cathedral)
rates
The following table shows rates increases for typical houses of varying
sizes.
Typical houses
The average house will have a rates increase of $2.74 per week.
Typical businesses
A typical business pays the following rates:
Value-based rates: general (business), water connected, land
drainage, sewerage, heritage and special heritage (Arts Centre)
rates
Fixed rates: the uniform annual general charge (UAGC), waste
minimisation (full), active travel and special heritage (Cathedral)
rates
The following table shows rates increases for typical business properties
of varying sizes. It assumes the property does not pay the Central City
Business Association (CCBA) Targeted Rate.
Typical businesses
CV2020/21
Rates
2021/22
Rates
Annual
increase ($)
Weekly
increase ($)Change (%)
200,000 1,337.57$ 1,392.97$ 55.40$ 1.07$ 4.14%
300,000 1,825.17$ 1,908.71$ 83.54$ 1.61$ 4.58%
400,000 2,312.77$ 2,424.45$ 111.68$ 2.15$ 4.83%
500,000 2,800.37$ 2,940.20$ 139.83$ 2.69$ 4.99%
600,000 3,287.97$ 3,455.94$ 167.97$ 3.23$ 5.11%
700,000 3,775.57$ 3,971.68$ 196.11$ 3.77$ 5.19%
800,000 4,263.17$ 4,487.42$ 224.25$ 4.31$ 5.26%
1,000,000 5,238.37$ 5,518.91$ 280.54$ 5.40$ 5.36%
1,500,000 7,676.37$ 8,097.63$ 421.26$ 8.10$ 5.49%
2,000,000 10,114.37$ 10,676.34$ 561.97$ 10.81$ 5.56%
3,000,000 14,990.37$ 15,833.77$ 843.40$ 16.22$ 5.63%
Average House
508,608 2,842.34$ 2,984.59$ 142.25$ 2.74$ 5.00%
CV2020/21
Rates
2021/22
Rates
Annual
increase ($)
Weekly
increase ($)Change (%)
200,000 1,753.93$ 1,837.72$ 83.79$ 1.61$ 4.78%
400,000 3,145.48$ 3,313.95$ 168.47$ 3.24$ 5.36%
600,000 4,537.04$ 4,790.19$ 253.15$ 4.87$ 5.58%
800,000 5,928.59$ 6,266.42$ 337.83$ 6.50$ 5.70%
1,000,000 7,320.15$ 7,742.66$ 422.51$ 8.13$ 5.77%
1,500,000 10,799.04$ 11,433.25$ 634.21$ 12.20$ 5.87%
2,000,000 14,277.93$ 15,123.84$ 845.91$ 16.27$ 5.92%
3,000,000 21,235.71$ 22,505.02$ 1,269.31$ 24.41$ 5.98%
5,000,000 35,151.27$ 37,267.38$ 2,116.11$ 40.69$ 6.02%
Average Business
1,858,572 13,293.91$ 14,079.93$ 786.03$ 15.12$ 5.91%
CCC Draft Long Term Plan 2021-2031 14
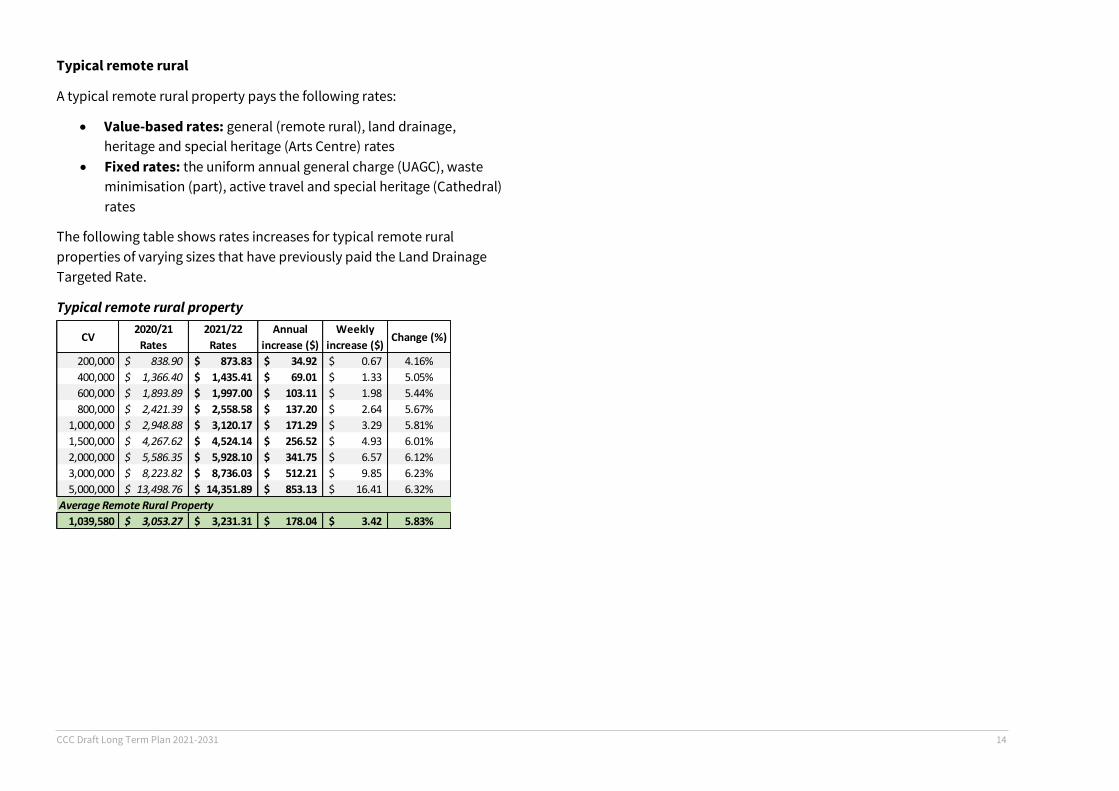
Typical remote rural
A typical remote rural property pays the following rates:
Value-based rates: general (remote rural), land drainage,
heritage and special heritage (Arts Centre) rates
Fixed rates: the uniform annual general charge (UAGC), waste
minimisation (part), active travel and special heritage (Cathedral)
rates
The following table shows rates increases for typical remote rural
properties of varying sizes that have previously paid the Land Drainage
Targeted Rate.
Typical remote rural property
CV2020/21
Rates
2021/22
Rates
Annual
increase ($)
Weekly
increase ($)Change (%)
200,000 838.90$ 873.83$ 34.92$ 0.67$ 4.16%
400,000 1,366.40$ 1,435.41$ 69.01$ 1.33$ 5.05%
600,000 1,893.89$ 1,997.00$ 103.11$ 1.98$ 5.44%
800,000 2,421.39$ 2,558.58$ 137.20$ 2.64$ 5.67%
1,000,000 2,948.88$ 3,120.17$ 171.29$ 3.29$ 5.81%
1,500,000 4,267.62$ 4,524.14$ 256.52$ 4.93$ 6.01%
2,000,000 5,586.35$ 5,928.10$ 341.75$ 6.57$ 6.12%
3,000,000 8,223.82$ 8,736.03$ 512.21$ 9.85$ 6.23%
5,000,000 13,498.76$ 14,351.89$ 853.13$ 16.41$ 6.32%
Average Remote Rural Property
1,039,580 3,053.27$ 3,231.31$ 178.04$ 3.42$ 5.83%