third working group meeting presentation
DESCRIPTION
Justice Reinvestment in KansasTRANSCRIPT

�����������������������������������
�(%1%�)2�#/.2%.242�!-/.'�0/,)#8-!+%12�).��!6!))�3(!3�3(%�23!3%�.%%$2�3/�1%$4#%�)32�$%0%.$%.#%�/.�/43�/&�23!3%�01)2/.2�� 6(%1%�� !2� /&� ������ !001/7)-!3%,8� /.%�3()1$�/&� 3(%� 23!3%;2� !$4,3�01)2/.�0/04,!3)/.� )2�(/42%$���3� 3(%�2!-%� 3)-%�� 23!3%� ,%!$%12� !1%� $%3%1-).%$� 3/� 1%$4#%� 5)/�,%.3�#1)-%��6()#(�� ,)+%� 3(%�23!3%�01)2/.�0/04,!3)/.��(!2�).#1%!2%$�2)'.)<#!.3,8�/5%1�3(%�,!23�$%#!$%���/5%1./1��%),��"%1#1/-")%���()%&��423)#%��!1+��%#+�
3%.6!,$���%.!3%��1%2)$%.3��(!.��24324)���/42%��0%!+%1��!,5).��!8�!.$��%0!13-%.3�/&��4",)#��!&%38��)1%#3/1��/$)%��!%2!+!��)1!3!�2%%+�3/�%-0,/8�!�$!3!�$1)5%.�*423)#%�1%).5%23-%.3�231!3%'8�3/�"1).'�/43�/&�23!3%�01)2/.%12�"!#+�3/��!6!))��1%$4#%�20%.$).'�/.�#/11%#3)/.2��!.$�1%).�5%23�2!5).'2�'%.%1!3%$�).�231!3%')%2�3(!3�6/4,$�1%5%12%�1%#%.3�#1)-%�31%.$2���/�3()2�%.$��3(%8�2/4'(3�!22)23!.#%�&1/-�3(%��41%!4�/&��423)#%��22)23!.#%��!�$)5)2)/.�/&�3(%�������%0!13-%.3�
/&��423)#%��!.$�3(%��%6��%.3%1�/.�3(%��3!3%2���(%�23!3%�,%!$%12�!'1%%$�3/�%23!",)2(�!�")0!13)2!.��).3%1�"1!.#(��423)#%��%).5%23-%.3� /1+).'��1/40�#/-01)2).'�,%!$).'�23!3%�!.$�,/#!,�/&<#)!,2�6()#(�6/4,$�1%#%)5%�).3%.�2)5%�3%#(.)#!,�!22)23!.#%�&1/-�3(%��/4.#),�/&��3!3%��/5%1.-%.32��423)#%��%.3%1��).�0!13.%12()0�6)3(�3(%��%6��%.3%1�/.�3(%��3!3%2���(%������423)#%��%.3%1�6),,�!22)23�3(%�6/1+).'�'1/40�).�!.!,89).'�$!3!�!.$�$%5%,/0).'�!�#/-01%(%.2)5%�2%3�/&�0/,)#8�/03)/.2��
���������
�������������� ���������������������������� ������������
:� �!6!));2�5)/,%.3�#1)-%�1!3%�6!2�1%,!3)5%,8�,/6�).�������!3����1%0/13%$�).#)$%.32�0%1���������1%2)$%.32��6()#(�1!.+2�)3�3()138�<&3(�!-/.'�3(%�23!3%2���()2�#1)-%�1!3%��(/6%5%1��)2�40�&1/-�6(!3�)3�6!2�).��������!6!))�6!2�/.%�/&�/.,8�36%,5%�23!3%2�3/�%70%1)%.#%�!.�).#1%!2%�).�5)/,%.3�#1)-%�1!3%2�$41).'�3()2�0%1)/$��
:� �)/,%.3�#1)-%�).#1%!2%2�6%1%�$1)5%.�"8�!�2)'.)<#!.3�1)2%�).�3(%�1%0/13%$�1!0%�1!3%��40�<5%�0%1#%.3�&1/-�������!.$�!''1!5!3%$�!22!4,32��40����0%1#%.3�&1/-��������41$%1�!.$�1/""%18�1!3%2�$1/00%$�"8�� �0%1#%.3�!.$���0%1#%.3��1%20%#3)5%,8��
:� �41).'�3(%�2!-%�0%1)/$��3(%�.4-"%1�/&�!11%232�&/1�1%0/13%$�1!0%�/&&%.2%2�1%,!3)5%�3/�3(%�.4-"%1�/&�/&&%.2%2�&%,,�"8����0%1#%.3�� �.������� 3(%��/./,4,4��/,)#%��%0!13-%.3�%23)-!3%$� 3(%�$%0!13-%.3�(!2�!�"!#+,/'�/&�2/-%6(%1%�"%36%%.����!.$�����2%74!,�!22!4,3�+)32�,%&3�4.%7!-).%$��
:� �%36%%.������!.$�������3(%�01/0%138�#1)-%�1!3%�$1/00%$����0%1#%.3�).��!6!))��&1/-����3/�������1%0/13%$�#1)-%2�0%1���������1%2)$%.32���%20)3%�3()2�$%#,).%���!6!));2�01/0%138�#1)-%�1!3%�1%-!).2�!"/5%�3(%�.!3)/.!,�!5%1!'%��)3�)2�3(%�36%,&3(�()'(%23�).�3(%�.!3)/.��
��� ����������� ��� �����
���
Justice Reinvestment in Kansas������3rd Working Group Meeting������October 29, 2012������Andy Barbee, Research Manager���Anne Bettesworth, Policy Analyst
Council of State Governments Jus4ce Center
Council of State Governments Jus4ce Center 2
• Na4onal non-‐profit, non-‐par4san membership associa4on of state government officials
• Engages members of all three branches of state government • Jus4ce Center provides prac4cal, nonpar4san advice informed
by the best available evidence
Funding and Partners
Council of State Governments Jus4ce Center 3
Justice Reinvestment
a data-‐driven approach to reduce corrections spending and reinvest savings in strategies that can decrease recidivism and increase public safety.

Jus4ce Reinvestment Focuses on Four Evidence-‐Based Strategies
Council of State Governments Jus4ce Center 4
1. Focus on the people most likely to commit crime
2. Use programs proven to work and ensure they are high quality
3. Deploy supervision policies and prac4ces that balance sanc4ons and treatment
4. Target places where crime and recidivism rates are the highest

Kansas Prison Popula4on to Grow 23% Over Next Ten Years
Council of State Governments Jus4ce Center 5
5,000
6,750
8,500
10,250
12,000 Kansas Prison Popula5on
Up 23% from 2012 to 2022
11,484
9,370 9,181
8,610 9% increase from July 2009 through June 2012.
projec'on
Cost of projected increase exceeds
$125 M
Sources: Kansas Sentencing Commission, 2013 Prison Population Projection, August 2012

Jus4ce Reinvestment Process
Council of State Governments Jus4ce Center 6
Phase I
Analyze Data and Develop Policy Options
Bipartisan , bicameral, inter-branch working group
• Analyze data to look at crime, court, corrections, and supervision trends
• Solicit input from stakeholders
• Map allocation of resources
• Develop policy options & estimate cost savings
• Identify assistance needed to implement policies effectively
• Deploy targeted reinvestment strategies to increase public safety
• Track the impact of enacted policies/programs
• Monitor recidivism rates and other key measures
Phase 2
Implement New Policies

Wrapping Up Detailed Analysis and Developing Policy Framework
Council of State Governments Jus4ce Center 7
Collect and examine quantitative data § Reported crime & arrests § Court dispositions & sentencing § Court services, community corrections & post-release supervision § Prison admissions, population & releases
Develop and present a comprehensive analysis of the state’s criminal justice
system
Develop a framework of policy options that together would increase public safety
and reduce/avert taxpayer spending
November - December
Phase I Analyze Data & Develop Policy Options
Engage stakeholders § Law enforcement § Judges § County/district attorneys & defense counsel § Victim advocates § County officials § Supervision agencies § Behavioral Health Treatment Providers
June -‐ October

Data Used to Inform Analyses
Council of State Governments Jus4ce Center 8
Data* Source Status Felony Sentences KSC Received
Court Services Judiciary Received
Community Corrections DOC Received
Prison Admissions, Releases, & Annual Population Snapshot DOC Received
Parole/Post-Release Supervision DOC Received
Arrests KBI Prohibited by State Law
* Denotes case specific records at person level. Court Services data are the excep4on as they were available only in aggregate form.

Presenta4on Overview
Council of State Governments Jus4ce Center 9
Crime Challenges
Proba5on Under Strain
Reentry and Vic5m Issues
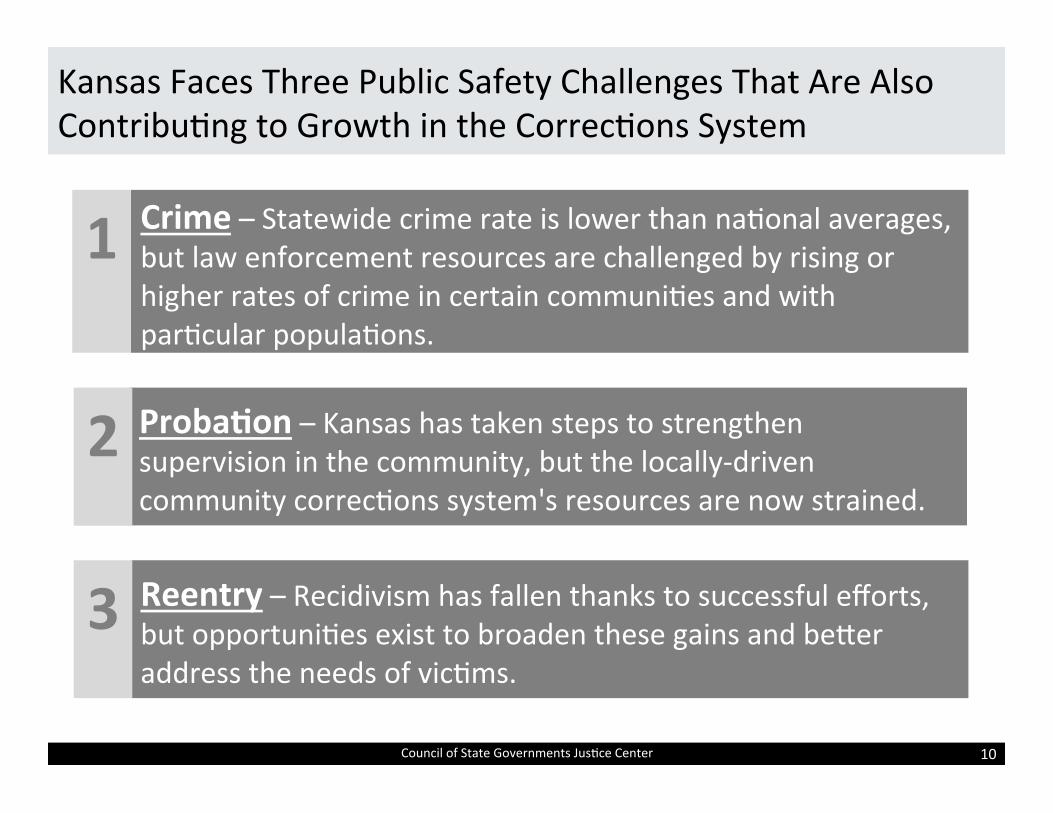
Kansas Faces Three Public Safety Challenges That Are Also Contribu4ng to Growth in the Correc4ons System
Council of State Governments Jus4ce Center 10
Crime – Statewide crime rate is lower than na4onal averages, but law enforcement resources are challenged by rising or higher rates of crime in certain communi4es and with par4cular popula4ons.
Proba5on – Kansas has taken steps to strengthen supervision in the community, but the locally-‐driven community correc4ons system's resources are now strained.
Reentry – Recidivism has fallen thanks to successful efforts, but opportuni4es exist to broaden these gains and beder address the needs of vic4ms.
1
2
3

Presenta4on Overview
Council of State Governments Jus4ce Center 11
Crime Challenges
Proba4on Under Strain
Reentry and Vic4m Issues

Summary of Crime Findings
Council of State Governments Jus4ce Center 12
Crime is down when viewed as a statewide average, but...
q More than 60% of coun4es face rising crime or have rates exceeding the statewide average.
q More than half of all coun4es are experiencing significant increases in domes4c violence.
q Constrained resources are limi4ng ability of law enforcement to be more effec4ve in preven4ng crime.
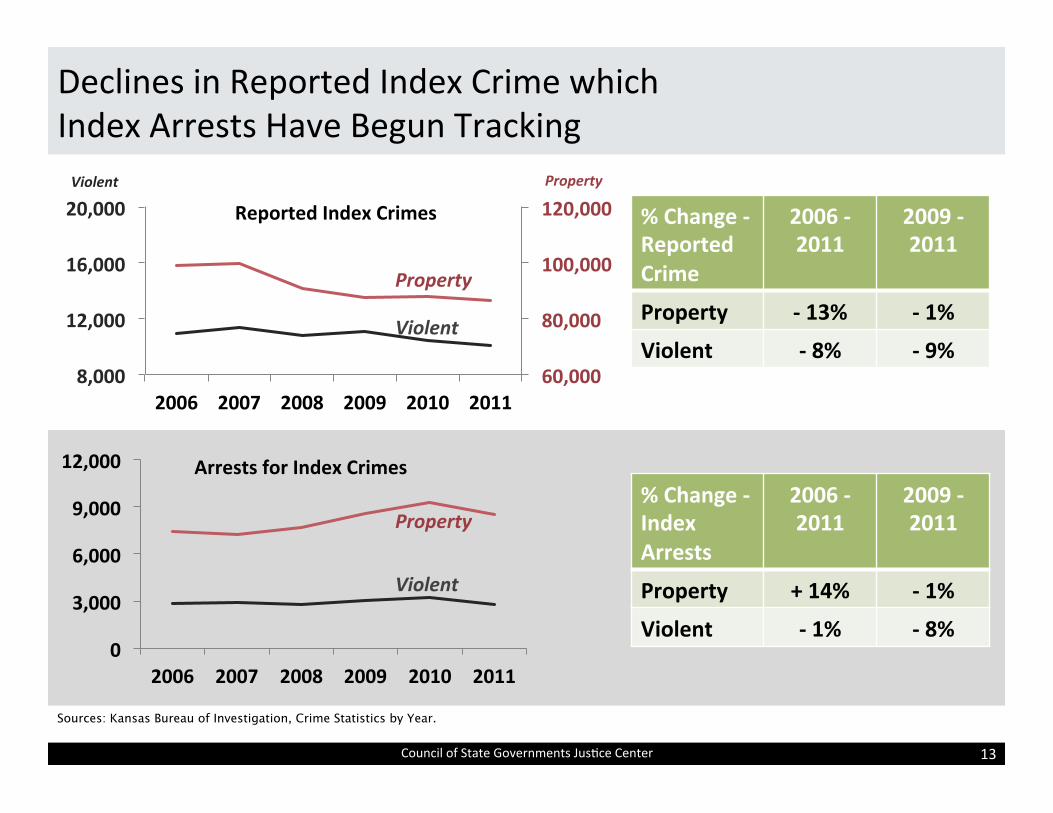
Declines in Reported Index Crime which Index Arrests Have Begun Tracking
Council of State Governments Jus4ce Center 13
60,000
80,000
100,000
120,000
8,000
12,000
16,000
20,000
2006 2007 2008 2009 2010 2011
Reported Index Crimes Violent Property
% Change -‐ Reported Crime
2006 -‐ 2011
2009 -‐ 2011
Property -‐ 13% -‐ 1%
Violent -‐ 8% -‐ 9%
Property
Violent
0
3,000
6,000
9,000
12,000
2006 2007 2008 2009 2010 2011
Arrests for Index Crimes
Property
Violent
% Change -‐ Index Arrests
2006 -‐ 2011
2009 -‐ 2011
Property + 14% -‐ 1%
Violent -‐ 1% -‐ 8%
Sources: Kansas Bureau of Investigation, Crime Statistics by Year.
Feedback from Law Enforcement Officials
Council of State Governments Jus4ce Center 14
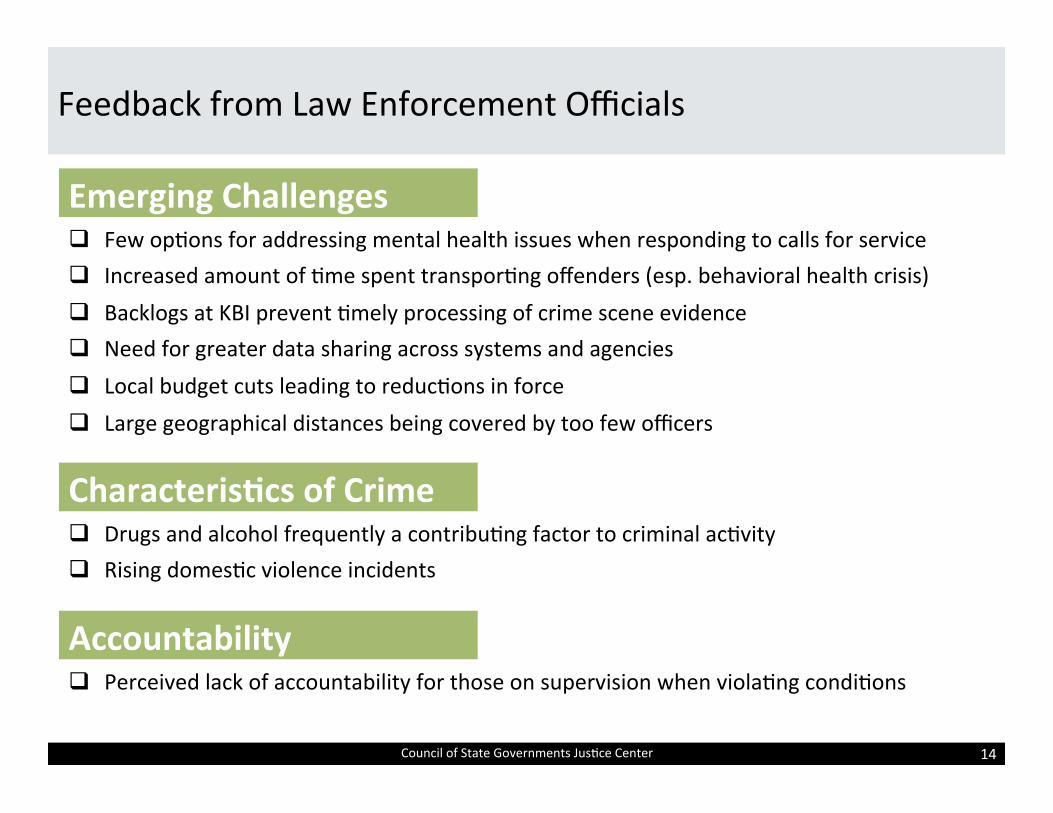
Emerging Challenges q Few op4ons for addressing mental health issues when responding to calls for service q Increased amount of 4me spent transpor4ng offenders (esp. behavioral health crisis) q Backlogs at KBI prevent 4mely processing of crime scene evidence q Need for greater data sharing across systems and agencies q Local budget cuts leading to reduc4ons in force q Large geographical distances being covered by too few officers
Characteris5cs of Crime q Drugs and alcohol frequently a contribu4ng factor to criminal ac4vity q Rising domes4c violence incidents
Accountability q Perceived lack of accountability for those on supervision when viola4ng condi4ons

Despite Overall Statewide Declines in Crime, Many Coun4es Face Increasing Crime
Council of State Governments Jus4ce Center 15
0% 50% 100% 150% 200% Washington
Barber Gray
Hodgeman Meade Cowley
Cheyenne Osborne Norton
McPherson Woodson
Prad Cloud Saline
Doniphan Barton Russell Labede
% Change: 2006-‐11 Violent Crime Rate
5 coun4es w/ growth in excess of 200% (3 coun4es excl. due to repor4ng
anomalies)
0% 50% 100% 150% 200% Ford
Cowley Norton
Sheridan Morris Phillips Osage Prad
Osborne Graham
Rush Bourbon
Gray Wichita Sumner Cloud
Neosho
% Change: 2006-‐11 Property Crime Rate
5 coun4es w/ growth in excess of 200%
Statewide violent crime rate decreased 11% during same 5meframe.
Statewide property crime rate decreased 16% during same 5meframe.
Sources: Kansas Bureau of Investigation, Crime Statistics by Year.

Even if Crime Declined, Many Coun4es S4ll Well Above Average Crime Rates
Council of State Governments Jus4ce Center 16
65
35
0 25 50 75
Sedgwick Wyandode
Labede Montgomery
Shawnee Leavenworth
Geary Cloud
Woodson Reno
Russell Ford
Harvey Cowley Douglas
Hodgeman Finney
Statewide
541
301
0 150 300 450 600
Wyandode Shawnee
Reno Saline
Sedgwick Crawford Douglas Bourbon Barton
Montgomery Lyon
Labede Sumner
Ford Cowley
Statewide
2011 Violent Crime Rate per 10,000 2011 Property Crime Rate per 10,000
Sources: Kansas Bureau of Investigation, Crime Statistics by Year, and FBI Uniform Crime Reports 2010.
Na5onal violent crime rate = 40.
Na5onal property crime rate = 294.

64 of 105 Coun4es Have Increasing Crime or Rates Higher than the Statewide Average
Council of State Governments Jus4ce Center 17
Sources: Kansas Bureau of Investigation, Crime Statistics by Year.
Increasing Crime Rates Higher than State Average Both
Shawnee Wyandode Sedgwick Reno Leavenworth
Cowley Saline
Butler − Robbery
− Rape − Agg. Assault
− Agg. Assault − Burglary − Them − MV Them
− Agg. Assault − Burglary
− Robbery − Them
− Burglary − Agg. Assault − Burglary
− Rape − Burglary
Beyond “Index” Crimes... Reports of Domes4c Violence Increasing
Council of State Governments Jus4ce Center 18
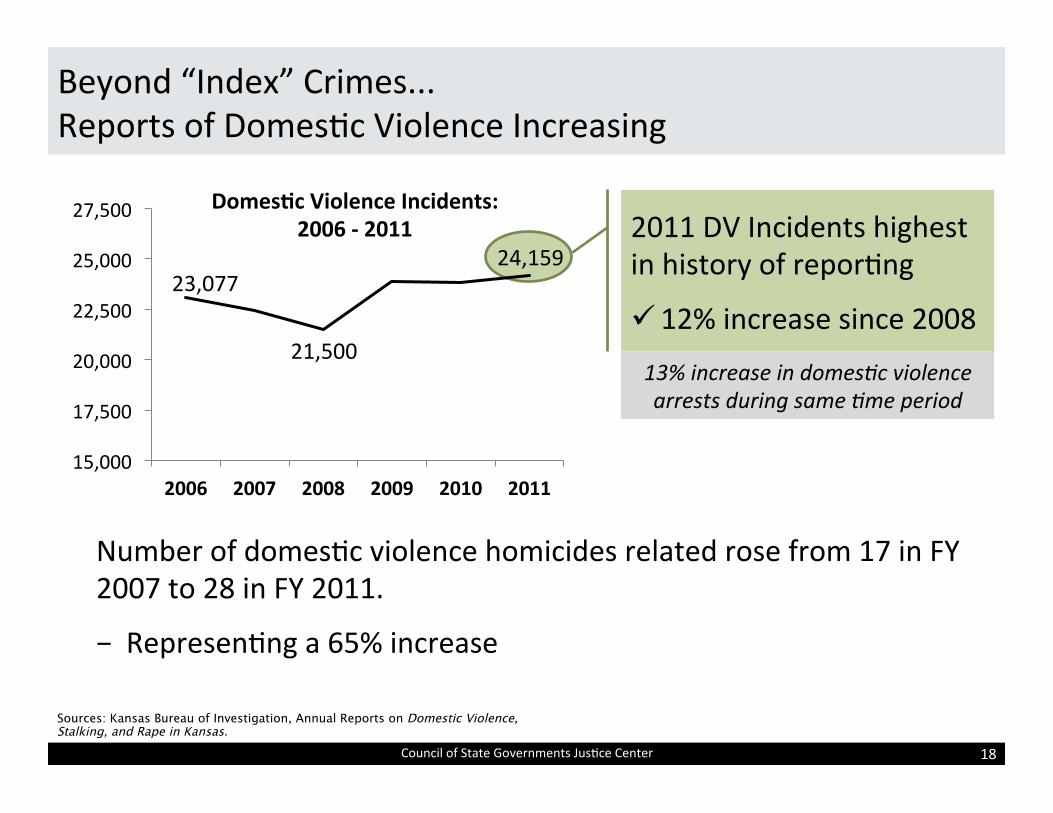
2011 DV Incidents highest in history of repor4ng
ü 12% increase since 2008 13% increase in domes'c violence arrests during same 'me period
Number of domes4c violence homicides related rose from 17 in FY 2007 to 28 in FY 2011.
− Represen4ng a 65% increase
Domes5c Violence Incidents: 2006 -‐ 2011
Sources: Kansas Bureau of Investigation, Annual Reports on Domestic Violence, Stalking, and Rape in Kansas.
23,077
21,500
24,159
15,000
17,500
20,000
22,500
25,000
27,500
2006 2007 2008 2009 2010 2011

56 of 105 Coun4es Had Increased Reports of Domes4c Violence Since 2006
Council of State Governments Jus4ce Center 19
Sources: Kansas Bureau of Investigation, Annual Reports on Domestic Violence, Stalking, and Rape in Kansas.
Coun4es experiencing increased reports of DV incidents accounted for a 19% increase from FY 2006 to FY 2011.
Addi5onal 2,456 DV Incidents from
2006-‐11
Crime Preven4on Hampered Due to Insufficient KBI Capacity to Process Evidence
Council of State Governments Jus4ce Center 20
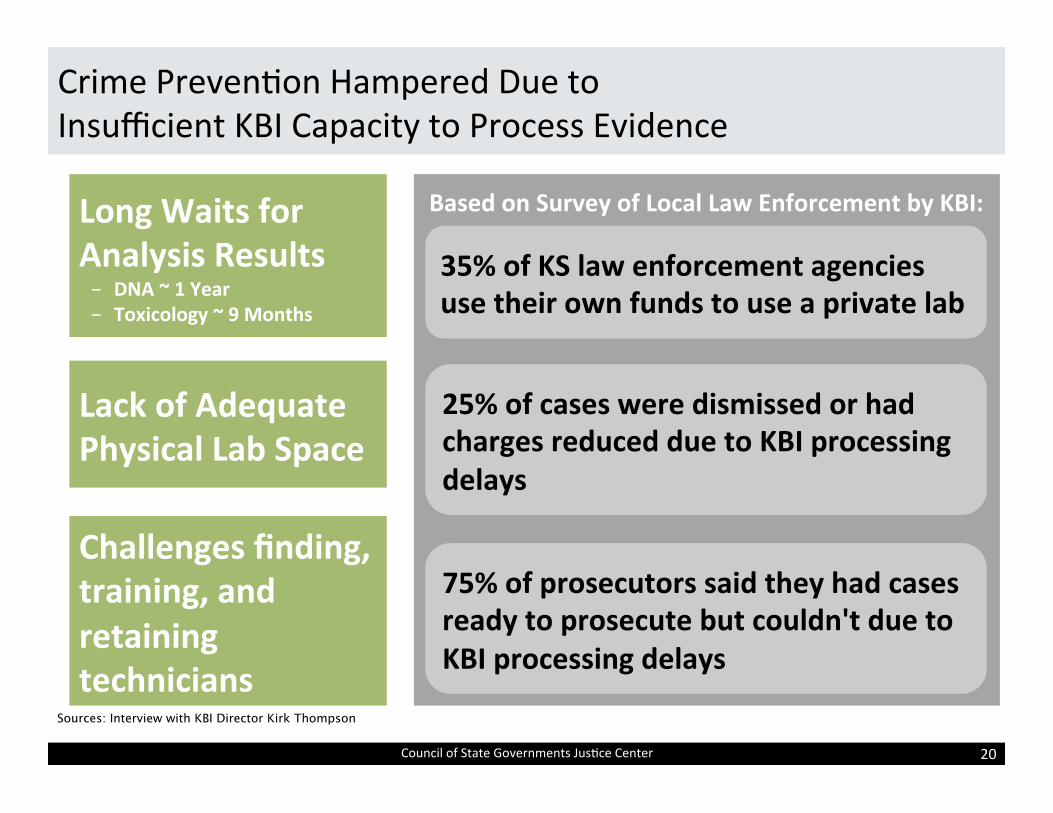
Sources: Interview with KBI Director Kirk Thompson
25% of cases were dismissed or had charges reduced due to KBI processing delays
35% of KS law enforcement agencies use their own funds to use a private lab
75% of prosecutors said they had cases ready to prosecute but couldn't due to KBI processing delays
Long Waits for Analysis Results − DNA ~ 1 Year − Toxicology ~ 9 Months
Lack of Adequate Physical Lab Space
Challenges finding, training, and retaining technicians
Based on Survey of Local Law Enforcement by KBI:
Johnson County: Case Study of Specialized Police-‐Based Response to People with Mental Illness
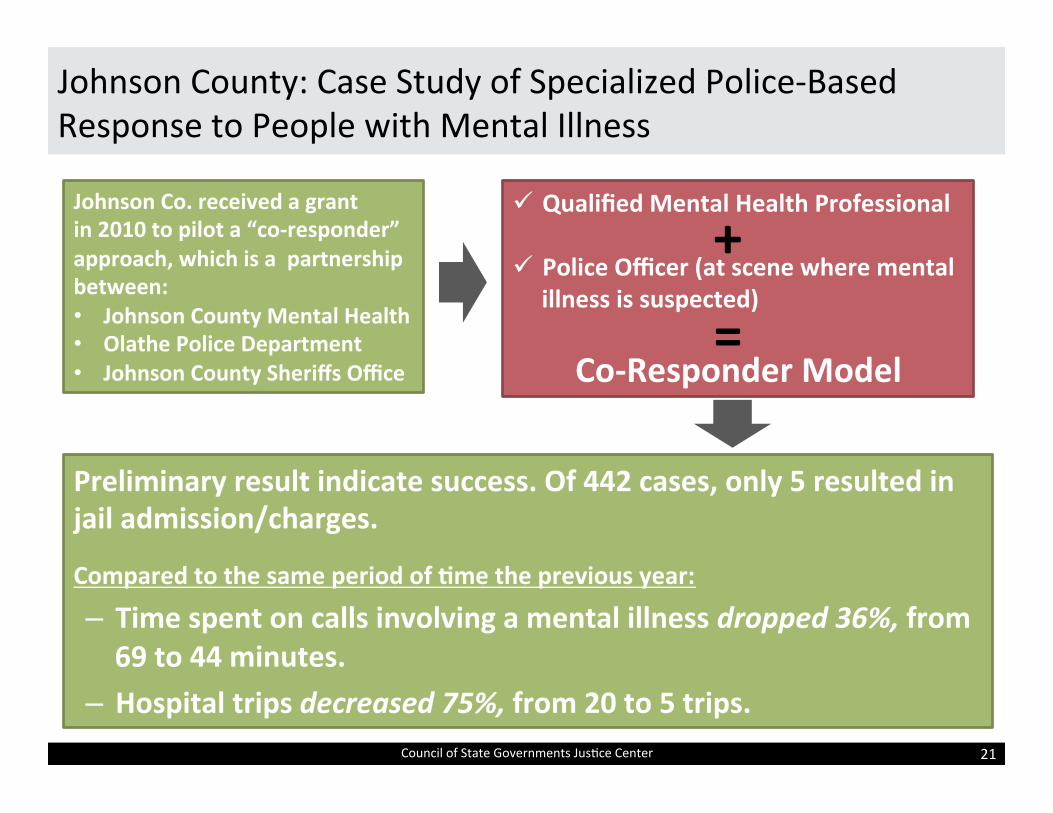
Preliminary result indicate success. Of 442 cases, only 5 resulted in jail admission/charges.
Compared to the same period of 5me the previous year:
– Time spent on calls involving a mental illness dropped 36%, from 69 to 44 minutes.
– Hospital trips decreased 75%, from 20 to 5 trips. Council of State Governments Jus4ce Center 21
Johnson Co. received a grant in 2010 to pilot a “co-‐responder” approach, which is a partnership between: • Johnson County Mental Health • Olathe Police Department • Johnson County Sheriffs Office
ü Qualified Mental Health Professional
ü Police Officer (at scene where mental illness is suspected)
Co-‐Responder Model
+
=

We Want Even More Input from Law Enforcement and Created a Survey Asking About...
Council of State Governments Jus4ce Center 22
Department Characteris5cs & Jurisdic5on Trends Jail Capacity
Crime Analysis & Preven5on
Mental Health Training & Transport
Processing Crime Scene Evidence
Results will be in by mid-‐November!
Presenta4on Overview
Council of State Governments Jus4ce Center 23
Crime Challenges
Proba5on Under Strain
Reentry and Vic4m Issues

Summary of Proba4on Findings
Council of State Governments Jus4ce Center 24
Despite modest growth in felony proba4on popula4on, revoca4ons are on the rise
contribu4ng to prison growth.
q 24% increase in rate of revoca4ons to prison since FY 2009 – almost exclusively condi4ons violators.
q Most revoked high-‐risk proba4oners do not receive adequate programming in community.
q Successful, low-‐risk proba4oners are being supervised as long as high-‐risk proba4oners.
q Barriers exist to more effec4ve supervision prac4ces.

Proba4on Revoca4ons to Prison Have Increased Almost 25% Past Three Years
Council of State Governments Jus4ce Center 25
1,759
1,479
1,841
0
500
1,000
1,500
2,000 Amer a decline in revoca4ons from FY07 to FY09, they have since risen by 24%.
Only one-‐quarter of Community Correc4ons revoca4ons involve “presump4ve prison” or “border box” offenders. Sources: Kansas Sentencing Commission, Felony Sentencing Case Data, and 2013
Prison Population Projection, August 2012
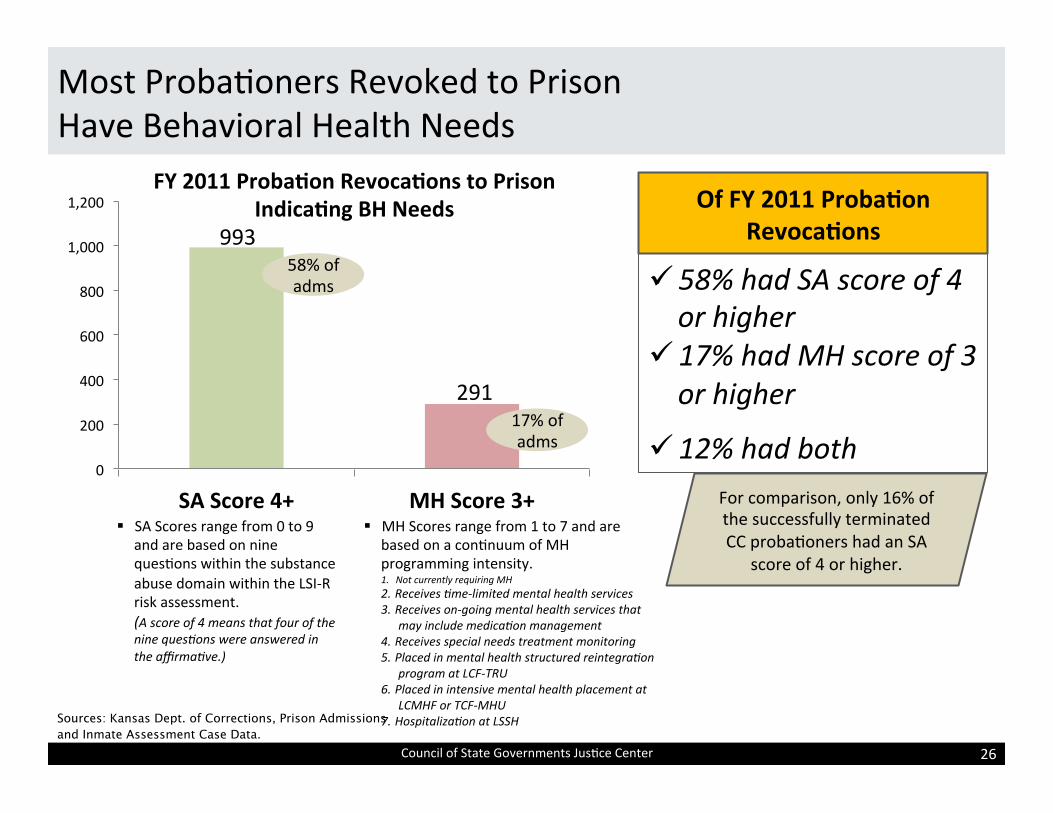
Most Proba4oners Revoked to Prison Have Behavioral Health Needs
Council of State Governments Jus4ce Center 26
Sources: Kansas Dept. of Corrections, Prison Admissions and Inmate Assessment Case Data.
993
291
0
200
400
600
800
1,000
1,200
SA Score 4+ MH Score 3+
FY 2011 Proba5on Revoca5ons to Prison Indica5ng BH Needs
17% of adms
58% of adms
§ SA Scores range from 0 to 9 and are based on nine ques4ons within the substance abuse domain within the LSI-‐R risk assessment. (A score of 4 means that four of the nine ques'ons were answered in the affirma've.)
§ MH Scores range from 1 to 7 and are based on a con4nuum of MH programming intensity. 1. Not currently requiring MH 2. Receives 'me-‐limited mental health services 3. Receives on-‐going mental health services that
may include medica'on management 4. Receives special needs treatment monitoring 5. Placed in mental health structured reintegra'on
program at LCF-‐TRU 6. Placed in intensive mental health placement at
LCMHF or TCF-‐MHU 7. Hospitaliza'on at LSSH
ü 58% had SA score of 4 or higher
ü 17% had MH score of 3 or higher
ü 12% had both
Of FY 2011 Proba5on Revoca5ons
For comparison, only 16% of the successfully terminated CC proba4oners had an SA
score of 4 or higher.

Successful Proba4oners Are Twice as Likely to Receive Programming as Those Revoked
Council of State Governments Jus4ce Center 27
Sources: Kansas Dept. of Corrections, Community Corrections Case Data.
Of successful mod/high risk termina5ons:
ü 57% completed two or more behavioral health programming interven4ons.
FY 2011 Total CC Termina5ons
4,881
High Risk
Low Risk
Mod Risk
4% Revoked
76% Revoked
37% Revoked Of the mod/high risk revocaEons:
ü Only 31% completed two or more behavioral health programming interven4ons.
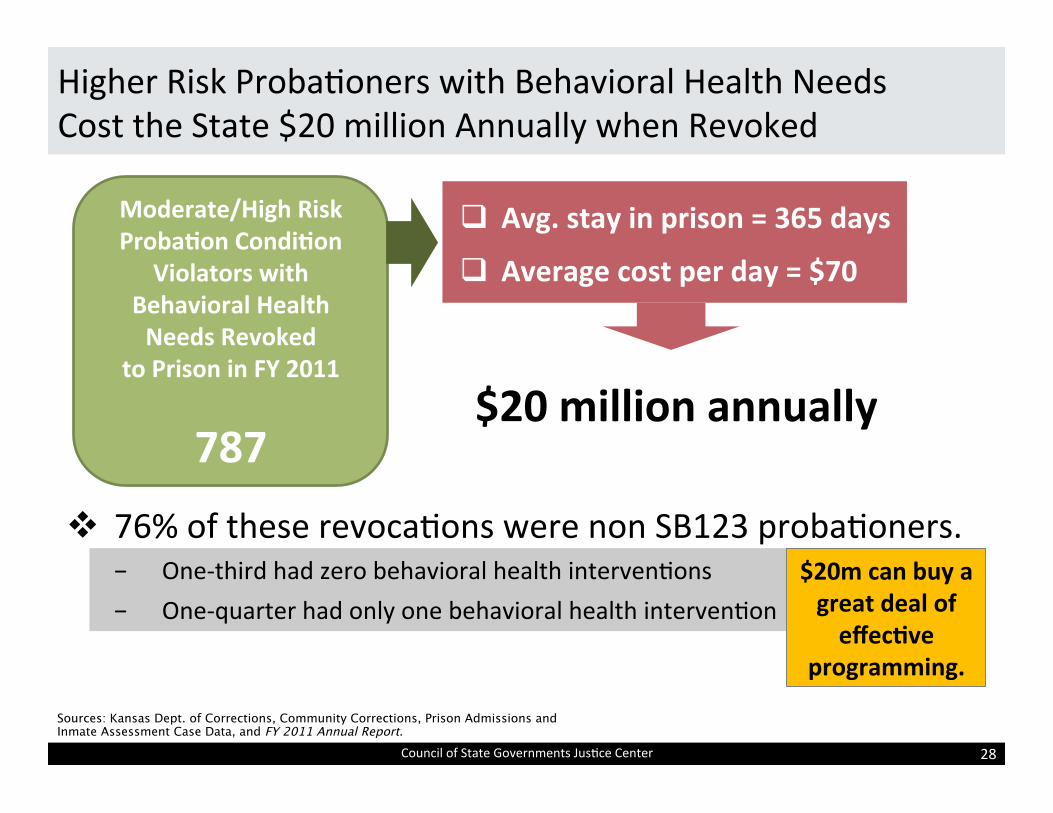
Higher Risk Proba4oners with Behavioral Health Needs Cost the State $20 million Annually when Revoked
Council of State Governments Jus4ce Center 28
Moderate/High Risk Proba5on Condi5on
Violators with Behavioral Health Needs Revoked
to Prison in FY 2011
787
q Avg. stay in prison = 365 days q Average cost per day = $70
$20 million annually
v 76% of these revoca4ons were non SB123 proba4oners. − One-‐third had zero behavioral health interven4ons − One-‐quarter had only one behavioral health interven4on
Sources: Kansas Dept. of Corrections, Community Corrections, Prison Admissions and Inmate Assessment Case Data, and FY 2011 Annual Report.
$20m can buy a great deal of effec5ve
programming.

Graduated Sanc4ons Coupled with Targeted Programs and Supervision Are Less Costly than Tradi4onal Approaches
Council of State Governments Jus4ce Center 29
IneffecEve PracEce
12 months incarcera5on
EffecEve PracEce
3 months incarcera5on
~18 months remaining on supervision
3 month program in the community
~0% recidivism reduc5on
$25,500 cost per person
~20% recidivism reduc5on
$13,800 cost per person
− Unlikely to receive programs in prison to reduce risk
− No supervision upon release to monitor risk & mi4gate
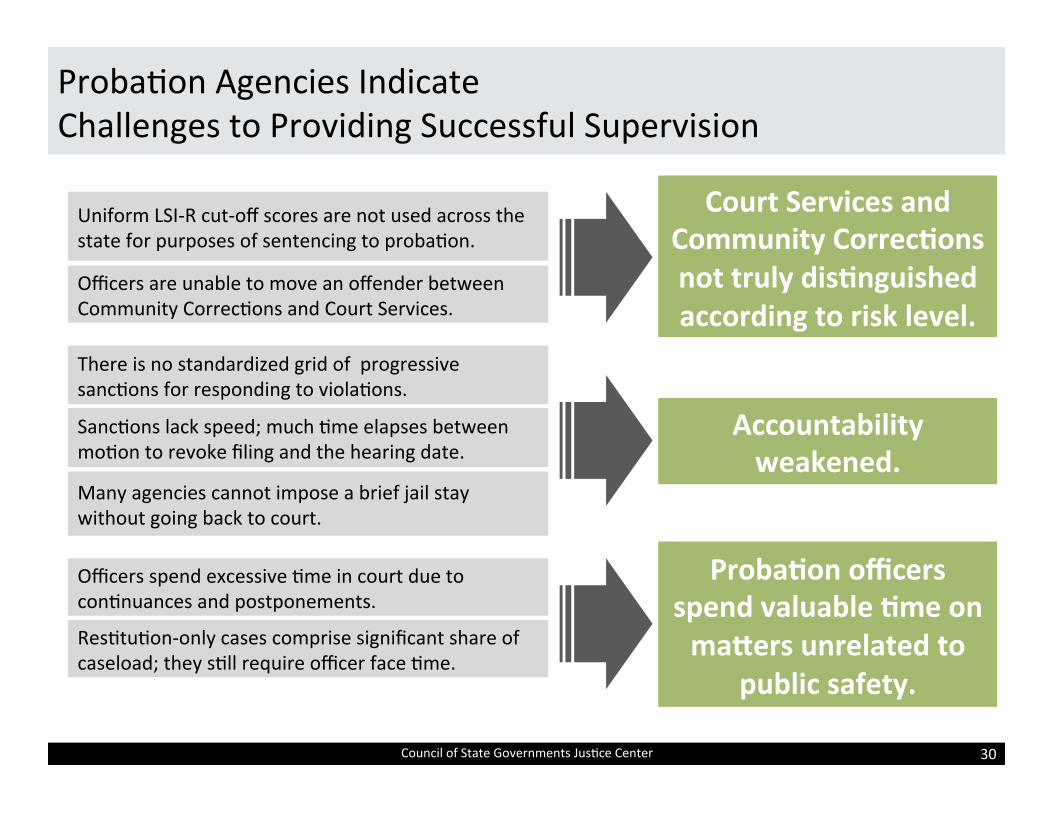
Proba4on Agencies Indicate Challenges to Providing Successful Supervision
Council of State Governments Jus4ce Center 30
Uniform LSI-‐R cut-‐off scores are not used across the state for purposes of sentencing to proba4on.
There is no standardized grid of progressive sanc4ons for responding to viola4ons.
Sanc4ons lack speed; much 4me elapses between mo4on to revoke filing and the hearing date.
Many agencies cannot impose a brief jail stay without going back to court.
Officers spend excessive 4me in court due to con4nuances and postponements.
Officers are unable to move an offender between Community Correc4ons and Court Services.
Res4tu4on-‐only cases comprise significant share of caseload; they s4ll require officer face 4me.
Court Services and Community Correc5ons not truly dis5nguished according to risk level.
Accountability weakened.
Proba5on officers spend valuable 5me on maqers unrelated to
public safety.
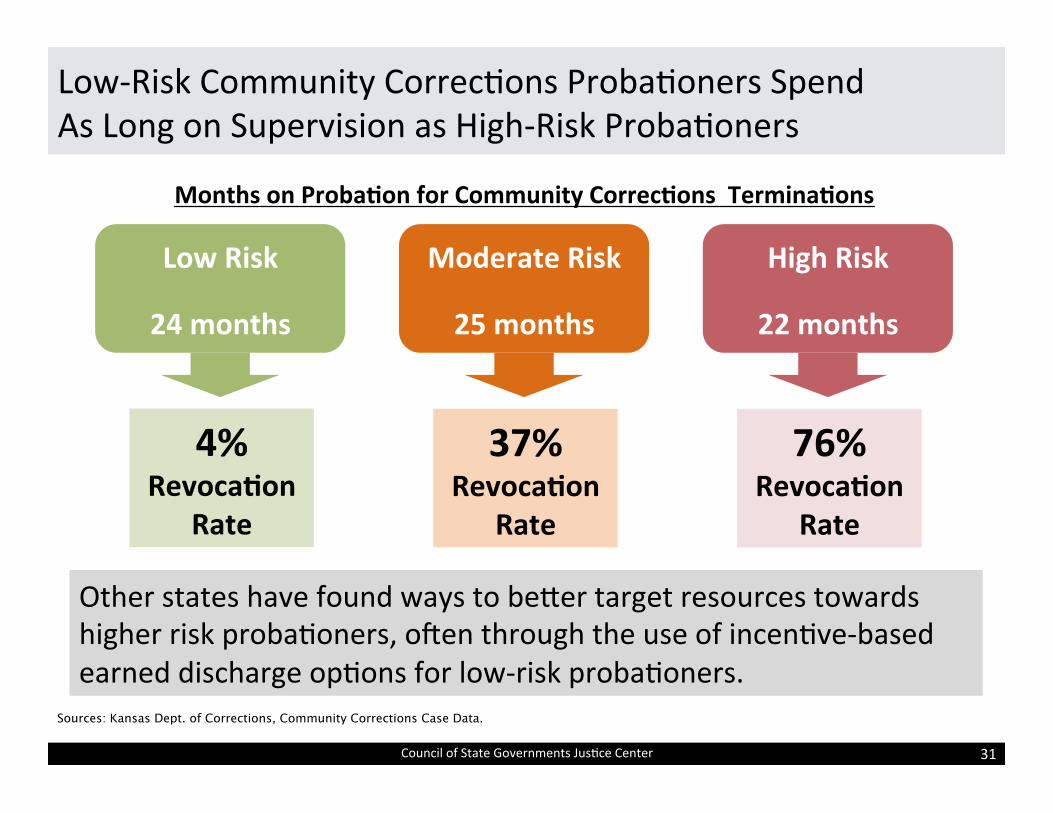
Low-‐Risk Community Correc4ons Proba4oners Spend As Long on Supervision as High-‐Risk Proba4oners
Council of State Governments Jus4ce Center 31
Sources: Kansas Dept. of Corrections, Community Corrections Case Data.
Months on Proba5on for Community Correc5ons Termina5ons
Low Risk
24 months
Moderate Risk
25 months
High Risk
22 months
4% Revoca5on
Rate
76% Revoca5on
Rate
37% Revoca5on
Rate
Other states have found ways to beder target resources towards higher risk proba4oners, omen through the use of incen4ve-‐based earned discharge op4ons for low-‐risk proba4oners.
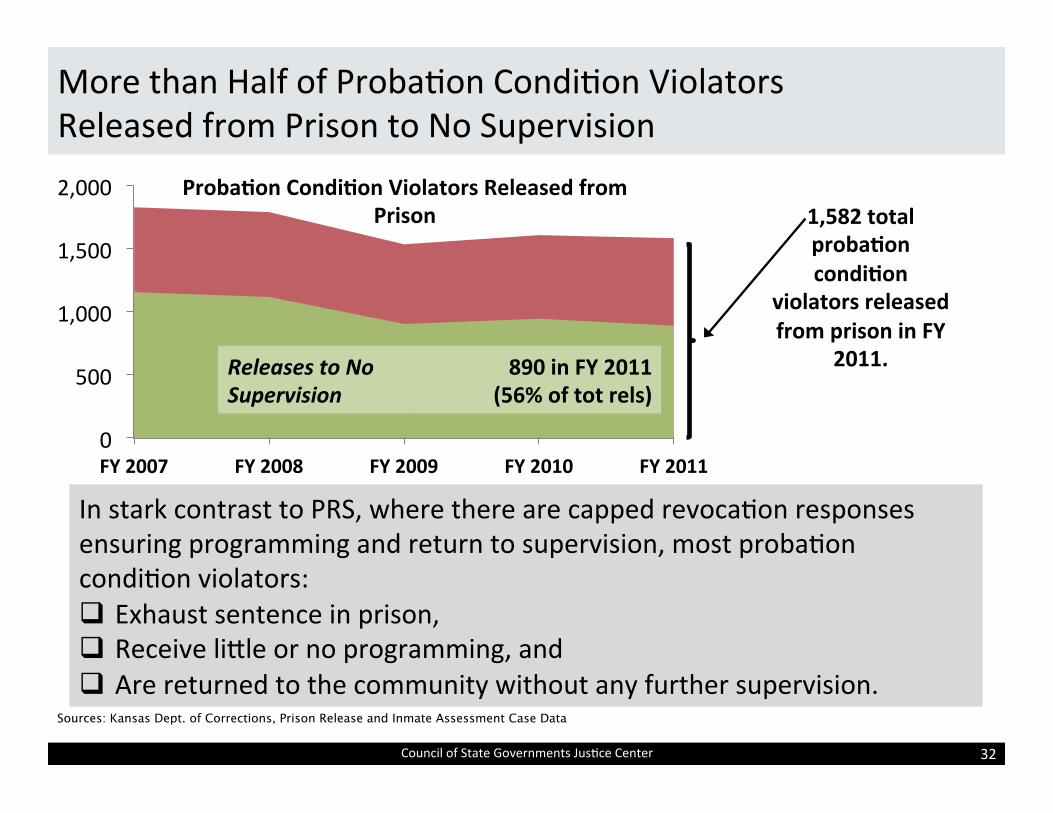
More than Half of Proba4on Condi4on Violators Released from Prison to No Supervision
Council of State Governments Jus4ce Center 32
0
500
1,000
1,500
2,000
FY 2007 FY 2008 FY 2009 FY 2010 FY 2011
Proba5on Condi5on Violators Released from Prison
Releases to No Supervision
890 in FY 2011 (56% of tot rels)
1,582 total proba5on condi5on
violators released from prison in FY
2011.
In stark contrast to PRS, where there are capped revoca4on responses ensuring programming and return to supervision, most proba4on condi4on violators: q Exhaust sentence in prison, q Receive lidle or no programming, and q Are returned to the community without any further supervision.
Sources: Kansas Dept. of Corrections, Prison Release and Inmate Assessment Case Data

Presenta4on Overview
Council of State Governments Jus4ce Center 33
Crime Challenges
Proba4on Under Strain
Reentry and Vic5m Issues

Summary of Reentry-‐Related Findings
Council of State Governments Jus4ce Center 34
Kansas has demonstrated success in reducing recidivism for those released to post-‐release supervision, and there are opportuni4es to expand that success even further.
q Increased delivery of behind-‐the-‐walls programming for those in need and resul4ng reduc4ons in recidivism.
q As with proba4on, supervision resources unnecessarily devoted to low-‐risk PRS popula4on.
q Many obstacles to preserva4on of vic4ms’ interests iden4fied by advocates.
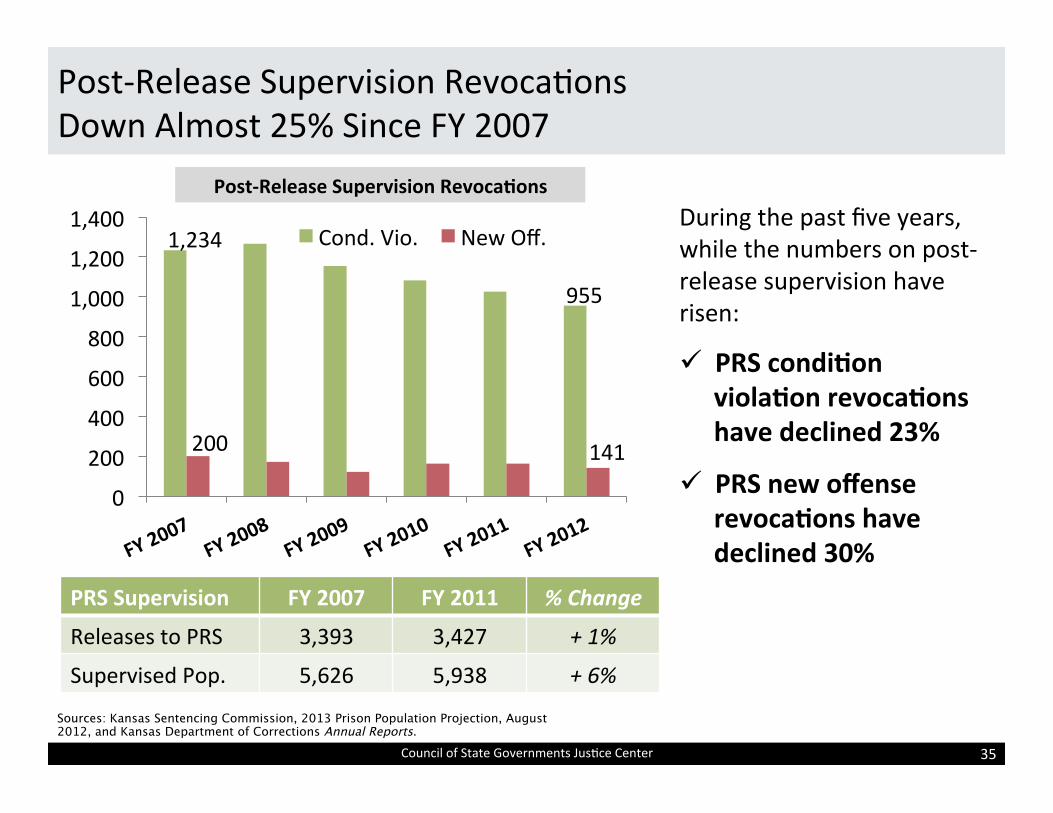
1,234
955
200 141
0
200
400
600
800
1,000
1,200
1,400 Cond. Vio. New Off.
Post-‐Release Supervision Revoca4ons Down Almost 25% Since FY 2007
Council of State Governments Jus4ce Center 35
During the past five years, while the numbers on post-‐release supervision have risen:
ü PRS condi5on viola5on revoca5ons have declined 23%
ü PRS new offense revoca5ons have declined 30%
Post-‐Release Supervision Revoca5ons
PRS Supervision FY 2007 FY 2011 % Change
Releases to PRS 3,393 3,427 + 1%
Supervised Pop. 5,626 5,938 + 6%
Sources: Kansas Sentencing Commission, 2013 Prison Population Projection, August 2012, and Kansas Department of Corrections Annual Reports.

Programming in Prison Has Increased Tenfold Since FY 2007
Council of State Governments Jus4ce Center 36
Prisoners with Behavioral Health Needs Released to Post-‐Release Supervision
FY 2007
1,822 PRS Rels
FY 2009
1,961 PRS Rels
FY 2011
2,006 PRS Rels
6% Received
BH Programming
64% Received
BH Programming
41% Received
BH Programming
Passage of legisla4on to expand and incen4vize par4cipa4on in risk reduc4on programming.
Ideal is to deliver programming to 100% of those in need.
Sources: Kansas Dept. of Corrections, Prison Release and Inmate Assessment Case Data
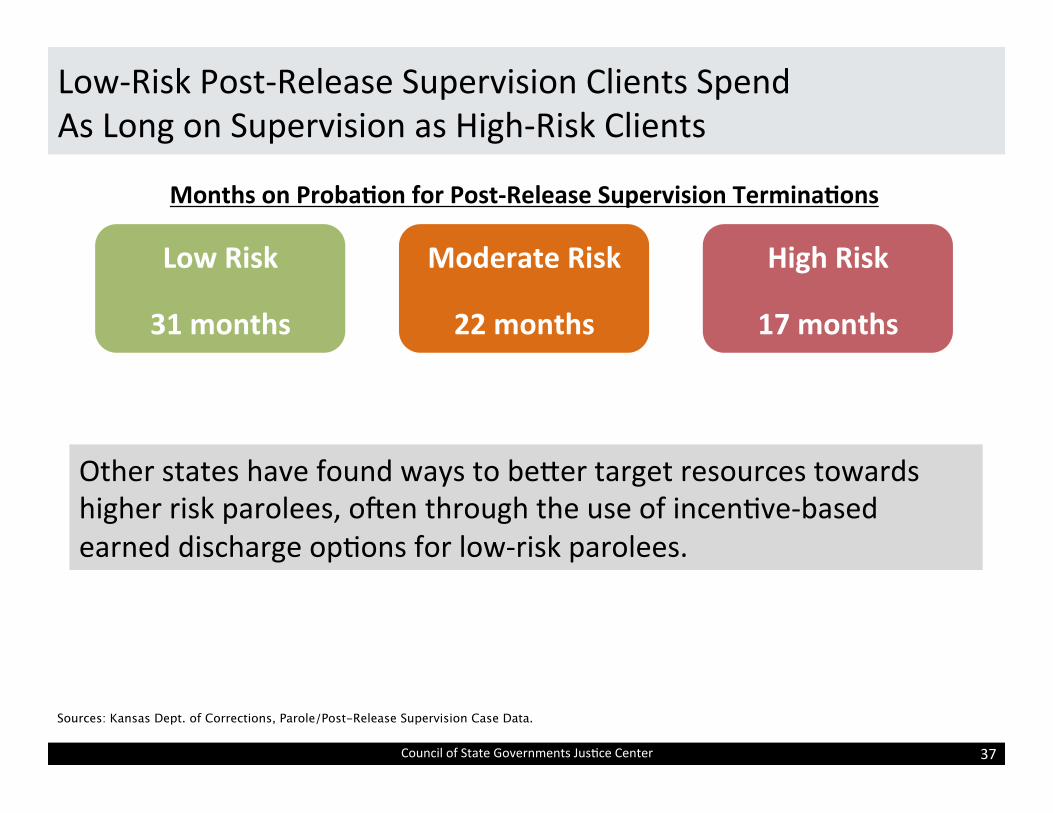
Low-‐Risk Post-‐Release Supervision Clients Spend As Long on Supervision as High-‐Risk Clients
Council of State Governments Jus4ce Center 37
Sources: Kansas Dept. of Corrections, Parole/Post-Release Supervision Case Data.
Months on Proba5on for Post-‐Release Supervision Termina5ons
Low Risk
31 months
Moderate Risk
22 months
High Risk
17 months
Other states have found ways to beder target resources towards higher risk parolees, omen through the use of incen4ve-‐based earned discharge op4ons for low-‐risk parolees.

Vic4m Advocate Feedback
Council of State Governments Jus4ce Center 38
Need to enhance priori4za4on of issues surrounding the crime of domes4c violence
A need to strengthen res4tu4on collec4on
Inadequate vic4m services, especially in rural areas
Insufficient training and oversight of vic4m witness coordinators
No automated vic4m no4fica4on system

Kansas’ Res4tu4on Collec4on Policies Present Opportuni4es for Beder Prac4ces
Council of State Governments Jus4ce Center 39
q Begin collec4ng res4tu4on from inmates earlier than current prac4ce (i.e. before work release).
q Expand funds from which res4tu4on can be collected (i.e. tax return garnishments, other inmate deposits).
q Ensure that parole/PRS officers have easy access to payment history/amount owed.
q Only allow commissary purchases for inmates who are up to date in mee4ng res4tu4on obliga4ons (either in whole or in accordance with a payment plan).

Vic4m-‐Witness Coordinators & DOC Need More Access to Training & Resources for Improving No4fica4on
Council of State Governments Jus4ce Center 40
q Funding for training of vic4m-‐witness coordinators has dwindled as grant funds diminish.
q Vic4m no4fica4on of offender movement is not electronic like most states. Rather, in Kansas it’s typically done through tradi4onal paper mail or phone calls.
q There is lidle consistency across the state regarding the kinds of services a vic4m-‐witness coordinator provides.

Other JR States Have Addressed Issues with Vic4m Res4tu4on, No4fica4on and Services
Council of State Governments Jus4ce Center 41
JR in Ohio
JR in Hawaii
ü Increased funding for vic4m-‐ witness coordinators
ü Improved res4tu4on polices ü Supported an updated vic4m no4fica4on system
ü Called for a Blue Ribbon Commission to study and recommend statewide res4tu4on prac4ces
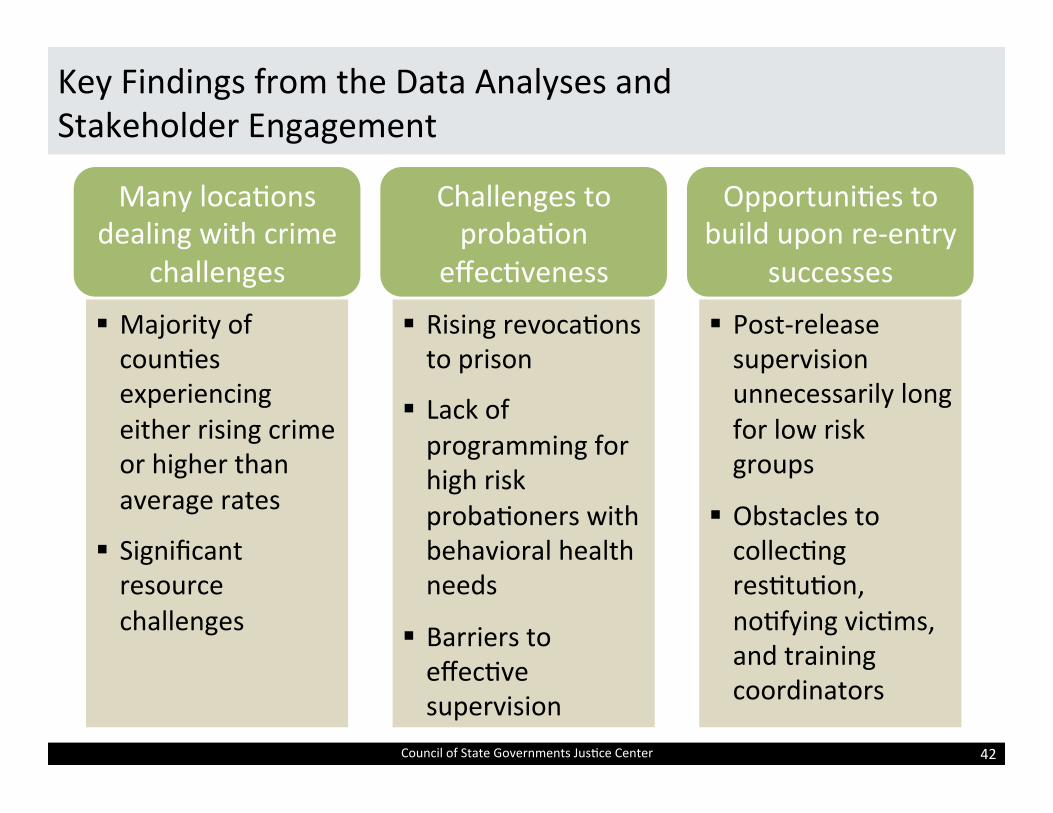
Key Findings from the Data Analyses and Stakeholder Engagement
Council of State Governments Jus4ce Center 42
Many loca4ons dealing with crime
challenges
Opportuni4es to build upon re-‐entry
successes
Challenges to proba4on
effec4veness
§ Post-‐release supervision unnecessarily long for low risk groups
§ Obstacles to collec4ng res4tu4on, no4fying vic4ms, and training coordinators
§ Rising revoca4ons to prison
§ Lack of programming for high risk proba4oners with behavioral health needs
§ Barriers to effec4ve supervision
§ Majority of coun4es experiencing either rising crime or higher than average rates
§ Significant resource challenges

Principles to Guide Development of Policy Framework
Council of State Governments Jus4ce Center 43
1. Focus on the people most likely to commit crime
2. Use programs proven to work and ensure they are high quality
3. Deploy supervision policies and prac4ces that balance sanc4ons and treatment
4. Target places where crime and recidivism rates are the highest
Are valuable supervision resources focused on those who are high risk and needs?
Is there enough programming capacity in the community to promote public safety outcomes?
Does supervision graduate sanc4ons and promote accountability through swim/certain sanc4ons balanced with incen4ves?
Does local law enforcement have the tools it needs to protect community?

Timeline and Next Steps
Council of State Governments Jus4ce Center 44
Date Activity May-June • Data Collection June 6 • Bill Signing June 13 • Working Group Meeting July-October • Detailed Data Analysis
• Stakeholder Engagement September 5 • Working Group Meeting October-November • Policy Framework Development
• Stakeholder Consultation October 29 • Working Group Meeting November-December • Policy Option Vetting December 7 • Working Group Meeting
Appendix of Addi4onal Analyses
Council of State Governments Jus4ce Center 45
Felony Sentencing Trends
Addi5onal Proba5on Analyses

Increase in Guilty Disposi4on Rate Has Yielded More Felony Sentences
Council of State Governments Jus4ce Center 46
2007
Felony Case Filings
19,534
Guilty Disps
14,893
2011
Felony Case Filings
19,608
Guilty Disps
16,041
Yielded 10,750
New Felony Sentences*
Yielded 11,932
New Felony Sentences*
* Unduplicated, most severe punishment, excludes proba4on revoca4ons.
11% increase in new felony sentences
=
Guilty disposi4ons as a percent of all felony filings increased from: q 76% in 2007, to q 82% in 2011.
0.3% growth in filings
Sources: Kansas Judicial Branch, Annual Reports; Kansas Sentencing Commission, Felony Sentencing Case Data.

Large Increase in Number of Offenders Falling in Higher Severity Levels of Grids
Council of State Governments Jus4ce Center 47
Sources: Kansas Sentencing Commission, Felony Sentencing Case Data.
Criminal History
Offe
nse Severity
Presump5ve Prison
Border Box Presump5ve Proba5on
§ 66% of FY 2008 Grid Sentences § 60% of FY 2011 Grid Sentences
-‐ 159 offenders
“Grid” Sentences
§ 25% of FY 2008 Grid Sentences § 29% of FY 2011 Grid Sentences
+ 577 offenders
§ 9% of FY 2008 Grid Sentences § 11% of FY 2011 Grid Sentences
+ 185 offenders
v Net increase of 603 offenders in higher severity levels
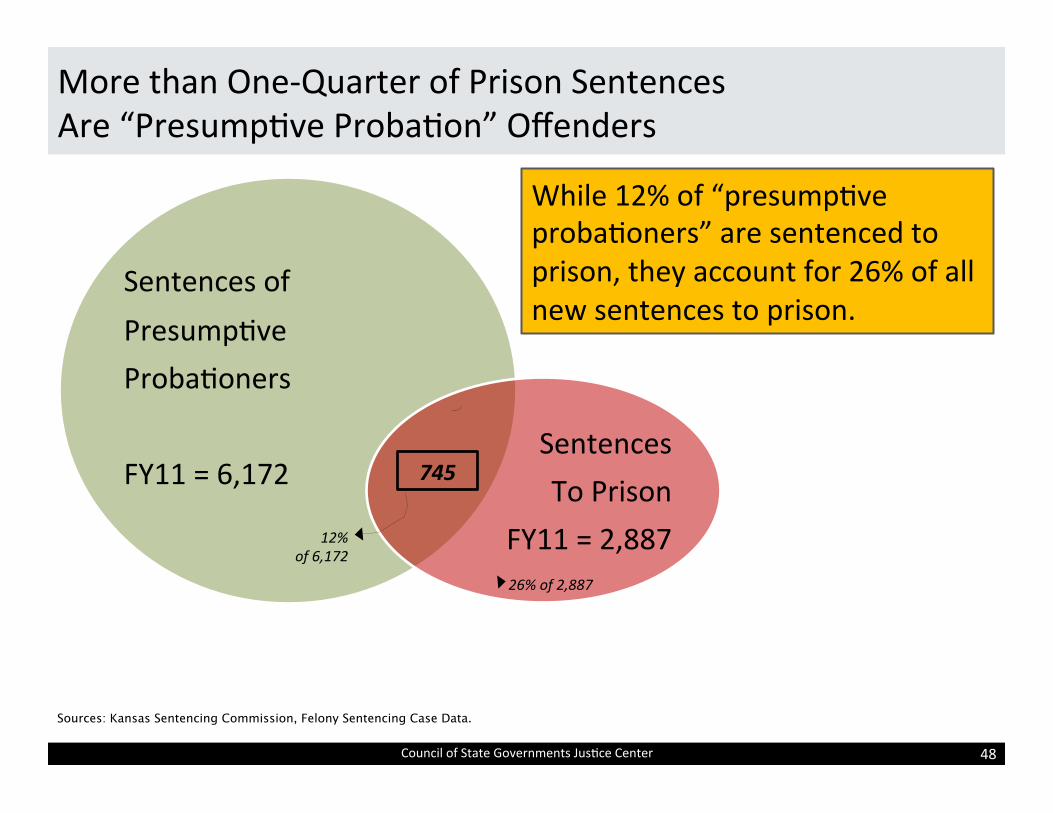
More than One-‐Quarter of Prison Sentences Are “Presump4ve Proba4on” Offenders
Council of State Governments Jus4ce Center 48
Sources: Kansas Sentencing Commission, Felony Sentencing Case Data.
Sentences of Presump4ve Proba4oners FY11 = 6,172
Sentences To Prison
FY11 = 2,887
745
While 12% of “presump4ve proba4oners” are sentenced to prison, they account for 26% of all new sentences to prison.
12% of 6,172
26% of 2,887

Special Rules Largely Account for “Presump4ve Proba4oners” Receiving Prison Sentences
Council of State Governments Jus4ce Center 49
FY 2008 Presump4ve Proba4oners
Sentenced to Prison
610
FY 2011 Presump4ve Proba4oners
Sentenced to Prison
745
78% due to
Special Rule
84% due to
Special Rule
58% of those sentenced under “Special Rule” were sentenced under
SR #9
Commission of offense while already on felony proba4on, parole/post-‐release supervision, condi4onal release, or incarcerated on a felony offense. Court “may” impose prison. However, sentence imposed must be consecu4ve to pre-‐exis4ng case.
Sources: Kansas Sentencing Commission, Felony Sentencing Case Data.
Commission of offense while already on felony proba4on, parole/post-‐release supervision, condi4onal release, or incarcerated on a felony offense. Court “may” impose prison. However, sentence imposed must be consecu4ve to pre-‐exis4ng case.

90% of “Presump4ve Proba4on” Sentences to Prison Involve Nonviolent Offenses
Council of State Governments Jus4ce Center 50
Offense Type
FY 2011 Sentences of Offenders Falling in Presump5ve Proba5on
Total Sentenced # to Prison % to Prison
Total 6,172 745 12% Violent 730 72 10%
Property 2,754 388 14%
Drug 1,654 92 6%
Other 1,034 193 19%
q More than half of the “property” offenses are them.
q The “other” offenses involve escape from custody, obstruc4ng legal process, fleeing or eluding a law enforcement officer (2 or more priors of same), criminal threat, aggravated failure to appear...
VIO
PROP
DRUG
OTH 52%
10%
12%
26%
Sources: Kansas Sentencing Commission, Felony Sentencing Case Data.

Modest Growth in the Number Sentenced to Proba4on
Council of State Governments Jus4ce Center 51
10,338 11,310
7,747 8,270
0
3,000
6,000
9,000
12,000
15,000 New Sentences to Proba5on Misdemeanor proba4on placements have increased 9% since FY07. − All misdemeanor
proba4oners are supervised by Court Services.
Felony proba4on placements have increased 7% since FY07. − About two-‐thirds of felony
proba4oners are supervised by Community Correc4ons.
− The remainder are supervised by Court Services.
Roughly one-‐quarter of felony proba4on sentences involve “presump4ve prison” or “border box” offenders.
Sources: Kansas Sentencing Commission, Felony Sentencing Case Data.
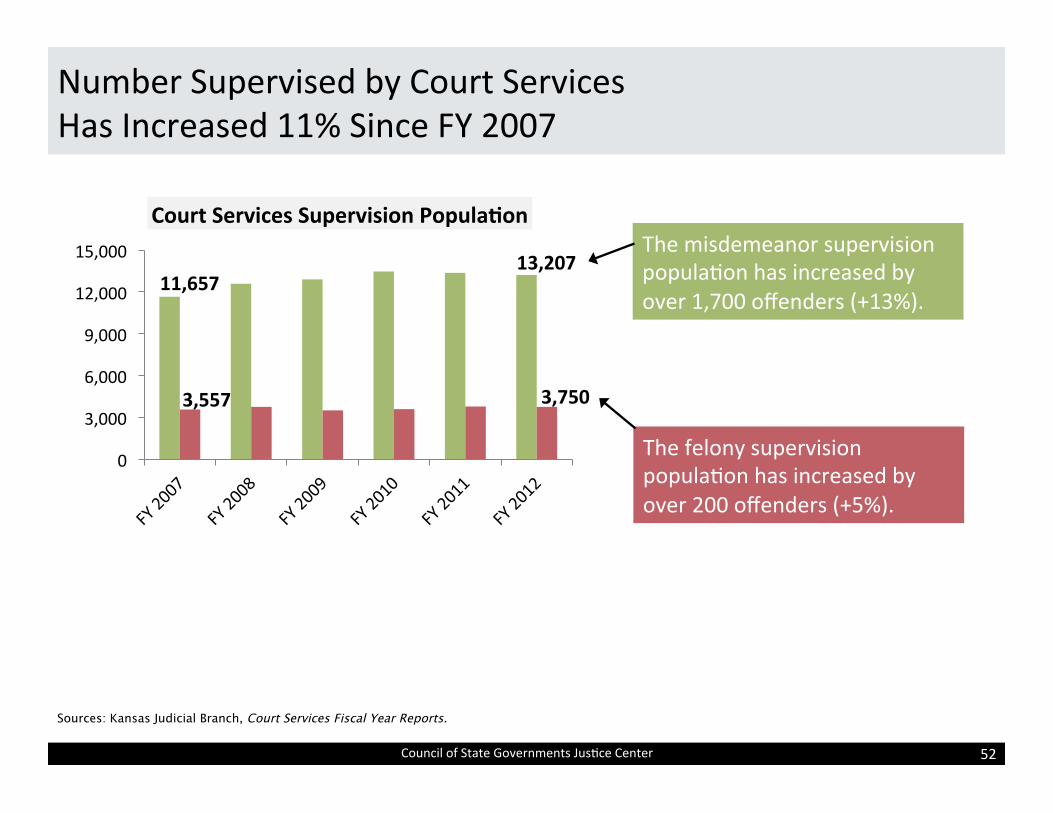
Number Supervised by Court Services Has Increased 11% Since FY 2007
Council of State Governments Jus4ce Center 52
Sources: Kansas Judicial Branch, Court Services Fiscal Year Reports.
0
3,000
6,000
9,000
12,000
15,000
Court Services Supervision Popula5on
3,750 3,557
The felony supervision popula4on has increased by over 200 offenders (+5%).
The misdemeanor supervision popula4on has increased by over 1,700 offenders (+13%).
13,207 11,657
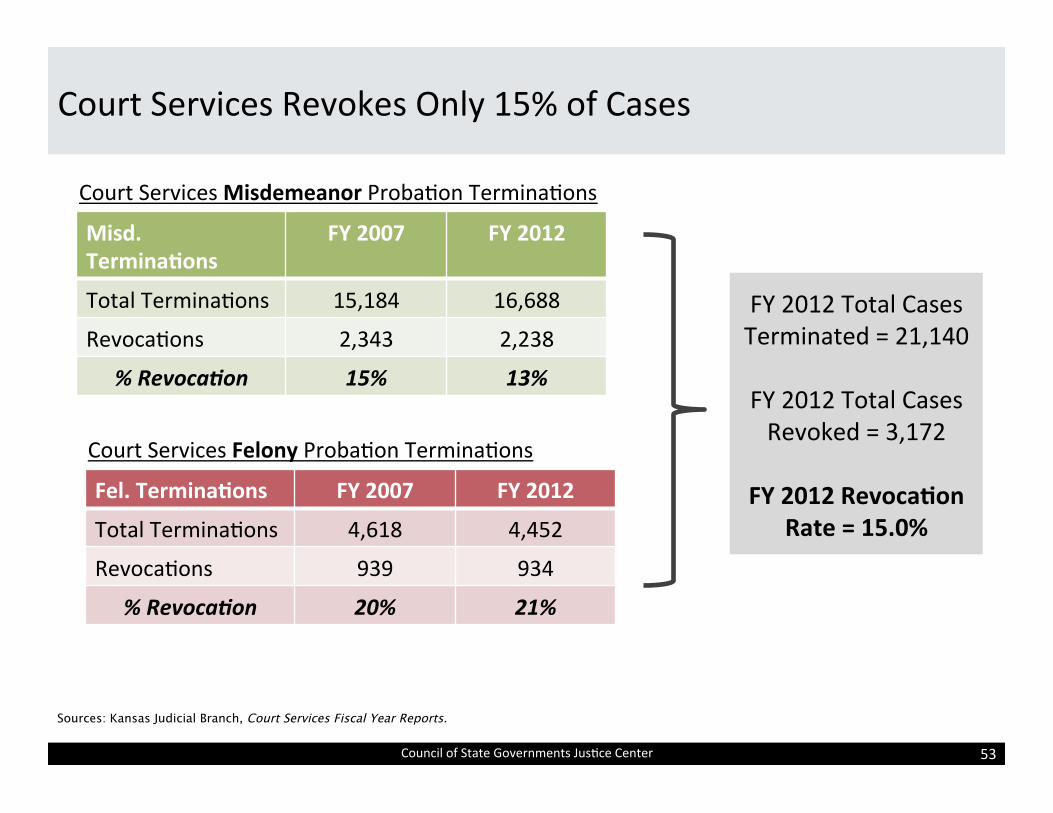
Court Services Revokes Only 15% of Cases
Council of State Governments Jus4ce Center 53
Misd. Termina5ons
FY 2007 FY 2012
Total Termina4ons 15,184 16,688
Revoca4ons 2,343 2,238
% RevocaEon 15% 13%
Court Services Misdemeanor Proba4on Termina4ons
Fel. Termina5ons FY 2007 FY 2012
Total Termina4ons 4,618 4,452
Revoca4ons 939 934
% RevocaEon 20% 21%
Court Services Felony Proba4on Termina4ons
FY 2012 Total Cases Terminated = 21,140
FY 2012 Total Cases Revoked = 3,172
FY 2012 Revoca5on
Rate = 15.0%
Sources: Kansas Judicial Branch, Court Services Fiscal Year Reports.

Community Correc4ons Placements Have Increased Less than 5% Since FY 2007
Council of State Governments Jus4ce Center 54
5,500 5,685
2,000
4,000
6,000
8,000
FY 2007 FY 2008 FY 2009 FY 2010 FY 2011
Community Correc5ons Placements
3.4% growth since FY 2007
Sources: Kansas Dept. of Corrections, Community Corrections Case Data.

Proba4oners Are Spending Almost 20% Longer on Supervision
Council of State Governments Jus4ce Center 55
Sources: Kansas Dept. of Corrections, Community Corrections Case Data.
0 10 20 30
Revs
Success
All Terms
The increased length of supervision does not seem to be related to success or failure on proba4on.
Months on Proba5on for CC Termina5ons
FY07 FY11
FY07 FY11
FY07 FY11
q 19% increase in months on supervision FY07-‐11 − 20mos to 24mos
q 29% increase for “presump4ve proba4oners” − 18mos to 24mos

Number Supervised by Community Correc4ons Has Increased 5% Since FY 2007
Council of State Governments Jus4ce Center 56
Sources: Kansas Department of Corrections Annual Reports.
7,406 7,800
0
2,000
4,000
6,000
8,000
10,000
FY 2006 FY 2010 FY 2012
Community Correc5ons Popula5on Modest growth in Community Correc4ons placements (+3%) and supervised popula4on (+5%) actually mask other, more worrisome underlying trends... ü Increasing revoca4ons
ü Increasing lengths of supervision

Council of State Governments Jus4ce Center 57
Thank You
Anne Beqesworth Policy Analyst, Jus5ce Reinvestment [email protected]
This material was prepared for the State of Kansas. The presenta4on was developed by members of the Council of State Governments Jus4ce Center staff. Because presenta4ons are not subject to the same rigorous review process as other printed materials, the statements made reflect the views of the authors, and should not be considered the official posi4on of the Jus4ce Center, the members of the Council of State Governments, or the funding agency suppor4ng the work.