third state of good repair roundtable term lite update development update and demonstration 1
TRANSCRIPT

Third State of Good Repair Roundtable
TERM Lite Update
Development Update and Demonstration
1

Third State of Good Repair Roundtable
What is TERM? • Transit Economic
Requirements Model – FTA’s Capital Needs Analysis Tool– National level analysis of:
• State of Good Repair backlog• Asset conditions• 20-year projection of
reinvestment needs• Impact of variations in funding
– Supports biennial C&P Report to Congress and related studies
– $5 million in development since 1995
2

Third State of Good Repair Roundtable
The National Surface Transportation Commission examined the condition and future needs of the nation's
surface transportation system
The Rail Modernization Study assessed the investment backlog and capital reinvestment needs of the nine largest rail operators
The National State of Good Repair assessed the investment backlog and capital reinvestment needs of the transit industry
What is TERM? – Related reports
3
Third State of Good Repair Roundtable
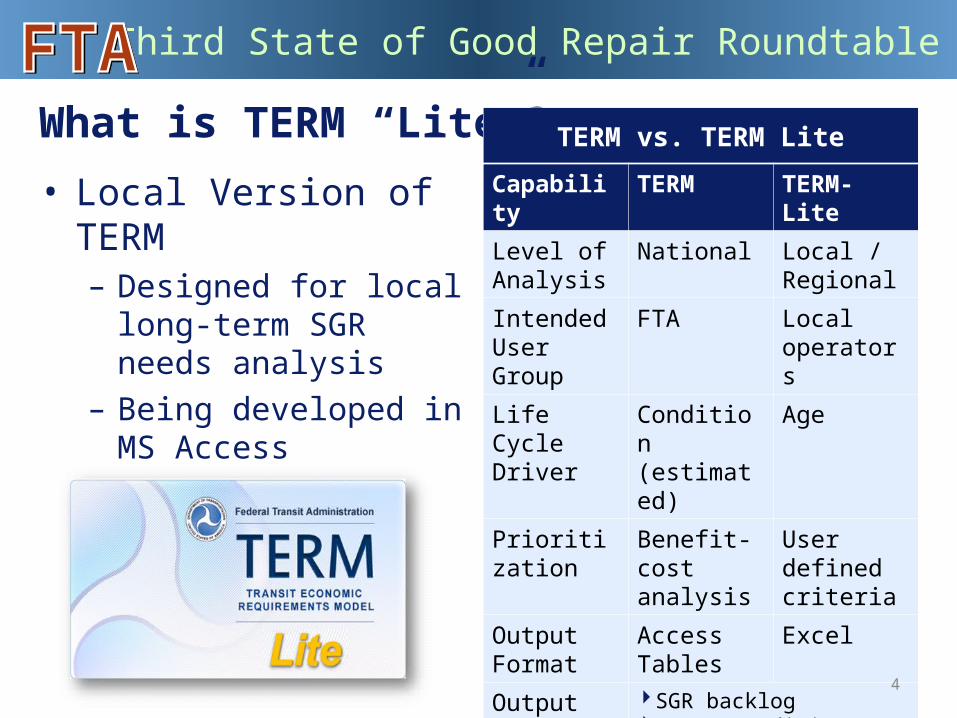
What is TERM “Lite”?
• Local Version of TERM– Designed for local long-
term SGR needs analysis– Being developed in MS
Access– Free through FTA website
TERM vs. TERM Lite
Capability TERM TERM-Lite
Level of Analysis
National Local / Regional
Intended User Group
FTA Local operators
Life Cycle Driver
Condition (estimated)
Age
Prioritization Benefit-cost analysis
User defined criteria
Output Format
Access Tables
Excel
Output (current and forecast)
SGR backlogAsset conditions20-yr reinvestment needs
4
Third State of Good Repair Roundtable
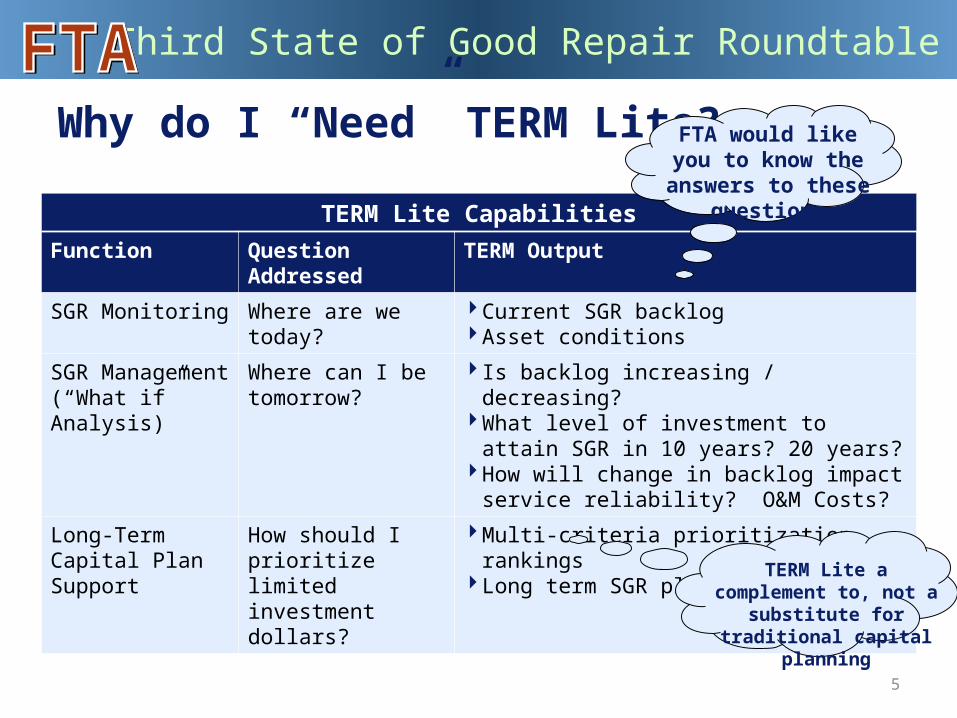
Why do I “Need” TERM Lite?
TERM Lite CapabilitiesFunction Question Addressed TERM Output
SGR Monitoring Where are we today?
Current SGR backlogAsset conditions
SGR Management (“What if” Analysis)
Where can I be tomorrow?
Is backlog increasing / decreasing?What level of investment to attain SGR in 10
years? 20 years?How will change in backlog impact service
reliability? O&M Costs?
Long-Term Capital Plan Support
How should I prioritize limited investment dollars?
Multi-criteria prioritization rankingsLong term SGR plan
FTA would like you to know the answers to
these questions
TERM Lite a complement to, not a substitute for
traditional capital planning
5

Third State of Good Repair Roundtable
• What features do you need?
Ease of use
Local level asset definitions
Investment prioritization
Constructability constraints
Asset to project mappings
Requirements Analysis
• Industry input
Cooperative Development
How is TERM Lite Being Developed?
Chicago RTA
LA Metro
San Francisco MTC
6

Third State of Good Repair Roundtable
What do you need to run TERM Lite?
7
Asset Inventory MS Access(or use executable version)
User Training

Third State of Good Repair Roundtable
How Does TERM Lite Work?What do I own & what
condition is it in?
What would I like to do, how much funding do I have, what are my priorities?
What are my potential backlog, condition and performance outcomes?
SafetyReliabilityPerformanceCost Effective
SafetyReliabilityPerformanceCost Effective
8
Third State of Good Repair Roundtable
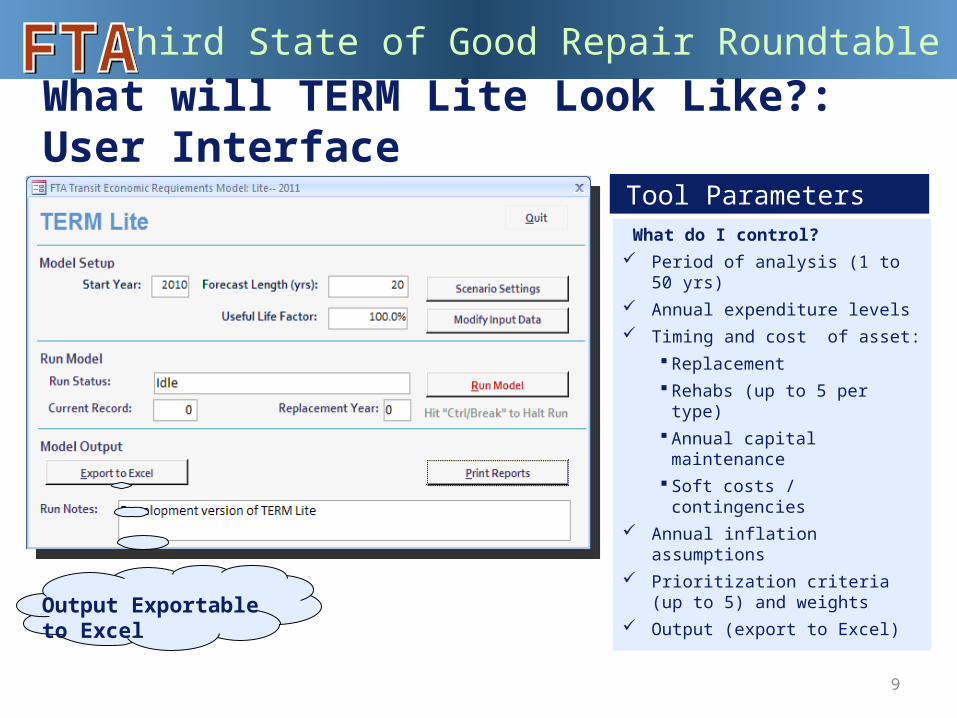
What will TERM Lite Look Like?: User Interface
Tool Parameters What do I control? Period of analysis (1 to 50 yrs) Annual expenditure levels Timing and cost of asset:
Replacement Rehabs (up to 5 per type) Annual capital
maintenance Soft costs / contingencies
Annual inflation assumptions Prioritization criteria (up to 5)
and weights Output (export to Excel)
Output Exportable to Excel
9
Third State of Good Repair Roundtable
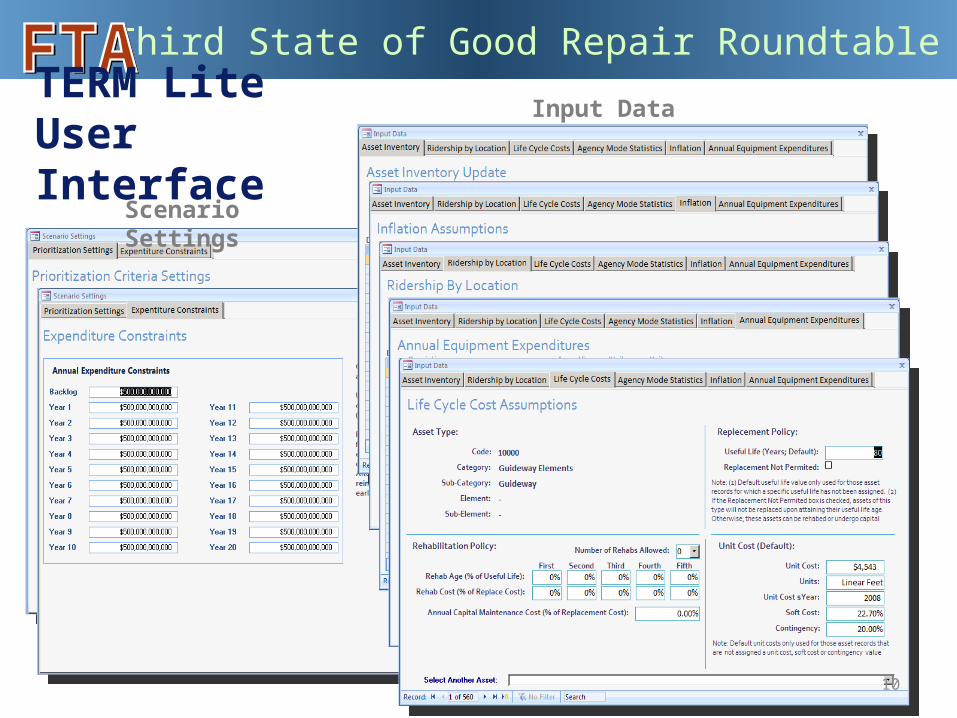
Scenario Settings
Input DataTERM Lite User Interface
10
Third State of Good Repair Roundtable
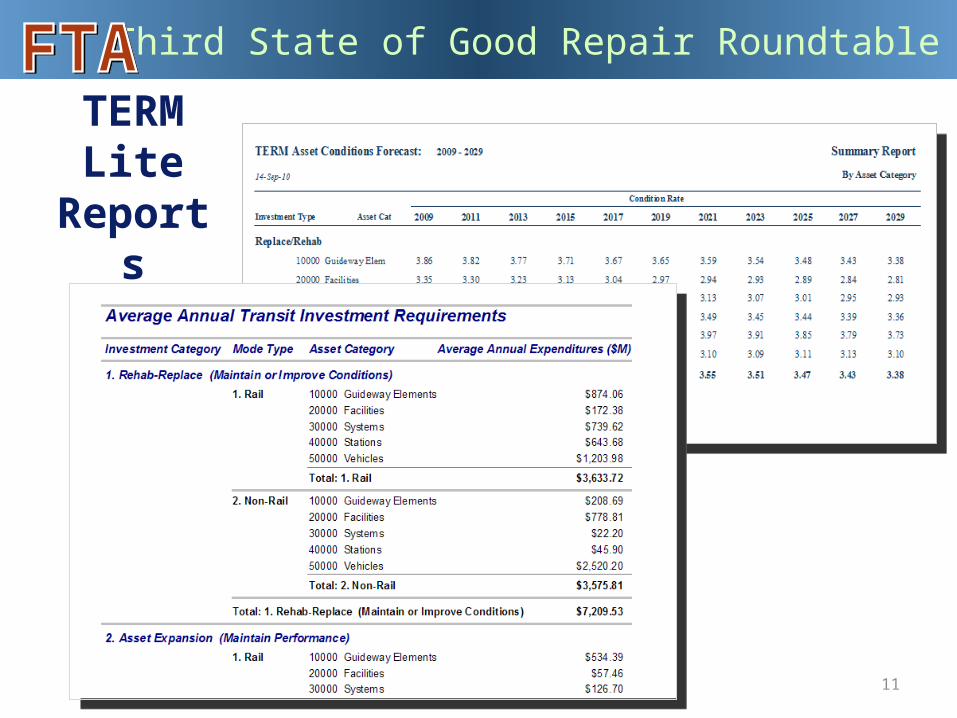
TERM Lite
Reports
11
Third State of Good Repair Roundtable
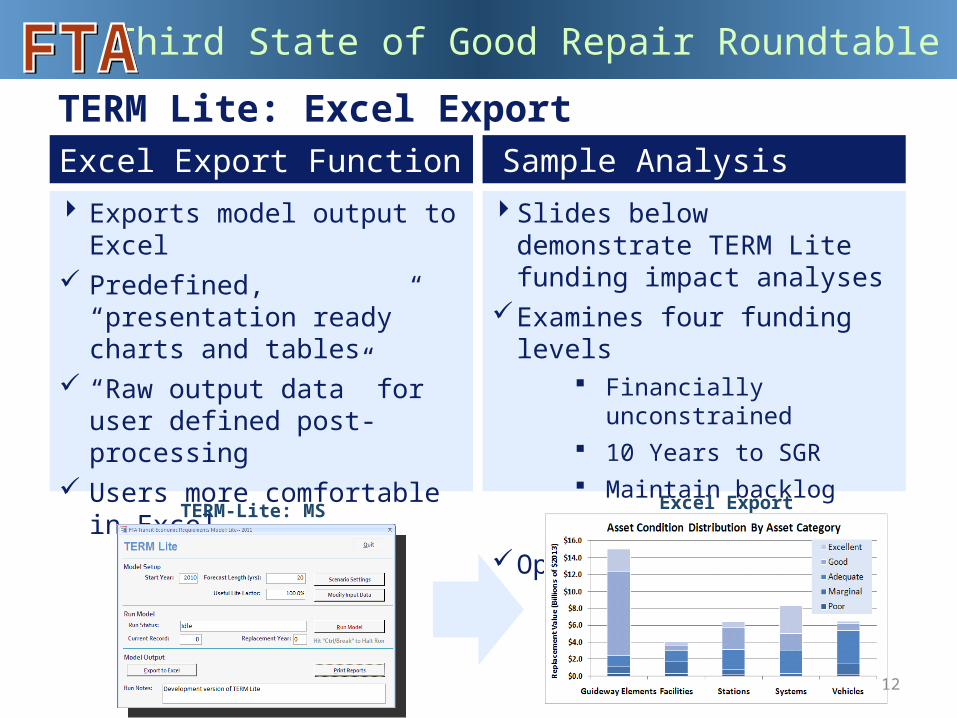
TERM Lite: Excel Export
Slides below demonstrate TERM Lite funding impact analyses
Examines four funding levels Financially unconstrained 10 Years to SGR Maintain backlog Current spending
Operator data
Sample Analysis Exports model output to Excel Predefined, “presentation ready”
charts and tables “Raw output data” for user
defined post-processing Users more comfortable in Excel
Excel Export Function
TERM-Lite: MS Access Excel Export Example
12
Third State of Good Repair Roundtable
$0.0
$5.0
$10.0
$15.0
$20.0
$25.0
SGRB
2013
2014
2015
2016
2017
2018
2019
2020
2021
2022
2023
2024
2025
2026
2027
2028
2029
2030
2031
2032
2033
2034
2035
2036
2037
2038
2039
2040
$Bill
ions
SGR Backlog by Category
Systems
Facilities
Stations
Guideway Elements
Vehicles
Capacity Constrained Fleet Replacement
0%
5%
10%
15%
20%
25%
30%
35%
SGRB
2013
2014
2015
2016
2017
2018
2019
2020
2021
2022
2023
2024
2025
2026
2027
2028
2029
2030
2031
2032
2033
2034
2035
2036
2037
2038
2039
2040
Weig
hted
Aver
age A
sset
Age
Percent of Assets Over Age
All Assets
Replaceable Assets
Non-Replaceable Assets
$0.0
$1.0
$2.0
$3.0
$4.0
$5.0
$6.0
$7.0
2013
2014
2015
2016
2017
2018
2019
2020
2021
2022
2023
2024
2025
2026
2027
2028
2029
2030
2031
2032
2033
2034
2035
2036
2037
2038
2039
2040
Billio
ns of
$YOE
Investment Needs by Category
Systems
Facilities
Stations
Guideway Elements
Vehicles
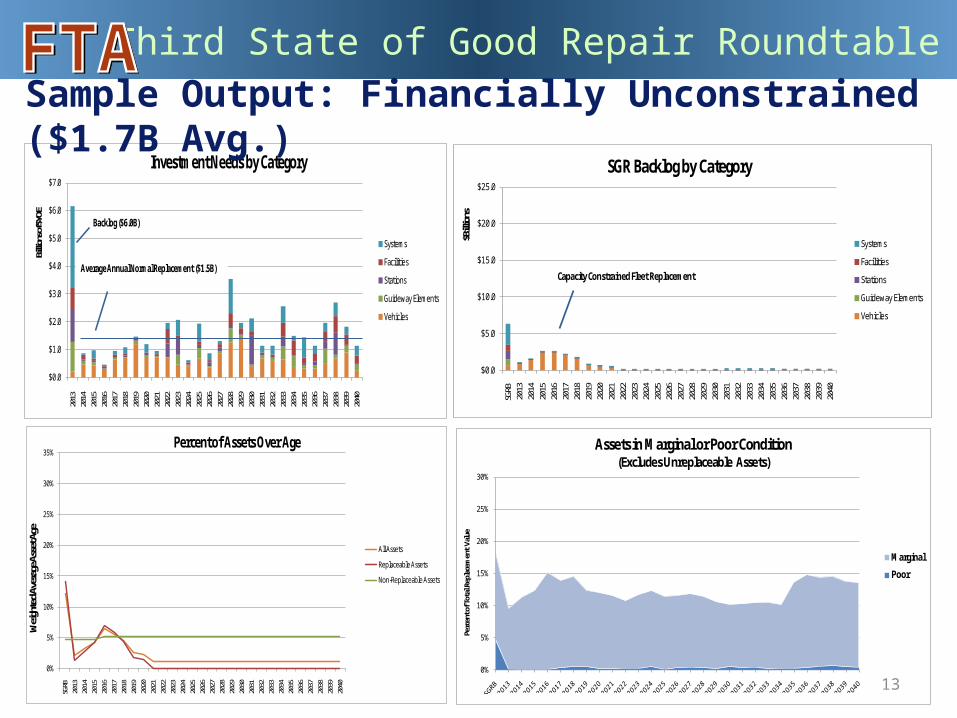
Average Annual Normal Replacement ($1.5B)
Backlog ($6.0B)
Sample Output: Financially Unconstrained ($1.7B Avg.)
0%
5%
10%
15%
20%
25%
30%Pe
rcen
t of T
otal
Repl
acem
ent V
alue
Assets in Marginal or Poor Condition (Excludes Unreplaceable Assets)
Marginal
Poor
13

Third State of Good Repair Roundtable
$0.0
$1.0
$2.0
$3.0
$4.0
$5.0
$6.0
$7.0
2013
2014
2015
2016
2017
2018
2019
2020
2021
2022
2023
2024
2025
2026
2027
2028
2029
2030
2031
2032
2033
2034
2035
2036
2037
2038
2039
2040
Billio
ns of
$YOE
Investment Expenditures by Category
Systems
Facilities
Stations
Guideway Elements
Vehicles
Average Annual Normal Replacement ($1.6B)
$0.0
$5.0
$10.0
$15.0
$20.0
$25.0
SGRB
2013
2014
2015
2016
2017
2018
2019
2020
2021
2022
2023
2024
2025
2026
2027
2028
2029
2030
2031
2032
2033
2034
2035
2036
2037
2038
2039
2040
$Bill
ions
SGR Backlog by Category
Systems
Facilities
Stations
Guideway Elements
Vehicles
0%
5%
10%
15%
20%
25%
30%
35%
SGRB
2013
2014
2015
2016
2017
2018
2019
2020
2021
2022
2023
2024
2025
2026
2027
2028
2029
2030
2031
2032
2033
2034
2035
2036
2037
2038
2039
2040
Weig
hted
Aver
age A
sset
Age
Percent of Assets Over AgeAll Assets
Replaceable Assets
Non-Replaceable Assets
Sample Output: 10 Years to SGR ($1.6B Avg.)
0%
5%
10%
15%
20%
25%
30%Pe
rcen
t of T
otal
Repl
acem
ent V
alue
Assets in Marginal or Poor Condition (Excludes Unreplaceable Assets)
Marginal
Poor
14

Third State of Good Repair Roundtable
0%
5%
10%
15%
20%
25%
30%Pe
rcen
t of T
otal
Repl
acem
ent V
alue
Assets in Marginal or Poor Condition (Excludes Unreplaceable Assets)
Marginal
Poor
$0.0
$5.0
$10.0
$15.0
$20.0
$25.0
SGRB
2013
2014
2015
2016
2017
2018
2019
2020
2021
2022
2023
2024
2025
2026
2027
2028
2029
2030
2031
2032
2033
2034
2035
2036
2037
2038
2039
2040
$Bill
ions
SGR Backlog by Category
Systems
Facilities
Stations
Guideway Elements
Vehicles
0%
5%
10%
15%
20%
25%
30%
35%
SGRB
2013
2014
2015
2016
2017
2018
2019
2020
2021
2022
2023
2024
2025
2026
2027
2028
2029
2030
2031
2032
2033
2034
2035
2036
2037
2038
2039
2040
Weig
hted
Aver
age A
sset
Age
Percent of Assets Over Age
All Assets
Replaceable Assets
Non-Replaceable Assets
Sample Output: Maintain Backlog* ($1.3B Avg.)
$0.0
$1.0
$2.0
$3.0
$4.0
$5.0
$6.0
$7.0
2013
2014
2015
2016
2017
2018
2019
2020
2021
2022
2023
2024
2025
2026
2027
2028
2029
2030
2031
2032
2033
2034
2035
2036
2037
2038
2039
2040
Billio
ns of
$YOE
Investment Expenditures by Category
Systems
Facilities
Stations
Guideway Elements
Vehicles
Average Annual Normal Replacement ($1.3B)
15
* As % of Replacement Value
Third State of Good Repair Roundtable
$0.0
$5.0
$10.0
$15.0
$20.0
$25.0
SGRB
2013
2014
2015
2016
2017
2018
2019
2020
2021
2022
2023
2024
2025
2026
2027
2028
2029
2030
2031
2032
2033
2034
2035
2036
2037
2038
2039
2040
$Bill
ions
SGR Backlog by Category
Systems
Facilities
Stations
Guideway Elements
Vehicles
0%
5%
10%
15%
20%
25%
30%
35%
2010
2010
2011
2012
2013
2014
2015
2016
2017
2018
2019
2020
2021
2022
2023
2024
2025
2026
2027
2028
2029
2030
2031
2032
2033
2034
2035
2036
2037
2038
2039
2040
Weig
hted
Aver
age A
sset
Age
Percent of Assets Over AgeAll Assets
Replaceable Assets
Non-Replaceable Assets
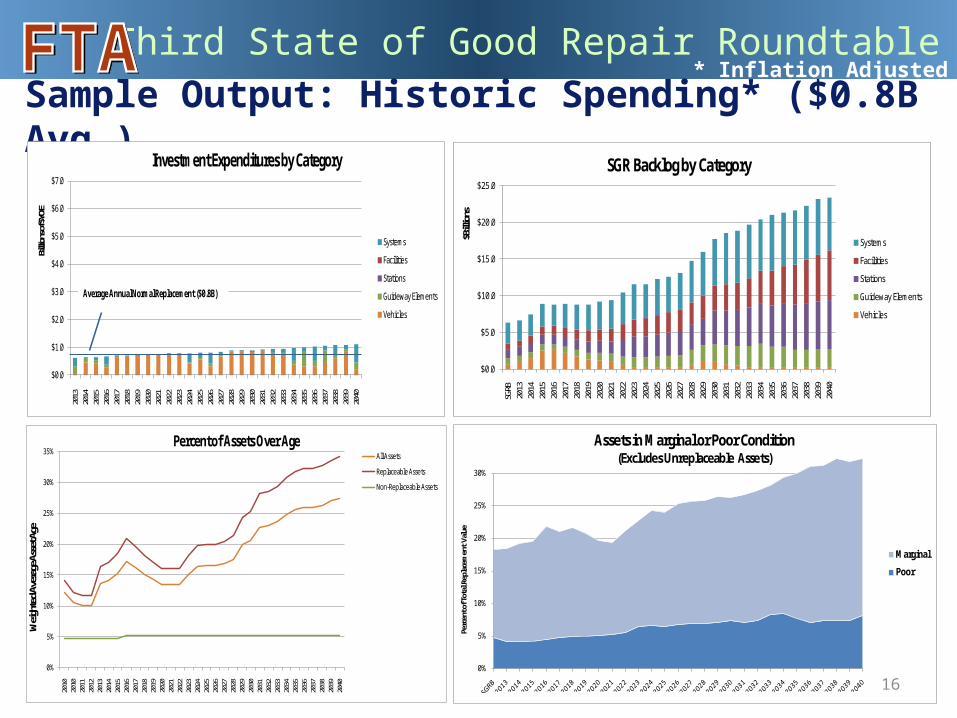
Sample Output: Historic Spending* ($0.8B Avg.)
$0.0
$1.0
$2.0
$3.0
$4.0
$5.0
$6.0
$7.0
2013
2014
2015
2016
2017
2018
2019
2020
2021
2022
2023
2024
2025
2026
2027
2028
2029
2030
2031
2032
2033
2034
2035
2036
2037
2038
2039
2040
Billio
ns of
$YOE
Investment Expenditures by Category
Systems
Facilities
Stations
Guideway Elements
Vehicles
Average Annual Normal Replacement ($0.8B)
0%
5%
10%
15%
20%
25%
30%Pe
rcen
t of T
otal
Repl
acem
ent V
alue
Assets in Marginal or Poor Condition (Excludes Unreplaceable Assets)
Marginal
Poor
16
* Inflation Adjusted
Third State of Good Repair Roundtable
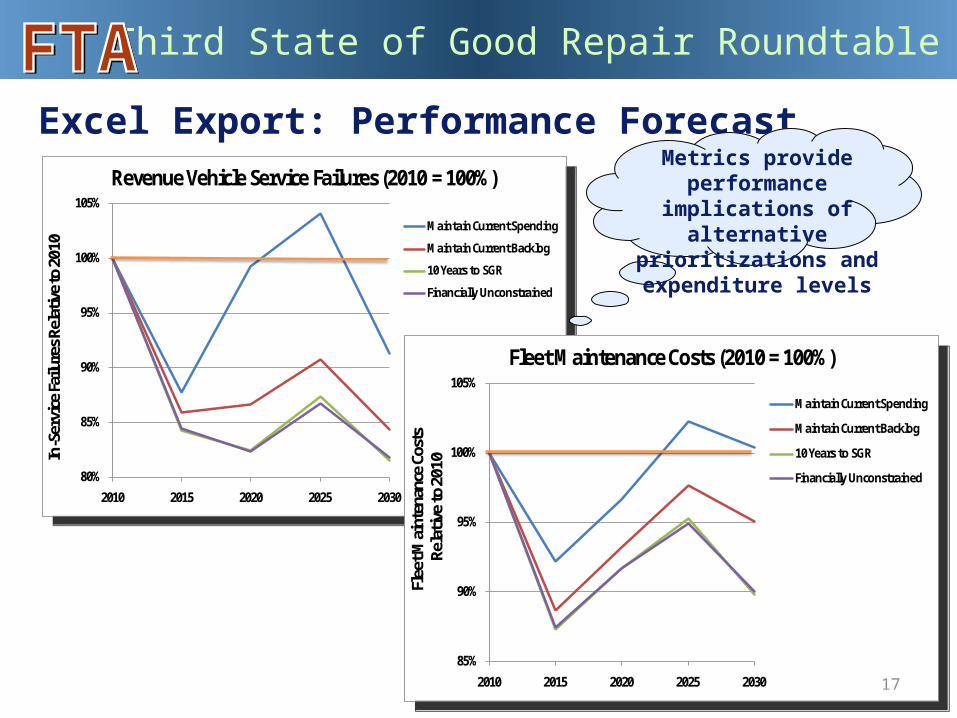
Excel Export: Performance Forecast
80%
85%
90%
95%
100%
105%
2010 2015 2020 2025 2030
In-S
ervi
ce Fa
ilure
s Rel
ative
to 2
010
Revenue Vehicle Service Failures (2010 = 100%)
Maintain Current Spending
Maintain Current Backlog
10 Years to SGR
Financially Unconstrained
80%
85%
90%
95%
100%
105%
2010 2015 2020 2025 2030
In-S
ervi
ce Fa
ilure
s Rel
ative
to 2
010
Revenue Vehicle Service Failures (2010 = 100%)
Maintain Current Spending
Maintain Current Backlog
10 Years to SGR
Financially Unconstrained
85%
90%
95%
100%
105%
2010 2015 2020 2025 2030
Flee
t Mai
nten
ance
Cos
tsRe
lativ
e to
201
0
Fleet Maintenance Costs (2010 = 100%)
Maintain Current Spending
Maintain Current Backlog
10 Years to SGR
Financially Unconstrained
85%
90%
95%
100%
105%
2010 2015 2020 2025 2030
Flee
t Mai
nten
ance
Cos
tsRe
lativ
e to
201
0
Fleet Maintenance Costs (2010 = 100%)
Maintain Current Spending
Maintain Current Backlog
10 Years to SGR
Financially Unconstrained
Metrics provide performance implications of
alternative prioritizations and expenditure levels
17
Third State of Good Repair Roundtable
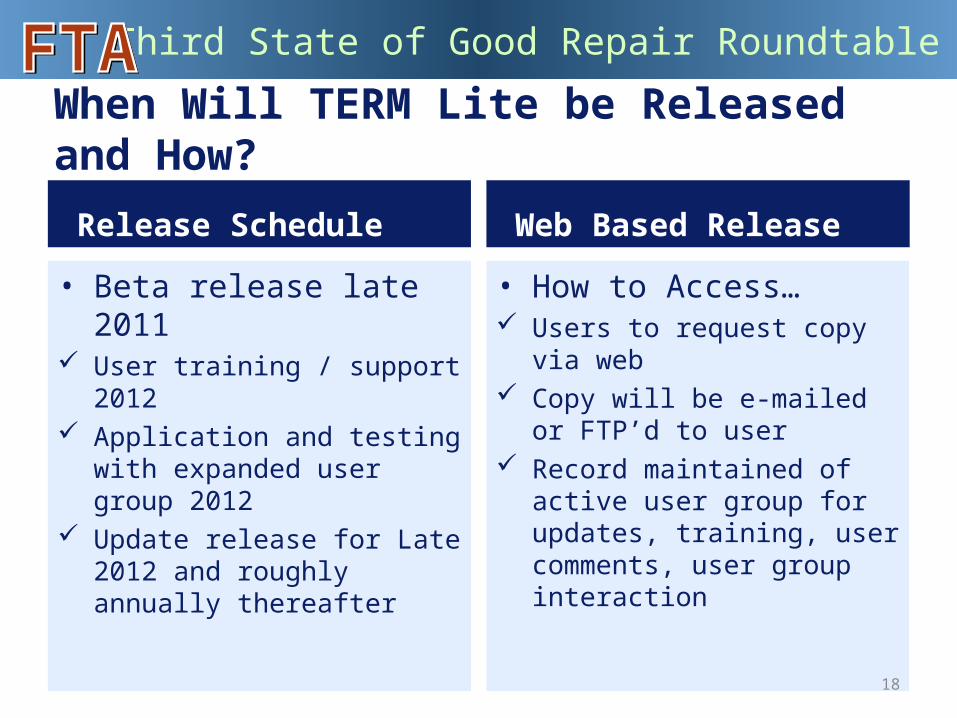
Release Schedule
• Beta release late 2011 User training / support 2012 Application and testing with
expanded user group 2012 Update release for Late 2012 and
roughly annually thereafter
Web Based Release
• How to Access… Users to request copy via web Copy will be e-mailed or FTP’d to
user Record maintained of active user
group for updates, training, user comments, user group interaction
When Will TERM Lite be Released and How?
18
Third State of Good Repair Roundtable
Questions?
19
Keith GatesDirector, Performance Management Office of Budget and Policy Federal Transit [email protected]
Rick LaverLead AssociateBooz Allen Hamilton / CH2M [email protected]