third quarterly report study to determine and … · third quarterly report study to determine and...
TRANSCRIPT

AED R-3562F Issued: April IO, 1970
Third Quarterly Report Study to Determine and Improve Design for Lithium-Doped Solar Cells
Prepared for Jet PropuEsion Laboratory California Institute of Technology Pasadena, California In fulfillment of Contract No. 952555 January 1 to March 31, 1970 Prepared by - G. Brucker, T. Faith, J. Corra, and A. Holmes-Siedle
RCA Corporation I Defense Electronic Products Astro Electronics Division [ Princeton, New Jersey
https://ntrs.nasa.gov/search.jsp?R=19700016218 2018-07-30T01:33:07+00:00Z

AED R-3562F Issued: April IO, 1970
and Improve Design for Lithium-Doped Solar Cells
Prepared for Jet Propulsion Laboratory California Institute of Technology Pasadena, California In fulfillment of Contract No. 952555 January 1 to March 31, 1970 Prepared by G. Brucker, T. Faith, J. Corra, and A. Holmes-Siedle
RCA Corporation I Defense Electronic Products Astro Electronics Division I Princeton, New Jersey
This work was performed for the .k?t Propulsion Laboratory, California Institute of Technology, as sponsored by the National Aeronautics and Space Administration under Contract NAS 7-100.
PREFA
This is the Third Quarterly Report on a program for a "Study to Determine and Improve Design for Lithium-Doped Solar Cells. This report was prepared under Contract No. 952555 for Jet Propulsion Laboratory, Pasadena, California, by the Astro-Electronics Division of RCA, Princeton, New Jersey. The preparation of this report is a contractual requirement covering the period from January 1 to March 31, 1970. The work reported here was conducted by the Radiation Ef- fects group, Manager, Dr. A.G. Holmes-Siedle, of AED, which is located at the RCA Space Center. The Project Supervisor is Dr. A.G. Holmes-Siedle and the Project Scientist is Dr. G. J. Brucker. The Technical Monitor of the program is Mr. Paul Berman of the Solar Power group, Je t Propulsion Laboratory.
ii
STR
This is the Third Quarterly Report on a program to study and analyze the action of lithium in producing a recovery o r spontaneous annealing of radiation damage in bulk silicon and silicon solar cells at room temperature o r below. This pro- gram has technical continuity with the work performed by AED of RCA for J P L on Contract No. 952249. The eventual goal of this effort is to understand the damage and recovery mechanisms os that an optimum set of Solar-cell design rules can be specified.
The test vehicles used for this work are (1) a group of solar cells supplied by JPL, and (2) silicon bars in the "Hall-bar" configuration. The source of particle irradiation being used is a 1-MeV electron beam produced by the RCA Labora- tories Van de Graaff generator.
Some overall conclusions of the present reporting period are as follows: the low- temperature measurements of Hall bars and of solar cells have proved very successful and provided some fruitful insights into the processes occurring in lithium-containing silicon. Correlation of lifetime damage constant K, with the carrier-removal rates , measured as a function of bombardment temperature ( % 80°K to 200°K), has been experimentally demonstrated.
Long-term stability tests at room temperature on lithium-containing crucible- grown cells continue to show these cells to be stable for periods ranging up to 450 days. Most of the crucible cells which have completed their recovery cycles are competitive in power with commercial 10 ohm-cm n/p cells irradiated to the same fluence. For a fluence of 3 x 10¹⁴ e/crn2, the time-to-half-recovery, 8 , of these cells with the exception of T2, T7, and Sb-doped cells is related to the lithium density gradient dNL/dw, through e dNL/dw = 6.5 + 2.5 x lo2' days/cm4 for 1018 5 dNL/dw 5 5 x 10¹⁹ ~ m - ~ . The T2 and T7 cells'recovery rate is faster by a factor of N l o 3 while the Sb-doped cell recovery rate is much slower. Although many of the float-zone and Lopex cells have suffered redegradation, some groups of Lopex cells, notably T6(1) and H7(1), (@I = 3 x 10¹⁴ e/cm2) are competitive with commercial n/p cells approximately 7 months after irradiation.
Cold finger experiments were performed on three (C6C) crucible cells with low lithium density gradient, dNL/dw lithium density gradient, dNL/dw *5 x lo1' ~ m - ~ . Bombardment temperature, TBy dependence of lifetime damage constant, K, , was measured. Both types of cells displayed a saturation of K, at high TB and a decrease at lower tempera- tures in agreement with results previously obtained from carrier removal ex- periments on Hall samples. K, saturated at TB = 120°K for the T9 cells and at TB %105'K for the C6C cells. The saturation values of K,, for a measurement
~ m - ~ , and two T9 Lopex cells with high
iii
temperature, TM, of 200°K were 1.5 x cm2/e-sec for C6C cells and 1.5 x TB = TM = 353OK for the C6C cells was 1 .3 x loq8 cm /e-sec, somewhat above the 8 x lo-' cm2/e-sec value for 1 ohm-cm p/n cells at room temperature. Recovery rate measurements versus annealing temperature showed the activation energy for recovery in the C6C cells to be 1.1 eV which is the activation energy for lithium diffusion in crucible-grown silicon, and that for T9 cells to be 0.65 eV, the activation energy for lithium diffusion in silicon with low-oxygen content. The defect activation energy in the irradiated C6C cells, obtained for lifetime versus temperature measurements, was found to be 0.13 eV. No significant change in this level was observable after cell recovery.
cm2/e-sec in the more heavily doped T9 cells. The damage constant for 2
Diffusion constant measurements made on a quartz-crucible cell (C6C20) show a n activation energy of 1.03 eV indicative of dissociation of LiO' and diffusion of Li'.
Hall and resistivity measurements on samples of float-zone silicon doped with lithium to concentrations of 2 to 5 x 10¹⁴ Li/cm3 and bombarded by electrons indicated the production of a defect located in the forbidden energy gap at an energy of 0.12 eV below the conduction band. This defect was produced at bom- bardment temperatures ranging from 78'K to 200°K. Annealing of these samples at a temperature of 100°C did not remove the defect completely, although the con- centration was reduced. These lightly doped samples exhibited annealing proper- ties and carrier-removal rates (An /B@ = 0.1 cm-1 at TB = 100°K to 200°K) which are similar to those of heavily doped (2 x 1 0 l 6 Li/cm3) quartz-crucible Hall bar samples. The results of the Hall bar experiments suggest that the ratio of oxygen to lithium concentration is an important parameter in determining the annealing properties in lithium-doped silicon. These properties include the stability of both the lithium neutralized and unannealed defect centers, and also the carrier- removal rate for high bombardment temperatures (TB = 100°K to 200OK).
iv
Section
I
Il
111
Iv
V
Page
INTRODUCTION .............................. 1
A . GENERAL ................................ 1
B . TECHNICAL-APPROACH ...................... 1
C . SUMMARY O F PREVIOUS WORK 0 . 0 0 . o o e * * e * . e * 1
LONG-TERM PERFORMANCE OF JPL-FURNISHED CELLS ..................................... 3
A . GENERAL ................................ 3
B . QUARTZ-CRUCIBLE CELLS . . o e e m o o o * o e 3
C . FLOAT-ZONE ANDLOPEXCELLS . . . . . . . . . . . . . . 7
D . NEW C E L L SHIPMENT (NO . 7) . . . . . . . . . . . . . . . . . . 8
LITHIUM DIFFUSION CONSTANT . . . . . . . . . . . . . . . . . . 1 0
SOLAR C E L L EXPERIMENTS ON THE COLD FINGER .................................... 13
A . GENERAL ................................ 13
B . CRUCIBLE-GROWN CELLS (LOT C6C) . . . . . . . . . . . . 1 4
C . L O P E X C E L L S ............................ 1 7
HALL AND RESISTIVITY MEASUREMENTS . . . . . . . . . . . . 20
A . INTRODUCTION ............................ 20
B . CARRIER-REMOVALRATES ................... 20
C . CARRIER DENSITY CHANGES . . . . . . . . . . . . . . . . . . 22
V
VI
T s i
Section
D . ANNEALING . . . . . . . . . . . . . . . . . . . . . . . . . . . . . E . DISCUSSION O F RESULTS . . . . . . . . . . . . . . . . . . . . .
1 . C a r r i e r .Removal . . . . . . . . . . . . . . . . . . . . . . . 2 . C a r r i e r Density Changes . . . . . . . . . . . . . . . . . . . 3 . Annealing Resu l t s . . . . . . . . . . . . . . . . . . . . . . . .
CONCLUSIONS AND FUTURE WORK . . . . . . . . . . . . . . . . . A . GENERAL . . . . . . . . . . . . . . . . . . . . . . . . . . . . . . . . B . SOLAR C E L L STABILITY ..................... C . SOLAR C E L L EXPERIMENTS . . . . . . . . . . . . . . . . . . . D . DIFFUSION CONSTANT MEASUREMENTS . . . . . . . . . . . E . HALL MEASUREMENTS . . . . . . . . . . . . . . . . . . . . . . . F . FUTUREPLANS . . . . . . . . . . . . . . . . . . . . . . . . . . . .
1 . Solar Cel l Studies . . . . . . . . . . . . . . . . . . . . . . . 2 . Diffusion Constant Measuremen t s . . . . . . . . . . . . 3 . Hall Measurements . . . . . . . . . . . . . . . . . . . . . . .
REFERENCES . . . . . . . . . . . . . . . . . . . . . . . . . . . . . . . . BIBLIOGRAPHY . . . . . . . . . . . . . . . . . . . . . . . . . . . . . .
22
28
28 29 30
32
32
32
33
33
34
35
35 35 35
36
37
vi
Figure Page
1
2
3
4
5
6
7
8
9
1 0
11
Normalized Performance Parameters vs Ti.me After Irradiation for Group C5(1) Cells and Group C5(9) Cells 0 0 0 0 6
Time-to-Half-Recovery of Short-circuit Current vs Lithium Density Gradient for Crucible-Grown Cells 0 e 0 0 0 - 0 7
Diffusion Constant of Cell C6C-20(4) v s Inverse Temperature ................................. 11
Lifetime Damage Constant vs Inverse Bombardment Tem- perature for Measurement Temperatures of 200°K and 90°K - Cell C6C-18(2) ................................ 15
Reciprocal Fraction of Damage Remaining v s Time After Irradiation at 373'K (Recovery Curve for Cells C6C-17(1) andC6C-18(1) ................................ 1 6
Recovery Slope and Lithium Diffusion Constant vs Inverse Annealing Te.mperature (Recovery Activation Energy for Crucible-Grown Cells C6C-17(1) and C6C-18(1) . . . . . . . . . 16
Lifetime Damage Constant vs Inverse Bombardment Tem- perature for Measurement Temperatures of 2OO0K and 90°K - Cells T9-14 and T9-16 .......................... 18
Recovery Slope and Lithium Diffusion Constant vs Inverse Annealing Temperature (Recovery Activation Energy for Lopex Cells T9-14 and T9-16) ..................... 18
Carrier-Removal Rates v s Reciprocal Bombardment Tem- perature for Float-Zone Silicon Irradiated by 1-MeV Electrons (Measured at TM = 78'K) . . . . . . . . . . . . . . . . . . 2 1
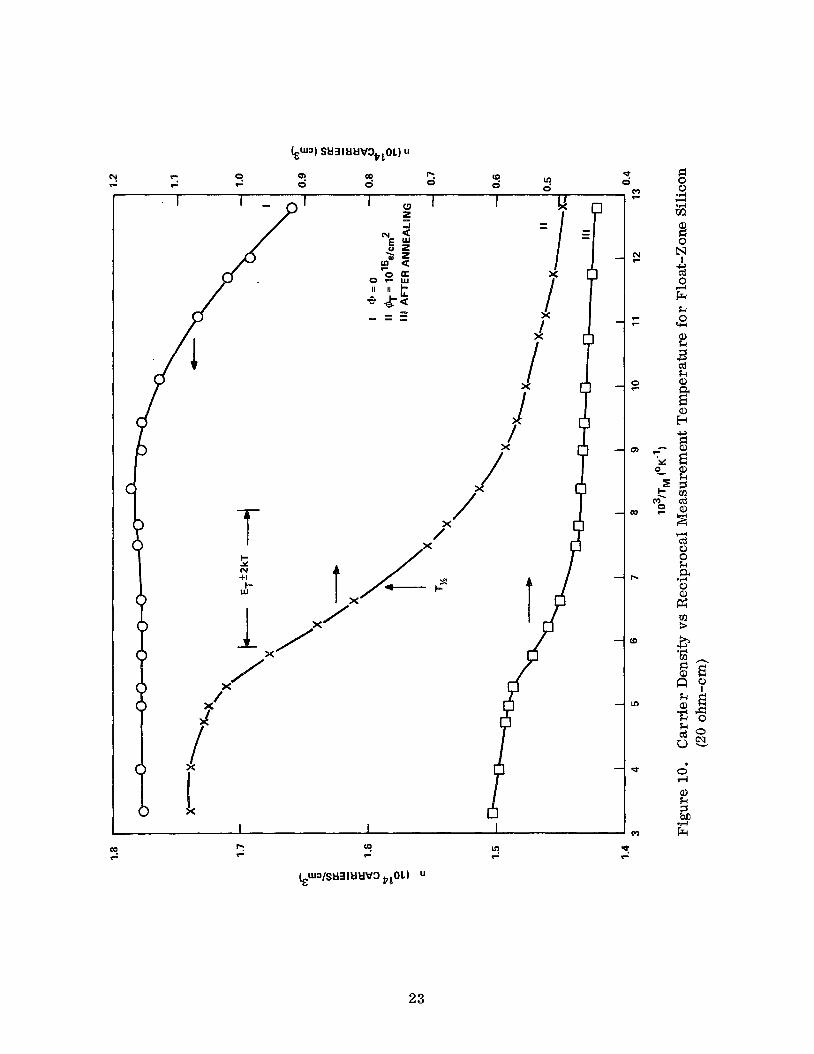
Carrier Density vs Reciprocal Measurement Temperature for Float-Zone Silicon (20 ohm-cm) .................... 23
Carrier Density vs Reciprocal Measurement Temperature for Float-Zone Silicon (20 ohm-cm) . ., + . - e e . . e e . 24
vii

Figure Page
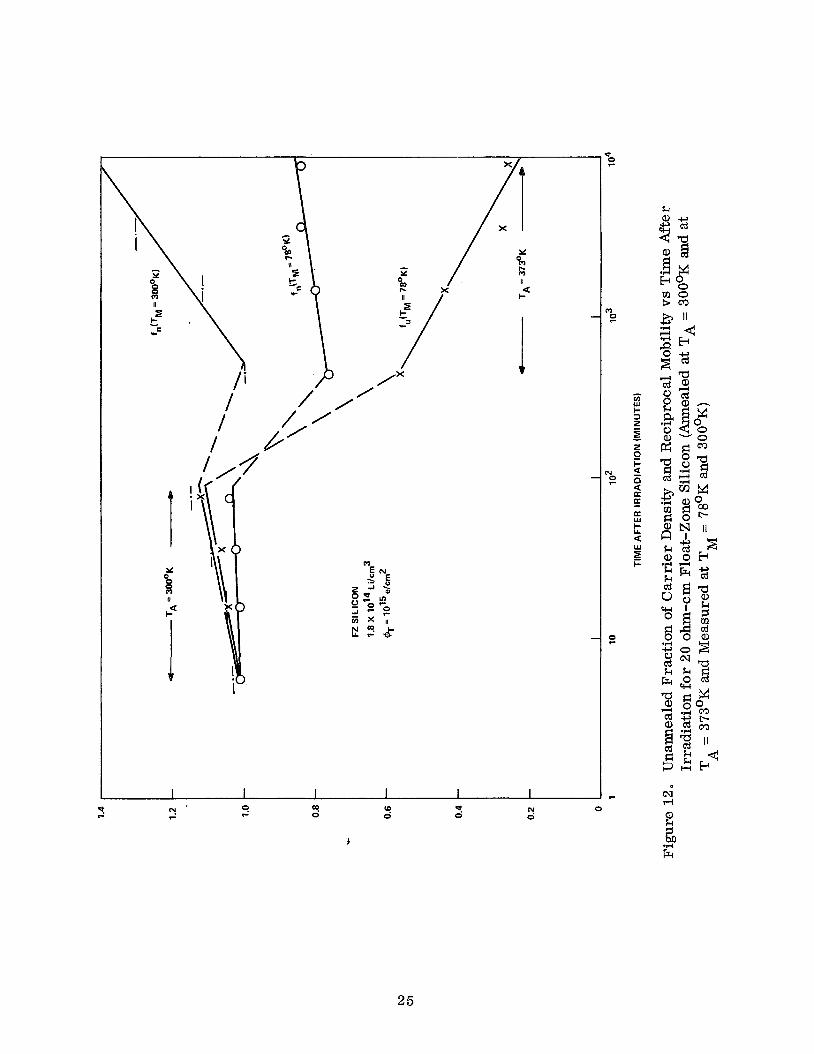
12 Unannealed Fraction of Carrier Density and Reciprocal Mobility vs Time After Irradiation for 20 ohm-cm Float- Zone Silicon (Annealed ai TA = 300°K and at TA = 373'K and Measured at T = 78OK and 300°K) . . . . . . . . . . . . . . . . 25 M
13 Unannealed Fraction of Carrier Density and Reciprocal Mobility vs Time After Irradiation for 0.3 ohm-cm Quartz- Crucible and 20 ohm-cm Float-Zone Silicon (Annealed at TA = 373'K and Measured at TM . 78% and 300°K) ........ 27
14 Unannealed Fraction of Carrier Density and Reciprocal Mobility vs Time After Irradiation for 0.3 ohm-cm Quartz- Crucible Silicon (Annealed at TA = 300°K and Measured at T = 78'Kand 300°K) ............................ 28 M
Table
TABLE
Page
I Properties and Performance of Crucible-Grown Lithium Cells and Comparisons with Commercial 10 ohm-cm n/pCells .................................... 4
viii
A. GENERAL
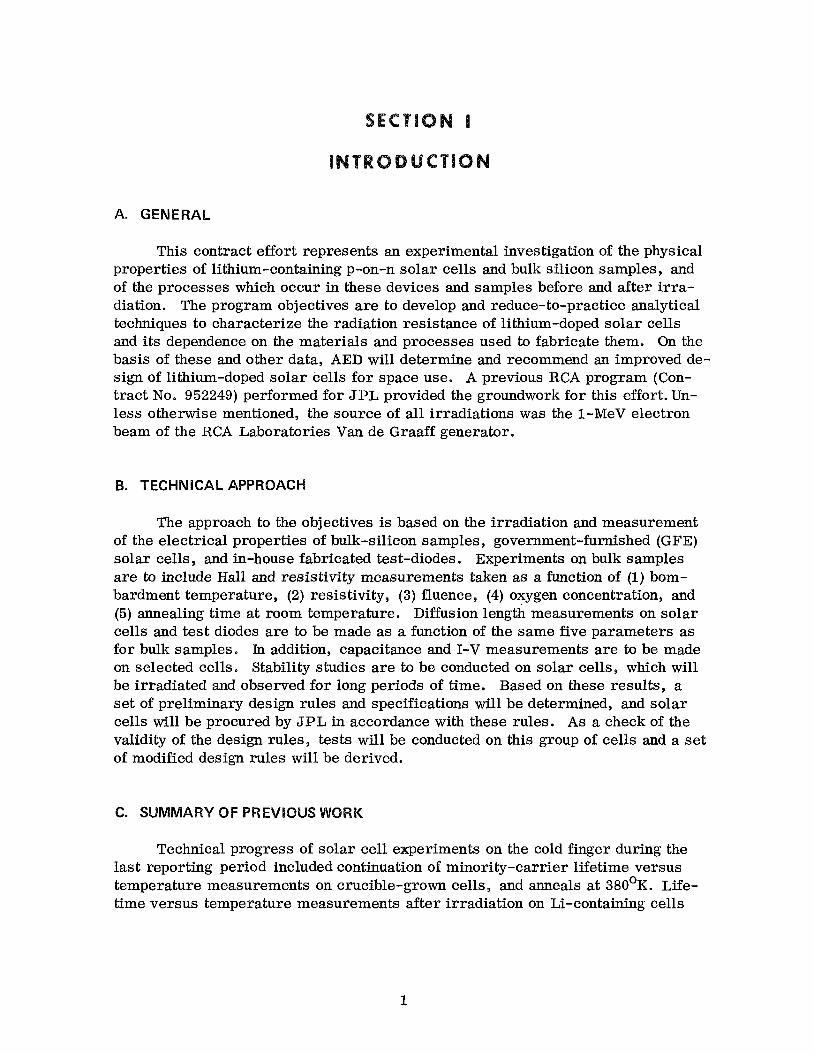
This contract effort represents an experimental investigation of the physical properties of lithium-containing p-on-n solar cells and bulk silicon samples and of the processes which occur in these devices and samples before and after irra- diation. The program objectives are to develop and reduce-to-practice analytical techniques to characterize the radiation resistance of lithium-doped solar cells and its dependence on the materials and processes used to fabricate them. On the basis of these and other data, AED will determine and recommend an improved de- sign of lithium-doped solar cells for space use. A previous RCA program (Con- tract No. 952249) performed for JPL provided the groundwork for this effort. Un- less otherwise mentioned, the source of all irradiations was the 1-MeV electron beam of the RCA Laboratories Van de Graaff generator.
B. TECHNICAL APPROACH
The approach to the objectives is based on the irradiation and measurement of the electrical properties of bulk-silicon samples , government-furnished (GFE) solar cells and in-house fabricated test-diodes. Experiments on bulk samples are to include Hall and resistivity measurements taken as a function of (1) bom- bardment temperature, (2) resistivity? (3) fluence, (4) oxygen concentration, and (5) annealing time at room temperature. Diffusion length measurements on solar cells and test diodes are to be made as a function of the same five parameters as for bulk samples. In addition, capacitance and I-V measurements are to be made on selected cells. Stability studies are to be conducted on solar cells, which will be irradiated and observed for long periods of time. Based on these results, a set of preliminary design rules and specifications will be determined, and solar cells will be procured by JPL in accordance with these rules. As a check of the validity of the design rules, tests will be conducted on this group of cells and a set of modified design rules will be derived.
c. s
Technical progress of solar cell experiments on the cold finger during the last reporting period included continuation of minority-carrier lifetime versus temperature measurements on crucible-grown cells and anneals at 380°K. Life- time versus temperature measurements after irradiation on Li-containing cells
1
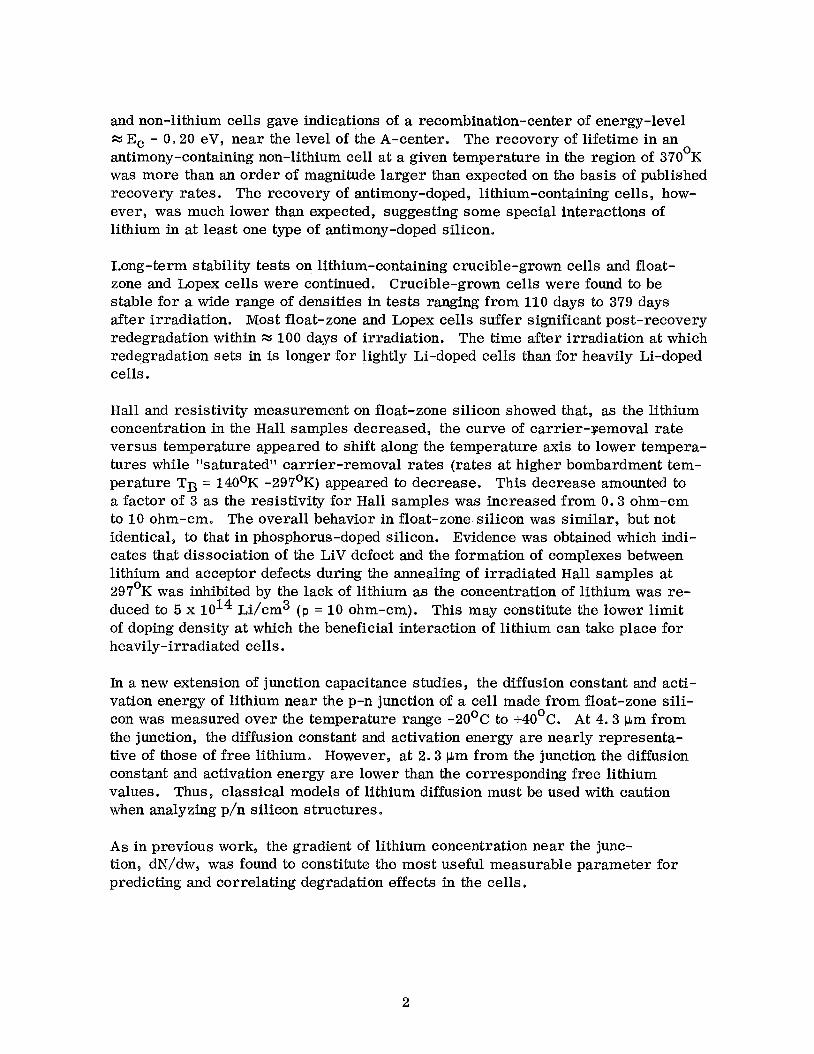
and non-lithium cells gave indications of a recombination-center of energy-level % E c - 0.20 eV, near the level of the A-center. The recovery of lifetime in an antimony-containing non-lithium cell at a given temperature in the region of 370 K was more than an order of magnitude larger than expected on the basis of published recovery rates. The recovery of antimony-doped, lithium-containing cells, how- ever, was much lower than expected, suggesting some special interactions of lithium in at least one type of antimony-doped silicon.
0
Long-term stability tests on lithium-containing crucible-grown cells and float- zone and Lopex cells were continued. Crucible-grown cells were found to be stable for a wide range of densities in tests ranging from 110 days to 379 days after irradiation. Most float-zone and Lopex cells suffer significant pos t-recovery redegradation within % 100 days of irradiation. The time after irradiation at which redegradation sets in is longer for lightly Li-doped cells than for heavily Li-doped cells.
Hall and resistivity measurement on float-zone silicon showed that, as the lithium concentration in the Hall samples decreased, the curve of carrier-Femoval rate versus temperature appeared to shift along the temperature axis to lower tempera- tures while "saturated1' carrier-removal rates (rates at higher bombardment tem- perature TB = 140°K -297'K) appeared to decrease. This decrease amounted to a factor of 3 as the resistivity for Hall samples was increased from 0.3 ohm-cm to 10 ohm-cm. The overall behavior in float-zone.silicon was similar, but not identical, to that in phosphorus -doped silicon. Evidence was obtained which indi- cates that dissociation of the LiV defect and the formation of complexes between lithium and acceptor defects during the annealing of irradiated Hall samples at 297'K was inhibited by the lack of lithium as the concentration of lithium was re- duced to 5 x l O I 4 Li/cm3 (p = 10 ohm-cm). This may constitute the lower limit of doping density at which the beneficial interaction of lithium can take place for heavily-irradiated cells.
In a new extension of junction capacitance studies, the diffusion constant and acti- vation energy of lithium near the p-n junction of a cell made from float-zone sili- con was measured over the temperature range -2OOC to +4OoC. At 4.3 pm from the junction, the diffusion constant and activation energy are nearly representa- tive of those of free lithium. However, at 2.3 ym from the junction the diffusion constant and activation energy are lower than the corresponding free lithium values. Thus, classical models of lithium diffusion must be used with caution when analyzing p/n silicon structures e
A s in previous work, the gradient of lithium concentration near the junc- tion, dN/dw, was found to constitute the most useful measurable parameter for predicting and correlating degradation effects in the cells.
2

A. GENERA
In the previous contract, 5 shipments of lithium cells were received from JPL. The cells were manufactured by T. I. from a wide variety of silicon stock with varying lithium introduction conditions. Several competitive 10 ohm-em n/p commercial solar cells were supplied for comparison purposes. Investigation of these cells has been carried over into the present contract. Tests performed on the cells included measurements of photo- voltaic I-V characteris tic under Tungs ten illumination, p/n junction characteris- tics in the dark, reverse-bias capacitance characteris tics , and minority-carrier diffusion length in the base region. Tungsten I-V characteristics were measured with a power density of 140 mW/cm2 incident on the cell surface. Cell tempera- ture was maintained at 28OC by water and forced-air cooling. These measurements have long term reproducibility of approximately 2 percent. During the previous year, cells of shipments No. 1, 2, and 3 had been irradiated at room temperature by 1-MeV electrons to one of three fluences: 1 x 10¹⁴ e/cm2, 5 x 10¹⁴ e/m2, or 3 x 10¹⁵ e/crn2. During the present contract, cells from shipments No. 4, 5, and 6 were irradiated to one of two fluences: 3 x 10¹⁴ e/cm2 or 3 x 10¹⁵ e/cmz. In the case of shipments 3 to 6 several cells from each lot were left unirradiated for other experiments and to test the stability of unirradiated lithium cells.
(T), Heliotek, (H) and Centralab (C)
In this section the cells will be discussed according to the type of silicon from which they were made: high-oxygen content crucible-grown cells in part B, and low-oxygen content float-zone and Lopex cells in part C. A short discussion of a new cell shipment (Shipment No. 7) is given in part D.
B. QUARTZ-CRUC
The crucible cell groups are listed in Table I which is divided into three parts according to fluence: (a) I = 1 x 10¹⁴ e/cm2, (b) I = 3 to 5 x 10¹⁴ e/cm2*, and (e) @ = 3 x 10¹⁵ e/cm2. In each part the cells are listed in order of increas- ing speed of recovery, the group showing slowest recovery being first. The per- formance of each lithium cell group is compared with 10 ohm-em n/p cells irradi- ated during the experiments to the same fluence. Columns 1 and 2 list the cell groups and the number of cells in each group, column 3 gives the initial dopants, and column 4 the (approximate) initial gradient of lithium density.
*Also includes groups irradiated to x 8 x 10¹⁴ e/cm2 by 0.7 MeV electrons.
3

TABLE I. PROPERTIES AND PERFORMANCE OF CRUCIBLE-GROWN LITHIUM CELLS AND COMPARISONS WITH COMMERCIAL
10 ohm-cm n/p CELLS
Cell Power (mW)
Initial After Irrad. Latest Reading dND/dw No. of
Cell Group Dopant Cells Li cell I n/p Li cell I n/p Li cell I n/p
T. A. B. (days)
2
3
3
3
3
2
3
2 3
2
1
3
2
3
c2 (1) 5 Sb
c1 (1) 7 As
H2 (1) 5 P
H1 (1) 8 A s
~2 (1) 6 P
Sb
Sb
Sb
P
P
A s
P
P
P
A s
P
P
P
1x10¹⁸ 30.3 28.1 17.9 21.3 20.8 23.3 442
1 ~ 1 0 ~ ~ 30.3 28.1 18.6 21.3 24.2 23.3 442
lx1019 26.0 28.1 17.0 21.3 23.1 23.3 442
2 ~ 1 0 ~ ~ 21.7 28.1 15.7 21.3 20.2 23.3 442
1x10l8 26.8 28.1 16.5 21.3 23.4 23.3 442
15.6
15.6
15.6
15.6
15.6
15.6
15.6
15.6
15.6
(44.7)
(45.4) 31p
411
194
194
194
194
194
194
411
194
411
194
(B) Intermediate Fluenel
3
3
3
. . 1x10¹⁸
1x10¹⁸
1x10¹⁸
1x10¹⁸
1x10¹⁸
1x10¹⁸
1x10¹⁹
1x10¹⁹
1x10¹⁹
2x10¹⁹
_ _ _ 5x1 O1
1x10¹⁸
5x1 019
P
P
P
30.3
28.2
29.3
28.1
30.9
31.8
26.1
24.3
24.7
17.4
27.6
25.0
(69.3)*
(70.8)
(C) High Fluent
1 x 1 0 ~ ~
1x10¹⁸
1x1018
iX1019
1x10¹⁹
1 ~ 1 0 ~ ~
1x10¹⁸
5 ~ 1 0 ~ ~
5x10l9
28.9
28.3
28.4
26.1
20.9
25.2
25.1
(68.8)
(70.5)
27.7
28.2
28.2
28. a 28.2
28.4
28.2
27.7
28.2
28.4
28.2
28.2
(69.6)
(70.1)
, 3 x 1 (
28.4
28.3
28.3
28.3
28.3
28.3
28.3
28.4
28.3
(69.1)
(70.1)
14.8
15.1
15.7
16.0
16.6
13.8
12.6
13.5
14.0
10.8
11.5
13.0
(36.6)
(35.3)
j e/cm2
10.7
9.7
10.1
10.7
11.0
8.5
9.5
9.9
8.2
(31.8)
(25.3)
17.7
19.5
19.5
19.5
19.5
16.6
19.5
17.7
19.5
16.6
19.5
19.5
(49.3)
(54.0)
13.9
14.2
14.2
14.2
14.2
14.2
14.2
13.9
14.2
(40.4)
(42.2)
T. A. B indicates time after bombardment a t latest reading.
* Numbers in parentheses under Cell Power Column are short-circuit currents (mA).
14.9
15.3
16.1
1 6 . 3
17.7
16.2
18.7
20.0
20.7
15.8
18.0
20.7
(58.9)
(56.2)
10.9
9.8
1.0. 1
10.7
10.9
9.4
11.6
15.0
14.8
(49. 6)
(50. 6)
18.9
20.9
20.9
20.9
20.9
18.9
20.9
18.9
20.9
18.9
20.9
20.9
(52.8)
(57.3)
376
194
194
194
194
376
194
376
194
376
98
194
376
194
4

Columns 5 to 10 give maximum powers averaged over the cell groups, columns 5, 7, and 9 for the lithium cells before irradiation, immediately after irradia- tion, and at the latest reading, respectively; columns 6, 8, and 10 give the equiv- alent values for the n/p cell groups. In the cases of groups T2(2), T7(1), T2(3), and T7(2) short-circuit currents are given instead of powers since these picture frame cells were partially shorted by our light table contact block thus invalidat- ing power measurements.
Of the five lithium cell groups irradiated to 1 x 10¹⁴ e/cm2, three cells C1(1), T2(1), and H2(1) have recovered to powers greater than or comparable to those of the n/p cells. Group C2(1), a slowly-recovering Sb-doped group is still re- covering. Only the Hl(1) cells with low initial power (21.7 mW) have completed their recovery cycle at a power significantly below that of the n/p cells.
Fourteen lithium cell groups, irradiated to fluences of 3 to 5 x 10¹⁴ e/cm2, are listed in Table I(B). The recovery times become longer with increasing fluences due to the greater loss of lithium during irradiation. Consequently, none of the cell groups with density gradients below 1019 ~ m - ~ , except T2(2), have recov- ered to the n/p power levels. Actually the first four groups listed have not yet recovered at all. Of the cells which have recovered, only groups H2(2), T2(2), T7(1), H6(1), and C5(1) are competitive with the n/p cells. Group T8(1) and cell C8G-7 are not yet Competitive but are still recovering. The Hl(2) cells (initial power of 17.7 mW) are not competitive and recovery has been completed.
Eleven cell groups irradiated to 3 x 10¹⁵ e/cm2 are listed in Table I(C). The first five groups with low density gradient cmm4) have yet to show any signs of recovery. Four groups H2(3), C5(2), T2(3), and T7(2) have recovered to power levels competitive with the n/p cells. Three of these four groups had high initial density gradients ~ m - ~ ) , however, T2(3) recovered well despite the low density gradient.
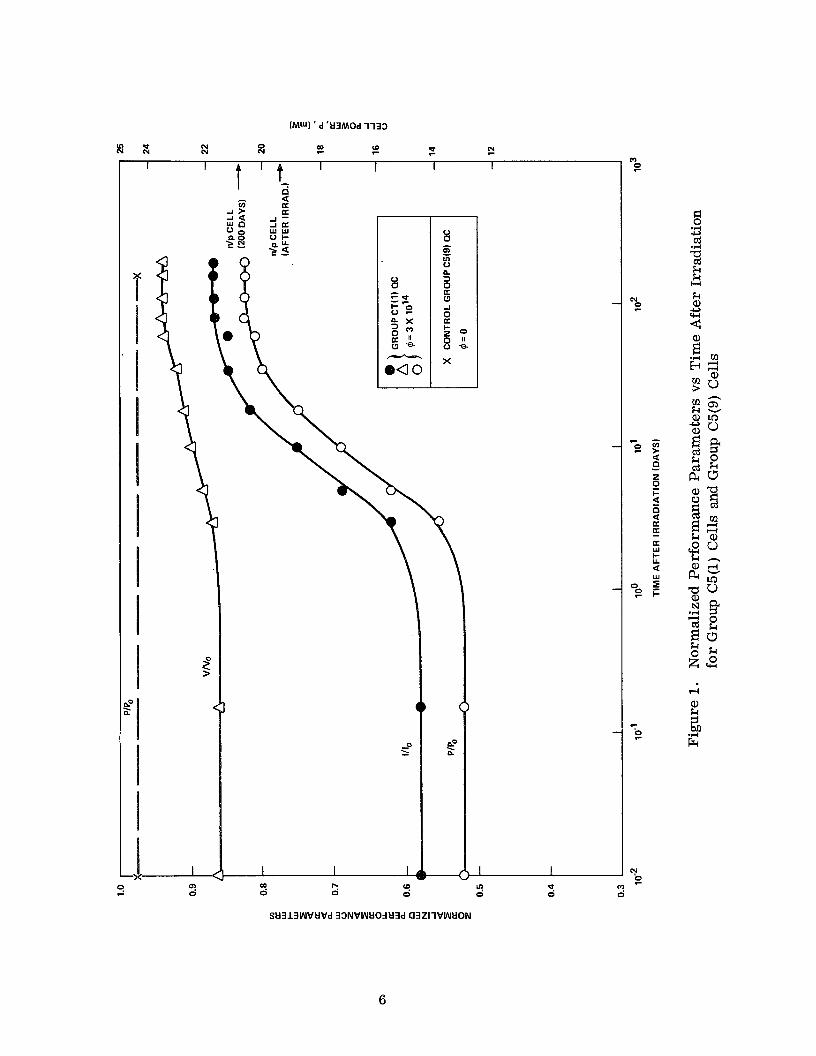
The recovery curves for the crucible-grown cells are S-shaped when plotted versus log time after irradiation. An example is shown in Figure 1, which gives plots of short-circuit current (I&), open-circuit voltage (V/Vo), and maximum power (P/Po), normalized to their pre-irradiation values versus time after ir- radiation for cell group CS(1). It should be noted in Figure 1 that an unexpected recovery of n/p cells occurred at room temperature during this time period.
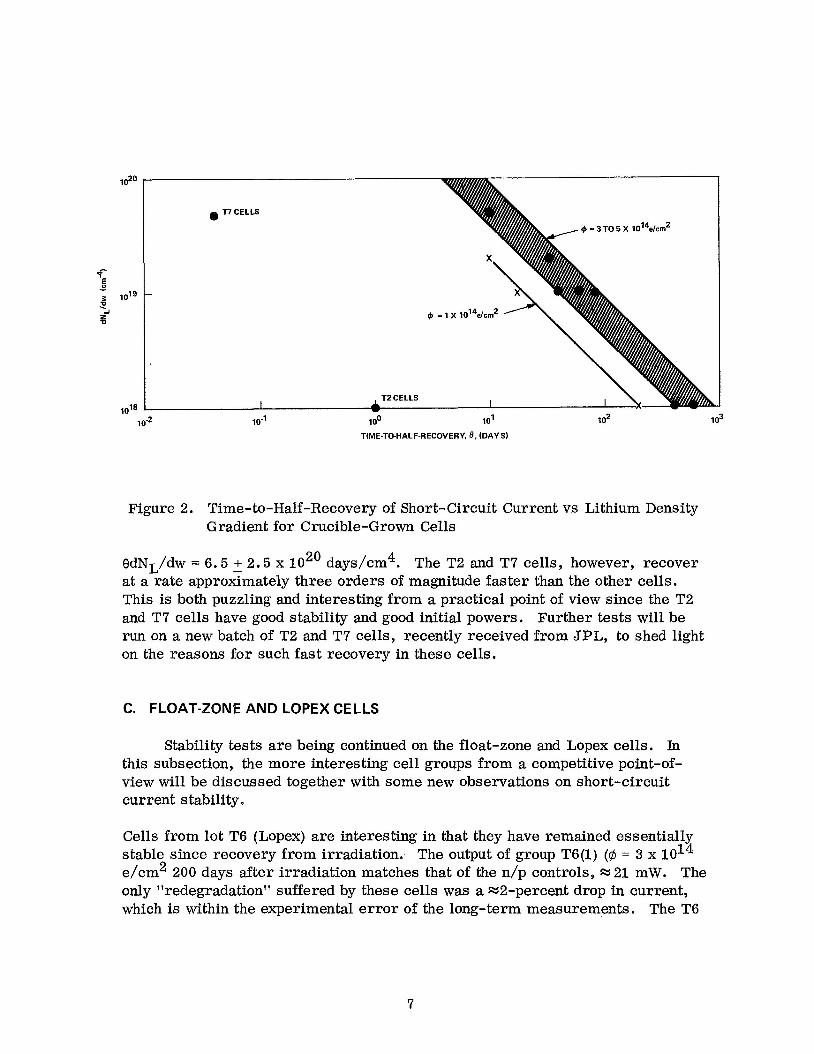
In general, the speed of cell recovery varied directly with the lithium density gradient in the cells. Figure 2 gives a logarithmic plot of time-to-half-recovery, e, of short-circuit current versus lithium density gradient. All of the cell groups from Table I parts (A) and (B) except the Sb-doped groups are included. All of the cell groups except the T2 and T7 cells fall along a straight line with unity slope, indicating a linear relationship between recovery time and inverse density gradient. The appropriate relation for cells irradiated to 3 x 10¹⁴ e/cm2 is
5
R X N N
(Mu) ' d 'P3MOd 1133
z 2 f 0 N
1 I I 1 I I
x SU313WVPVd 33NVWPOdP3d a3ZIlVWPON
6
9- E -
1019 . 2
B
1018 10-2 10-1 100 101 102 lo3
TIME-TO-HALF-RECOVERY, 6, (DAYS)
Ll
Figure 2. Time-to-Half-Recovery of Short-circuit Current vs Lithium Density Gradient for Crucible-Grown Cells
OdNL/dw = 6.5 + 2.5 x lo2' days/cm4. The T2 and T7 cells, however, recover at a rate approximately three orders of magnitude faster than the other cells. This is both puzzling and interesting from a practical point of view since the T2 and T7 cells have good stability and good initial powers. Further tests will be run on a new batch of T2 and T7 cells, recently received from JPL, to shed light on the reasons for such fast recovery in these cells.
C. FLOAT-ZONE AND LOPEX CELLS
Stability tests a re being continued on the float-zone and Lopex cells. In this subsection, the more interesting cell groups from a competitive point-of- view will be discussed together with some new observations on short-circuit current stability.
Cells from lot T6 (Lopex) are interesting in that they have remained essentially stable since recovery from irradiation. The output of group T6(1) (QI = 3 x 10¹⁴ e/crn2 200 days after irradiation matches that of the n/p controls, M 21 mW. The only "redegradation" suffered by these cells was a x2-percent drop in current, which is within the experimental e r ror of the long-term measurements. The T6
7
cells have high density gradients x 3 x lo1' cm-4 and would therefore normally be expected to redegrade, however, unlike many of the other high-density lots, they were lithium doped with a long, low-temperature diffusion (8 hours at 325OC). It is therefore possible that the T6 cells owe their good properties to this diffusion schedule which should be tested further.
Cell group H7(1) (Lopex, dNL/dw control groups ~ 2 0 0 days after irradiation to 3 x 10¹⁴ e/cm2, both groups putting out 21 mW. This is the case in spite of a ~6-percent current redegradation in the H7(1) cells spanning in time from =l to 60 days after irradiation. The cells have been stable over the last a140 days.
2 x lo1' ~ m - ~ ) is competitive with its n/p
Among the oxygen skin cells of lot C8, the C8C cells (Lopex) look interesting. Cell, C8C-7 (Po = 25.7 mW) has recovered to a power of 21 mW one hundred days after irradiation to 3 x 10¹⁴ e/cm2. Most of the recovery occurred over the first 10 days, however the recovery curve has the S-shape characteristic of crucible-grown cells. Two C8C cells remain unirradiated along with two C8D "control" cells (no oxygen-skin). Further tests will be performed on these cells.
Irradiated cells from lots T9 (Lopex, dND/dw x 5 x lo1' ~ m - ~ ) and T10 (Lopex, dND/dw X2 x lo2' cmq4) were subject to significant redegradation. The current redegradation in group T9 l), r$ = 3 x 10¹⁴ e/cm2, was %9 percent, that in group T10(1), @I = 3 x 10¹⁴ e/cm', was x14 percent, both after 100 days post-irradia- tion duration. However, checks on the unirradiated cells of lots T9 and T10 showed no degradation. Clearly, the short-circuit current redegradation in these lots was associated with radiation-induced defects. Checks of other cell lots showed that in lots T3, H7 and, to a lesser extent, T4 and T5, the post- irradiation current redegradation was large (2 7 percent), but degradation in unirradiated cells was small (usually less than 3 percent). Checks on lots C4 and C5, however, showed that comparable amounts of pre-irradiation current degradation and pos t-irradiation current redegradation has occurred. No satis- factory explanation has yet been found for this behavior.
D. NEW CELL SHIPMENT (NO. 7)
A seventh cell shipment has recently been received from JPL comprising ten more cells from each of lots T2 and T7 and a total of 15 cells,from lot H3A. The T2 and T7 cells will be tested in an attempt to answer the questions which arose regarding the fast recovery of previous cells from these lots.
8

Capacitance and photovoltaic measurements have been made on all of the cells of shipment No. 7. The H3A cells have low capacitance indicating a density gradi- ent in the 1 0 l 8 cm-4 range. These cells also have very good photovoltaic proper- ties, short-circuit currents ranging from 61 to 79 mA under 140 mW/cm tungs- ten illumination, and high open-circuit voltages (% 580 mW). They are now being prepared for irradiation.
2
9
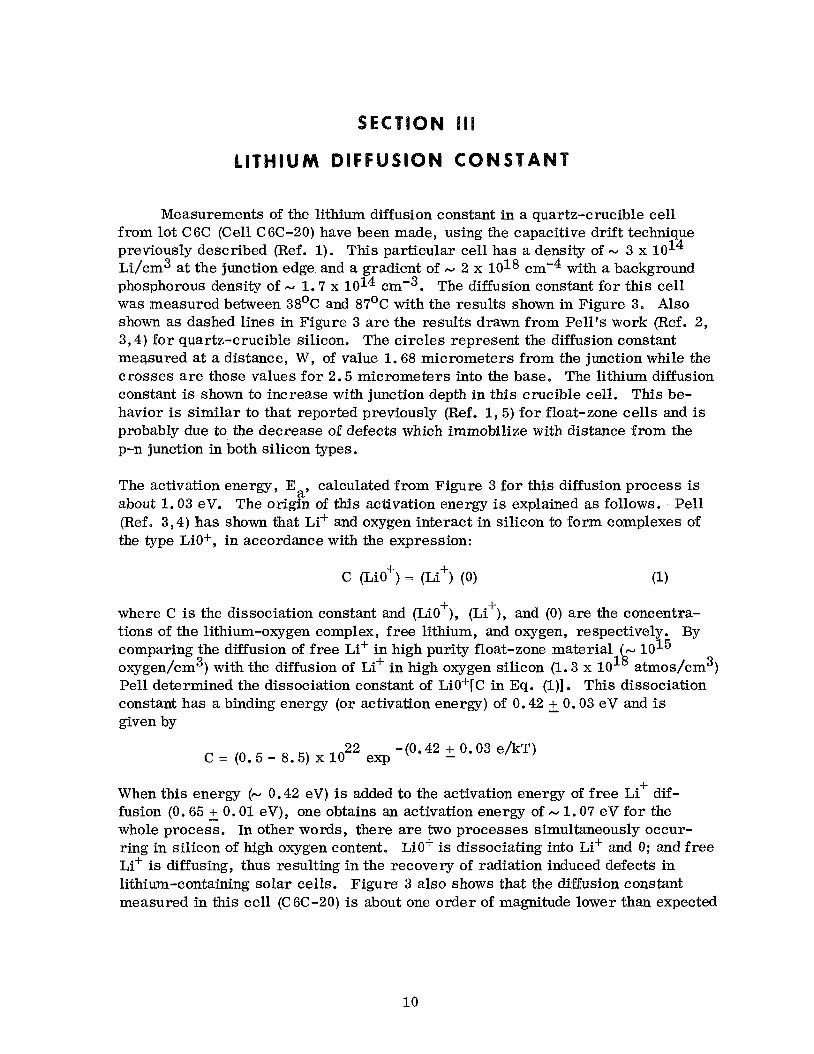
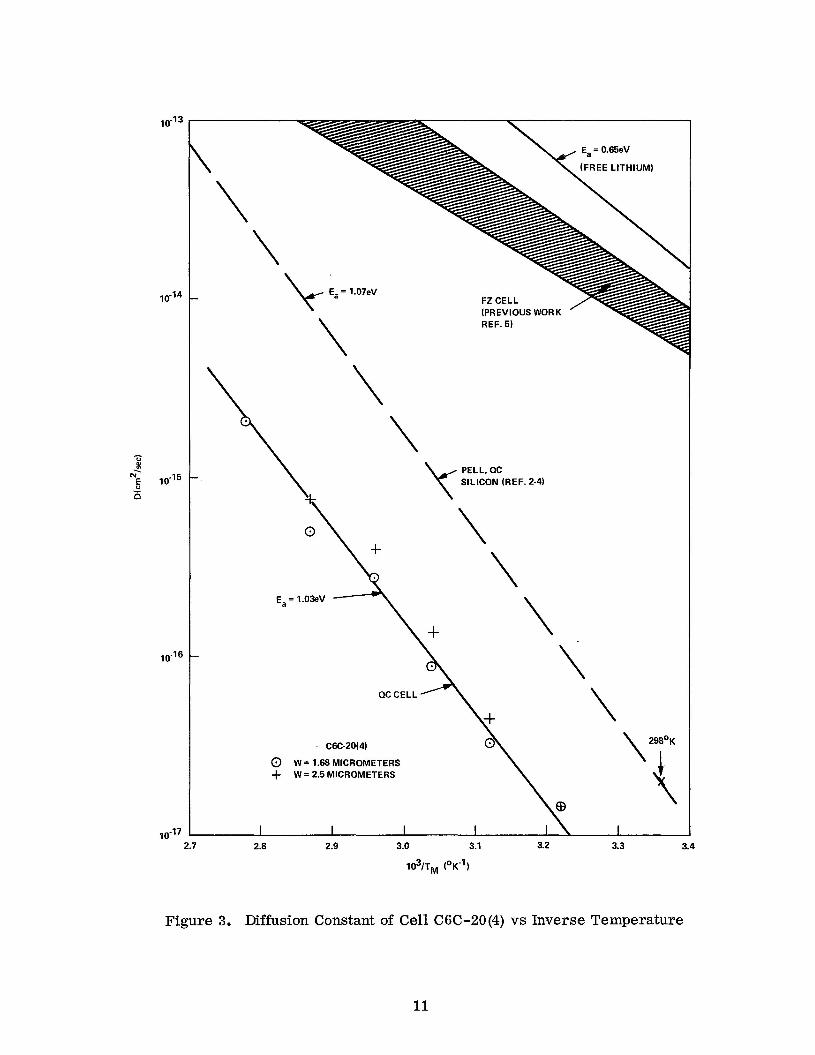
Measurements of the lithium diffusion constant in a quartz-crucible cell from lot C6C (Cell C6C-20) have been made, using the capacitive drift technique previously described (Ref. 1). This particular cell has a density of - 3 x 10¹⁴ Li/cm3 at the junction edge and a gradient of N 2 x 10 l8 cme4 with a background phosphorous density of - 1.7 x 10¹⁴ ~ m ' ~ . The diffusion constant for this cell was measured between 38OC and 87OC with the results shown in Figure 3. Also shown as dashed lines in Figure 3 are the results drawn from Pell's work (Ref. 2, 3,4) for quartz-crucible silicon. The circles represent the diffusion constant measured at a distance, W, of value 1.68 micrometers from the junction while the crosses a re those values for 2.5 micrometers into the base. The lithium diffusion constant is shown to increase with junction depth in this crucible cell. This be- havior is similar to that reported previously (Ref. l, 5) for float-zone cells and is probably due to the decrease of defects which immobilize with distance from the p-n junction in both silicon types.
The activation energy, Ea, calculated from Figure 3 for this diffusion process is about 1.03 eV. The origin of this activation energy is explained as follows. Pell (Ref, 3,4) has shown that Li+ and oxygen interact in silicon to form complexes of the type LiO+, in accordance with the expression:
+ + where C is the dissociation constant and (LiO ), (Li ), and (0) are the concentra- tions of the lithium-oxygen complex, free lithium, and oxygen, respectively. By comparing the diffusion of free Li+ in high purity float-zone material 1015 oqgen/cm3) with the diffusion of Li+ in high oxygen silicon (1.3 x 101LNatmos/cm3) Pell determined the dissociation constant of LiO+[C in Eq. (l)] . This dissociation constant has a binding energy (or activation energy) of 0.42 - + 0.03 eV and is given by
22 -(0.42 - + 0.03 e/kT) C = (0.5 - 8.5) x 10 exp
When this energy (N 0.42 eV) is added to the activation energy of free Li+ dif- fusion (0.65 + 0.01 eV), one obtains an activation energy of - 1.07 eV for the whole process. In other words, there are two processes simultaneously occur- ring in silicon of high oxygen content. LiO' is dissociating into Li+ and 0; and free Li+ is diffusing, thus resulting in the recovery of radiation induced defects in lithium-containing solar cells. Figure 3 also shows that the diffusion constant measured in this cell (C6C-20) is about one order of magnitude lower than expected
10
1 0 - l ~
I
P E 1 0 - l ~ N' - 0
10-16
1 0 - l ~
(FREE LITHIUM)
(PREVIOUS WORK
SILICON (REF. 2-4)
C6C-20(4)
0 W = 1.68 MICROMETERS + W = 2.5 MICROMETERS
\ "5" \
2.7 2.8 2.9 3.0 3.1 3.2 3.3 3.4
103/~, (OK-")
Figure 3. Diffusion Constant of Cell C6C-20(4) vs Inverse Temperature
11

from Pell's work in silicon containing an oxygen concentration of about 10 l8 3 atoms/cm e When the lithium concentration is much less than the oxygen con-
centration, (0), as is the case for cell C6C-20, the effective diffusion constant, Deff is given by
D 1 + (0) -
C
where D is the free Li+ diffusion constant. At room temperature (298'K), for C M 1015 ~ m ' ~ and (0) M 10 l8 cme3
-17 2 = (0.001) D = 2 x 10 cm /sec Deff
This value is 'shown as point llX" in Figure 3. Extrapolating the measured curve for cell C6C-20 to room temperature one finds that, instead,
Deff = (0.0001) D
If high oxygen content were the reason for this very low diffusion constant, an oxygen content in this cell of the order of lo1' atoms/cm3, would be required, a somewhat unlikely condition. It is more likely that some additional defect o r impurity may be prohibiting lithium from diffusing. More information is required to resolve this question. It is also interesting to note that cells C6C 11, 12, and 13 (taken from the same batch as C6C-20) have yet to recover from 1-MeV electron damage (3 x 10¹⁴ e/cm2) even 194 days after irradiation. Figure 2 shows that their time-to-half-recovery should be between about 400 to 600 days (dNL/dw M 10 l8 ~ m - ~ ) . If indeed their bulk lithium diffusion constant is a factor of 10 lower than that observed for 10 l8 oxygen/cm3, one would expect them to recover more slowly than that indicated in Figure 2. One might also note that the point at 2.87 = (1000)/T in Figure 3 does not lie on the 1.06 eV activation energy line. This was the last measurement taken in the series and it is tentatively thought that the equilibrium reaction
+ Lie+ e ~ i + o
has been driven to the left by the drift field used to determine the diffusion constant. More measurements are being initiated to understand this behavior,
12
A. GENERAL
Experimentation on solar cells with the cells mounted on a cold finger previously described (Ref. 1) was continued during the present reporting period. The principal cell property measured in these experiments was the minority- carrier diffusion length, L, in the base region of the cell (Ref. 6). This measure- ment together with published mobility values (Ref. 7) enabled the calculation of the minority-carrier lifetime, T , through the equation L = EJD T , where D is the minority-carrier diffusion constant obtained from the mobility by the use of the Einstein relation. During the present reporting period experiments were performed on three low-density crucible cells (lot C6C) and two high-density Lopex cells (lot T9).
The diffusion-length measurement was accomplished using a 1-MeV Van de Graaff generator at a low electron current to supply the exciting beam. Cell irradiations were also performed with this beam at a higher intensity. Periodic measurements of diffusion length during electron irradiation enabled the calculation of lifetime damage constant, K, , using the equation
-- - + K ai 1
' 'bb T
where is the lifetime prior to irradiation, and
'bb
@I is the electron fluence.
Measurements were repeated for a set of bombardment temperatures to obtain the dependence of K
After irradiation, diffusion length measurement versus Gel1 temperature for tem- peratures ranging from 80°K to 380°K yielded curves of lifetime versus temperature ( 7 vs TM) from which defect energy levels were obtained using the Hall-Shockley- Read analysis (Ref. 8,9) e
on bombardment temperature. 7
A series of anneals were performed at various annealing temperatures to obtain activation energies for the recovery process in the lithium-containing cell.
13
Three crucible-grown cells from lot C6C, namely C6C-17(1), C6C-18)1), and C6C-18(2), were tested on the cold finger. The lithium density gradient mea- sured in these cells was x l x 10 l8 ~ m - ~ . Lifetime damage constant, K,, was measured for two of the cells C6C-18(1) and C6C-18)2). Anneals were done on C6C-17(1) and C6C-18(1) and lifetime versus measurement temperature was ob- tained for all three cells.
Previous attempts (Ref. 5) at measuring K, versus temperature had encountered difficulties. In the present experiments these difficulties were overcome by ir- radiating to very low fluences so that the change in diffusion length for each in- cremental irradiation was s 5 percent. Thus, the cells were irradiated to fluence increments of 'VN 10 l2 e/cm2 at the bombardment temperature, TB. Dif- fussion length measurements were then made at two measurement temperatures, TM = 200% and TM = 90°K. The cells were then returned to TB for another ir- radiation. For each bombardment temperature this procedure was repeated ap- proximately six times, the diffusion length measurements were converted to life- time, T , through use of the mobility data of Morin and Maita (Ref. 7), and l / ~ was plotted against fluence, 6 . The damage constant, K, , from Eq. (2) is the slope of this curve. (Throughout the measurements these curves were good approximations to straight lines). In this way K was found for several values of TB (in this case TB = 82OK, 86OK, 90°K, 95'2, 100°K, 110°K9 and 140'K). The results are shown for cell C6C-18(2) in Figure 4 in which K, is plotted against TB for the two measurement temperatures (200°K, 90°K). The value of K, decreases exponentially at low temperatures and saturates at the higher tem- peratures in agreement with the carrier-removal curves previously obtained in bulk samples (Ref. 1, 11) and with current theories of the temperature depen- dence of defect formation in silicon @ef. 10). An additional measurement not shown in Figure 1) at TB = 353% (103/TB = 2.83) gave K, = 1.6 x cm / e-sec at TM = 200°K and K, = 5 x cm2/e-sec at TM = 90°K further estab- lishing the leveling of the damage constant at high temperatures. The curves for cell C6C-18( 1)were almost identical to those shown in Figure 4. During the course of the measurements the diffusion length at TM = 200°K dropped from x 30 Cbm to x 12 pm; at TM = 90°K from 18 pm to M 9 bmo Since these cells had dN /dw
L
10 l8 cm'4 the average lithium density in the collection volume was X 10 h ~ m ' ~ .
In addition to obtaining damage constants at low temperature, during irradiations 8 at TB = 353OK the damage constant at TM = 353'K was measured to be 1.3 x 10-
cm2/e-sec. This is comparable to, but somewhat higher than, the x 8 x cm2/e-sec found at x 3OO0K for 1 ohm-cm non-lithium p/n cells (Ref. 12).
Successive anneals at different annealing temperatures,. Ta9 were performed on C6C-17(1) and C6C-18(1). The procedure was as follows: The cells were annealed
14

I I I I I I
Figure 4. Lifetime Damage Constant vs Inverse Bombardment Temperature for Measurement Temperatures of 2 OO°K and 90°K - Cell C6C-18(2)
at Ta until their diffusion lengths recovered from 15 pm to 50 pm. They were then irradiated at 353OK until the diffusion length again dropped to the anneal was repeated at another annealing temperature. A total of 5 different annealing temperatures (353'K, 363'K 373OIC, 378OK and 382'K) were used. During the anneal the quantity fr-' = est (Ref. 13) where S = 4 IT ro NL DL was plotted versus annealing time, where f," is reciprocal fraction of damage re- maining, S is the recovery slope, ro is the capture radius for lithium by the de- fect, NL is the lithium density, and DL is the lithium diffusion constant. The only quantity in S which is strongly temperature dependent is DL. Thus, DL can be calculatedby finding S and inserting values for ro and NL.
15 pm and
Figure 5 shows an example of an annealing curve. The curve is (as were all the curves) an excellent approximation to a straight line on a semi-log plot. The slope of this line is S, the recovery slope, in this case S = 5.1 x sec-1 for C6C-17(1) and 4.5 x sec-l for C6C-18(1). In Figure 6, S is plotted versus inverse annealing temperature. The right side ordinate gives the lithium dif- fusion constant calculated from S using NL = 1015 cmw3 (the density 10 krn from the junction) and ro = 10°A. A curve for the diffusion constant of lithium in crucible-grown silicon with 5 x 1017 cm'3 oxygen density obtained from Pel1
15

3
2.5
2
- c: *- -
1.5
1
0 5 10 15 20 25 30 35
TIME AFTER IRRADIATION (MINUTES)
Figure 5. Reciprocal Fraction of Damage Remaining vs Time After Irradiation at 373'K (Recovery Curve for Cells C6C-17(1) and C6C-18(1)
2.6 2.7 2.8 2.9
1 0 % ~ PK'I
Figure 6. Recovery Slope and Lithium Diffusion Constant v s Inverse Annealing Temperature (Recovery Activation Energy for Crucible-Grown Cells C6C-17(1) and C6C-18(1)
16
(Ref 4) is also shown. The good agreement between Pell's data and that obtained here leaves little doubt that the recovery in these cells is associated with lithium diffusion. One puzzling point, however, arises from the diffusion measurements reported in Section 111 which were made on a similar cell from lot C6C. These measurements show a f i t to an oxygen density of % 1019cm-3, an order of mag- nitude above the recovery results. This question has not been resolved yet but the difficulty may be associated with the different portions of the cell covered in the measurements M 2 ylm in the diffusion constant and M 30 pm in the recovery measurement). Also there is a factor of a 3 uncertainty in both ro and the appro- priate value of NL which would be reflected in the effective diffusion constant.
Lifetime versus temperature measurements were made on the C6C cells at various stages of the experiments. These curves indicate the presence of a level with x 0.13 eV activation energy, both immediately after irradiation and after recovery. This level is sufficiently far from the A-center to suggest either a number of closely spaced levels near the A-center or some modification of it by lithium. Similar level configurations have been suggested by the bulk-sample data (Ref. 1,ll).
C. LOPEX CELLS
19 -4 cm Two Lopex cells from lot T9 (dNL/dw M 5 x 10 ) were tested on the cold finger. Both cells T9-14(1) and T9-16(1) were subjected to irradiation at several temperatures to obtain damage constant dependence on bo.mbardment temperature, and were annealed at several temperatures to obtain the activation energy for recovery.
The lifetime damage constant as a function of inverse bombardment temperature is given in Figure 7. The curve shape is similar to that for the C6C cells (Fig- ure 4) except that the saturation occurs at a higher temperature, 12OoC as com- pared to % 105OC for the C6C cells. This is as expected since the T9 cells a re more heavily doped and thus the Fermi-level reaches the E, - 0.07 e V .meta- stable level for the vacancy-interstitial pair (Ref. 10, 11) at a higher tempera- ture than for the C6C cells. The saturation level of K, is higher in the T9 cells,
2 M 1.5 x l o m 6 cm /e-sec for TM = 200°K, than the corresponding value for the C6C cells % 1.5 x low7 cm2/e-sec. This is due to the much higher lithium density in the T9 cells.
The annealing curve for the T9 cells, which was obtained in the same manner as Figure 6, is given in Figure 8. The recovery slope, S, and diffusion constant, DL, a re plotted against inverse annealing temperature The diffusion constant was calculated from S by assuming values of 1 0 8 and 5 x 1 0 l 6 cm'3 (the value M 10 pm from the junction) for ro and NL, respectively. Together with the
1 7
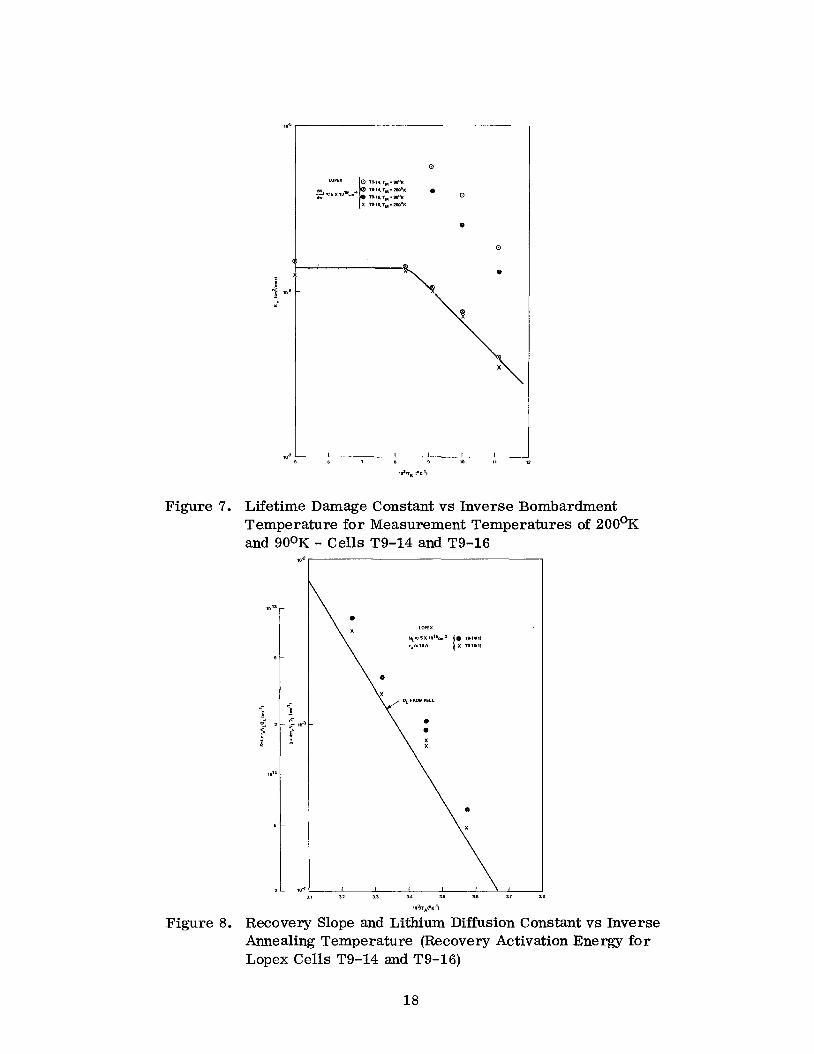
Figure 7. Lifetime Damage Constant vs Inverse Bombardment Te.mperature for Measurement Temperatures of 200°K and 90°K - Cells T9-14 and T9-16
1 1 12 11 3 4 I5 I6 I7 18
lO%,P. 'I
Figure 8. Recovery Slope and Lithium Diffusion Constant vs Inverse Annealing Temperature (Recovery Activation Energy for Lopex Cells T9-14 and T9-16)
18
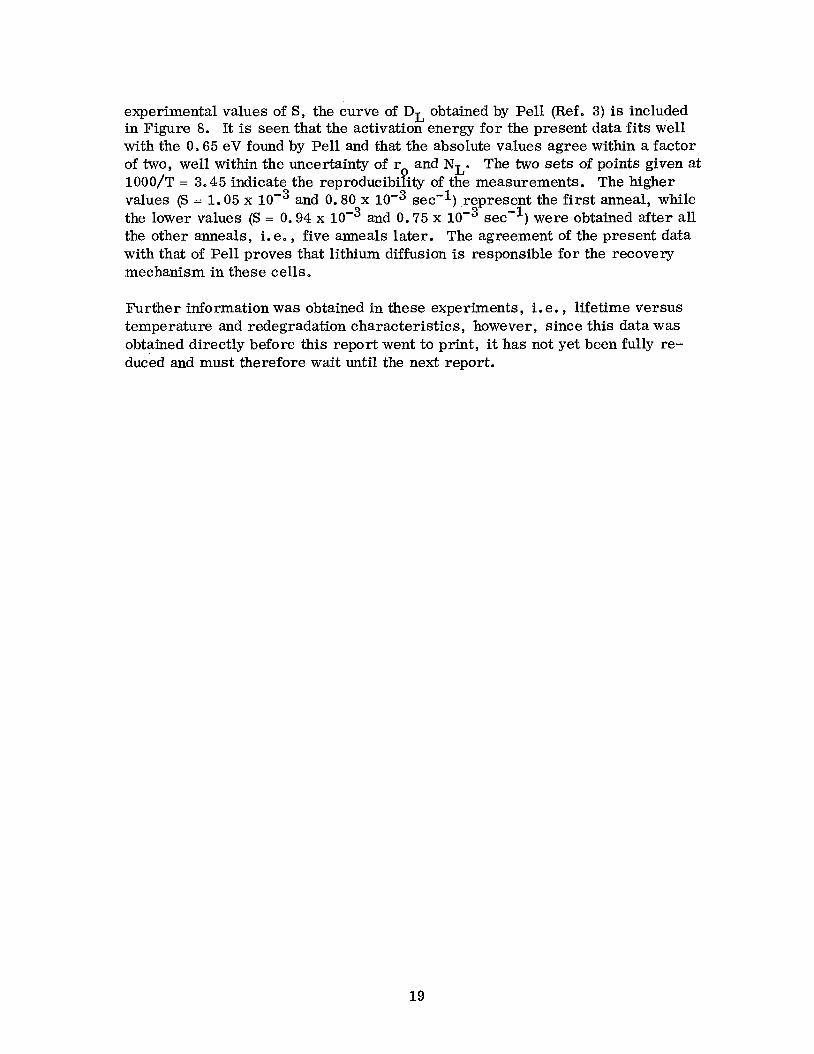
experimental values of S, the curve of DL obtained by Pell (Ref. 3) is included in Figure 8. It is seen that the activation energy for the present data fits well with the 0.65 eV found by Pell and that the absolute values agree within a factor of two, well within the uncertainty of ro and NL. The two sets of points given at 1000/T = 3.45 indicate the reproducibility of the measurements. The higher values (S = 1.05 x and 0.80 x low3 sec'l) represent the first anneal, while the lower values (S = 0.94 x and 0.75 x lom3 sec") were obtained after all the other anneals, i. e., five anneals later. The agreement of the present data with that of Pell proves that lithium diffusion is responsible for the recovery mechanism in these cells.
Further information was obtained in these experiments, i. e. , lifetime versus temperature and redegradation characteristics, however, since this data was obtained directly before this report went to print, it has not yet been fully re- duced and must therefore wait until the next report.
19

N T I
A. INTRODUCTION
The objectives of the Hall and resistivity measurements on bulk-silicon samples diffused with lithium are (1) to determine the dependence of carrier- removal on lithium concentration, oxygen concentration, and electron fluences at low and high bombardment temperatures, and ( 2 ) to determine the dependence of annealing at room temperature on the same parameters as in (1). To achieve these objectives, ingots of high-resistivity float-zone (FZ) refined silicon, Monex, and quartz-crucible (QC) grown silicon were procured and are presently being fabricated into Hall bars. Measurements on Hall samples fabricated from silicon procured during the last contract period (Ref. 1) were irradiated and measured. These results will be presented in this report. A complete description of the methods and techniques of these measurements can be found in Reference 1.
B. CARRIER-REMOVAL RATES
The temperature dependence of the carrier-removal rate was measured on five Hall bar samples fabricated from two different sources of high-resistivity float-zone silicon. These two sources of silicon had initial resistivities of 1500 and 5000 ohm-cm. Two Hall bar samples were fabricated from the 1500-ohm-cm material and doped with lithium to a concentration of 5 x 10¹⁵ Li/cm3. The other three samples were made from the 5000-ohm-cm material and doped with lithium to a concentration of 1.8 x 10¹⁴ Li/cm3. All five samples were irradiated at several bombardment temperatures (TB), and then the rate of carrier-removal was determined after each bombardment (measurement temperatures always being 78-81°K: These samples (10 to 20 ohm-cm) are very lightly doped with lithium compared to samples which were bombarded and measured previously (Ref. 1,14). The results obtained on the five samples are shown in Figure 9 where curve I represents the measurements obtained on three samples made from the 5000 ohm-cm material (hereafter referred to as !!J" material) and curve I1 repre- sents the measurements obtained on the 1500 ohm-cm float-zone silicon ("H" material). A very surprising result was obtained when samples (previously ir- radiated at lower temperatures) were bombarded at TB = 95'K. The carrier- removal rate decreased to a low value and then increased as successive bombard- ments were done at higher temperatures. All five samples showed this effect, thus the experimental evidence strongly supports the reality of this minimum in the TB dependence curve of carrier-removal rate. The only reasonable explana- tion is that a defect level located at an energy corresponding to the position of the Fermi-level at a bombardment temperature of 95OK (about 0.14 eV below Ec)
TM7
20

0.1
FZ SILICON
0.08 0 1.8 X 10¹⁴Li/03
c. 1 El 5 x 10'4~i/cm'
- E
d 1 1 Q \ I
8 0.06
c
I
0.04
0.02 I I I I I I I 5 6 7 8 9 10 11 12 13
103/~, ( o K - ~ )
Figure 9. Carrier-Removal Rates vs Reciprocal Bombardment Tem- perature for Float-Zone Silicon Irradiated by 1-MeV Electrons (Measured at T
M = 78'K)
would affect the measurements. If this defect is being introduced by the bombard- ment then it would be expected that an unirradiated sample initially bombarded at TB = 95'K would not exhibit the low value of carrier-removal rate (0.04 cm-'). To test this theory, one of the three samples of rrJ1r silicon was bombarded initially at a temperature of 95OK whereas the other two were bombarded starting at TB = 200°K and at 85OK, respectively. The bombardment temperatures of the latter two samples was slowly decreased to 78OK and increased to 200°K. As was ex- pected, the sample pristinely bombarded at 95'K indicated a carrier-removal rate of 0.092 cm" which is approximately twice the value measured on the four pre- viously-irradiated samples. It thus appears that a radiation-induced defect level was responsible for this minimum in the curves of Figure 9. Further evidence will be given in later sections to support this hypothesis. The shift of the curves (Figure 9), TB versus carrier-removal characteristics along the temperature axis, to lower temperatures was in agreement with the interstitial-vacancy-close- pair model (Ref. 15) which predicts this shift with changing resistivity. It should be noted that the saturated value of An/A@ (0.1 cm-l) obtained on these lightly- doped samples of float-zone silicon is equal to the saturated value of An/AQI ob- tained on the quartz-crucible samples of Ref. 11 which were heavily doped with lithium (2 x 1 0 l 6 Li/cm3).
2 1

The carrier density was measured as a function of temperature at various times during the bombardment of the samples. Figure 10 shows the results ob- tained on one of the "J" samples. All three "J" samples exhibited the same carrier density dependence on measuring temperature e Curve I was obtained from measurements on the sample before bombardment, curve 11 was obtained following the completion of bombardments, and curve 111 was obtained following the completion of the high temperature annealing cycles (TA = 300% and 373OK). Curve 11 clearly shows that the irradiation has introduced a defect level or levels covering a wide temperature range. The temperature at which half of the traps are filled is T1 corresponding i! o this temperature was calculated to be E = E, - 0.14 eV. This defect level or levels thus appears to be responsible for the minimum carrier- removal rate shown in Figure 9 at a bombardment temperature of 95'K. Curve 111 indicates that interaction of lithium with this unknown defect and other possible lithium centers takes place during the high temperature annealing cycles. Both the trap density and the carr ier density at low and high temperatures decreased. The lithium density decreased by a factor of 1.8 whereas the carrier density measured at low temperature (78'K) decreased by a factor of 1.1.
= 146'K as shown in Figure 10. The effective energy level
Figure 11 is particularly interesting since these a re the results of carrier density versus temperature measurements taken on the sample of "J" silicon which was initially bombarded at TB = 95OK and subsequently bombarded at lower and higher temperatures. As previously stated, the An/A@ measured at TB = 95'K was found to be 0.092 cm" rather than 0.04 cm" indicating the absence of this pre- viously unknown defect level at the beginning of the bombardment. Figure 11 shows that curve I1 taken right after bombardment at TB = 95OK does not show the presence of any defect level, but the level does appear in the measurements (curve 111) made after the other bombardments were completed. Thus, these re- sults support the carrier-removal measurements. Curve IV taken after annealing (TA = 300°K and 373'K) shows that the defect level is reduced in density and modified in energy but is not completely removed, in agreement with the results of Figure 10. The measurements taken on the third lfJ" sample were in complete agreement with those shown in Figures 10 and 11.
D. ANNEALING
After completion of all irradiations, isothermal annealing of all samples was 0 carried out at annealing temperatures (T ) of 300°K and 373 KO Figure 12
shows the results obtained after annealing of "J" sample at room temperature (300'K) for a total of 75 minutes and at 100°C for 60 minutes. The unannealed fraction of carrier density and the reciprocal of mobility are plotted versus the
A
22
/ /"
a! c
c - F
- z
- m
- - t o
--I-
- - ( D
- - v )
- e
I I I M
Y F
* c
23

m N‘
I 0
I I I I 1 I I o! x c
k c
24
t P
\
II
I- I - C r
I i Y w a
X I
Y
% m I1
I- a
9 N c c N 0 0
25
annealing time. This unannealed fraction was defined in a previous report. (Ref. 1) . The time scale of the data taken during the 100°C annealing cycle was multiplied by the expected temperature-dependence factor (150) so as to norma- lize this data to the results obtained during the 300°K annealing cycle (an activa- tion energy of 0.66 eV was used in the calculation). The two annealing tempera- tures a re indicated in Figure 12, where dashed lines connect the last data point at TA = 300°K to the first data point at TA = 373'K. As previously reported (Ref. 5), the high resistivity samples (10-20 ohm-cm) exhibit annealing proper- ties which are similar to those of the low resistivity (0.3-ohm-cm) quartz- crucible samples. The unannealed fractions increase slowly with time for TA = 300°K but decrease by large amounts for TA = 373'K. It appears that the higher annealing temperature initially increases the supply of free lithium and subsequent recovery of mobility occurs. However, the carrier density mea- sured at both high and low temperature decreased with time after the initial (t = 0) increase. The three samples of f7J" silicon and the two samples of "H" silicon displayed the same annealing properties.
A sample of low-resistivity (0.3 ohm-cm) quartz-crucible silicon was bombarded and.annealed at temperatures of 300°K and 373'K. The unannealed fractions versus annealing time a re plotted in Figure 13 together with the results obtained at TA = 300°K on H9-1 which is a sample of high-resistivity (10 ohm-cm) float- zone silicon. The time scale of the quartz-crucible data taken during the 373'K anneal was multiplied by a factor of 2000. The dashed lines indicate the start of the annealing cycle at 373'K. The similarity in the speed of response and in the behavior of carrier density and mobility in the two samples should be compared to the annealing properties of low resistivity F. Z samples shown in Figures 9, 10, and 11 of Ref. 5. High resistivity float-zone silicon appears to behave like low- resistivity quartz-crucible silicon during annealing cycles. It should be noted that the oxygen concentration in the F. Z samples is 5 1014 which is now com- parable to the lithium concentration in the IIJfl or '?Hf1 samples.
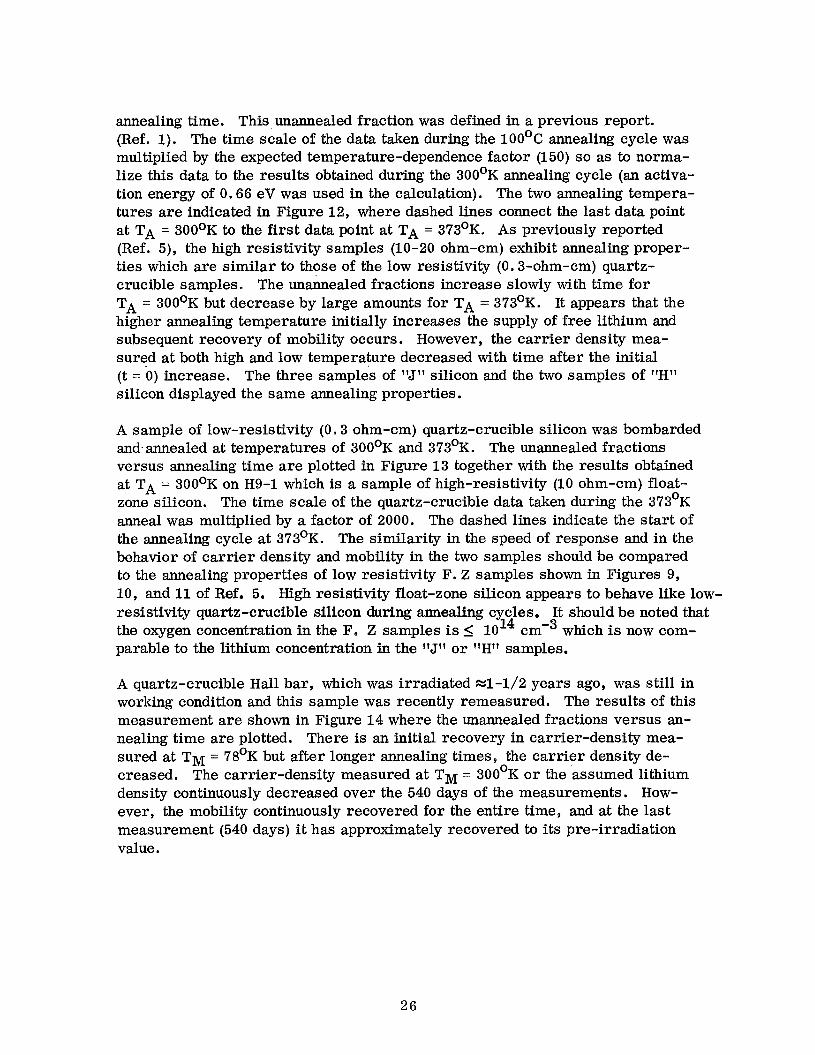
A quartz-crucible Hall bar, which was irradiated %1-1/2 years ago, was still in working condition and this sample was recently remeasured. The results of this measurement a re shown in Figure 14 where the unannealed fractions versus an- nealing time are plotted. There is an initial recovery in carrier-density mea- sured at TM = 78'K but after longer annealing times, the carrier density de- creased. The carrier-density measured at TM = 300°K or the assumed lithium density continuously decreased over the 540 days of the measurements. How- ever, the mobility continuously recovered for the entire time, and at the last measurement (540 days) it has approximately recovered to its pre-irradiation value.
26

"4 N c
-- - A
- Y - Y Y o Y o
k! F3k F3 I1 I1 II I1
0 ! o x I
0
t r
n! c 2
27
7
101 102 103
TIME AFTER IRRADIATION (DAYS)
Figure 14. Unannealed Fraction of Carrier Density and Reciprocal Mobility vs Time After Irradiation for 0.3 ohm-cm Quartz-Crucible Silicon (Annealed at TA = 300°K and Measured at TM = 78'K and 300°K)
E. DISCUSSION OF RESULTS
1. Carrier Removal
The minimum in the carrier-removal curve of Figure 9 is a very unusual result. There is sufficient experimental evidence (4 samples) to support the validity of the measurement but such a phenomenon has not been observed by other workers. In addition, the carrier density versus temperature curves indi- cate the existence of a defect level o r levels close to the bombardment tempera- ture where the minimum occurred. As final confirmatory evidence, we may quote the experiment where a pristine "J" sample was initially bombarded at TB = 95OK and did not exhibit this minimum An/h@, but the value of 0.092 cm-1 which is more like the expected value. Obviously the existence of this previ- ously mknown defect level has a strong influence on the rate of carrier-removal which occurred when the bombardment temperature located the Fermi-level close to the defect energy level. If the defect is an acceptor, then at best the Fermi-level could alter the net carrier density by the magnitude of the defect density. All the acceptors a re filled and emptied of electrons by the passage of
28

the Fermi-level through the acceptor level. The defect density was not great enough to change the effective carrier density by more than a factor of two. The value of An/A@ is unaffected by a change in carrier density of this amount, thus it is not clear why An/h@ decreased so much. Further study of high-resistivity samples is necessary to resolve this question.
2. Carrier Density Changes
The results shown in Figures 10 and 11 clearly indicate that a defect level was introduced during bombardment. The spread of the energy level over such a wide temperature range makes the calculation of the level position uncertain. There may be more than one energy level within the temperature range of 100°K to 190°K due to this unknown defect. A discrete energy level would be effective only if the Fermi level was within +2 kT of its position. This corresponds to the defect level being 88 percent filled-to 1 2 percent filled. Assuming that the level is discrete, the position of energy level was calculated using Equation (3),
C N
- ET - kTl/2 ND - NT/2 * ' (3)
where
is the position of the defect energy level below the conduction band, ET
is the temperature at which half of the traps are filled, 1/2
T
NT is the trap density,
is the donor density, ND
k is Boltzmann constant, and
is the density of available states in the conduction band.
The energy level, ET, was calculated to be 0.14 eV with T1/2 = 146'K. ET + 2 kT is equal to 0.163 o r 0.117 eV. The Fermi-level is located approximately-at these energies for T = 170°K and 124'K. These limits indicate an effective temperature spread of 46'K whereas the experimental results indicate a spread
NC
29
of 90°K. This calculation suggests that there is more than one level. The com- plete expression was also used to f i t curve 11 and to obtain a value of ET. Equa- tion (4) is the relationship which was used.
2 n + n (NT - ND + Nc exp E -E /kT) -N N exp ET - Ec /kT = 0 . . . (4) T c D c
All the quantities in Equation (4) were defined before except for n which is the car- rier density and E which is the energy of the conduction band. The best f i t to curve I1 of Figure 10 ove a range of T = 100°K to 190°K was obtained for ET = 0.115 eV, NT = 5.8 x 10 closer to the value suggested by the results shown in Figure 9. Since the mini- mum in the carrier-removal curve occurred at 95'K, it can be concluded that the Fermi-level must be close to the effective defect energy level. The Fermi- level' was calculated to be at ZO. 085 eV + 2 kT where 2 kT = 0.016 eV. Thus, this calculat.ion indicates the level is located near ET = 0.1 eV. Whether o r not lithium is involved in the formation of this defect cannot be deduced from the present experiments. The defect could involve lithium, a vacancy, and/or oxy- gen since the lithium concentration is comparable to the oxygen concentration ( SlOI4 ~ m - ~ ) in these high resistivity samples. This defect level could have been present in the low-resistivity (0.3 ohm-cm) samples previously reported (Ref. ll), but could have been undetected because of the greater density of other lithium-containing defects (e. g. , LiV). Since this unknown defect formed during low temperature bombardments (78O to 90°K) as well as high temperature (90°K to 250°K), it must be formed by the trapping of mobile vacancies at impurity sites. The vacancy is mobile a t= 80°K whereas the interstituial is not mobile until T z 140°K, and all impurities are frozen in the lattice for temperatures in the range. It is interesting to note that Stannard (Ref. 16) reported finding a de- fect level at ET = 0.13 eV in irradiated float-zone silicon doped with lithium to a concentration of 1 x 10¹⁴ Li/cm3 after room temperature annealing. However, his experiment indicated that the defect was a donor. In our previous work (Ref. 11) a defect level located at ZO. 08 eV was observed in the measurements made on quartz-crucible samples after room temperature annealing. All of these levels may be due to the same defect. The A-center located at 0.186 eV is the only well- identified center that comes close to the energy of this unknown defect, but it is still outside the experimental error of the energy determination.
C
1"3 and ND = 1.08 x ~ m - ~ . This value of ET is
3. Annealing Results
The annealing results obtained on the rrJff and "Hrf samples clearly demon- strated the dependence of the annealing properties of float-zone silicon at room temperature on the lithium concentration. A comparison of Figure 12 with Figures 9, 10, and 11 of Ref. 5 points out the sharp differences in the sample as the lithium concentration was decreased from 2 x 10l6 to 2 x l O I 4 Li/cm . During 3
30

annealing carrier-density and mobility changed very slowly compared to the very fast changes in the samples containing a high concentration of lithium. In addi- tion, the carrier density and mobility initially decreased in the '?T" and "H" Sam- ples rather than increased. It is apparent in Figure 1 2 that raising the annealing temperature to 373% suddenly increased the supply of free lithium which neutra- lized charged-scattering centers and the mobility increased. The carrier density measured at low and high temperature subsequently decreased as the mobility continued to increase.
Comparison (see Figure 13) of low-resistivity (0.3 ohm-cm) quartz-crucible silicon to high-resistivity (10 to 20 ohm-cm) float-zone silicon shows that both types of silicon have similar annealing properties. Mobility increases slowly at room temperature and faster at a temperature of 373'K whereas the carrier density measured at low and high temperature decreased. Dissociation of de- fects during room-temperature annealing with an increase in carrier density measured at room temperature did not occur in the high resistivity samples. This effect has always been observed in irradiated and annealed float-zone Sam- ples which varied in lithium concentration from 3 x 10¹⁵ to 2 x 10l6 ~ m - ~ . '
31
R
A. GENERAL
Some overall conclusions of the present reporting period are as follows: the low-temperature measurements of Hall bars and of solar cells have proved very successful and provided some fruitful insights into the processes occurring in lithium-containing silicon. Correlation of lifetime damage constant K, with the carrier-removal rates, measured as a function of bombardment temperature ( M 80°K to 200°K), has been experimentally demonstrated. This result lends support to the validity of using carrier-removal data to assist in formulating optimum cell designs as is planned by the end of the next reporting period. The damage and recovery model previously proposed has to be slightly modified so as to explain our present results. However, in general, the model was confirmed and further proof has been obtained which shows that lithium is involved in the process of lifetime recovery in Lopex and quartz-crucible solar cells.
B. SOLAR CELL STAB1 LlTY
Lithium-containing crucible-grown cells stored at room temperature for post-irradiation periods ranging up to 450 days continue to maintain stable post- recovery performance at levels which in the majority of the cell groups are com- petitive with commercial 1 0 ohm-cm n/p cells. Many other crucible cell groups, e. g. , all of the Sb-doped groups and some of the groups irradiated to the highest fluence, 3 x 10¹⁵ e/cm2, have not yet completed the recovery stage. The recov- ery curves for crucible cells are S-shaped when plotted on a logarithmic time scale. In most of the crucible cells tested, i.e., all except T2, T7, and Sb- doped cells, the time-to-half-recovery, 9, is related to the lithium density gradient, dNL/dw, through 8 (dNL/dw) = 6.5 + 2.5 x lo2' days/cm4, for a den- sity gradient range of from 10 l8 to 5 x 10¹⁹ c L - ~ and a fluence of 3 x 10¹⁴ e/cm2. For the lower fluence of 1 x l O I 4 e/cm2 encompassing only 3 cell groups), this product is somewhat lower, w2 x loB0 days/cm4. Although the cell-group samplings are rather low, the relationship between recovery time and density gradient does offer a possible criterion for pre-irradiation predic- tions of cell dynamics.
Two of the low-oxygen content cell groups have apparently stabilized as of 200 days after irradiation. Their power levels are comparable to n/p cells. These groups a re T6(1) and H7(1) cells, both of which were made from Lopex silicon. However, either low initial outputs or redegradation and, in a few cases both of these factors, have rendered most of the other float-zone and Lopex cells
32
non-competitive. A low-temperature, lithium diffusion cycle of long duration (325OC for 8 hours) looks interesting and should be pursued further. This diffu- sion cycle was used on lot T7, which had relatively good initial power and (so far, at 200 days) stable post-recovery behavior, in spite of a high density gradi- ent ( x 3 x 10¹⁹ ~ m - ~ ) which usually foreshadows redegradation.
C. SOLAR CELL EXPERIMENTS
Measurements of lifetime damage constant, K,, in both crucible-grown and Lopex solar cells containing lithium have established that the bombardment tem- perature (TB) dependence of K, is similar to the bombardment temperature de- pendence of carrier removal rate measured previously in Hall-bar bulk samples. The value of K, was shown to saturate at high temperatures and to decrease ex- ponentially at lower temperatures in agreement with a defect model proposed by Stein (Ref. 10). It is also of some interest that the lifetime damage constant for lithium-containing silicon is not greatly different from that for phosphorus-doped silicon.
For T9 cells (Lopex, dNL/dw x 5 x 10¹⁹ ~ m - ~ ) K, measured at 200°K saturated at xl. 5 x % 10l8 ~ m - ~ ) K, measured at 2OO0K saturated at xl. 5 x cm2/e-sec at TB x 105OK. The higher K, for the Lopex cells is presumably due to their higher lithium doping level.
cm2/e-sec at T w120°K, for C6C cells (crucible-grown, dNL/dw
Activation energy for lifetime recovexy was measured by making successive iso- thermal anneals. In the crucible cells, the activation energy for lifetime recovery was found to be x1.1 eV which is the activation energy for lithium diffusion in crucible silicon; in the Lopex cells the activation energy for lifetime recovery was found to be GO. 65 e V which is the activation energy for lithium in low-oxygen con- tent silicon. This result proves that, as predicted in the original model of Wysocki, lithium diffusion to defect sites is responsible for lifetime recovery in silicon of both low- and high-oxygen content. The study so far thus provides an encouraging degree of consistency between photovoltaic and lifetime measure- ments at all temperatures studied.
D. DIFFUSION CONSTANT MEASUREMENTS
The measurement of the lithium diffusion constant near room temperature in a high-oxygen content (QC) silicon cell (C6C20) using a lithium drift-capacitance method shows that two processes are occurring simultaneously; LiO' is dissoci- ating into Li' + 0 (Eact x 0 . 4 eV), and Lif is diffusing (EactXO. 65 eV). This is reflected by the measured activation energy of 1.03 eV for the combined process. The diffusion of the Li' results in the recovery of the radiation induced defects in these cells.
33
Thus, a completely independent physical measurement, involving no irradiation, gives an excellent confirmation of the basic physical parameters derived from the above irradiation experiments e
E. HALL MEASUREMENTS
A defect located at %Ec - 0.12 eV is produced by electron b mbardment of 9 lithium-lean float-zone silicon of high resistivity (2 x 10¹⁴ Li/cm ) at low tem- peratures. The defect survives in modified form at room temperature. This de- fect may possibly also be produced in low-resistivity silicon but at a reduced rate, so that it is undetectable. This particular defect level would not influence the electrical characteris tics of solar cells operating at room-temperature unless the lithium concentration in the cell was very high. Then the Fermi-level would be located at an energy of 0.12 eV at 300°K, and this defect would affect solar cell operating characteristics. However, stability requirements would limit the lithium concentration before this concentration was used.
There is no evidence of any dissociation of LiV damage centers during the anneal- ing cycle at T = 300°K of the high-resistivity float-zone samples. The damage centers responsible for carrier-removal in these samples are stable, that is, dissociation of damage centers does not occur. This property of the lithium- lean float-zone samples is in agreement with the results obtained on quartz- crucible samples. In addition, the annealing results and the saturated value of carrier-removal rate measured at high temperatures (lOO°K to 200°K) on high- resistivity float-zone samples suggest that F. Z. silicon with low lithium content behaves in the same manner as quartz-crucible silicon. It appears that the con- centration of oxygen relative to the concentration of lithium determines the an- nealing properties and the carrier-removal rates of lithium-containing silicon measured at high temperatures. These properties include the stability of both lithium neutralized and unannealed defect centers. Damage at high bombardment temperatures (TB = 100°K to 200°K) is also very dependent on the Li:O ratio.
The Hal l bar experiments suggest, in agreement with the conclusions of stability studies on solar cells, that the lithium concentrations can be high (2 x 1 0 l 6 ~ m - ~ ) in quartz-crucible silicon without producing unstable defect centers and annealed defect centers. In contrast to this, the concentration of lithium must be limited to a value 1015 cm-3 to achieve stability in float-zone silicon. This lower con- centration of lithium also produces lower carrier-removal rates in Hall samples made from this type of silicon.
34

1. Solar Cell Studies
Stability tests on shipments No. 1 through 6 will be continued. Cells for shipment No. 7, (H3A, T2, T7) will be irradiated. In addition, oxygen skin C8A and C8C cells will be irradiated together with their respective (no oxygen skin) controls - C8B and C8D cells.
The cold finger experiments will be continued with both low- and high-oxygen content cells of varying lithium density. An attempt will be made to answer some of the questions regarding the anomalously fast recovery of the T2 and T7 cells by performing successive isothermal anneals on these cells.
2. Diffusion Constant Measurements
Diffusion constant measurements will be continued on cells of several dif- ferent values of oxygen content and various lithium densities.
3. Hall Measurements
The search for experimental correlation of carrier-removal measurements with the behavior of lifetime in solar cells at low bombardment temperatures and of carrier density and mobility changes during annealing with recovery of solar cells will be continued. Acquisition of data required to develop a curve of car- rier-removal rate and annealing properties versus lithium concentration will also be continued. A preliminary set of lithium cell design rules will be formu- lated.
35
'1.
2.
3.
4.
5.
6.
7.
8.
9.
10 e
11.
12.
13 e
14 e
15 e
16.
G. J. Brucker, T. J. Faith, and A. G. Holmes-Siedle, Final Report, JPL Contract No. 952249, prepared by RCA and issued April 21, 1969.
E. M. Pell, J. Appl. Phys. 31, 291 (1960).
E. Me Pell, Phys. Rev. 119, 1222 (1960).
E. M. Pell, J. Appl. Phys. 32, 6 (1961).
G. J. Brucker, T. J, Faith, 5. P. Corra, andA. G. Holmes-Siedle, 2nd Quarterly Report, JPL Contract No. 952555, prepared by RCA and issued January 10, 1970.
W. Rosenzweig, Bell Sys. Tech. Journ. 41, 1573 (1962).
F. J. Morinand J. P. Maita, Phys. Rev. 96, 28 (1954).
R. N. Hall, Phys. Rev. 83, 228 (1951) and 87, 387 (1952).
W. Shockely andW. T. Read, Jr., Phys. Rev. 87, 835 (1952).
H. J. Stein and F. L. Vook, Phys. Rev. 163, 790 (1967).
G. J. Brucker, Phys. Rev. 183, 712 (1969).
W. Cooley and M. Barrett. Handbook of Space Environmental Effects on Solar Cell Power Systems, Contract NASw-1345, January 1968.
T. Faith, G, J. Brucker, A. Holmes-Siedle andR. Neadle, IEEE Trans. on Nuclear Science NS-15, 6 (1968).
G. J. Brucker, T. J. Faith, J. P. Corra, andA. G. Holmes-Siedle, First Quarterly Report, JPL Contract No. 952555, prepared by RCA and issued October 10, 1969.
F. L. Vook and H. J. Stein, llProducts of Defects in N-Type Silicon, Proceedings of the Santa Fe Conference on Radiation Effects in Semi- conductors, Plenen Press, N. Y., pp 99-114, Oct. 1967.
J. Stannard, Proceedings of the Conference on Effects of Lithium Doping on Silicon Solar Cells, Jet Propulsion Laboratory, Pasadena, Calif. , May 9, 1969.
36
G. J. Brucker, "Electrical Studies of Electron-Irradiated Lithium-Containing n-Type Silicon, I t Phys. Rev., Vol. 183, No. 3, 15 July 1969.
G. J. Brucker, T. Faith, and A. Ho. mes-Siedle, "Injection-Level Effects in Irradiated, Lithium-Containing Solar Cells, l t Conf. Record of the Seventh Photovoltaic Specialists Conference, IEEE, Pasadena, Calif. , Nov. 19-21, 1968.
T. J. Faith, G. J. Brucker, A. G. Holmes-Siedle, and J. Wysocki, "Long Term Stability of Lithium-Doped Solar Cells Irradiated with Electrons, Protons, o r Neutrons, lf Conf. Record of the Seventh Photovoltaic Specialists Conference, IEEE, Pasadena, Calif., Nov. 19-21, 1968.
*Papers published during this contract.
37