third quarter results 2015 - ir service quarter results 2015 matti lievonen, president & ceo 23...
TRANSCRIPT

Third quarter
results 2015
Matti Lievonen, President & CEO
23 October 2015

Agenda
23 October 2015 2
1 Q3/15 Group financials
2 January-September 2015 review
3 Q3/15 segment reviews
4 Current topics
5 Appendix
Disclaimer
The following information contains, or may be deemed to contain, “forward-looking statements”. These
statements relate to future events or our future financial performance, including, but not limited to,
strategic plans, potential growth, planned operational changes, expected capital expenditures, future
cash sources and requirements, liquidity and cost savings that involve known and unknown risks,
uncertainties and other factors that may cause Neste Corporation’s or its businesses’ actual results,
levels of activity, performance or achievements to be materially different from those expressed or
implied by any forward-looking statements. In some cases, such forward-looking statements can be
identified by terminology such as “may,” “will,” “could,” “would,” “should,” “expect,” “plan,” “anticipate,”
“intend,” “believe,” “estimate,” “predict,” “potential,” or “continue,” or the negative of those terms or other
comparable terminology. By their nature, forward-looking statements involve risks and uncertainties
because they relate to events and depend on circumstances that may or may not occur in the future.
Future results may vary from the results expressed in, or implied by, the following forward-looking
statements, possibly to a material degree. All forward-looking statements made in this presentation are
based on information presently available to management and Neste Corporation assumes no obligation
to update any forward-looking statements. Nothing in this presentation constitutes investment advice
and this presentation shall not constitute an offer to sell or the solicitation of an offer to buy any
securities or otherwise to engage in any investment activity.
23 October 2015 3

Record-high quarter
4
• All-time high quarterly
comparable operating profit of
EUR 281 million
• Refining margin environment
continued strong
• Strong cash flow thanks to
high EBITDA and reduced
working capital
• Production facilities in normal
operation after scheduled
turnaround in Porvoo
23 October 2015

Q3/15 Group financials

Group financials Q3/15
6
MEUR Q3/2015 Q3/2014
Revenue 3,023 3,846
Comparable EBITDA 368 273
Comparable operating profit 281 191
Oil Products 178 111
Renewable Products 75 53
Oil Retail 27 26
Others (incl. eliminations) 0 2
IFRS operating profit 158 54
Net cash from operations 322 -144
Comparable earnings per share, EUR 0.89 0.49
23 October 2015
Q3/14 Referencemargin
Additionalmargin excl. fx
hedges
Volumes Fx changesincl. fx hedges
Fixed costs Other Q3/15
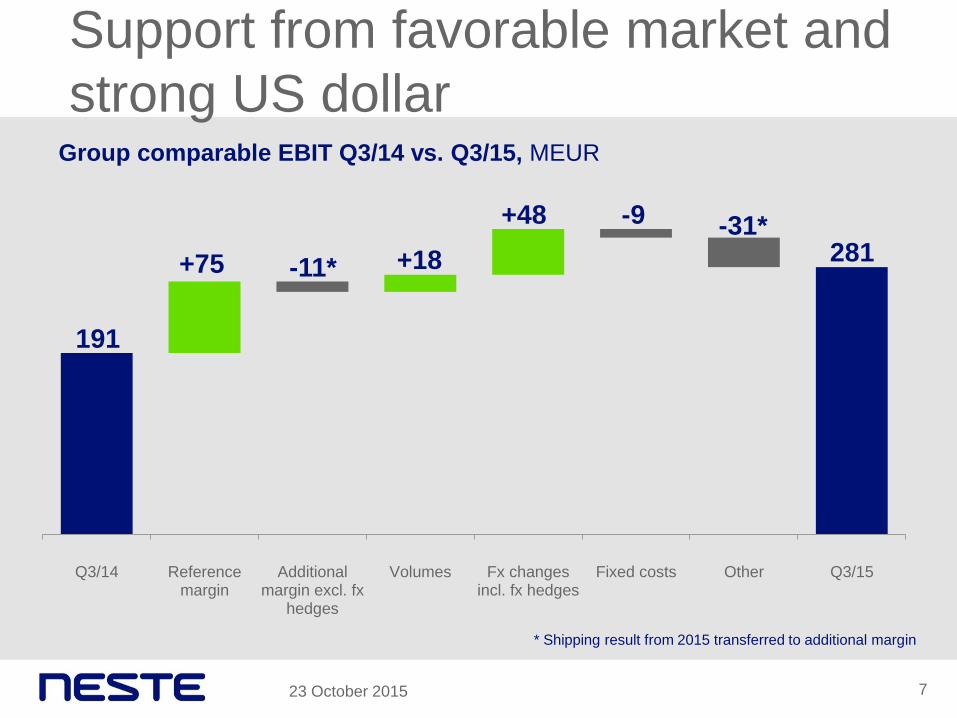
Support from favorable market and
strong US dollar
7
Group comparable EBIT Q3/14 vs. Q3/15, MEUR
23 October 2015
191
-11* +75 +18
-9
281
+48 -31*
* Shipping result from 2015 transferred to additional margin

ROACE approaching 15% target level
8
0
10
20
30
40
50
Q3/14 Q4/14 Q1/15 Q2/15 Q3/15
0
5
10
15
20
Q3/14 Q4/14 Q1/15 Q2/15 Q3/15
ROACE, rolling 12 months, % Leverage, %
23 October 2015
14.5 35.7

January-September 2015 Review

Strong performance despite scheduled
Porvoo turnaround in spring
10
• Comparable operating profit
almost at full-year 2014 level
• Clearly higher reference refining
margins compared to 2014
• Higher additional margin and
sales volumes in Renewable
Products
• Positive margin and volume
trend in Oil Retail
• Favorable USD/EUR exchange
rate
23 October 2015

Group financials 1-9/15
11
MEUR 1-9/2015 1-9/2014
Revenue 8,372 11,459
Comparable EBITDA 822 572
Comparable operating profit 574 327
Oil Products 348 176
Renewable Products 171 97
Oil Retail 67 60
Others (incl. eliminations) -12 -6
IFRS operating profit 454 175
Net cash from operations 364 -103
Comparable earnings per share, EUR 1.69 0.79
23 October 2015

1-9/14 Changes in oil price Volume Fx changes 1-9/15
-0.9
Decrease in revenue mainly due to
oil price decline
12
32 +1.3
11.5 -3.5
23 October 2015
8.4
Group revenue 1-9/14 vs. 1-9/15, billion euros
1-9/14 Referencemargin
Additionalmargin excl. fx
hedges
Volumes Fx changesincl. fx hedges
Fixed costs Other 1-9/15
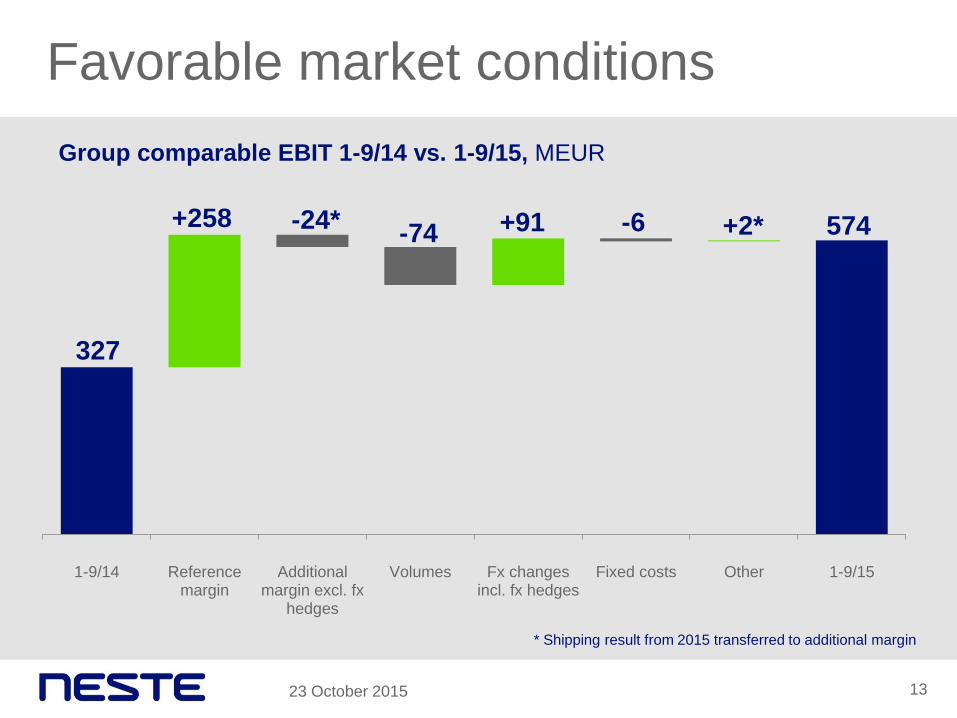
Favorable market conditions
13
Group comparable EBIT 1-9/14 vs. 1-9/15, MEUR
23 October 2015
327
-74 +258 -24* -6 574 +91 +2*
* Shipping result from 2015 transferred to additional margin

Q3/15 segment reviews
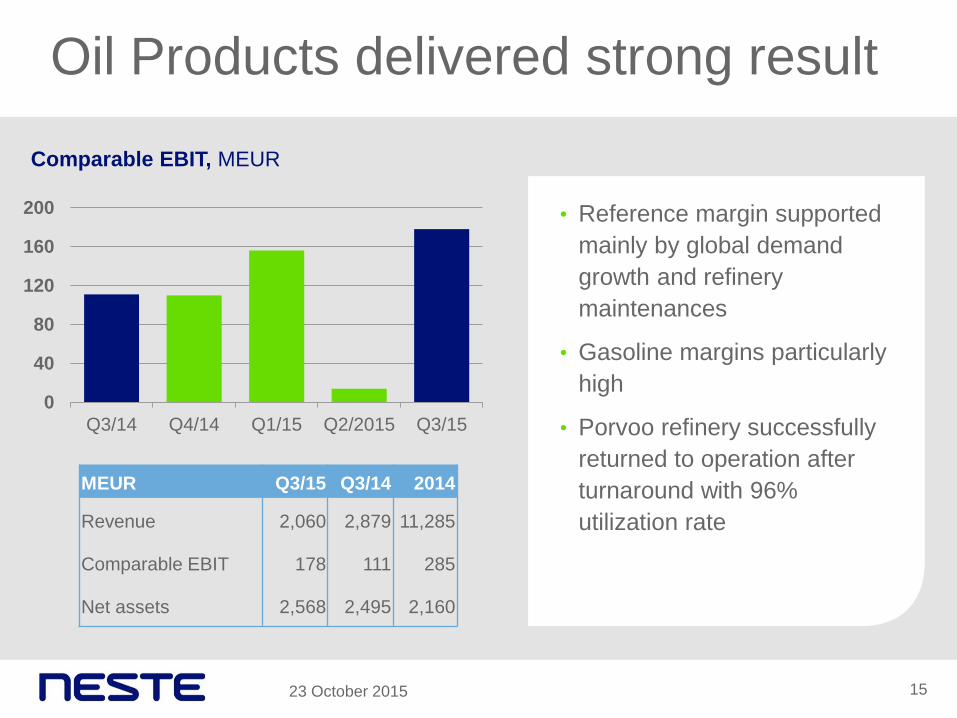
Oil Products delivered strong result
15
Comparable EBIT, MEUR
• Reference margin supported
mainly by global demand
growth and refinery
maintenances
• Gasoline margins particularly
high
• Porvoo refinery successfully
returned to operation after
turnaround with 96%
utilization rate
0
40
80
120
160
200
Q3/14 Q4/14 Q1/15 Q2/2015 Q3/15
MEUR Q3/15 Q3/14 2014
Revenue 2,060 2,879 11,285
Comparable EBIT 178 111 285
Net assets 2,568 2,495 2,160
23 October 2015

Q3/14 Referencemargin
Additionalmargin excl. fx
hedges
Volumes Fx changesincl. fx hedges
Fixed costs Other Q3/15
Support from favorable refining margins
16
Oil Products comparable EBIT Q3/14 vs. Q3/15, MEUR
23 October 2015
111
-12* +81 +3
-7
178
+32 -30*
* Shipping result from 2015 transferred to additional margin

High reference margin thanks to
gasoline and lower utility costs
17
0
2
4
6
8
10
12
14
Q3/14 Q4/14 Q1/15 Q2/15 Q3/15
Total refining margin
Reference refining margin
Neste refining margins, USD/bbl
• Reference margin USD 9.1/bbl
almost 60% higher than in
Q3/2014
• Lower utility costs resulting in 30%
lower production costs than in
Q3/2014
• Additional margin of USD 4.1/bbl
negatively impacted by lower oil
price
• Shipping’s cumulative result from
2015 transferred to additional
margin
23 October 2015

Gasoline margins peaked in Q3
18
Product margins (price differential vs. Brent),
USD/bbl
-30
-20
-10
0
10
20
30
Jan-13 Jul-13 Jan-14 Jul-14 Jan-15 Jul-15
Diesel Gasoline Heavy Fuel Oil
-4
-3
-2
-1
0
1
Jan-13 Jul-13 Jan-14 Jul-14 Jan-15 Jul-15
Urals vs. Brent price differential,
USD/bbl
23 October 2015

Renewable Products’ performance
continued to strengthen
19
0
50
100
150
Q3/14 Q4/14 Q1/15 Q2/15 Q3/15
Comparable EBIT, MEUR
• Clearly higher comparable EBIT
compared to Q3/14
• High utilization rate of 99%
• Share of sales to Europe 66%
and 34% to North America
• Share of waste and residues
feedstock increased to record-
high 75% MEUR Q3/15 Q3/14 2014
Revenue 582 560 2,269
Comparable EBIT 75 53 239
Net assets 1,689 1,763 1,923
23 October 2015

Q3/14 Volumes Referencemargin
Additionalmargin excl.fx hedges
Fx changesincl. fxhedges
Fixed costs Others Q3/15
-6
-1
Positive impact from higher sales
volumes and stronger US dollar Renewable Products comparable EBIT Q3/14 vs. Q3/15, MEUR
20
53
-2
+13
+17
+1
23 October 2015
75
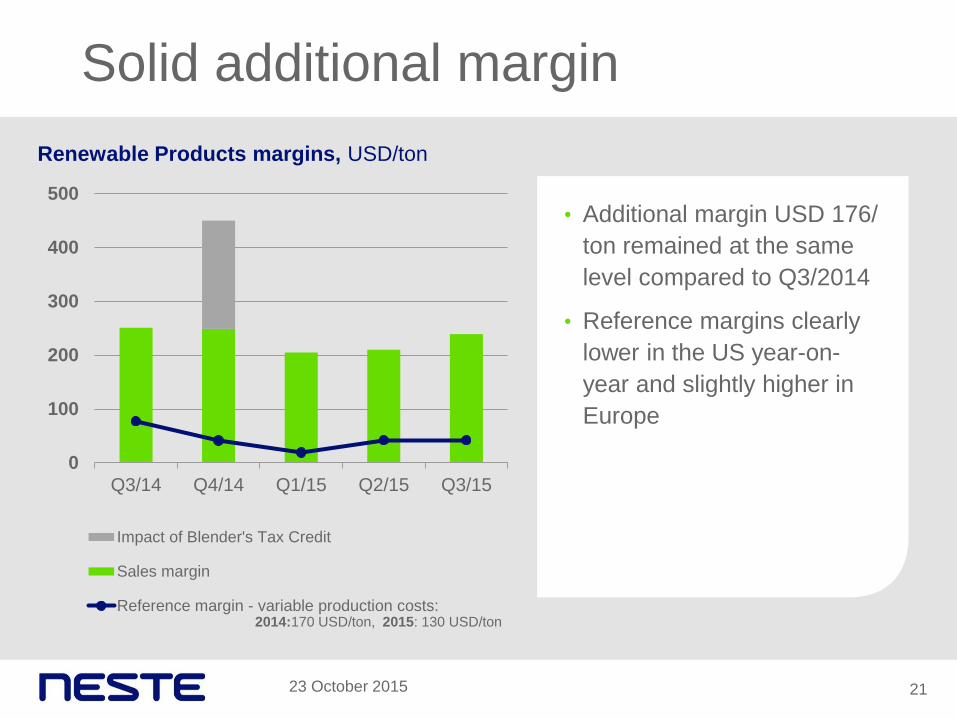
Solid additional margin
21
0
100
200
300
400
500
Q3/14 Q4/14 Q1/15 Q2/15 Q3/15
Impact of Blender's Tax Credit
Sales margin
Reference margin - variable production costs:
Renewable Products margins, USD/ton
• Additional margin USD 176/
ton remained at the same
level compared to Q3/2014
• Reference margins clearly
lower in the US year-on-
year and slightly higher in
Europe
23 October 2015
2014:170 USD/ton, 2015: 130 USD/ton

400
600
800
1,000
1,200
1,400
Jan-13 Jul-13 Jan-14 Jul-14 Jan-15 Jul-15
Soybean Rapeseed Palm oil Animal fat
0
100
200
300
400
500
Jan-13 Jul-13 Jan-14 Jul-14 Jan-15 Jul-15
22
Improved European margins
22
FAME RED Seasonal vs. Palm oil price*
differential, USD/ton
Vegetable oil and animal fat prices**, USD/ton
* Including $70/ton freight
**Quotations in NWE, source: Oil World
23 October 2015

0
50
100
150
Jan-13 Jul-13 Jan-14 Jul-14 Jan-15 Jul-15
Biomass-based diesel (D4)
Conventional renewable fuel (D6)
0
200
400
600
800
Jan-13 Jul-13 Jan-14 Jul-14 Jan-15 Jul-15
Weak US market due to pending
regulatory decisions
23
Biodiesel RIN, US cent /gal SME vs. Soybean oil price differential, USD/ton
23 October 2015

Oil Retail seasonally strong
24
Comparable EBIT, MEUR
• Markets remain stable
• Unit margins improved with a
positive impact of EUR 2
million
• Sales volumes increased,
especially in the Baltics
• Weaker ruble had only a
minor negative impact
0
10
20
30
Q3/14 Q4/2014 Q1/15 Q2/15 Q3/15
MEUR Q3/15 Q3/14 2014
Revenue 991 1,153 4,294
Comparable EBIT 27 26 68
Net assets 190 271 201
23 October 2015

Positive impact from higher
volumes and better margins
25
Oil Retail comparable EBIT Q3/14 vs. Q3/15, MEUR
Q3/14 Volumes Unit margin Fx changesincl. fxhedges
Fixed costs Others Q3/15
26 +2
+2 0 27
-2
23 October 2015
-1

Current topics

Outlook
23 October 2015 27
• Guidance statement
remains unchanged:
Group's full-year 2015
comparable EBIT
estimated to remain robust
and to be higher than in
2014
• Expected capital
expenditure approx.
EUR 500 million in 2015
• Refining market expected
to follow normal
seasonality, but market
conditions remain
reasonably favorable
• Neste will discontinue
giving out numerical
result guidance starting
2016

Rotterdam turnaround
23 October 2015 28
• Rotterdam NEXBTL
renewable diesel refinery
scheduled for a major
turnaround in Q2/2016
• Duration approx. seven
weeks

We focus on
29
Cash flow Refinery
productivity
Markets and
customers Safety
23 October 2015

23 October 2015 30
New vision takes us forward
Our vision
Creating responsible choices every day

Appendix
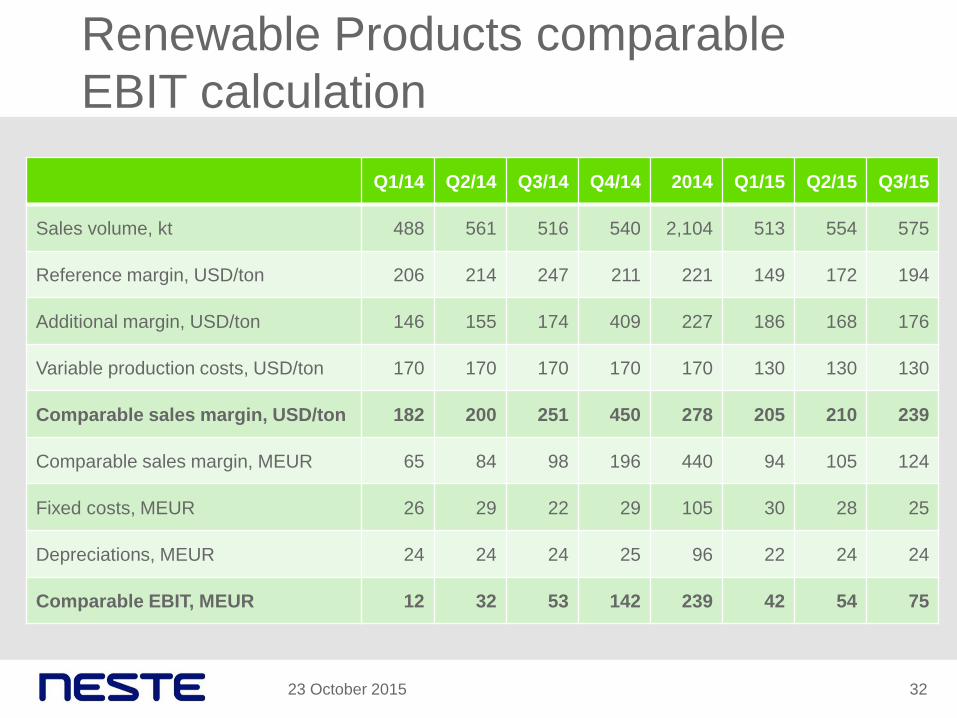
Renewable Products comparable
EBIT calculation
23 October 2015 32
Q1/14 Q2/14 Q3/14 Q4/14 2014 Q1/15 Q2/15 Q3/15
Sales volume, kt 488 561 516 540 2,104 513 554 575
Reference margin, USD/ton 206 214 247 211 221 149 172 194
Additional margin, USD/ton 146 155 174 409 227 186 168 176
Variable production costs, USD/ton 170 170 170 170 170 130 130 130
Comparable sales margin, USD/ton 182 200 251 450 278 205 210 239
Comparable sales margin, MEUR 65 84 98 196 440 94 105 124
Fixed costs, MEUR 26 29 22 29 105 30 28 25
Depreciations, MEUR 24 24 24 25 96 22 24 24
Comparable EBIT, MEUR 12 32 53 142 239 42 54 75

Refinery production costs,
Porvoo & Naantali
Q3/14 Q4/14 2014 Q1/15* Q2/15* Q3/15
Refined products Million barrels 26.0 25.8 103.2 27.3 12.2 27.8
Exchange rate EUR/USD 1.33 1.25 1.33 1.13 1.10 1.11
Utilities costs
EUR million 40.5 47.2 173.4 36.6 33.3 29.8
USD/bbl 2.1 2.3 2.2 1.5 3.0 1.2
Fixed costs
EUR million 50.8 71.7 238.0 52.1 59.6 53.1
USD/bbl 2.6 3.5 3.1 2.2 5.4 2.1
External cost sales
EUR million -4.9 -4.9 -24.4 -5.2 -5.0 -5.8
USD/bbl -0.2 -0.2 -0.3 -0.2 -0.4 -0.2
Total
EUR million 86.4 113.9 387.1 83.5 88.0 77.2
USD/bbl 4.4 5.5 5.0 3.5 8.0 3.1
23 October 2015 33
* Q1/15 and Q2/15 figures revised

Balance sheet
34
2,486 2,860
4,131 4,110
0
1,000
2,000
3,000
4,000
5,000
6,000
7,000
8,000
30 Sep 15 30 Sep 14
1,819 2,224
1,933 1,980
2,865 2,766
0
1,000
2,000
3,000
4,000
5,000
6,000
7,000
8,000
30 Sep 15 30 Sep 14
Non-current assets
Current assets
Equity Int-bear. liabilities
Int-free liabilities
Total assets Total equity & liabilities
23 October 2015 34
6,618 6,970 6,618 6,970

Cash flow
MEUR Q3/15 Q3/14 Q2/15 2014
EBITDA (IFRS) 245 136 146 480
Capital gains/losses 0 0 2 2
Other adjustments -62 -35 96 -80
Change in working capital 208 -220 28 -33
Net finance costs -50 -4 -18 -44
Taxes -20 -21 -28 -77
Net cash from operating activities 322 -144 227 248
Capital expenditure -145 -52 -198 -272
Other investing activities 72 -4 -14 -34
Cash flow before financing activities 249 -200 14 -59
23 October 2015 35

Liquidity & maturity profile
0
100
200
300
400
500
600
700
2015 2016 2017 2018 2019 2020+
Short-term
Long-term
MEUR
36
• Total liquidity at the end of September 2015 was EUR 2,389 million
• Cash and cash equivalents totalled EUR 339 million
• Unused committed credit facilities totalled EUR 1,650 million
• Unused CP programmes (not committed) totalled EUR 400 million
• Average interest rate was 3.3% and maturity 3.8 years at the end of September
• No financial covenants in Group’s existing loan agreements
23 October 2015

The only way
is forward.