third quarter report - via · pdf filethird quarter at a glance 4 transformation milestones 6...
TRANSCRIPT

THIRD QUARTERREPORT
EVOLUTION
TRANSFORMATION
CONNECTION


CONTENT
PRESIDENT’S MESSAGE 2
THIRD QUARTER AT A GLANCE 4
TRANSFORMATION MILESTONES 6
Capital Investment 6
Tracks 6
Trains 6
Stations 6
Technology and Customer Experience 7
Intermodal Partnerships 8
Lean Management 9
Social Media 9
KEY PERFORMANCE INDICATORS 10
COMMUNITY AND GOVERNANCE 11
Safety Outreach 11
Partnership with the Canadian Institute for Citizenship 11
The Board of Directors 12
Official Languages 12
Access to Information and Privacy 13
Community Involvement 13
Travel, Hospitality and Conference Expenses 13
MANAGEMENT DISCUSSION AND ANALYSIS 14
INTERIM CONDENSED FINANCIAL STATEMENTS 24
VIA
RA
IL C
AN
AD
A /
TH
IRD
QU
AR
TER
RE
PO
RT
2012
/ P
RESI
DEN
T’S
MES
SAG
E
2
PRESIDENT’S MESSAGE
The first three quarters of 2012 have underlined how important it is for VIA to keep moving forward with its transformation of passenger rail. We have to continue modernizing passenger rail operations, and make the fundamental changes that will help VIA Rail become a financially viable operation in the years ahead.
So far, 2012 has been challenging for the travel industry, with markets showing little sign of growth. In the third quarter, VIA Rail continued to face significant challenges with respect to both ridership and revenues, in all parts of its passenger rail network.
We launched new marketing and pricing strategies to retain customers and attract new ones. At the same time, we worked harder than ever to control costs, and improve our productivity. In fact, we reduced operating costs for the quarter to offset reduced revenues. And we are doing everything we can to make sure we stay within our funding enveloppe for the year.
But we will continue to face major financial challenges this year, and beyond. Like any other public or private sector organization, we have to change and adapt to economic realities.
We began making important changes in 2007, when the Government of Canada announced that it would invest almost one billion dollars to renew our aging locomotives, passenger cars and stations, improve railway tracks, and develop information technologies to improve service while reducing operating costs. So far we have completed 80% of the investment program. We have also continued to introduce newly refurbished trains into service during the third quarter. New sections of upgraded track were opened to deliver faster, more reliable service. We opened more new and rebuilt stations across Canada. And we continued implementing new technologies, such as electronic ticketing to make travel with VIA easier and more convenient than ever before.
Marc LalibertéPresident and Chief Executive Officer
VIA
RA
IL C
AN
AD
A /
TH
IRD
QU
AR
TER
RE
PO
RT
2012
/ P
RESI
DEN
T’S
MES
SAG
E
3
Now we have to look at the best ways to use our resources to deliver a better return for our operating funding. In markets where there is an opportunity to grow – such as the Montreal-Ottawa-Toronto market – faster and more frequent service is essential for passenger rail. With better trains and tracks, we have already added more frequent services, and shortened trip times. We will add more frequencies including a new direct Ottawa-Toronto, Montreal-Quebec City and Ottawa-Quebec City service.
But in some markets, it means adjusting frequencies to better reflect current and anticipated ridership levels. As announced last June, we began reducing the number of trains we operate on our long distance services, the Canadian and the Ocean. As well, on some Corridor routes, we have adjusted service levels in line with market demand and reduced the duplication of services in Toronto area markets where GO Transit commuter trains and buses operate. These are important steps to reduce costs.
We are also reshaping the role of passenger rail in partnership with other transportation services. We have to stop thinking of passenger rail as a separate system that runs independently from other services, such as air, bus and commuter lines. We have to start thinking of our services as a connected part of the entire transportation system – one that can work far more efficiently when it works in partnership with other services.
Over the past 12 months we have entered into intermodal partnerships with commuter train and bus services in Quebec, Ontario, Alberta and British Columbia, and with Air Transat, an international airline. This past quarter, we added Royal Jordanian, another airline, and Robert Q Motorcoaches in Sarnia to our growing list of partners. Such partnerships can allow us to integrate our web ticketing facilities, harmonize our schedules and cross-promote each other’s intermodal services.
The result is an integrated system that is more convenient and efficient for travelers – a system that will attract more people out of their cars and onto public transportation, including VIA’s trains.
As we move forward, our long term goal is to make VIA Rail a financially and commercially viable operation, with a new approach to operating as a publicly-owned business. We want to make our intercity services in the Corridor, and our peak season services in Atlantic and Western Canada, break even. That means for these services, our goal is to ensure that revenues cover operating costs. For all other services, our goal is to limit the need for government funding as much as possible.
We have a long way to go, and many challenges to overcome, before we can reach our objective. But the challenges we have faced this year show that the status quo is not a viable option. And we are making progress, putting the changes necessary into place for the future.
In closing, I wish to welcome Elizabeth Van den Eynden and Ramona Materi as VIA Rail Canada’s new members of the Board. Appointed on October 4th by the Government of Canada, we are confident their knowledge, leadership skills and experience will be important assets to VIA Rail.
I also wish to underline the important contribution of departing directors Anthony Pearl and Wendy King. Their dedication and understanding of the transportation industry were valuable resources for VIA Rail. I wish them the best in their future endeavours.

VIA
RA
IL C
AN
AD
A /
TH
IRD
QU
AR
TER
RE
PO
RT
2012
/ T
HIR
D Q
UA
RTER
AT
A G
LAN
CE
4
THIRD QUARTER AT A GLANCE
(1) Deficit before amortization of Deferred Capital Funding & Corporate Taxes.
Q3-2012 Q3-2011 YTD-2012 YTD-2011
KEY FINANCIAL INDICATORS (in millions of dollars)Total passenger revenues 77.2 79.6 196.2 201.2
Total revenues 82.3 83.7 211.1 214.5
Operating expenses 151.0 149.2 449.8 432.9
Government funding 65.2 61.7 216.7 199.1
Amortization of Deferred Capital Funding 14.2 12.1 43.6 33.1
Corporate Tax Expense 2.4 0.6 4.7 (3.1)
Net income (net loss) and comprehensive income 8.3 7.7 16.9 16.9
Capital expenditures 32.0 61.6 116.0 171.9
KEY OPERATING STATISTICSTotal passenger-miles (in millions) 245 258 621 648
Total seat-miles (in millions) 423 425 1,175 1,161
Operating deficit per passenger-mile (in cents) (1) 28.0 25.4 38.4 33.7
Yield (cents per passenger-mile) 30.8 30.5 30.9 30.8
Train-miles operated (in thousands) 1,656 1,662 4,932 4,930
Car-miles operated (in thousands) 13,393 13,355 34,667 34,207
Average passenger load factor (%) 58 61 53 56
Average number of passenger-miles per train mile 148 155 126 131
On-time performance (%) 83 86 84 84
Average number of full time employees during the period 2,812 2,908 2,812 2,908

VIA
RA
IL C
AN
AD
A /
TH
IRD
QU
AR
TER
RE
PO
RT
2012
/ T
HIR
D Q
UA
RTER
AT
A G
LAN
CE
5
PASSENGER REVENUES AND RIDERSHIP FOR THE THIRD QUARTER OF 2012
Train ServicePassenger Revenues*(in thousands)
Passengers(in thousands)
Passenger-Miles(in thousands)
Goverment Funding
(per passenger mile)
Corridor $50,251 910 158,638 $0.23
Longhaul West $18,645 45 55,431 $0.16
Longhaul East $4,847 41 21,037 $0.39
Mandatory Services $2,487 34 10,350 $1.07
Total $76,229 1,030 245,455 $0.27
PASSENGER REVENUES AND RIDERSHIP FOR THE 9 MONTHS ENDED SEPT. 30, 2012
Train ServicePassenger Revenues*(in thousands)
Passengers(in thousands)
Passenger-Miles(in thousands)
Goverment Funding
(per passenger mile)
Corridor $143,667 2,622 440,806 $0.27
Longhaul West $34,350 91 111,237 $0.33
Longhaul East $11,011 109 49,416 $0.54
Mandatory Services $4,432 71 19,769 $1.77
Total $193,461 2,893 621,228 $0.35
* Before off-train and other passenger revenues.

VIA
RA
IL C
AN
AD
A /
TH
IRD
QU
AR
TER
RE
PO
RT
2012
/ T
RAN
SFO
RMAT
ION
MIL
ESTO
NES
6
TRANSFORMATION MILESTONESSince 2007 the Government of Canada has committed $923 million to upgrade tracks, modernize passenger stations, and renew passenger trains and technology. To capture the benefits of this investment, VIA is transforming its own operations to increase efficiency and deliver more value to customers. At the same time it is aligning train services more closely with markets across Canada -- matching train schedules, capacity and pricing to market demand.
CAPITAL INVESTMENTBy the end of the third quarter of 2012, 80% of the $923 million fund had been invested The Transforming VIA website (www.viarail.ca/transformingVIA) provides up-to-date information on many of the train, track and station work currently underway across VIA’s network. Image galleries and additional project details create a comprehensive online reference point for all projects.
TracksIn June 2012 VIA, in cooperation with Goderich-Exeter Railway (GEXR), released a tender for major safety improvements and signal work on the Guelph Subdivision between Georgetown and London, Ontario. The work package includes Centralized Traffic Control (CTC) of approximately 90 miles (144 Km) of track as well as significant level crossing upgrades. Tenders have now closed and it is planned that the construction work will get underway this fall and will continue into 2013.
Work also continued on major projects to increase the capacity of CN-owned track between Brockville and Toronto, which will allow VIA to add more frequencies between Ottawa and Toronto as well as future additional frequencies between Montreal and Toronto. With projects at Brockville and Gananoque already complete, the new third track section between Grafton and Cobourg was put in service at the end of July 2012.
Improvements to VIA-owned infrastructure started in early July. This work includes the replacement of approximately 28,000 ties on the Alexandria and Smiths Falls Subdivisions and another 16,000 on the Chatham Subdivision. Also included is the replacement of sections of track ballast and crossing rehabilitations. Design work for the replacement of Centralized Traffic Control systems in the Ottawa area and between Coteau - De Beaujeu, Quebec is also underway.
TrainsVIA is rebuilding most of its locomotives and passenger cars to extend their life, enhance environmental performance and efficiency, and to provide better comfort and service to customers – including better accessibility for people with special mobility needs.
As of September 30, 2012, 51 of VIA’s 53 F-40 locomotives have been completed, along with 16 of VIA’s 59 Renaissance passenger cars and 10 of 97 Light, Rapid Comfortable (LRC) passenger cars. Six (6) Rail-Diesel (RDC) cars have yet to be completed.
During the quarter, VIA finalized a new contract to complete 12 HEP-I Park and sleeper cars with new reconfigured interiors.
StationsVIA is upgrading and modernizing key passenger stations across the country to serve customers more efficiently, and to address operational and safety needs.
Work is advancing well at Oshawa and Cobourg, where, together with track capacity improvements to be completed later this year, the new fully accessible overhead walkway structures will accommodate the growing number of passengers who use the facilities each year. The new overhead walkway at Oshawa was opened to passengers in July 2012.

VIA
RA
IL C
AN
AD
A /
TH
IRD
QU
AR
TER
RE
PO
RT
2012
/ T
RAN
SFO
RMAT
ION
MIL
ESTO
NES
7
The new Windsor Station opened to the public on September 11, 2012. Demolition of the existing station building and site work will follow, and should be completed by this year end.
VIA recently started a new project to upgrade its Winnipeg Station that will improve public areas and passenger services, upgrade the exterior of the East side of the station and both sides of the train shed, and improve accessibility from the boarding lounge to the platform level, and various other building improvements to ensure long term tenant retention. This work is forecasted to be complete by December 2013.
TECHNOLOGY AND CUSTOMER EXPERIENCEOn Train and Station AutomationOn Train and Station Automation (OTS) is a central focus of VIA’s program to develop and implement new technologies that enhance the customer’s experience with VIA Rail. The system links many “back-end” or behind-the-scenes systems with our front-line employees, through Blackberry smartphones.
Key elements of the OTS project were introduced early this year, including on-board real-time passenger manifests, which greatly enhance boarding efficiency as well as on-train service delivery; train status information (TSI), such as estimated arrivals and departure information, easily communicated to all VIA staff and passengers; and improved communication between on-board VIA staff and other VIA departments.
E-Boarding PassesA key element of the OTS system is electronic ticketing and boarding passes. After pilot testing in July, VIA launched e-boarding in the Quebec City-Windsor Corridor in August.
Customers who book travel in the Corridor now receive an e-boarding pass by email, which can be printed at home, or used directly from their smartphone. The boarding pass is then scanned at the boarding gate and on the train by staff equipped with a smartphone and scanner, which are linked to VIA’s central reservation system. When scanned, the boarding pass is validated and the passenger’s name added to the “virtual” list of passengers travelling on that train.
This is both a more efficient and reliable way of updating the passenger list. It also means that other departments can have access to the real-time information. Staff can know, at a glance, how many seats are still available on the train for any stand-by passengers, or if any ticket holders are missing. They also have the most up-to-date information about passenger service requests such as meal choices and train connections, greatly improving the quality of customer service.
Improving Access for International TravelersInternational travelers planning trips to Canada can now compare trains and flights at a glance using Skyscanner, a leading global travel search site. In partnership with VIA, Skyscanner has integrated VIA’s inter-city routes into its existing flight search capability. Travelers searching for flights between Toronto and Montreal, for example, will see the air and rail travel alternatives in the search results. When choosing the rail option, the customer can click through to the VIA Rail site to make the booking. For passengers who are flexible on their dates of travel, Skyscanner will show the cheapest price to travel, making it easy and stress-free to plan travel around the country.

8
VIA
RA
IL C
AN
AD
A /
TH
IRD
QU
AR
TER
RE
PO
RT
2012
/ T
RAN
SFO
RMAT
ION
MIL
ESTO
NES
Entertainment On BoardVIA launched a pilot for a new system that allows passengers to watch news, TV shows and documentaries while they travel. Selected programming from CBC, Radio-Canada and the National Film Board is streamed through a dedicated WiFi server installed on the train without affecting regular internet access for customers using VIA’s on board WiFi service.
Agent’s Choice AwardReliable service and on board WiFi access helped VIA Rail win the 2012 Baxter Travel Media’s Agent’s Choice Award for the 6th year in a row. In choosing VIA, travel agents also praised VIA for a developing a new online training course for travel agents, and for continuously improving passenger services.
VIA has now won this award 11 times in the last 12 years.
INTERMODAL PARTNERSHIPSThe transformation of passenger rail also involves building better intermodal partnerships with other transportation services – making it easier for people to find the right solution for their travel needs.
Since January 2010, VIA Rail has implemented one-stop shopping experiences for bus connections between trains and airports in Montreal and Toronto, for connections between VIA Rail trains and GO regional trains in Ontario, as well as partnerships with car rental agencies, and Air Transat international services operating out of Montreal. During the third quarter of 2012 VIA added a new partnership with Royal Jordanian, the national air carrier of Jordan, to allow Royal Jordanian to sell VIA train tickets to its passengers who wish to continue their travels beyond their destination city of Montreal and on to Toronto or Ottawa.
VIA has also made arrangements to offer its web ticketing facilities, stations and other cross-promotional platforms to regional carriers in the Atlantic region this fall, in order to offer one-stop, integrated travel experiences to travelers.
9
VIA
RA
IL C
AN
AD
A /
TH
IRD
QU
AR
TER
RE
PO
RT
2012
/ T
RAN
SFO
RMAT
ION
MIL
ESTO
NES
LEAN MANAGEMENTLean Management techniques improve efficiency by analyzing business activities, focusing on the value of those activities to customers, and eliminating wasted effort and resources that do not add value. VIA began implementing Lean Management in 2010-11, training coaches and developing awareness of the process throughout the organization, and launching Lean projects in areas such as improving the on-time performance, resolving customer complaints, and reducing equipment maintenance delays.
As September 30, 2012, 33 Lean projects and initiatives were completed or expected to be completed by the end of the year.
SOCIAL MEDIAIn 2011 VIA expanded its use social media to connect with customers, communities and stakeholders through Facebook (facebook.com/viarailcanada) and Twitter (twitter.com/via_rail). Along with email, and VIA’s award-winning website (viarail.ca), social media helps VIA to maintain a strong online presence, and engage in a dynamic dialogue with customers. VIA has also implemented a new corporate blog, VIA Evolution (VIAEvolution.ca). The blog features weekly commentaries and insights from VIA executives on VIA’s business strategy, initiatives and operations, and provides an opportunity to explain the reasoning behind VIA’s business decisions.
During the third quarter, VIA Rail was discussed or mentioned 19,299 times in social media including blogs and online publications . On Twitter there were over 12,500 comments mentioning VIA Rail. There were over 338 posts on VIA’s Facebook page, along with 2,365 “likes” and 1,142 posted comments.

VIA uses the following performance indicators as an integral part of its Lean Management process. For detailed information on financial and operating performance during the quarter consult the Management Discussion and Analysis.
Q3 2012 Q3 2011
Total Revenue per Employee ($000s) YTD revenues divided by the number of employees. A measure of productivity. 109 109
Passenger Revenues per Available Seat-Mile (¢) Revenues divided by available seat-miles. 18 19
Direct Costs per Available Seat-Mile (¢) Direct costs divided by available seat-miles. 22 22
On-Time Performance (%) Excludes mandatory services 83 86
Employee Attendance (%) Total hours of absences per month divided by the total possible work hours per month. 93 92
Train Incidents per Million Train-Miles Includes collisions between two (2) trains; derailments with at least one wheel off the track; all cardinal rule violations; excludes crossing accidents and trespassing. 2 2
VIA
RA
IL C
AN
AD
A /
TH
IRD
QU
AR
TER
RE
PO
RT
2012
/ K
EY P
ERFO
RMA
NCE
IND
ICAT
ORS
10
KEY PERFORMANCE INDICATORS
VIA
RA
IL C
AN
AD
A /
TH
IRD
QU
AR
TER
RE
PO
RT
2012
/ C
OM
MU
NIT
Y A
ND
GO
VER
NA
NCE
11
COMMUNITY AND GOVERNANCE
SAFETY OUTREACHThe majority of rail safety incidents occur at intersections where roads cross rail tracks, or involve pedestrians trespassing on rail property. These types of incidents often caused by people underestimating the dangers of trespassing on rail property or trying to cross tracks in front of trains. VIA Rail has developed a comprehensive community outreach program to help educate and raise public awareness of these dangers.
VIA also works with the owners of private property where road-rail crossings are located, encouraging them to eliminate these danger points through Transport Canada’s Closure Crossing Program. These efforts earned VIA a safety award from the Railway Association of Canada in 2011, and continue to be a priority in 2012. As of September 30, five crossings on VIA’s Alexandria subdivision have been submitted in 2012 and approved by Transport Canada for closures.
PARTNERSHIP WITH THE CANADIAN INSTITUTE FOR CITIZENSHIPOn July 1st of this year, VIA Rail Canada announced a new partnership with the Institute for Canadian Citizenship which will allow new Canadian citizens to discover their adopted country by train. With this announcement VIA Rail is now offering all new Citizens who are members of the Cultural Access Pass program, a 50% discount on the lowest available fare on any VIA train. The one-time offer applies to any class, both one way and round trips, with no blackout periods, to all new Citizens and up to four of their children under the age of 18.
Since its launch, close to 500 new citizens have taken advantage of the discount and travelled aboard VIA trains, enjoying the service, the views, and becoming more immersed in Canadian culture.

VIA
RA
IL C
AN
AD
A /
TH
IRD
QU
AR
TER
RE
PO
RT
2012
/ C
OM
MU
NIT
Y A
ND
GO
VER
NA
NCE
12
THE BOARD OF DIRECTORSThe Board of Directors consists of the Chairperson, the President and Chief Executive Officer and 11 other directors appointed by the Government of Canada. The Board is responsible for overseeing the strategic direction and management of the Corporation, and reports on VIA’s operations to Parliament through the Minister of State (Transport).
During the third quarter of 2012, one Board Meeting and six Board Committee meetings were held. The overall average attendance rate of Board members at the Board Meeting was of 91%, and of 86% for the Board Committees. Cumulative fees for Board members during this time period totaled $44,689.
OFFICIAL LANGUAGESVIA received two (2) complaints under the Official Languages Act during the second quarter of 2012, which were still in progress at the end of the quarter.
Language of Work InitiativesIn 2011 Last year, VIA conducted a Language of Work Survey in regions designated as bilingual. The goal of the survey was to assess VIA employees’ opportunities to perform their duties in the official language of their choice. The results of this survey showed a significant improvement over those of a survey completed in 2008.
On Linguistic Duality Day (September 13) VIA announce a number of measures based on this survey to promote even more linguistic duality in the workplace. The initiatives include:
/ Information campaigns on rights and obligations with respect to language of work;
/ New tools to promote freedom of choice for the use of language, particularly during meetings; and
/ Reminders on the importance of practicing VIA’s active offer of bilingual services.

VIA
RA
IL C
AN
AD
A /
TH
IRD
QU
AR
TER
RE
PO
RT
2012
/ C
OM
MU
NIT
Y A
ND
GO
VER
NA
NCE
13
ACCESS TO INFORMATION AND PRIVACYVIA is committed to responding promptly to information requests under the Access to Information Act and the Privacy Act. During the third quarter of 2012 VIA received seven (7) such requests, which were in progress at the end of the quarter.
COMMUNITY INVOLVEMENTVIA works with a variety of local, regional and national charity groups and non-profit organizations to support community activities, fundraisers and initiatives across the country. Promotional travel credits are donated to qualifying organizations that have submitted requests through VIA’s website.
During the third quarter of 2012, VIA accepted 248 requests for support valued at $235,000.
TRAVEL, HOSPITALITY AND CONFERENCE EXPENSESThe following travel, hospitality and conference expenses were submitted during the third quarter of 2012:
Paul G. Smith, Chairman of the Board $3,226
Marc Laliberté, President and CEO $8,193
Executive management committee members $33,184
Board of Directors members $11,498
Travel expenses submitted by the Board of Directors reflect the diverse geographical locations of the members.
VIA
RA
IL C
AN
AD
A /
TH
IRD
QU
AR
TER
RE
PO
RT
2012
/ M
AN
AG
EMEN
T D
ISCU
SSIO
N A
ND
AN
ALY
SIS
14
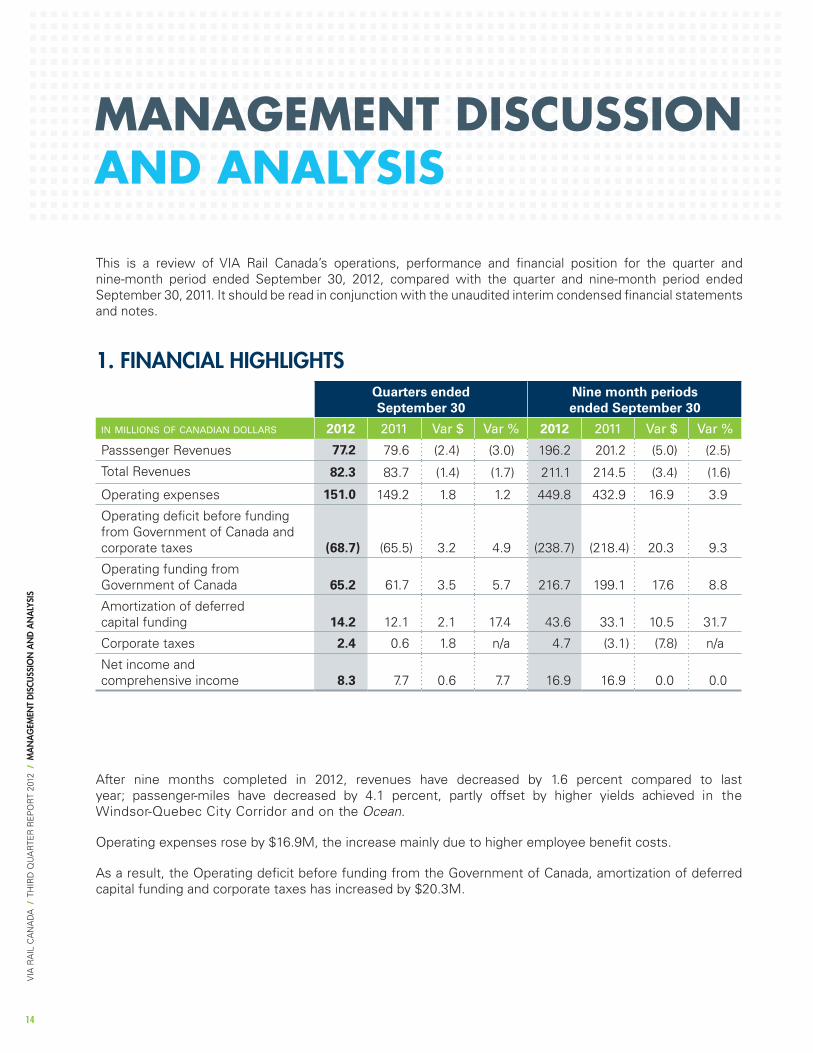
This is a review of VIA Rail Canada’s operations, performance and financial position for the quarter and nine-month period ended September 30, 2012, compared with the quarter and nine-month period ended September 30, 2011. It should be read in conjunction with the unaudited interim condensed financial statements and notes.
After nine months completed in 2012, revenues have decreased by 1.6 percent compared to last year; passenger-miles have decreased by 4.1 percent, partly offset by higher yields achieved in the Windsor-Quebec City Corridor and on the Ocean.
Operating expenses rose by $16.9M, the increase mainly due to higher employee benefit costs.
As a result, the Operating deficit before funding from the Government of Canada, amortization of deferred capital funding and corporate taxes has increased by $20.3M.
MANAGEMENT DISCUSSION AND ANALYSIS
1. FINANCIAL HIGHLIGHTS Quarters ended September 30
Nine month periods ended September 30
in millions of canadian dollars 2012 2011 Var $ Var % 2012 2011 Var $ Var %
Passsenger Revenues 77.2 79.6 (2.4) (3.0) 196.2 201.2 (5.0) (2.5)
Total Revenues 82.3 83.7 (1.4) (1.7) 211.1 214.5 (3.4) (1.6)
Operating expenses 151.0 149.2 1.8 1.2 449.8 432.9 16.9 3.9
Operating deficit before funding from Government of Canada and corporate taxes (68.7) (65.5) 3.2 4.9 (238.7) (218.4) 20.3 9.3
Operating funding from Government of Canada 65.2 61.7 3.5 5.7 216.7 199.1 17.6 8.8
Amortization of deferred capital funding 14.2 12.1 2.1 17.4 43.6 33.1 10.5 31.7
Corporate taxes 2.4 0.6 1.8 n/a 4.7 (3.1) (7.8) n/a
Net income and comprehensive income 8.3 7.7 0.6 7.7 16.9 16.9 0.0 0.0

15
HIGHLIGHTS OF THE QUARTER
Compared with the quarter ended September 30, 2011:
/ Revenues have decreased by 1.7 percent and total $82.3M for the quarter;
/ Operating expenses before corporate taxes and amortization of deferred capital funding have increased by 1.2 percent and amount to $151.0M for the quarter;
Highlights of the nine month period ended September 30, 2012
Compared with the corresponding period ended September 30, 2011:
/ Revenues have decreased by 1.6% and total $211.1M for the period;
/ Operating expenses before corporate taxes and amortization of deferred capital funding have increased by 3.9% and amount to $449.8M for the period;
VIA
RA
IL C
AN
AD
A /
TH
IRD
QU
AR
TER
RE
PO
RT
2012
/ M
AN
AG
EMEN
T D
ISCU
SSIO
N A
ND
AN
ALY
SIS
/ Funding from Government of Canada increased by $3.5M to $65.2M for the quarter;
/ There is a net profit of $8.3M for the quarter, compared to a profit of $7.7M for the same quarter of 2011.
/ Funding from Government of Canada increased by 8.8% to $216.7M for the period;
/ There is a net profit of $16.9M for the period, in line with the profit of $16.9M generated in the corresponding period in 2011.

16
Passenger revenues have decreased by 3.0 percent and total $77.2M for the quarter. On a cumulative basis, they have decreased by 2.5 percent and amount to $196.2M. The performance of the quarter results from the decrease in ridership (5.0 percent less passenger-miles), partly offset by higher yields (+2.1 percent).
The performance of the nine month period is also due to the decline in ridership (4.1 percent less passenger-mile), resulting from the combination of sustained uncertain economic conditions and increased competition from airline and bus companies in the Corridor (including the launch of new air services in Southwestern Ontario). The decrease in ridership was partly offset by higher yields (+1.7 percent).
REVENUES (IN ‘000 000$)
Quarters ended September 30
Nine month periods ended September 30
2012 2011 Var $ Var % 2012 2011 Var $ Var %
Corridor East 39.9 40.5 (0.6) (1.5) 112.7 115.4 (2.7) (2.3)
Southwestern Ontario (SWO) 10.3 10.9 (0.6) (5.5) 31.0 33.3 (2.3) (6.9)
Ocean 4.8 5.3 (0.5) (9.4) 11.0 10.8 0.2 1.9
Canadian 18.7 19.3 (0.6) (3.1) 34.4 34.5 (0.1) (0.3)
Mandatory Services 2.5 2.9 (0.4) (13.8) 4.4 5.7 (1.3) (22.8)
Other 1.0 0.7 0.3 42.9 2.7 1.5 1.2 80.0
TOTAL 77.2 79.6 (2.4) (3.0) 196.2 201.2 (5.0) (2.5)
PASSENGER MILES (IN ‘000 000)
Quarters ended September 30
Nine month periods ended September 30
2012 2011 Var $ Var % 2012 2011 Var $ Var %
Corridor East 129.9 137.6 (7.7) (5.6) 355.0 375.1 (20.1) (5.4)
Southwestern Ontario (SWO) 28.7 31.9 (3.2) (10.0) 85.8 94.5 (8.7) (9.2)
Ocean 21.0 23.6 (2.6) (11.0) 49.4 49.5 (0.1) (0.2)
Canadian 55.4 53.5 1.9 3.6 111.2 104.0 7.2 6.9
Mandatory Services 10.4 11.8 (1.4) (11.9) 19.8 24.5 (4.7) (19.2)
Other - - - - - - - -
TOTAL 245.4 258.4 (13.0) (5.0) 621.2 647.6 (26.4) (4.1)
2. HIGHLIGHTS OF OPERATING RESULTSa) Passenger Revenues
VIA
RA
IL C
AN
AD
A /
TH
IRD
QU
AR
TER
RE
PO
RT
2012
/ M
AN
AG
EMEN
T D
ISCU
SSIO
N A
ND
AN
ALY
SIS

VIA
RA
IL C
AN
AD
A /
TH
IRD
QU
AR
TER
RE
PO
RT
2012
/ M
AN
AG
EMEN
T D
ISCU
SSIO
N A
ND
AN
ALY
SIS
17
For the quarter:
/ Corridor East revenues are 1.5 percent below last year, and result mainly from lower ridership (5.6 percent less passenger miles), partly offset by higher yields (+4.4 percent);
/ Revenues in SWO have decreased by 5.5 percent also as a result of lower ridership (10.0 percent less passenger-miles), partly offset by higher yields (+5.0 percent);
/ Revenues on the Ocean have decreased by 9.4 percent, due to lower volume (-11.0 percent passenger-miles), partly offset by higher yields (+1.8 percent);
For the nine month period ended September 30:
/ Corridor East revenues are 2.3 percent below last year, and result mainly from lower ridership (5.4 percent less passenger miles), partly offset by higher yields (+3.2 percent). The decrease in passenger-miles during the period was more significant than the decrease of passengers, reflecting the fact that the erosion of ridership affected end to end markets;
/ Revenues in SWO have decreased by 6.9 percent also as a result of lower ridership (9.2 percent less passenger-miles), partly offset by higher yields (+2.5 percent);
/ Revenues on the Ocean have grown by 1.9 percent, due to higher yields (+2.1 percent), volume remained stable compared to the previous year (slight decrease of 0.2 percent in passenger-miles);
/ Revenues on the Canadian have decreased by 3.1 percent. Passenger volumes increased compared to last year (3.6 percent more passenger-miles), but yields decreased (-6.4 percent) due to the fact that ridership grew in Economy where average fares are lower compared to Sleeper class, and that average fares in both classes were below last year’s levels;
/ Mandatory services have generated lower revenues (-13.8 percent), the decrease mainly attributable to the situation affecting the Montreal-Gaspé service. The train service cannot be provided all the way to Gaspe because of poor track conditions, the train therefore stops at New Carlisle where passengers are transferred on a bus and taken to Gaspé. This situation has had a negative impact on ridership.
/ Revenues on the Canadian are comparable to last year (slight decrease of 0.3 percent in revenues). Although volume increased (+6.9 percent in passenger miles), yields decreased (-6.7 percent) due to the fact that ridership grew in Economy where average fares are lower compared to Sleeper class, and that average fares in both classes were below last year’s levels;
/ Mandatory services have generated lower revenues (-22.8 percent), the decrease directly attributable to the situation affecting the Montreal-Gaspé service. The train service cannot be provided all the way to Gaspe because of poor track conditions, the train therefore stops at New Carlisle where passengers are transferred on a bus and taken to Gaspé. This situation has had a negative impact on ridership.

VIA
RA
IL C
AN
AD
A /
TH
IRD
QU
AR
TER
RE
PO
RT
2012
/ M
AN
AG
EMEN
T D
ISCU
SSIO
N A
ND
AN
ALY
SIS
18
b) Operating Expenses
For the quarter: / Operating expenses before amortization of deferred capital funding & corporate tax expense increased by $1.8M and total $151.0M for the quarter, mainly due to higher compensation and benefit costs (due to higher employee benefit costs), partly offset by the gains (realized and unrealized) on derivative financial instruments.
For the nine month period ended September 30: / Operating expenses before amortization of deferred capital funding & corporate tax expense increased by $16.9M and total $449.8M for the period, mainly due to higher compensation and benefit costs (due to higher employee benefit costs).
Quarters ended September 30
Nine month periods ended September 30
in millions of canadian dollars 2012 2011 Var $ Var % 2012 2011 Var $ Var %
Compensation & Benefits 73.2 67.9 5.3 7.8 206.0 190.2 15.8 8.3
Train Operations & Fuel 31.7 32.4 (0.7) (2.2) 94.0 93.1 0.9 1.0
Other operating expenses 48.6 47.8 0.8 1.7 150.2 151.6 (1.4) (0.9)
Unrealized loss (gain) on derivative financial instruments (2.3) 2.7 (5.0) (185.2) 0.8 2.4 (1.6) (66.7)
Realized loss (gain) on derivative financial instruments (0.2) (1.6) 1.4 87.5 (1.2) (4.4) 3.2 72.7
Total Operating expenses before amortization of deferred capital funding & corporate tax expense 151.0 149.2 1.8 1.2 449.8 432.9 16.9 3.9
Corporate taxes 2.4 0.6 1.8 n/a 4.7 (3.1) 7.8 n/a
TOTAL OPERATING EXPENSES BEFORE AMORTIZATION OF DEFERRED CAPITAL FUNDING 153.4 149.8 3.6 2.4 454.5 429.8 24.7 5.7

VIA
RA
IL C
AN
AD
A /
TH
IRD
QU
AR
TER
RE
PO
RT
2012
/ M
AN
AG
EMEN
T D
ISCU
SSIO
N A
ND
AN
ALY
SIS
19
3. CAPITAL INVESTMENTSFixed assets (net of accumulated depreciation) amount to $1,222.9M, up $70.9M compared to the balance as at December 31, 2011. Capital investments for the quarter totaled $32.0M and $116.0M for the nine month period ended September 30. Year to date capital expenditures include:
/ Investments of $50.4M made in major infrastructure projects, mostly on the CN Kingston subdivision of the Montreal-Toronto line. Work is done to add sections of a third track to minimize congestion;
/ A total of $38.4M invested in major equipment projects, including $22.2M for the F40 locomotive fleet rebuild project, $5.9M for the HEP1 Modernization program and $4.8M for the Renaissance Accessibility project;
/ Investments of $12.1M made in Information Technology projects (including the Main frame migration, Revenue management and Automation of On Train and station service projects);
/ A total of $9.4M invested in other infrastructure projects;
The Corporation’s cash balance is $18.9M as at September 30, 2012, up $11.4M compared to the balance as at June 30, 2012 and up $5.7M compared to December 31, 2011.
The increase in cash position during the quarter and nine month period is due to higher capital funding from the government.
4. CASH FLOW AND FINANCIAL POSITION

20
5. RISK ANALYSIS
RISK TREND CURRENT SITUATION
CAPITAL INVESTMENT PROJECTS
Major delays in infrastructure or equipment projects, and/or an increase in project costs would adversely affect VIA’s financial performance.
Issues concerning the production timelines of specific equipment projects have materialized.
Since the beginning of the year, VIA terminated the remainder of the Renaissance and LRC contracts as a result of the supplier’s failure to meet the delivery schedule.
VIA has since developed a new schedule for the completion of the projects and some of the work has already started.
PASSENGER REVENUES
Passenger revenues and ridership have been declining since the fourth quarter of 2011.
VIA continues to implement initiatives to mitigate the impact of declining passenger revenues. These include optimizing train services between Montreal, Ottawa and Toronto in growing markets, the introduction of a new low fare product and through information technology improvements that support revenue generation initiatives.
OPERATING FUNDING
VIA continues to face operational funding challenges.
The Corporation is pursuing the development and the implementation of a range of initiatives to reduce its deficit by reducing costs and increasing revenues.
VIA has reduced, in the fall, service levels on the Ocean, the Canadian, and on certain trains in South Western Ontario to better align with demand and reduce its funding requirements.
Furthermore, VIA continues to work with Transport Canada to address the challenge of operating loss and develop sustainable funding solutions.
increasing stable decreasingVIA
RA
IL C
AN
AD
A /
TH
IRD
QU
AR
TER
RE
PO
RT
2012
/ M
AN
AG
EMEN
T D
ISCU
SSIO
N A
ND
AN
ALY
SIS

21
RISK TREND CURRENT SITUATION
CAPITAL FUNDING
VIA will need to continue investing in equipment, stations, maintenance systems, facilities and information technology after 2012, when the current investment program is completed.
The Corporation is working with Transport Canada to address ongoing capital funding requirements, and to ensure that VIA has the capital funding it requires to deliver on its mandate.
VIA received a $60M envelope for the 2012-2013 year but ongoing capital funding will still be required for future years.
PENSION COSTS
Pension costs could increase significantly given current and projected discount rates as well as demographics.
The situation has worsened due to declining interest rates.
Management has adopted changes to the Pension plan programs to minimize cost increases and ensure costs are contained as much as possible. Some of these changes are being implemented in 2012 and 2013.
FUEL COST FLUCTUATIONS
Fuel is a major cost for passenger rail operations, and fueI costs could vary significantly from VIA’s estimates due to the uncertainty and volatility of fuel prices.
VIA’s proven hedging strategy adds certainty to future fuel costs and can delay the impact of fuel price fluctuations. Given that contracts used to hedge fuel prices are denominated in U.S. dollars, VIA also hedges against foreign exchange risks.
Furthermore, fuel consumption has decreased compared to previous years as a result of the introduction of the refurbished locomotives as well as other initiatives to reduce fuel consumption.
increasing stable decreasing VIA
RA
IL C
AN
AD
A /
TH
IRD
QU
AR
TER
RE
PO
RT
2012
/ M
AN
AG
EMEN
T D
ISCU
SSIO
N A
ND
AN
ALY
SIS

VIA
RA
IL C
AN
AD
A /
TH
IRD
QU
AR
TER
RE
PO
RT
2012
/ M
AN
AG
EMEN
T D
ISCU
SSIO
N A
ND
AN
ALY
SIS
22
RISK TREND CURRENT SITUATION
CROSSING INCIDENTS
VIA’s train operate through many protected and unprotected level road crossings where vehicles can cross and where incidents/accidents could occur.
VIA has developed a crossing improvement (protection, fences) and closure program. They work actively with communities and owners of the land where there are crossings. The objectives of the program are to close crossings where possible and to increase public awareness about the potential dangers they represent.
increasing stable decreasing
VIA
RA
IL C
AN
AD
A /
TH
IRD
QU
AR
TER
RE
PO
RT
2012
/ M
AN
AG
EMEN
T D
ISCU
SSIO
N A
ND
AN
ALY
SIS
23
6. OUTLOOKThe performance of revenues has continued to be below expectations during the third quarter, as total ridership continued to decline for a fourth consecutive quarter.
VIA has put in place measures to minimize the adverse impact of the uncertain economic conditions and sustained competition from airlines and bus companies have had on revenues since the beginning of the year. This plan includes initiatives to stimulate revenues and measures to ensure that expenses are kept at the minimal level.
VIA has also reduced, in the fall, service levels on the Ocean, the Canadian, and on certain trains in South Western Ontario to better align with demand and reduce its funding requirements.
While the third quarter was another challenging quarter, the Corporation remains confident that growth in ridership will materialize during the fourth quarter in services not affected by reductions in frequency, and that it will meet its financial objectives for 2012 with the exclusion of the recent pension cost increases.
At the same time, VIA is focusing on completing its capital investments projects and will ensure that passenger rail delivers better value to more Canadian travelers, while maintaining rigorous control over operating costs.

INTERIM CONDENSED
FINANCIAL STATEMENTS

25
VIA
RA
IL C
AN
AD
A /
TH
IRD
QU
AR
TER
RE
PO
RT
2012
/ M
AN
AG
EMEN
T’S
RESP
ON
SIBI
LITY
STA
TEM
ENT
25
Management is responsible for the preparation and fair presentation of these quarterly financial statements in accordance with the Treasury Board of Canada Standard on Quarterly Financial Reports for Crown Corporations, and for such internal controls as management determines is necessary to enable the preparation of quarterly financial statements that are free from material misstatement.
Management is also responsible for ensuring all other information in this quarterly financial report is consistent, where appropriate, with the quarterly financial statements.
Based on our knowledge, these unaudited quarterly financial statements present fairly, in all material respects, the financial position, results of operations and cash flows of the corporation, as at the date of and for the periods presented in the quarterly financial statements.
Marc LalibertéPresident and Chief Executive Officer
Robert St-Jean, CAChief Financial and Administration Officer
MANAGEMENT’S RESPONSIBILITY STATEMENTQUARTER ENDED SEPTEMBER 30, 2012
Montréal, Canada November 19, 2012

26
VIA
RA
IL C
AN
AD
A /
TH
IRD
QU
AR
TER
RE
PO
RT
2012
/ I
NTE
RIM
CO
ND
ENSE
D F
INA
NCI
AL
STAT
EMEN
TS
26
INTERIM CONDENSED FINANCIAL STATEMENTSStatement of Financial PositionAs at (in thousands of canadian dollars)
September 30, 2012 (unaudited)
December 31, 2011 (audited)
CURRENT ASSETSCash and cash equivalents $ 18,913 $ 13,253 Accounts receivable, trade 7,661 10,707 Prepaids, advances on contracts and other receivables 8,954 11,147 Derivative financial instruments (NOTE 16) 1,949 2,225 Materials 22,648 21,287 Asset Renewal Fund (NOTE 8) 10,505 24,022
70,630 82,641NON-CURRENT ASSETS Property, plant and equipment (NOTE 6) 845,566 814,876 Intangible assets (NOTE 7) 377,376 337,182 Asset Renewal Fund (NOTE 8) 12,078 9,881 Accrued benefit asset (NOTE 11) 206,085 186,937
1,441,105 1,348,876 Total assets $ 1,511,735 $ 1,431,517CURRENT LIABILITIES Accounts payable and accrued liabilities (NOTE 9) $ 82,884 $ 103,841 Provisions (NOTE 10) 15,165 18,050 Deferred government funding 10,730 6,148 Derivative financial instruments (NOTE 16) 1,683 1,173 Deferred revenues 32,729 26,734
143,191 155,946NON-CURRENT LIABILITIES Accrued benefit liability (NOTE 11) 36,033 35,425 Deferred corporate tax liabilities (NOTE 12) 4,776 - Deferred investment tax credits 352 566
41,161 35,991 DEFERRED CAPITAL FUNDING (NOTE 13) 1,214,673 1,143,800SHAREHOLDER’S EQUITY Share capital 9,300 9,300 Retained earnings 103,410 86,480
112,710 95,780 Total liabilities and shareholder’s equity $ 1,511,735 $ 1,431,517
Commitments (Notes 14) The notes are an integral part of the interim condensed financial statements.
Eric L. Stefanson. FCA Director and Chairman of the Audit. Risk and Finance Committee
Paul G. SmithDirector and Chairman of the Board
Approved on behalf of the Board.

27
VIA
RA
IL C
AN
AD
A /
TH
IRD
QU
AR
TER
RE
PO
RT
2012
/ I
NTE
RIM
CO
ND
ENSE
D F
INA
NCI
AL
STAT
EMEN
TS
27
INTERIM CONDENSED FINANCIAL STATEMENTSStatement of Operations and Comprehensive Income
Statement of changes in Shareholder’s Equity
Period ended September 30 (in thousands of canadian dollars) (unaudited)
Quarters ended Nine-month periods ended2012 2011 2012 2011
REVENUESPassenger $ 77,228 $ 79,571 $ 196,205 $ 201,185 Other 5,032 4,162 14,855 13,338
82,260 83,733 211,060 214,523 EXPENSES
Compensation and employee benefits 73,233 67,809 206,013 190,155 Train operations and fuel 31,654 32,474 94,000 93,136 Stations and property 7,706 8,073 24,657 25,773 Marketing and sales 7,285 6,608 22,668 21,748 Maintenance material 6,341 7,278 20,997 25,792 On-train product costs 4,604 4,493 11,540 11,316 Operating taxes 2,439 1,364 7,870 7,716 Professional services 2,506 1,551 6,890 5,012 Amortization and losses on write-down and disposal of property, plant and equipment and intangible assets (NOTES 6 AND 7)
14,527 12,310 43,901 36,145
Unrealized net (gains) losses on derivative financial instruments (2,305) 2,668 786 2,382 Realized gain on derivative financial instruments (288) (1,545) (1,244) (4,382)Other 3,308 6,069 11,688 18,090
151,010 149,152 449,766 432,883 OPERATING LOSS BEFORE FUNDING FROM THE GOVERNMENT OF CANADA AND CORPORATE TAXES
68,750 65,419 238,706 218,360
Operating funding from the Government of Canada 65,186 61,662 216,675 199,119 Amortization of deferred capital funding (NOTE 13) 14,275 12,055 43,665 33,052 Income before corporate taxes 10,711 8,298 21,634 13,811 Corporate tax expense (recovery) (NOTE 12) 2,405 649 4,704 (3,085)NET INCOME AND COMPREHENSIVE INCOME FOR THE PERIOD $ 8,306 $ 7,649 $ 16,930 $ 16,896
The notes are an integral part of the interim condensed financial statements.
Period ended September 30 (in thousands of canadian dollars) (unaudited)
Quarters ended Nine-month periods ended2012 2011 2012 2011
BALANCE, BEGINNING OF PERIOD $ 104,404 $ 84,877 $ 95,780 $ 75,630 Net income and comprehensive income for the period 8,306 7,649 16,930 16,896 BALANCE, END OF PERIOD $ 112,710 $ 92,526 $ 112,710 $ 92,526
The notes are an integral part of the interim condensed financial statements.

28
VIA
RA
IL C
AN
AD
A /
TH
IRD
QU
AR
TER
RE
PO
RT
2012
/ I
NTE
RIM
CO
ND
ENSE
D F
INA
NCI
AL
STAT
EMEN
TS
28
INTERIM CONDENSED FINANCIAL STATEMENTSStatement of Cash FlowsPeriod ended September 30(in thousands of canadian dollars) (unaudited)
Quarters ended Nine-month periods ended2012 2011 2012 2011
OPERATING ACTIVITIES
Net income and comprehensive income for the period $ 8,306 $ 7,649 $ 16,930 $ 16,896
Adjustments to determine net cash (used in) from operating activities:
Amortization of property, plant and equipment and intangible assets 14,605 12,403 42,144 35,596
Losses on write-down and disposal of property, plant and equipment and intangible assets (6) 6 1,971 846
Amortization of deferred investment tax credits (72) (99) (214) (297)
Amortization of deferred capital funding (14,275) (12,055) (43,665) (33,052)
Interest income (164) (209) (576) (683)
Deferred corporate taxes 2,477 574 4,776 822
Change in fair value of financial instruments (Asset Renewal Fund) (346) 537 (747) (106)
Unrealized (net gain) net loss on derivative financial instruments (2,305) 2,668 786 2,382
Net change in non-cash working capital items (10,405) 35,923 (14,171) (11,192)
Change in accrued benefit asset (5,328) (7,578) (19,148) (21,059)
Change in accrued benefit liability 256 318 608 918
Change in other non-current liabilities - - - (66)
Net cash used in operating activities (7,257) 40,137 (11,306) (8,995)FINANCING ACTIVITIES
Capital funding 31,989 58,713 114,538 169,006
Change in capital funding receivable from the Government of Canada 17,011 (8,713) 16,447 7,494 Net cash provided by financing activities 49,000 50,000 130,985 176,500
INVESTING ACTIVITIES
Acquisition of investments in the Asset Renewal Fund (14,495) (186,232) (61,166) (249,656)
Proceeds from sale and maturity of investments in the Asset Renewal Fund 19,109 190,063 73,233 257,270
Change in Capital accounts payable and accrued liabilities (3,151) (3,481) (11,663) (34,074)
Acquisition of property, plant and equipment and intangible assets (31,989) (61,560) (116,033) (171,853)
Interest received 164 209 576 683
Proceeds from disposal of property, plant and equipment and intangible assets 5 127 1,034 193 Net cash used in investing activities (30,357) (60,874) (114,019) (197,437)
CASH AND CASH EQUIVALENTS
Increase (decrease) during the period 11,386 29,263 5,660 (29,932)
Balance, beginning of period 7,527 17,634 13,253 76,829
BALANCE, END OF PERIOD $ 18,913 $ 46,897 $ 18,913 $ 46,897
REPRESENTED BY:
Cash $ (1,205) $ 4,427 $ (1,205) $ 4,427
Short-term investments 20,118 42,470 20,118 42,470
$ 18,913 $ 46,897 $ 18,913 $ 46,897
The notes are an integral part of the interim condensed financial statements.

29
VIA
RA
IL C
AN
AD
A /
TH
IRD
QU
AR
TER
RE
PO
RT
2012
/ N
OTE
S TO
TH
E IN
TERI
M C
ON
DEN
SED
FIN
AN
CIA
L ST
ATEM
ENTS
29
1. AUTHORITY AND OBJECTIVESVIA Rail Canada Inc. is a Crown corporation named in Part I of Schedule III to the Financial Administration Act. The corporation was incorporated in 1977 in Canada, under the Canada Business Corporations Act. The corporate headquarters is located at 3 Place Ville-Marie, Montreal (Quebec). The Corporation’s vision is to offer the best travel experience in Canada with a mission to work together to exceed customer expectations every time. The Corporation uses the roadway infrastructure of other railway companies and relies on them to control train operations.
The Corporation is not an agent of Her Majesty and is subject to income taxes.
The Corporation has one operating segment, passenger transportation and related services in Canada. The corporation’s activities are considered seasonal since passenger traffic increases significantly during the summer and holiday periods resulting in an increase in revenue for these same periods.
These interim condensed financial statements were approved and authorized for issue by the Board of Directors on November 19, 2012.
2. BASIS OF PREPARATION A) STATEMENT OF COMPLIANCESection 83 of the Financial Administration Act requires that most parent Crown Corporations prepare and make public quarterly financial reports for periods beginning on or after April 1, 2011 compliant with the Standard on Quarterly Financial Reports for Crown Corporations.
These unaudited interim condensed financial statements have been prepared in accordance with IAS 34 “Interim financial reporting”. The interim condensed financial statements should be read in conjunction with the annual financial statements for the year ended December 31, 2011, which have been prepared in accordance with the IFRS.
B) FUNCTIONAL AND PRESENTATION CURRENCYThese interim condensed financial statements are presented in Canadian dollars, which is the Corporation’s functional currency. All financial information presented in Canadian dollars has been rounded to the nearest thousand in the interim condensed financial statements and rounded to the nearest million in the Notes to the interim condensed financial statements.
3. SUMMARY OF SIGNIFICANT ACCOUNTING POLICIESThe significant accounting policies applied in these unaudited interim condensed financial statements are disclosed in note 4 of the Corporation’s annual financial statement for the year ended December 31, 2011. The accounting policies have been applied consistently to all periods presented.
NOTES TO THE INTERIM CONDENSED FINANCIAL STATEMENTSAS AT SEPTEMBER 30, 2012 (UNAUDITED)

30
VIA
RA
IL C
AN
AD
A /
TH
IRD
QU
AR
TER
RE
PO
RT
2012
/ N
OTE
S TO
TH
E IN
TERI
M C
ON
DEN
SED
FIN
AN
CIA
L ST
ATEM
ENTS
30
4. SIGNIFICANT ACCOUNTING ESTIMATES AND ASSUMPTIONSThe preparation of the interim condensed financial statements requires management to make estimates and assumptions that affect the reported amounts of revenues, expenses, assets and liabilities, and the disclosure of contingent liabilities, at the reporting date. However, uncertainty about these assumptions and estimates could result in outcomes that require a material adjustment to the carrying amount of the asset or liability affected in future years.
Estimates and underlying assumptions are reviewed on an ongoing basis. Changes to accounting estimates are recognized in the period in which the estimate is revised. Key sources of estimation uncertainty and assumptions are disclosed in note 5 of the Corporation’s annual financial statements for the year ended December 31, 2011.
5. RECONCILIATION OF NET INCOME AND COMPREHENSIVE INCOME TO GOVERNMENT FUNDING BASIS
The Corporation receives its funding from the Government of Canada based primarily on cash flow requirements. Items recognized in the Statement of Operations and Comprehensive Income in one period may be funded by the Government of Canada in different periods. Accordingly, the Corporation has different net results of operations for the period on a government funding basis than on a IFRS basis. These differences are outlined below:
Quarters ended September 30
Nine month periods ended September 30
(in millions of dollars) 2012 2011 2012 2011
Net income and comprehensive income for the period 8.3 7.6 16.9 16.9
Items not requiring (not providing) operating funds:
Amortization of property, plant and equipment and intangible assets 14.6 12.4 42.1 35.6
Losses on write-down and disposal of property, plant and equipment and intangible assets - - 2.0 0.8
Amortization of deferred capital funding (14.3) (12.1) (43.7) (33.1)
Employee benefits to be funded in subsequent years (5.1) (7.2) (18.5) (20.0)
Deferred corporate taxes expense 2.5 0.6 4.8 0.8
Unrealized (net gain) net loss on derivative financial instruments (2.3) 2.7 0.8 2.4
Adjustment for accrued compensation (3.6) (4.7) (3.8) (3.8)
(Increase) decrease in investment’s fair value (0.3) 0.5 (0.7) (0.2)
Other 0.2 0.2 0.1 0.6
Operating funding deficit for the period - - - -
31
VIA
RA
IL C
AN
AD
A /
TH
IRD
QU
AR
TER
RE
PO
RT
2012
/ N
OTE
S TO
TH
E IN
TERI
M C
ON
DEN
SED
FIN
AN
CIA
L ST
ATEM
ENTS
31
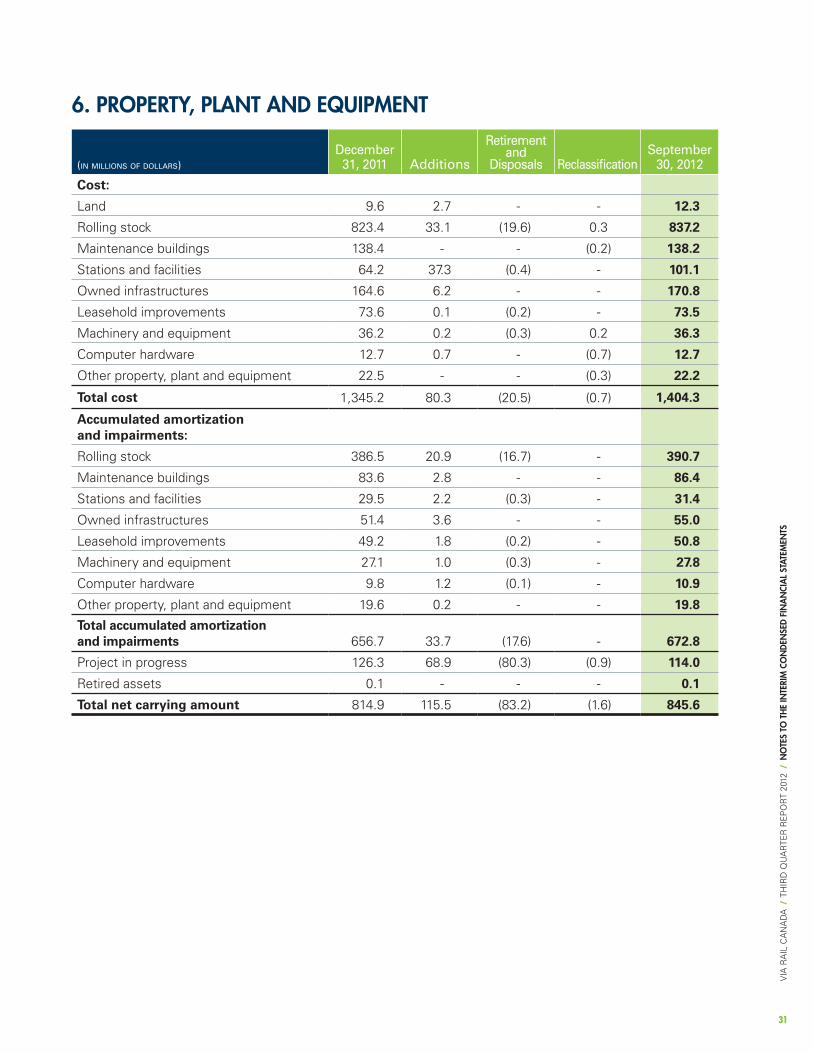
6. PROPERTY, PLANT AND EQUIPMENT
(in millions of dollars)December
31, 2011 Additions
Retirement and
Disposals ReclassificationSeptember
30, 2012
Cost:
Land 9.6 2.7 - - 12.3
Rolling stock 823.4 33.1 (19.6) 0.3 837.2
Maintenance buildings 138.4 - - (0.2) 138.2
Stations and facilities 64.2 37.3 (0.4) - 101.1
Owned infrastructures 164.6 6.2 - - 170.8
Leasehold improvements 73.6 0.1 (0.2) - 73.5
Machinery and equipment 36.2 0.2 (0.3) 0.2 36.3
Computer hardware 12.7 0.7 - (0.7) 12.7
Other property, plant and equipment 22.5 - - (0.3) 22.2
Total cost 1,345.2 80.3 (20.5) (0.7) 1,404.3
Accumulated amortization and impairments:
Rolling stock 386.5 20.9 (16.7) - 390.7
Maintenance buildings 83.6 2.8 - - 86.4
Stations and facilities 29.5 2.2 (0.3) - 31.4
Owned infrastructures 51.4 3.6 - - 55.0
Leasehold improvements 49.2 1.8 (0.2) - 50.8
Machinery and equipment 27.1 1.0 (0.3) - 27.8
Computer hardware 9.8 1.2 (0.1) - 10.9
Other property, plant and equipment 19.6 0.2 - - 19.8
Total accumulated amortization and impairments 656.7 33.7 (17.6) - 672.8
Project in progress 126.3 68.9 (80.3) (0.9) 114.0
Retired assets 0.1 - - - 0.1
Total net carrying amount 814.9 115.5 (83.2) (1.6) 845.6
32
VIA
RA
IL C
AN
AD
A /
TH
IRD
QU
AR
TER
RE
PO
RT
2012
/ N
OTE
S TO
TH
E IN
TERI
M C
ON
DEN
SED
FIN
AN
CIA
L ST
ATEM
ENTS
32
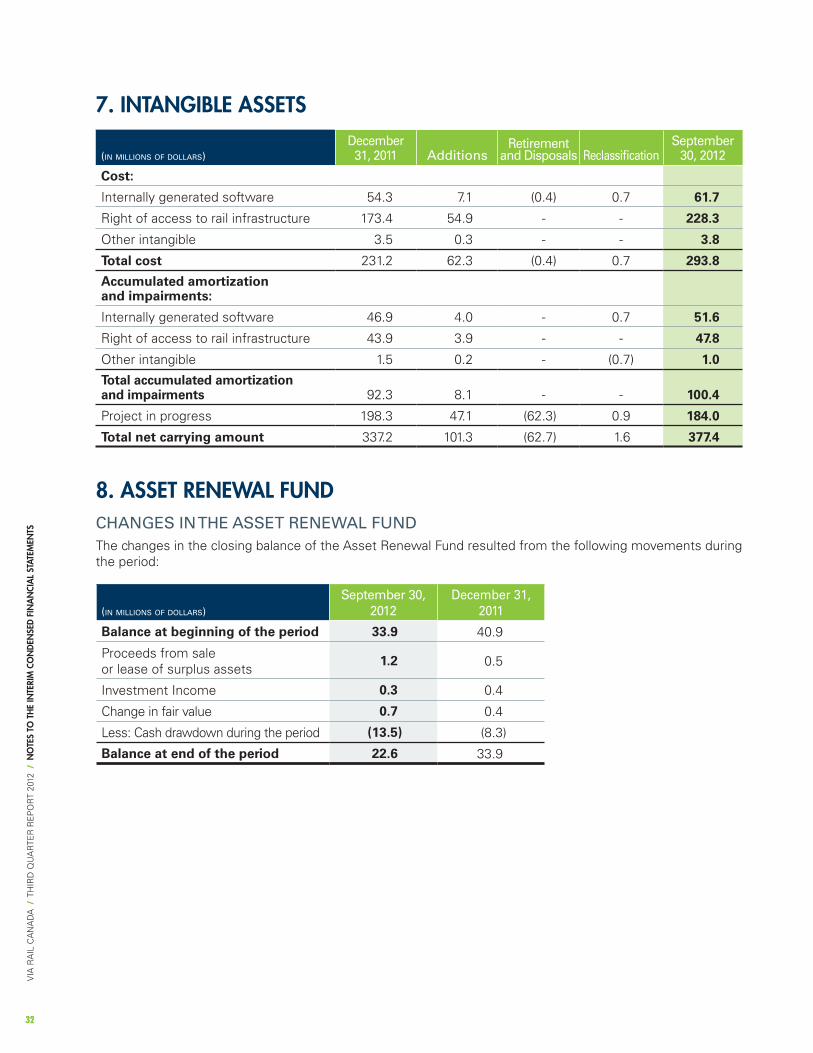
7. INTANGIBLE ASSETS
(in millions of dollars)December
31, 2011 AdditionsRetirement
and Disposals ReclassificationSeptember
30, 2012
Cost:
Internally generated software 54.3 7.1 (0.4) 0.7 61.7
Right of access to rail infrastructure 173.4 54.9 - - 228.3
Other intangible 3.5 0.3 - - 3.8
Total cost 231.2 62.3 (0.4) 0.7 293.8
Accumulated amortization and impairments:
Internally generated software 46.9 4.0 - 0.7 51.6
Right of access to rail infrastructure 43.9 3.9 - - 47.8
Other intangible 1.5 0.2 - (0.7) 1.0
Total accumulated amortization and impairments 92.3 8.1 - - 100.4
Project in progress 198.3 47.1 (62.3) 0.9 184.0
Total net carrying amount 337.2 101.3 (62.7) 1.6 377.4
8. ASSET RENEWAL FUNDCHANGES IN THE ASSET RENEWAL FUNDThe changes in the closing balance of the Asset Renewal Fund resulted from the following movements during the period:
(in millions of dollars)
September 30, 2012
December 31, 2011
Balance at beginning of the period 33.9 40.9
Proceeds from sale or lease of surplus assets
1.2 0.5
Investment Income 0.3 0.4
Change in fair value 0.7 0.4
Less: Cash drawdown during the period (13.5) (8.3)
Balance at end of the period 22.6 33.9

33
VIA
RA
IL C
AN
AD
A /
TH
IRD
QU
AR
TER
RE
PO
RT
2012
/ N
OTE
S TO
TH
E IN
TERI
M C
ON
DEN
SED
FIN
AN
CIA
L ST
ATEM
ENTS
33
9. ACCOUNTS PAYABLE AND ACCRUED LIABILITIESThe Accounts payable and accrued liabilities balance includes the following:
(in millions of dollars)
September 30, 2012
December 31, 2011
Wages payable and accrued 31.1 39.6
Capital Payables 14.9 26.6
Trade payables 29.0 29.5
Capital tax, income tax and other taxes payable 7.3 7.0
Other 0.6 1.1
82.9 103.8
10. PROVISIONSThe provision balance includes:
(in millions of dollars)
December 31, 2011
Charge (used)
Reversal (used)
Reversal (not used)
September 30, 2012
Environmental costs 0.2 - - - 0.2
Litigation and contractual disputes 14.5 9.8 (7.8) (4.5) 12.0
Restructuring costs 3.0 - (0.8) - 2.2
Other 0.4 0.4 - - 0.8
Total provisions 18.1 10.2 (8.6) (4.5) 15.2
LITIGATION AND CONTRACTUAL DISPUTESThe Corporation is subject to claims and legal proceedings brought against it in the normal course of business. Such matters are subject to many uncertainties. Management believes that adequate provisions have been made in the accounts where required and the ultimate resolution of such contingencies is not expected to have a material adverse effect on the financial position of the Corporation.
On February 26, 2012, a train derailment with fatalities occurred. A class action suite was filed in the court of Ontario. The Corporation has recorded a provision for this accident.
In March of 2012, the corporation settled an outstanding matter before the Canadian Industrial Relations Board (CIRB) involving a restructuring of its labour force in 1997. The Corporation is no longer providing for this arbitration matter.
34
VIA
RA
IL C
AN
AD
A /
TH
IRD
QU
AR
TER
RE
PO
RT
2012
/ N
OTE
S TO
TH
E IN
TERI
M C
ON
DEN
SED
FIN
AN
CIA
L ST
ATEM
ENTS
34
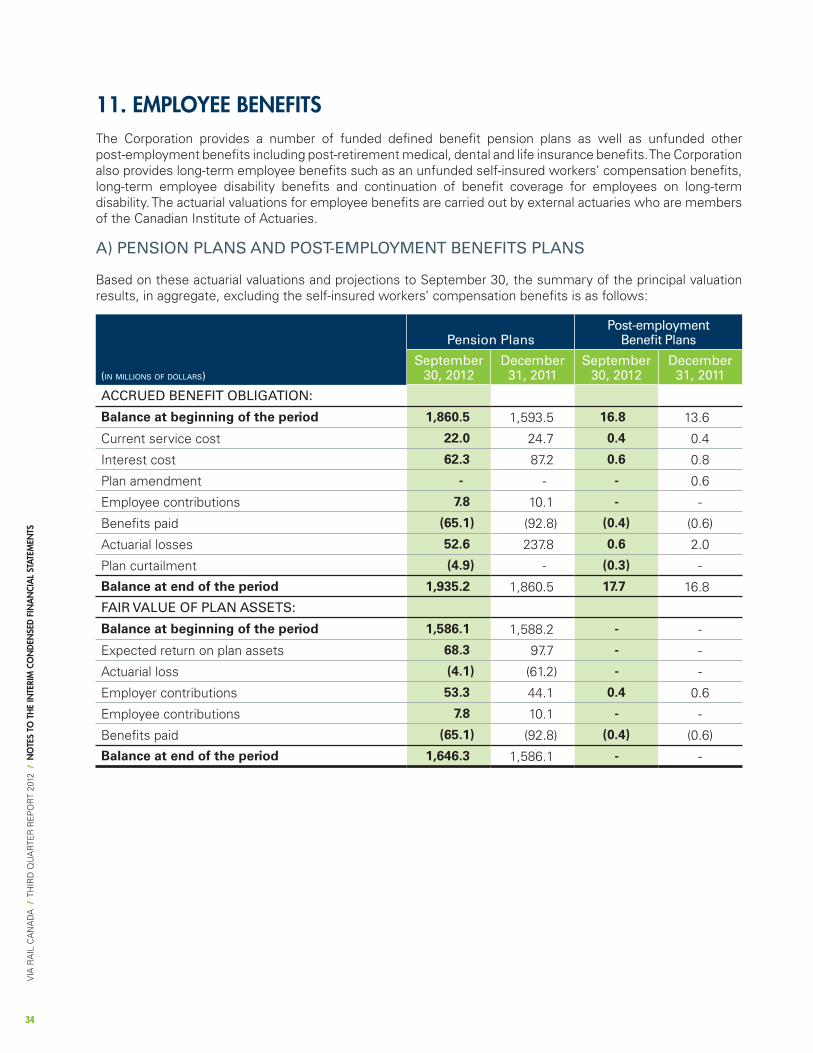
11. EMPLOYEE BENEFITS The Corporation provides a number of funded defined benefit pension plans as well as unfunded other post-employment benefits including post-retirement medical, dental and life insurance benefits. The Corporation also provides long-term employee benefits such as an unfunded self-insured workers’ compensation benefits, long-term employee disability benefits and continuation of benefit coverage for employees on long-term disability. The actuarial valuations for employee benefits are carried out by external actuaries who are members of the Canadian Institute of Actuaries.
A) PENSION PLANS AND POST-EMPLOYMENT BENEFITS PLANS
Based on these actuarial valuations and projections to September 30, the summary of the principal valuation results, in aggregate, excluding the self-insured workers’ compensation benefits is as follows:
(in millions of dollars)
Pension PlansPost-employment
Benefit Plans
September 30, 2012
December 31, 2011
September 30, 2012
December 31, 2011
ACCRUED BENEFIT OBLIGATION:
Balance at beginning of the period 1,860.5 1,593.5 16.8 13.6
Current service cost 22.0 24.7 0.4 0.4
Interest cost 62.3 87.2 0.6 0.8
Plan amendment - - - 0.6
Employee contributions 7.8 10.1 - -
Benefits paid (65.1) (92.8) (0.4) (0.6)
Actuarial losses 52.6 237.8 0.6 2.0
Plan curtailment (4.9) - (0.3) -
Balance at end of the period 1,935.2 1,860.5 17.7 16.8
FAIR VALUE OF PLAN ASSETS:
Balance at beginning of the period 1,586.1 1,588.2 - -
Expected return on plan assets 68.3 97.7 - -
Actuarial loss (4.1) (61.2) - -
Employer contributions 53.3 44.1 0.4 0.6
Employee contributions 7.8 10.1 - -
Benefits paid (65.1) (92.8) (0.4) (0.6)
Balance at end of the period 1,646.3 1,586.1 - -

35
VIA
RA
IL C
AN
AD
A /
TH
IRD
QU
AR
TER
RE
PO
RT
2012
/ N
OTE
S TO
TH
E IN
TERI
M C
ON
DEN
SED
FIN
AN
CIA
L ST
ATEM
ENTS
35
Quarters endedSeptember 30
Nine month periods ended September 30
(in millions of dollars) 2012 2011 2012 2011
Components of Pension cost:
Current service cost 7.6 6.4 22.0 19.2
Interest cost 20.6 21.6 62.3 64.9
Expected return on plan assets (23.0) (24.2) (68.3) (72.6)
Actuarial loss recognized in the period 7.9 0.3 21.6 0.9
Plan curtailment - - (3.5) -
Total pension cost 13.1 4.1 34.1 12.4
Components of Post-employment benefit cost:
Current service cost 0.1 0.1 0.4 0.4
Interest cost 0.2 0.2 0.6 0.6
Actuarial losses - - 0.1 -
Vested Past service cost 0.1 0.1 0.2 0.3
Plan curtailment - - (0.2) -
Total post-employment benefit costs 0.4 0.4 1.1 1.3
Amounts Recognized in the Statement of financial position:
(in millions of dollars)
Pension PlansPost-employment
Benefit Plans
September 30, 2012
December 31, 2011
September 30, 2012
December 31, 2011
Benefit obligation (1,935.2) (1,860.5) (17.7) (16.8)
Fair value of plan assets 1,646.3 1,586.1 - -
Deficit (288.9) (274.4) (17.7) (16.8)
Unamortized past service costs - - 0.4 0.7
Unamortized net actuarial loss 495.0 461.3 4.1 3.6
Net asset (liability) 206.1 186.9 (13.2) (12.5)

36
VIA
RA
IL C
AN
AD
A /
TH
IRD
QU
AR
TER
RE
PO
RT
2012
/ N
OTE
S TO
TH
E IN
TERI
M C
ON
DEN
SED
FIN
AN
CIA
L ST
ATEM
ENTS
36
11. EMPLOYEE BENEFITS (CONT’D) B) LONG-TERM EMPLOYEE BENEFIT PLANS
Based on these actuarial valuations and projections to September 30, the summary of the principal valuation results for the self-insured workers’ compensation benefits and other long-term employee benefits is as follows:
(in millions of dollars)September 30,
2012December 31,
2011
ACCRUED BENEFIT OBLIGATION:
Balance at beginning of the period 22.2 20.9
Current service cost 3.9 5.0
Interest cost 0.6 1.0
Benefits paid (4.5) (6.6)
Actuarial losses - 1.9
Balance at end of the period 22.2 22.2
FAIR VALUE OF PLAN ASSETS:
Balance at beginning of the period - -
Employer contributions 4.5 6.6
Benefits paid (4.5) (6.6)
Balance at end of the period - -
Components of cost:
Quarters endedSeptember 30
Nine month periods endedSeptember 30
(in millions of dollars) 2012 2011 2012 2011
Current service cost 1.3 1.3 3.9 3.9
Interest cost 0.2 0.2 0.6 0.7
Total cost 1.5 1.5 4.5 4.6
Amounts Recognized in the Statement of financial position:
(in millions of dollars)September 30,
2012December 31,
2011
Benefit obligation (22.2) (22.2)
Fair value of plan assets - -
Net liability (22.2) (22.2)

37
VIA
RA
IL C
AN
AD
A /
TH
IRD
QU
AR
TER
RE
PO
RT
2012
/ N
OTE
S TO
TH
E IN
TERI
M C
ON
DEN
SED
FIN
AN
CIA
L ST
ATEM
ENTS
37
C) SUMMARY OF PENSIONS PLANS, POST-EMPLOYMENT BENEFIT PLANS AND LONG-TERM EMPLOYEE BENEFIT PLANS RECOGNIZED IN THE FINANCIAL STATEMENTS
Total amounts recognized in the Statement of financial position:
(in millions of dollars)September 30,
2012December 31,
2011
Assets:
Pension Plans 206.1 186.9
Liabilities:
Post-employment benefit plans (13.2) (12.5)
Long-term employee benefit plans (22.2) (22.2)
Network Restructuring obligation (0.6) (0.7)
Total (36.0) (35.4)
Total amounts recognized in the Statement of Operations and Comprehensive Income:
Quarters endedSeptember 30
Nine month periods ended September 30
(in millions of dollars) 2012 2011 2012 2011
Pension Plans 13.1 4.1 34.1 12.4
Post employment Benefit Plans 0.4 0.4 1.1 1.3
Long-term employee benefit plans 1.5 1.5 4.5 4.6
Network Restructuring obligation (0.1) - (0.1) -
Total 14.9 6.0 39.6 18.3
The total component of costs is presented in the Compensation and employee benefits line in the Statement of operation and Comprehensive income. The cost for the network restructuring obligation is presented in the “Other” expense line in the Statement of operation and Comprehensive income.

38
VIA
RA
IL C
AN
AD
A /
TH
IRD
QU
AR
TER
RE
PO
RT
2012
/ N
OTE
S TO
TH
E IN
TERI
M C
ON
DEN
SED
FIN
AN
CIA
L ST
ATEM
ENTS
38
12. CORPORATE TAXESThe corporate tax (recovery) expense of the Corporation consists of the following:
Quarters ended September 30
Nine month periods ended September 30
(in millions of dollars) 2012 2011 2012 2011
Current corporate tax (recovery) expense (0.1) 0.1 (0.1) (3.9)
Deferred corporate tax expense 2.5 0.6 4.8 0.9
Corporate tax expense (recovery) 2.4 0.7 4.7 (3.0)
Corporate tax expense (recovery) is comprised of:
Deferred tax expense related to the original and reversal of temporary differences 2.7 2.1 5.4 3.6
Effect of reversal of previous write-downs of deferred tax assets (0.3) (3.2) (0.7) (3.3)
Other - 1.8 - (3.3)
Corporate tax expense (recovery) 2.4 0.7 4.7 (3.0)
The overall corporate tax expense (recovery) for the year differs from the amount that would be computed by applying the combined Federal and provincial statutory income tax rates of 24.37% (September 2011: 26.12%) to income before corporate taxes. The reasons for the differences are as follows;
(in millions of dollars) September 30, 2012 September 30, 2011
Income before corporate taxes 21.6 13.8
Computed corporate tax recovery - statutory rates 5.3 3.6
Non-taxable portion of capital and accounting gains and other (0.1) 0.7
Effect of reversal of previous write-downs of deferred tax assets (0.7) (3.3)
Effect of tax rate changes on deferred corporate taxes 0.1 -
Adjustment recognized in the current year in relation to the deferred tax of prior years. 0.1 (4.0)
Corporate tax expense (recovery) 4.7 (3.0)
39
VIA
RA
IL C
AN
AD
A /
TH
IRD
QU
AR
TER
RE
PO
RT
2012
/ N
OTE
S TO
TH
E IN
TERI
M C
ON
DEN
SED
FIN
AN
CIA
L ST
ATEM
ENTS
39
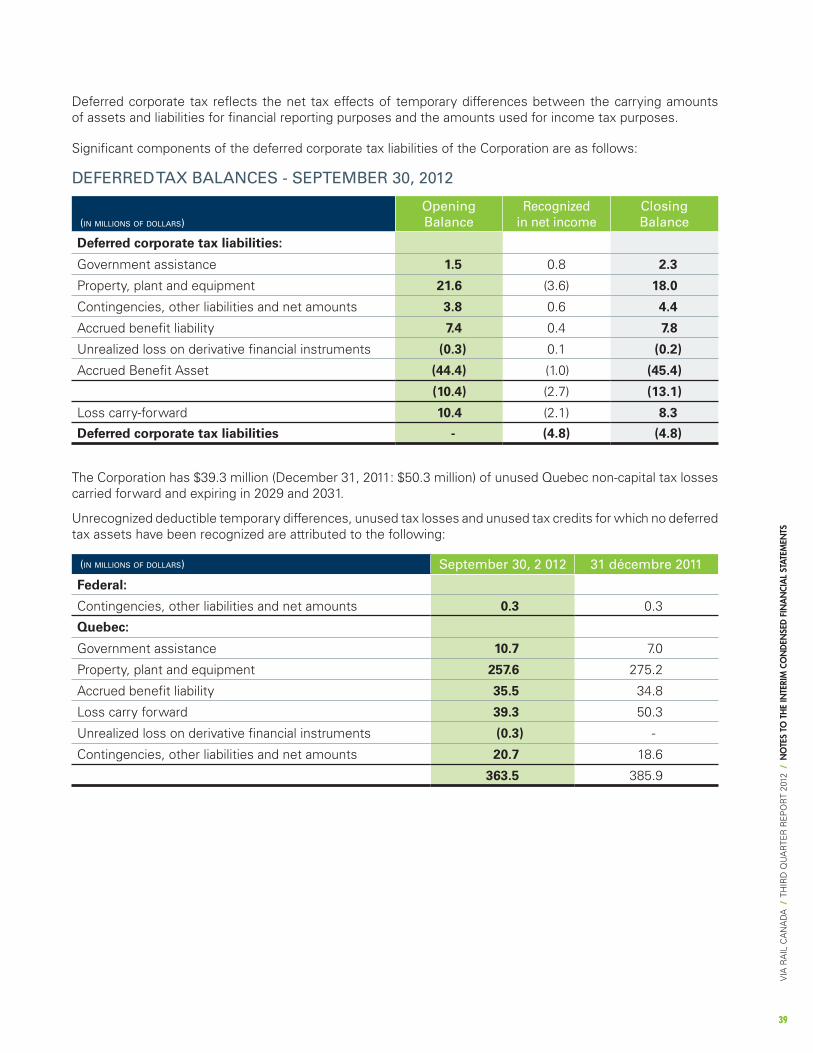
Deferred corporate tax reflects the net tax effects of temporary differences between the carrying amounts of assets and liabilities for financial reporting purposes and the amounts used for income tax purposes.
Significant components of the deferred corporate tax liabilities of the Corporation are as follows:
DEFERRED TAX BALANCES - SEPTEMBER 30, 2012
(in millions of dollars)
Opening Balance
Recognized in net income
Closing Balance
Deferred corporate tax liabilities:
Government assistance 1.5 0.8 2.3
Property, plant and equipment 21.6 (3.6) 18.0
Contingencies, other liabilities and net amounts 3.8 0.6 4.4
Accrued benefit liability 7.4 0.4 7.8
Unrealized loss on derivative financial instruments (0.3) 0.1 (0.2)
Accrued Benefit Asset (44.4) (1.0) (45.4)
(10.4) (2.7) (13.1)
Loss carry-forward 10.4 (2.1) 8.3
Deferred corporate tax liabilities - (4.8) (4.8)
The Corporation has $39.3 million (December 31, 2011: $50.3 million) of unused Quebec non-capital tax losses carried forward and expiring in 2029 and 2031.
Unrecognized deductible temporary differences, unused tax losses and unused tax credits for which no deferred tax assets have been recognized are attributed to the following:
(in millions of dollars) September 30, 2 012 31 décembre 2011
Federal:
Contingencies, other liabilities and net amounts 0.3 0.3
Quebec:
Government assistance 10.7 7.0
Property, plant and equipment 257.6 275.2
Accrued benefit liability 35.5 34.8
Loss carry forward 39.3 50.3
Unrealized loss on derivative financial instruments (0.3) -
Contingencies, other liabilities and net amounts 20.7 18.6
363.5 385.9
40
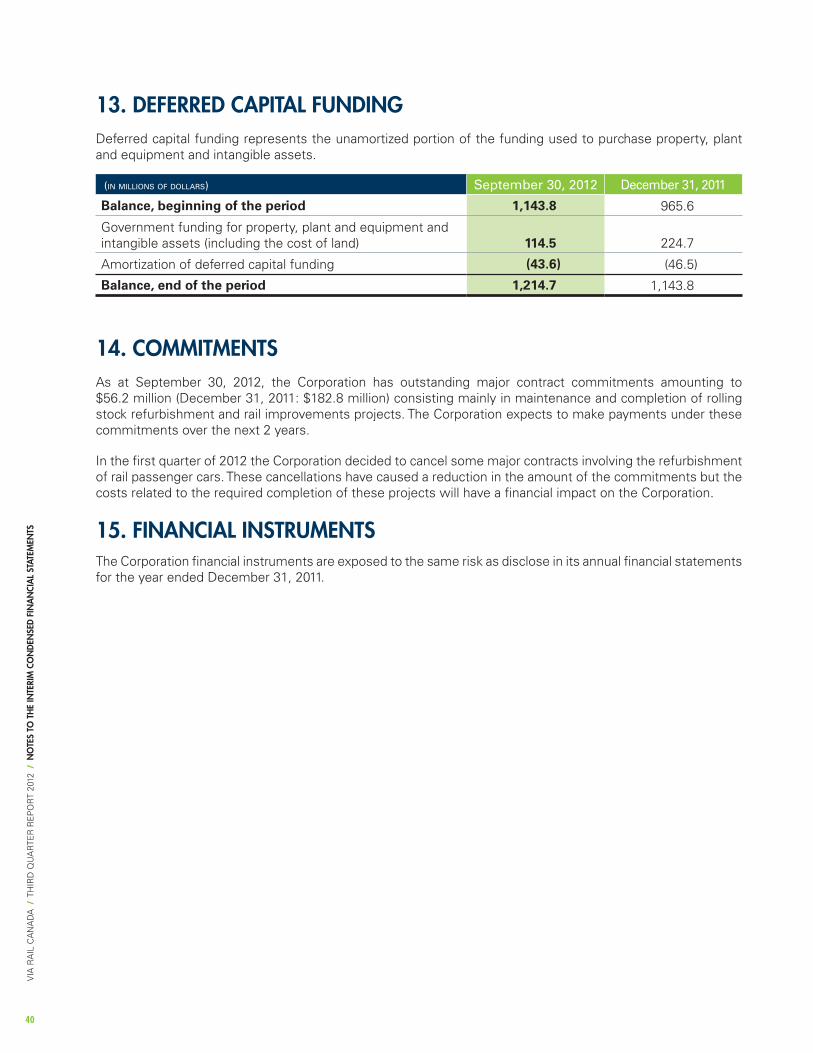
13. DEFERRED CAPITAL FUNDINGDeferred capital funding represents the unamortized portion of the funding used to purchase property, plant and equipment and intangible assets.
(in millions of dollars) September 30, 2012 December 31, 2011
Balance, beginning of the period 1,143.8 965.6
Government funding for property, plant and equipment and intangible assets (including the cost of land) 114.5 224.7
Amortization of deferred capital funding (43.6) (46.5)
Balance, end of the period 1,214.7 1,143.8
14. COMMITMENTSAs at September 30, 2012, the Corporation has outstanding major contract commitments amounting to $56.2 million (December 31, 2011: $182.8 million) consisting mainly in maintenance and completion of rolling stock refurbishment and rail improvements projects. The Corporation expects to make payments under these commitments over the next 2 years.
In the first quarter of 2012 the Corporation decided to cancel some major contracts involving the refurbishment of rail passenger cars. These cancellations have caused a reduction in the amount of the commitments but the costs related to the required completion of these projects will have a financial impact on the Corporation.
15. FINANCIAL INSTRUMENTSThe Corporation financial instruments are exposed to the same risk as disclose in its annual financial statements for the year ended December 31, 2011.
VIA
RA
IL C
AN
AD
A /
TH
IRD
QU
AR
TER
RE
PO
RT
2012
/ N
OTE
S TO
TH
E IN
TERI
M C
ON
DEN
SED
FIN
AN
CIA
L ST
ATEM
ENTS

41
16. DERIVATIVE FINANCIAL INSTRUMENTSThe Corporation uses commodity or price swaps where it exchanges cash payments based on changes in the price of a commodity (i.e. heating oil) or a market index. The Corporation also enters into foreign exchange forward contracts to either buy or sell USD at a specified price and date in the future. These contracts are related to fuel swaps and a future capital project.
At the end of the period, the fair value of the derivative financial instruments is as follows:
Crude swap September 30, 2012 December 31, 2011
Notional Quantity (000’s of U.S.
Gallons)
Fair Value CAD
(000’s)
Notional Quantity (000’s of U.S.
Gallons)
Fair Value CAD
(000’s)
Assets 12,852 1,274 4,032 1,509
Liabilities 5,040 408 9,324 1,173
As at September 30, 2012, the fuel swaps have a fixed price per U.S. gallon in USD between 1.957 and 3.149 and the maturity dates are 2012 to 2014. These financial instruments have a monthly settlement schedule.
Foreign Exchange contracts September 30, 2012 December 31, 2011
Notional Amount (USD)
(000’s)
Fair Value CAD
(000’s)
Notional Amount (USD)
(000’s)
Fair Value CAD
(000’s)
Assets 34,940 675 37,697 716
Liabilities 34,692 1,275 - -
As at September 30, 2012, the forward contracts rates are between 0.954 and 1.042 for these forwards contracts in US dollars and the maturity dates are 2012 to 2014. These financial instruments have a monthly settlement schedule.
Amounts recognized in the Statement of financial position:
September 30, 2012 December 31, 2011
Fair Value CAD
(000’s)
Fair Value CAD
(000’s)
Total assets 1,949 2,225
Total liabilities 1,683 1,173
17. SUBSEQUENT EVENTOn October 1, 2012 the Court of Queen’s Bench of New Brunswick issued an order that was favorable to the Corporation and settles all outstanding matters with respect to the completion of the railcars that are presently at the supliers facilities in Moncton, New Brunswick as well as all on-going litigations related to the railcar refurbishment contracts. The Corporation has negotiated a Management Agreement with the Receiver appointed by the Court as well as a third party to oversee the completion of these railcars.
VIA
RA
IL C
AN
AD
A /
TH
IRD
QU
AR
TER
RE
PO
RT
2012
/ N
OTE
S TO
TH
E IN
TERI
M C
ON
DEN
SED
FIN
AN
CIA
L ST
ATEM
ENTS