third quarter report -...
TRANSCRIPT

JANUARY - MARCH 2018
THIRD QUARTER REPORT
Third Quarter Report 2017-18 1
Page
COMPANY INFORMATION 2
DIRECTORS� REVIEW 3-4
DIRECTORS� REVIEW - IN URDU 5-6
CONDENSED INTERIM BALANCE SHEET 7
CONDENSED INTERIM PROFIT AND LOSS ACCOUNT 8
CONDENSED INTERIM STATEMENT OF CHANGES IN EQUITY 9
CONDENSED INTERIM CASH FLOW STATEMENT 10
NOTES TO AND FORMING PART OF THE CONDENSED
INTERIM FINANCIAL STATEMENTS 11-20
CONTENTS
Third Quarter Report 2017-182
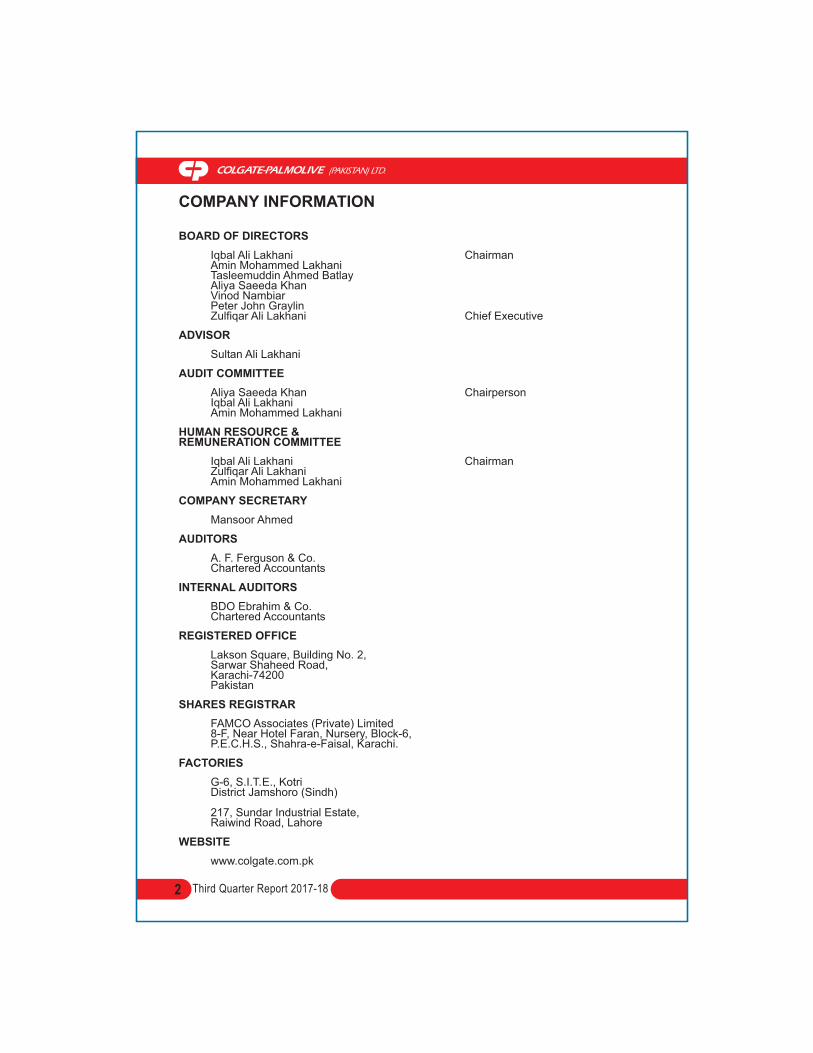
BOARD OF DIRECTORS
Iqbal Ali Lakhani ChairmanAmin Mohammed LakhaniTasleemuddin Ahmed BatlayAliya Saeeda KhanVinod NambiarPeter John GraylinZulfiqar Ali Lakhani Chief Executive
ADVISOR
Sultan Ali Lakhani
AUDIT COMMITTEE
Aliya Saeeda Khan ChairpersonIqbal Ali LakhaniAmin Mohammed Lakhani
HUMAN RESOURCE &REMUNERATION COMMITTEE
Iqbal Ali Lakhani ChairmanZulfiqar Ali LakhaniAmin Mohammed Lakhani
COMPANY SECRETARY
Mansoor Ahmed
AUDITORS
A. F. Ferguson & Co.Chartered Accountants
INTERNAL AUDITORS
BDO Ebrahim & Co.Chartered Accountants
REGISTERED OFFICE
Lakson Square, Building No. 2,Sarwar Shaheed Road,Karachi-74200Pakistan
SHARES REGISTRAR
FAMCO Associates (Private) Limited8-F, Near Hotel Faran, Nursery, Block-6,P.E.C.H.S., Shahra-e-Faisal, Karachi.
FACTORIES
G-6, S.I.T.E., KotriDistrict Jamshoro (Sindh)
217, Sundar Industrial Estate,Raiwind Road, Lahore
WEBSITE
www.colgate.com.pk
COMPANY INFORMATION

3
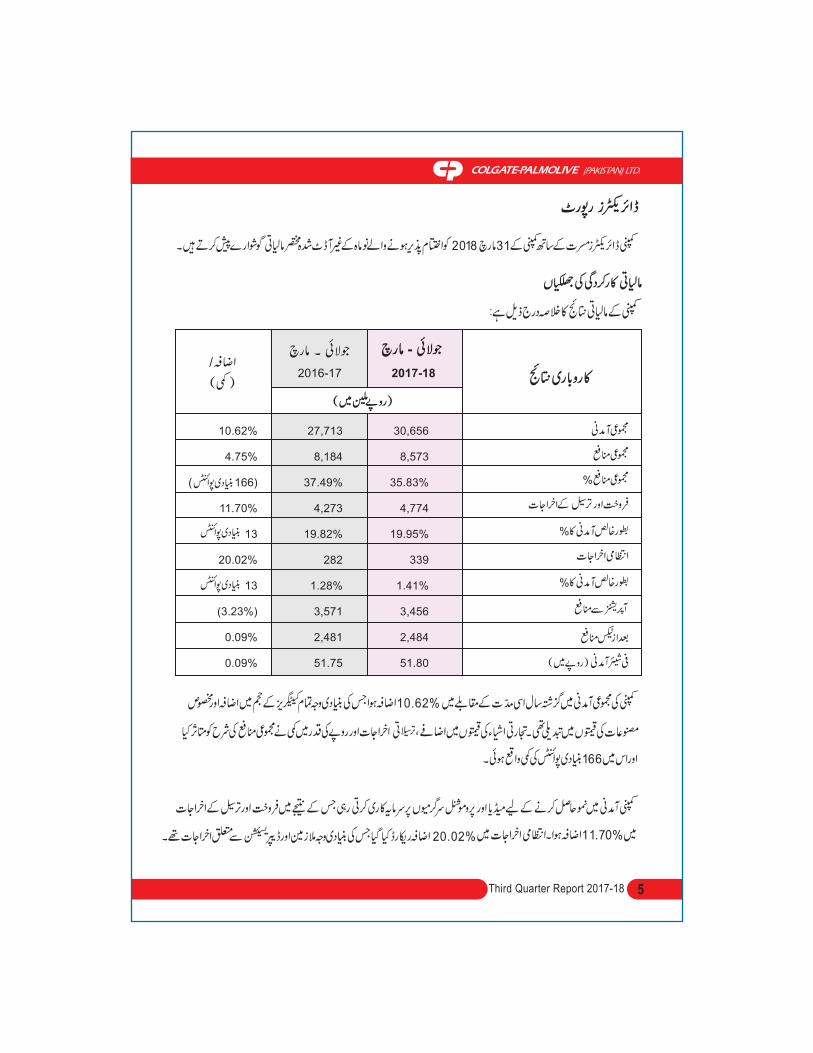
The turnover of the Company increased by 10.62% over the corresponding period last year
mainly due to growth in volume of all categories and selective price adjustments. Gross profit
margin has been impacted by the increase in commodity prices, logistics costs and devaluation
of PKR which declined by 166 bps.
The Company continued to support revenue growth through investment on media and promotional
campaigns which increased selling and distribution costs by 11.70%. Administrative expenses
recorded an increase of 20.02% primarily due to employee related costs and depreciation.
Business Performance Highlights
The Company introduced two variants of Colgate Total - Advanced Health and Charcoal Deep
Clean in the multi-benefit toothpaste segment. Its unique, clinically proven formula provides
12-hour protection against bacteria to help prevent common oral issues like cavities, plaque,
gingivitis, sensitivity, tartar, staining and bad breath. Besides offering a whole-mouth clean
benefit to superior oral care seekers, this premium toothpaste launch will strengthen our leadership
in the toothpaste category.
DIRECTORS� REVIEW
The directors of your Company are pleased to present un-audited condensed financial statements
of the Company for the nine months period ended March 31, 2018.
Financial Performance Highlights
The financial performance of the Company for the period is summarized below:
Turnover
Gross Profit
- as %age to Net Sales
Selling & Distribution Costs
- as %age to Net Sales
Administrative Expenses
- as %age to Net Sales
Profit from Operations
Profit After Tax
Earnings per Share - Rupees
Increase/(Decrease)Amount in PKR million
27,713
8,184
37.49%
4,273
19.82%
282
1.28%
3,571
2,481
51.75
July- March2017-18
July- March2016-17
10.62%
4.75%
(166 bps)
11.70%
13 bps
20.02%
13 bps
(3.23%)
0.09%
0.09%
Operating Results
Third Quarter Report 2017-18
30,656
8,573
35.83%
4,774
19.95%
339
1.41%
3,456
2,484
51.80

Third Quarter Report 2017-184
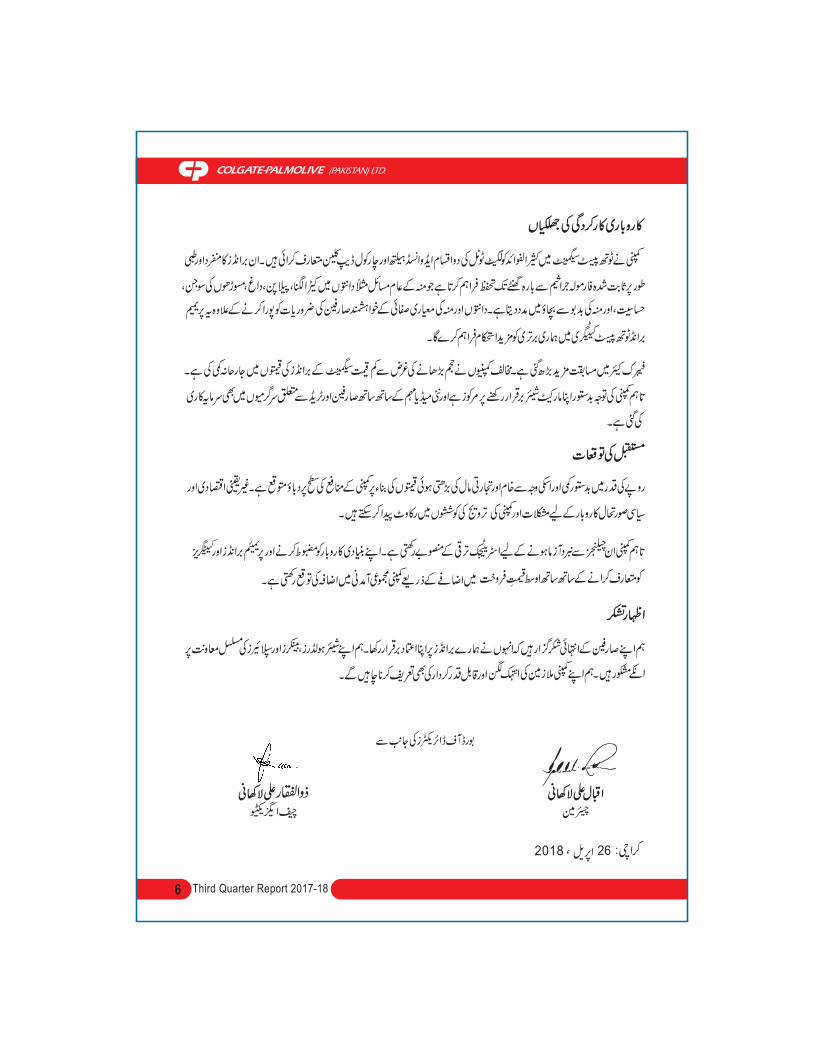
Competition intensified further in Fabric care as we saw aggressive price drops from competitors
to gain volume in the low-price segment. The Company remains focused in defending its market
share and has invested in a new media campaign along with consumer activations and trade
activities to grow its business in the low-price segment.
Future Outlook
With rupee devaluation and increasing raw material and commodity prices, the Company foresees
pressure on margins. The uncertain economic and political environment could pose challenges
for the business and is anticipated to counter Company's growth efforts.
However, the Company has strategic growth plans to deal with these challenges. The Company
anticipates to increase average selling prices and topline growth that will be delivered through
strengthening base business and introducing premium products and categories.
Acknowledgement
We would like to extend our sincere gratitude to our customers for their trust in our brands. We
are thankful to our bankers, shareholders and suppliers for their continued support. We also
appreciate our employees for their relentless dedication and immense contribution to the
Company.
Karachi : April 26, 2018
On behalf of Board of Directors
IQBAL ALI LAKHANIChairman
ZULFIQAR ALI LAKHANIChief Executive
Third Quarter Report 2017-18 5
11.76%
6.86%
( 158)
12.72%
21
20.30%
10
0.67%
3.87%
3.87%
10.62%
4.75%
( 166)
11.70%
13
20.02%
13
(3.23%)
0.09%
0.09%
2017-18
27,713
8,184
37.49%
4,273
19.82%
282
1.28%
3,571
2,481
51.75
30,656
8,573
35.83%
4,774
19.95%
339
1.41%
3,456
2,484
51.80
2016-17
Third Quarter Report 2017-186
26
Third Quarter Report 2017-18 7
Zulfiqar Ali LakhaniChief Executive
Tasleemuddin Ahmed BatlayDirector
Mirza Rehan AhmedChief Financial Officer
(Rupees in �000)
As at March 31, 2018
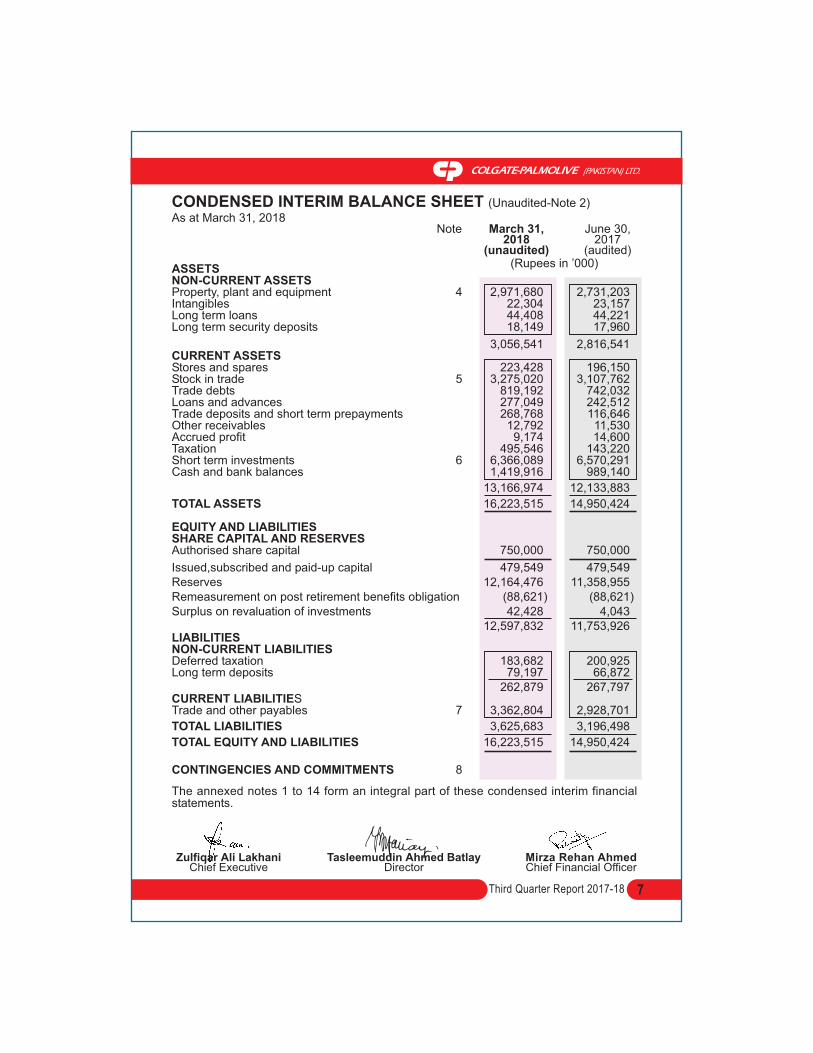
CONDENSED INTERIM BALANCE SHEET (Unaudited-Note 2)
March 31,2018
(unaudited)
June 30,2017
(audited)
Note
ASSETSNON-CURRENT ASSETSProperty, plant and equipment 4 2,971,680 2,731,203Intangibles 22,304 23,157Long term loans 44,408 44,221Long term security deposits 18,149 17,960
3,056,541 2,816,541CURRENT ASSETSStores and spares 223,428 196,150Stock in trade 5 3,275,020 3,107,762Trade debts 819,192 742,032Loans and advances 277,049 242,512Trade deposits and short term prepayments 268,768 116,646Other receivables 12,792 11,530Accrued profit 9,174 14,600Taxation 495,546 143,220Short term investments 6 6,366,089 6,570,291Cash and bank balances 1,419,916 989,140
13,166,974 12,133,883
TOTAL ASSETS 16,223,515 14,950,424
EQUITY AND LIABILITIESSHARE CAPITAL AND RESERVESAuthorised share capital 750,000 750,000
Issued,subscribed and paid-up capital 479,549 479,549Reserves 12,164,476 11,358,955Remeasurement on post retirement benefits obligation (88,621) (88,621)Surplus on revaluation of investments 42,428 4,043
12,597,832 11,753,926LIABILITIESNON-CURRENT LIABILITIESDeferred taxation 183,682 200,925Long term deposits 79,197 66,872
262,879 267,797CURRENT LIABILITIESTrade and other payables 7 3,362,804 2,928,701
TOTAL LIABILITIES 3,625,683 3,196,498
TOTAL EQUITY AND LIABILITIES 16,223,515 14,950,424
CONTINGENCIES AND COMMITMENTS 8
The annexed notes 1 to 14 form an integral part of these condensed interim financialstatements.

Third Quarter Report 2017-188
Zulfiqar Ali LakhaniChief Executive
Tasleemuddin Ahmed BatlayDirector
Mirza Rehan AhmedChief Financial Officer
Note Nine monthsperiod ended
March 31,2018
Nine monthsperiod ended
March 31,2017
Quarter endedMarch 31,
2018
Quarter endedMarch 31,
2017
(Rupees in �000)
Turnover 10,490,602 9,669,744 30,656,081 27,712,935Sales tax (1,666,353) (1,536,736) (4,862,090) (4,397,163)Trade and other discounts (642,975) (556,834) (1,863,394) (1,620,816)
Net turnover 8,181,274 7,576,174 23,930,597 21,694,956
Cost of sales (5,264,122) (4,685,274) (15,357,445) (13,510,696)
Gross profit 2,917,152 2,890,900 8,573,152 8,184,260Selling and distribution costs (1,618,872) (1,474,556) (4,773,594) (4,273,475)Administrative expenses (121,733) (101,824) (338,512) (282,040)Other expenses (102,724) (104,199) (301,875) (284,083)Other income 96,943 90,931 296,689 226,688Profit from operations 1,170,766 1,301,252 3,455,860 3,571,350Finance cost and bank charges (7,369) (5,551) (20,405) (17,782)
Profit before taxation 1,163,397 1,295,701 3,435,455 3,553,568Taxation
- Current - for the period 359,159 421,423 1,009,800 1,144,384 - for prior year - 19,894 (28,136) (9,624)
359,159 441,317 981,664 1,134,760 - Deferred (11,971) (21,682) (30,153) (62,852)
(347,188) (419,635) (951,511) (1,071,908)
Profit after taxation 816,209 876,066 2,483,944 2,481,660
Other comprehensive incomefor the period - net of tax
Items that may be reclassified subsequently to profit and loss
Surplus on investments categorisedas 'available for sale' - net 10,349 38,336 45,159 112,691
Impact of deferred tax (1,552) (5,751) (6,774) (16,904)
8,797 32,585 38,385 95,787Total comprehensive income
for the period 825,006 908,651 2,522,329 2,577,447
Earnings per share - (Rupees) 9 17.02 18.27 51.80 51.75
The annexed notes 1 to 14 form an integral part of these condensed interim financial statements.
CONDENSED INTERIM PROFIT AND LOSS ACCOUNT (Unaudited- Note 2)
For the Quarter and Nine months period ended March 31, 2018

10,677,367)
2,481,660)
95,787)
2,577,447)
-
(1,438,648)
(719,324)
(2,157,972)
11,096,842)
11,753,926)
2,483,944)
38,385)
2,522,329)
-
(959,099)
(719,324)
(1,678,423)
12,597,832)
Third Quarter Report 2017-18 9
Zulfiqar Ali LakhaniChief Executive
Tasleemuddin Ahmed BatlayDirector
Mirza Rehan AhmedChief Financial Officer
CONDENSED INTERIM STATEMENT OF CHANGES IN EQUITY (Unaudited - Note 2)
For the Nine months period ended March 31, 2018
(Rupees in �000)
Issued,subscribedand paid upshare capital
Capitalreserve-
sharepremium
Generalreserve
Unappro-priatedprofit
TotalEquity
Revenue reserves Surplus onrevaluation
ofinvestments-
net of tax
SubTotal-
reserves
Remeasurementon post retire-ment benefitsobligation- net
of tax
The annexed notes 1 to 14 form an integral part of these condensed interim financial statements.
7,296
-
95,787
95,787
-
-
-
-
103,083
4,043
-
38,385
38,385
-
-
-
-
42,428
7,428,000
-
-
-
1,380,000
-
-
-
8,808,000
8,808,000
-
-
-
1,578,000
-
-
-
10,386,000
Balance as at July 1, 2016
Comprehensive income for the period
Profit after taxation for the nine monthsperiod ended March 31, 2017
Other comprehensive income
Total comprehensive income for theperiod ended March 31, 2017
Transfer to general reserve
Transactions with owners
Final dividend for the year endedJune 30, 2016 (Rs. 30 per share)
Interim dividend for the year endedJune 30, 2017 (Rs. 15 per share)
Total transactions with owners
Balance as at March 31, 2017
Balance as at July 1, 2017
Comprehensive income for the period
Profit after taxation for the nine monthsperiod ended March 31, 2018
Other comprehensive income
Total comprehensive income for theperiod ended March 31, 2018
Transfer to general reserve
Transactions with owners
Final dividend for the year endedJune 30, 2017 (Rs. 20 per share)
Interim dividend for the year endingJune 30, 2018 (Rs. 15 per share)
Total transactions with owners
Balance as at March 31, 2018
479,549
-
-
-
-
-
-
-
479,549
479,549
-
-
-
-
-
-
-
479,549
13,456
-
-
-
-
-
-
-
13,456
13,456
-
-
-
-
-
-
-
13,456
2,819,048)
2,481,660)
-
2,481,660)
(1,380,000)
(1,438,648)
(719,324)
(2,157,972)
1,762,736)
2,537,499)
2,483,944)
-
2,483,944)
(1,578,000)
(959,099)
(719,324)
(1,678,423)
1,765,020)
(69,982)
-
-
-
-
-
-
-
(69,982)
(88,621)
-
-
-
-
-
-
-
(88,621)
10,260,504
2,481,660
-
2,481,660
-
(1,438,648)
(719,324)
(2,157,972)
10,584,192
11,358,955
2,483,944)
-
2,483,944)
-
(959,099)
(719,324)
(1,678,423)
12,164,476)

Third Quarter Report 2017-1810
Zulfiqar Ali LakhaniChief Executive
Tasleemuddin Ahmed BatlayDirector
Mirza Rehan AhmedChief Financial Officer
CONDENSED INTERIM CASH FLOW STATEMENT (Unaudited - Note 2)For the Nine months period ended March 31, 2018
(Rupees in �000)
Nine monthsperiod ended
March 31,2018
Nine monthsperiod ended
March 31,2017
Note
CASH FLOWS FROM OPERATING ACTIVITIES
Cash generated from operations 10 3,670,669 3,710,730
Staff retirement gratuity paid (15,000) (2,683)
Finance cost and bank charges paid (20,405) (17,782)
Taxes paid (1,333,993) (808,959)
Long term loans (187) (8,401)
Long term security deposits (assets) (189) (73)
Long term deposits (liabilities) 12,325 13,995
Net cash generated from operating activities 2,313,220 2,886,827
CASH FLOWS FROM INVESTING ACTIVITIES
Capital expenditure (749,122) (329,494)
Purchase of Intangible assets (7,117) (5,960)
Proceeds from disposal of property, plant and equipment 22,234 19,748
Profit received on saving accounts and Term Deposit Receipts 97,939 68,112
Profit received on treasury bills 84,751 -
Profit received on Pakistan Investment Bonds 5,058 -
Profit received on Mushrakah Certificates 3,896 -
Short term investments made during the period (8,342,183) (2,745,031)
Disposal / redemption of short term investments 9,003,405 3,975,692
Net cash generated from investing activities 118,861 983,067
CASH FLOWS FROM FINANCING ACTIVITIES
Dividend paid (1,672,305) (2,153,321)
Net increase in cash and cash equivalents 759,776 1,716,573
Cash and cash equivalents at the beginning of the period 4,415,140 1,798,227
Cash and cash equivalents at the end of the period 11 5,174,916 3,514,800
The annexed notes 1 to 14 form an integral part of these condensed interim financial
statements.
1. THE COMPANY AND ITS OPERATIONS
Colgate-Palmolive (Pakistan) Limited (the Company) was initially incorporated inPakistan on December 5,1977 as a public limited Company with the name of NationalDetergents Limited. The name of the Company was changed to Colgate- Palmolive(Pakistan) Limited on March 28, 1990 when the Company entered into a ParticipationAgreement with Colgate-Palmolive Company, USA. The Company is listed on PakistanStock Exchange. The registered office of the Company is situated at Lakson Square,Building No.2, Sarwar Shaheed Road, Karachi.
The Company is mainly engaged in the manufacture and sale of detergents, personalcare and other related products.
2. BASIS OF PREPARATION AND SIGNIFICANT ACCOUNTING POLICIES
2.1 STATEMENT OF COMPLIANCE
As per the requirements of circular no. CLD/CCD/PR(11)/2017 dated October 4, 2017issued by the Securities & Exchange Commission of Pakistan (SECP), companieswhose financial year, including quarterly and other interim periods, closes on or beforeDecember 31, 2017, Shall prepare their financial statements, including interim financialstatements in accordance with the provisions of the repealed Companies Ordinance,1984.
Accordingly, These condensed interim financial statements have been prepared inaccordance with the requirements of the International Accounting Standard (IAS) 34,Interim Financial Reporting' and provisions of and directives issued under the repealedCompanies Ordinance, 1984. In case where requirements differ, the provisions of ordirectives issued under the repealed Companies Ordinance , 1984 have been followed.
2.2 These condensed interim financial statements do not include all the information anddisclosures required in an annual audited financial statements, and should be readin conjunction with the Company's annual audited financial statements for the yearended June 30, 2017.
2.3 These condensed interim financial statements comprise of the condensed interimbalance sheet as at March 31, 2018 and the condensed interim profit and loss account,the condensed interim statement of changes in equity, the condensed interim cashflow statement and notes thereto for the nine months period then ended. Thesecondensed interim financial statements also include the condensed interim profit andloss account for the quarter ended March 31, 2018.
2.4 The comparative balance sheet presented in these condensed interim financialstatements, as at June 30, 2017 has been extracted from the annual audited financialstatements of the Company for the year ended June 30, 2017 whereas the comparativecondensed interim profit and loss account, condensed interim statement of changes
Third Quarter Report 2017-18 11
NOTES TO AND FORMING PART OF THE
CONDENSED INTERIM FINANCIAL STATEMENTS (Unaudited - Note 2)For the Nine months period ended March 31, 2018

Third Quarter Report 2017-1812
in equity and condensed interim cash flow statement together with the notes theretofor the nine months period ended March 31, 2017 have been extracted from thecondensed interim financial statements of the Company for the nine months periodthen ended. The comparative condensed interim profit and loss account for the quarterended March 31, 2017 also included in these condensed interim financial statements.
2.5 Change in accounting standards, interpretations and amendments to publishedapproved accounting standards that are effective.
a) Standards, interpretations and amendments to the published approved accountingstandards that are effective
There are certain new amendments to approved accounting standards which aremandatory for the Company's accounting periods beginning on or after July 1, 2017.However such do not have any siginficant impact on the Company's financial reporting,therefore, have not been detailed in these condensed interim financial statements.
b) Standards, interpretations and amendments to published approved accountingstandards that are not yet effective but relevant
The following are the new standards, amendments to existing approved accountingstandards and new interpretations that will be effective for the periods beginning onor after July 1, 2018 that may have an impact on the financial statements of theCompany.
IFRS 9 'Financial instruments' - This standard replaces the guidance in IAS 39. Itincludes requirements on the classification and measurement of financial assets andliabilities ; it also includes an expected credit loss model that replaces the currentincurred loss impairment model.
IFRS 15 'Revenue from contracts with customers' - IFRS 15 replaces the perviousrevenue standards: IAS 18 Revenue, IAS 11 Construction Contracts, and the relatedinterpretations on revenue recognitions.
IFRS 15 introduces a single five-step model for revenue recognition and establishesa comprehensive framework for recognition of revenue from contracts with customersbased on a core principle that an entity should recognise revenue representing thetransfer of promised goods or services to customers in an amount that reflects theconsideraton to which the entity expects to be entitled an exchange for those goodsor services.
The management is in the process of assessing the impact of changes laid down bythese standards on its financial statements.
2.6 The accounting policies and the methods of computation adopted in the preparationof these condensed interim financial statements are same as those applied in thepreparation of the financial statements for the year ended June 30, 2017.

Third Quarter Report 2017-18 13
(Rupees in �000)
March 31,2018
(unaudited)
June 30,2017
(audited)
Note
4. PROPERTY, PLANT AND EQUIPMENT
Operating fixed assets (at net book value) 4.1 to 4.5 2,527,523 2,465,377Capital work-in-progress (at cost) 4.6 444,157 265,826
2,971,680 2,731,203
4.1 Additions - operating fixed assets (at cost)
Factory building on leasehold land 25,358 2,691Plant and machinery 274,451 73,300Electric fittings and installation 24,203 5,038Furniture and fixtures 41,515 518Tools and equipment 48,545 15,313Vehicles 75,642 38,807Computers and accessories 60,303 28,707Office equipment 20,774 5,749
570,791 170,123
4.1.1 Additions include transfers from capital work-in-progress aggregating Rs 348.555million (March 31, 2017: Rs 1.260 million).
3. SIGNIFICANT ACCOUNTING ESTIMATES , JUDGEMENTS AND FINANCIAL RISKMANAGEMENT
The preparation of these condensed interim financial statements in conformity withthe approved accounting standards as applicable in Pakistan for interim reportingrequires management to make estimates, assumptions and use judgments that affectthe application of policies and reported amounts of assets and liabilities and incomeand expenses. Estimates, assumptions and judgments are continually evaluated andare based on the historical experience and other factors, including reasonableexpectations of future events. Revision to accounting estimates are recognisedprospectively commencing from the period of revision.
Judgements and estimates made by the management in the preparation of thesecondensed interim financial statements are same as those applied to financialstatements as at and for the year ended June 30, 2017.
The Company's financial risk management objectives and policies are consistent withthose disclosed in the financial statements as at and for the year ended June 30,2017.
Nine monthsperiod ended
March 31,2018
Nine monthsperiod ended
March 31,2017
(Rupees in �000)

Third Quarter Report 2017-1814
Nine monthsperiod ended
March 31,2018
Nine monthsperiod ended
March 31,2017
(Rupees in �000)
4.2 Disposals - operating fixed assets (at net book value)
Plant and machinery 2,459 -Vehicles 9,115 8,704Computer and accessories 250 47Office equipment 67 80Tools and equipment 60 -
11,951 8,831
4.3 Depreciation charge during the period 495,621 426,653
4.4 Included in operating fixed assets are few items having cost of Rs. 18.771 million(June 30,2017: Rs. 37.380 million) held by third parties for manufacturing certainproducts of the Company. These fixed assets are free of lien and the Company hasfull right of repossession of these assets.
4.5 During the period, the Company has identified certain items of property, plant andequipment from which further economic benefits are no longer being derived.Therefore, assets having cost of Rs 9.013 million (March 31, 2017: Rs 4.843 million)and net book value of Rs 1.073 million (March 31, 2017: Rs 0.246 million) havebeen retired from active use and have been written off in these condensed interimfinancial statements.
4.6 Additions - capital work-in-progress (at cost)
Factory building on leasehold land 63,466 33,552 Plant and machinery 373,592 84,033 Vehicles 33,434 -
Electric fittings and installation 18,506 6,928Tools and equipment 19,991 4,313
Furniture & fixtures 8,510 20,873Computer and accessories 126 3,917Office equipment 9,261 7,018
526,886 160,634
4.6.1 During the period, the Company has written off capital work-in-progress aggregationgRs Nil (March 31,2017 : Rs 0.139 million).
Third Quarter Report 2017-18 15
(Rupees in �000)
March 31,2018
(unaudited)
June 30,2017
(audited)
Note
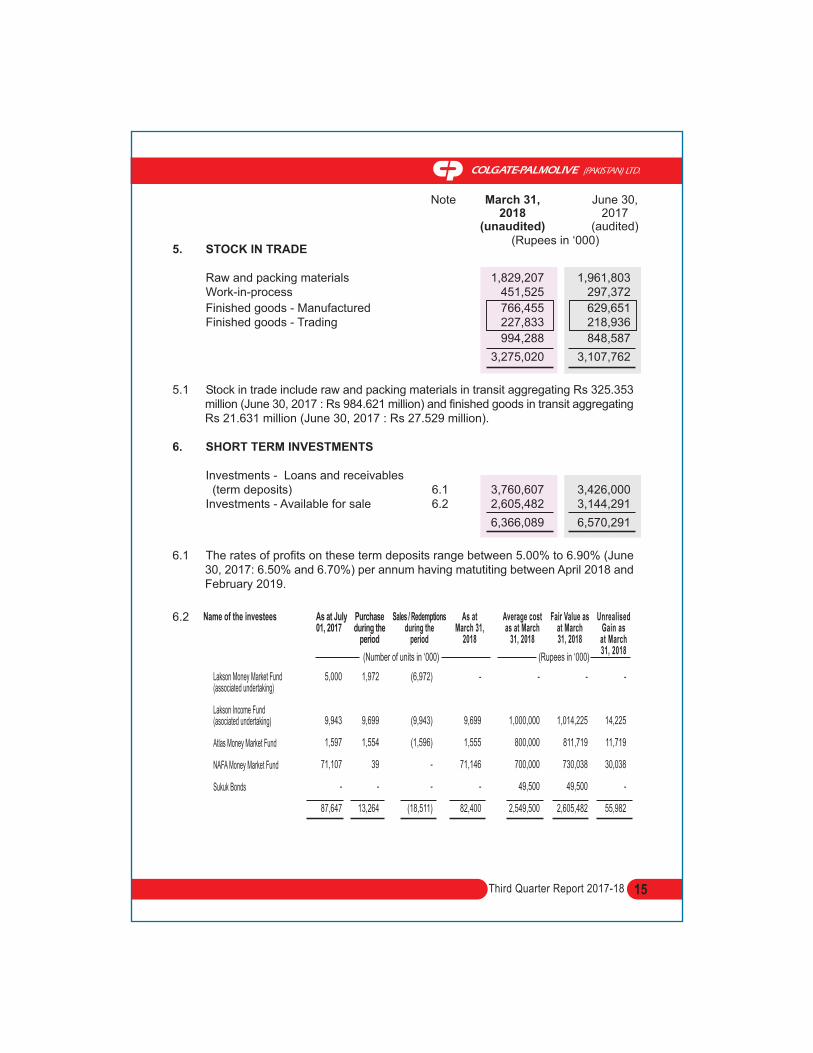
5. STOCK IN TRADE
Raw and packing materials 1,829,207 1,961,803Work-in-process 451,525 297,372
Finished goods - Manufactured 766,455 629,651Finished goods - Trading 227,833 218,936
994,288 848,587
3,275,020 3,107,762
5.1 Stock in trade include raw and packing materials in transit aggregating Rs 325.353million (June 30, 2017 : Rs 984.621 million) and finished goods in transit aggregatingRs 21.631 million (June 30, 2017 : Rs 27.529 million).
6. SHORT TERM INVESTMENTS
Investments - Loans and receivables(term deposits) 6.1 3,760,607 3,426,000
Investments - Available for sale 6.2 2,605,482 3,144,291
6,366,089 6,570,291
6.1 The rates of profits on these term deposits range between 5.00% to 6.90% (June30, 2017: 6.50% and 6.70%) per annum having matutiting between April 2018 andFebruary 2019.
5,000
9,943
1,597
71,107
-
87,647
Lakson Money Market Fund (associated undertaking)
Lakson Income Fund (asociated undertaking)
Atlas Money Market Fund
NAFA Money Market Fund
Sukuk Bonds
1,972
9,699
1,554
39
-
13,264
6.2 Name of the investees As at July01, 2017
Purchaseduring the
period
Sales / Redemptionsduring the
period
As atMarch 31,
2018
Fair Value asat March31, 2018
UnrealisedGain asat March31, 2018
Average costas at March
31, 2018
(Number of units in �000) (Rupees in �000)
(6,972)
(9,943)
(1,596)
-
-
(18,511)
-
9,699
1,555
71,146
-
82,400
-
1,000,000
800,000
700,000
49,500
2,549,500
-
1,014,225
811,719
730,038
49,500
2,605,482
-
14,225
11,719
30,038
-
55,982
Third Quarter Report 2017-1816
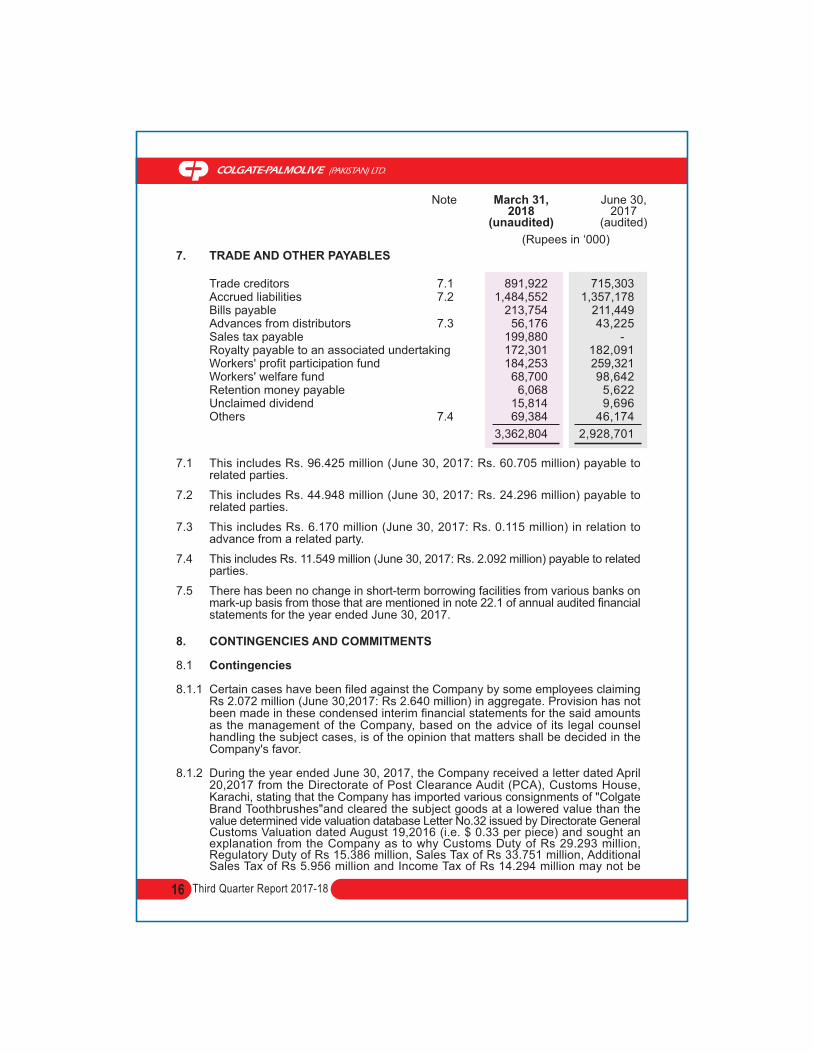
7. TRADE AND OTHER PAYABLES
Trade creditors 7.1 891,922 715,303Accrued liabilities 7.2 1,484,552 1,357,178Bills payable 213,754 211,449Advances from distributors 7.3 56,176 43,225Sales tax payable 199,880 -Royalty payable to an associated undertaking 172,301 182,091Workers' profit participation fund 184,253 259,321Workers' welfare fund 68,700 98,642Retention money payable 6,068 5,622Unclaimed dividend 15,814 9,696Others 7.4 69,384 46,174
3,362,804 2,928,701
7.1 This includes Rs. 96.425 million (June 30, 2017: Rs. 60.705 million) payable torelated parties.
7.2 This includes Rs. 44.948 million (June 30, 2017: Rs. 24.296 million) payable torelated parties.
7.3 This includes Rs. 6.170 million (June 30, 2017: Rs. 0.115 million) in relation toadvance from a related party.
7.4 This includes Rs. 11.549 million (June 30, 2017: Rs. 2.092 million) payable to relatedparties.
7.5 There has been no change in short-term borrowing facilities from various banks onmark-up basis from those that are mentioned in note 22.1 of annual audited financialstatements for the year ended June 30, 2017.
8. CONTINGENCIES AND COMMITMENTS
8.1 Contingencies
8.1.1 Certain cases have been filed against the Company by some employees claimingRs 2.072 million (June 30,2017: Rs 2.640 million) in aggregate. Provision has notbeen made in these condensed interim financial statements for the said amountsas the management of the Company, based on the advice of its legal counselhandling the subject cases, is of the opinion that matters shall be decided in theCompany's favor.
8.1.2 During the year ended June 30, 2017, the Company received a letter dated April20,2017 from the Directorate of Post Clearance Audit (PCA), Customs House,Karachi, stating that the Company has imported various consignments of "ColgateBrand Toothbrushes"and cleared the subject goods at a lowered value than thevalue determined vide valuation database Letter No.32 issued by Directorate GeneralCustoms Valuation dated August 19,2016 (i.e. $ 0.33 per piece) and sought anexplanation from the Company as to why Customs Duty of Rs 29.293 million,Regulatory Duty of Rs 15.386 million, Sales Tax of Rs 33.751 million, AdditionalSales Tax of Rs 5.956 million and Income Tax of Rs 14.294 million may not be
March 31,2018
(unaudited)
June 30,2017
(audited)
(Rupees in �000)
Note

recovered from the Company. During the period, these orders were withdrawl bythe respective authorities. Further, the Company has filed a revision petition againstthe valuation ruling No. 1067/2017 issued by Collector of Customs determiningvalues of Branded Toothbrushes on a higher rate. The Company has also obtaineda stay order against the aforementined ruling (issued by Collector of Customs) torestrain the custom authorities from taking any coercive action against the Company.
The management of the Company, based on the advice of its legal councel, isconfident of a favourable outcome.
8.1.3 During the period, the Company received an order dated August 10, 2017 from theCompetition Commission of Pakistan imposing a penalty of Rs 10 million undersection 10 of The Competition Act, 2010 against the show cause notice issued forindulging in deceptive marketing practices. The amount of the penalty has beenrecognised in these financial statements under the head 'Other Expenses'. However,the Company has filed an appeal with the Competition Appellate Tribunal againstthe above mentioned order which has also granted an interim relief order in favourof the Company stating that no coercivec action shall be taken untill the disposalof appeal.
8.1.4 There has been no change in the cases disclosed as contingency in notes 23.1.2,23.1.3 and 23.1.5 to the Company's financial statements for the year ended June30, 2017.
8.1.5 Contingent liabilities in respect of indemnities given to financial institutions forguarantees issued by them on behalf of the Company in the normal course ofbusiness aggregate Rs.40.750 million (June 30, 2017: Rs. 38.142 million).
8.1.6 Contingent liabilities in the form of bank guarantees issued in favour of Collectorof Customs for clearance of tooth brushes shipments under section 81 aggregateRs 55.662 million (June 30, 2017: 41.887 million) as mentioned in the note 8.1.2.
8.2 Commitments
8.2.1 Commitments in respect of capital expenditure and inventory items amount to Rs.83.327 million and Rs. 1,429.241million respectively (June 30, 2017: Rs. 51.974million and Rs. 1,050 million respectively).
8.2.2 Outstanding letters of credit amount to Rs. 1,281.852 million (June 30, 2017: Rs.980.045 million).
8.2.3 Outstanding duties leviable on clearing of stocks amount to Rs.17.275 million (June30, 2017: Rs. 14.382 million).
Third Quarter Report 2017-18 17
9. EARNINGS PER SHARE
(Rupees)
(Number of shares)
Profit after taxation 816,209 876,066 2,483,944 2,481,660
Weighted average number of ordinary shares outstanding
during the period 47,954,929 47,954,929 47,954,929 47,954,929
Earnings per share 17.02 18.27 51.80 51.75
Nine monthsperiod ended
March 31,2018
Nine monthsperiod ended
March 31,2017
Quarter endedMarch 31,
2018
Quarter endedMarch 31,
2017
(Rupees in �000)

9.1 There were no dilutive potential ordinary shares outstanding as at March 31, 2018and 2017.
Third Quarter Report 2017-1818
10. CASH GENERATED FROM OPERATIONS
Profit before taxation 3,435,455 3,553,568
Adjustment for non-cash charges and other items:
Depreciation and amortisation expense 503,591 429,869Gain on disposal of items of operating fixed assets (10,282) (10,918)Property,plant and equipment written off 4.5 1,073 246Profit on saving accounts and Term Deposit Receipts (98,951) (52,973)Profit on Treasury Bills (84,751) (84,487)Profit on PIBs (1,956) (11,490)Profit on Sukuks (1,321) -Profit on Musharaka Certificates (3,896) -Gain on redemption of short term investments (72,067) (38,100)Finance cost and bank charges 20,405 17,782Stocks in trade written off 502 4,288Capital work-in-progress charged off - 139Working capital changes 10.1 (17,133) (97,194)
3,670,669 3,710,730
10.1 Working capital changes
(Increase) / decrease in current assets:Stores and spares (27,278) (23,657)Stock in trade (167,760) (124,316)Trade debts (77,160) (108,187)Loans and advances (19,537) 34,816Trade deposits and short term prepayments (152,122) 15,797Other receivables (1,262) 5,602
(445,119) (199,945) Increase in current liabilities:Trade and other payables 427,986 102,751
(17,133) (97,194)
11. CASH AND CASH EQUIVALENTS
Cash and bank balances 1,419,916 921,072Short term investments - TDRs 3,755,000 2,500,000Short term Investments - Held to maturity - 93,728
5,174,916 3,514,800
Nine monthsperiod ended
March 31,2018
Nine monthsperiod ended
March 31,2017
(Rupees in �000)
Note

Third Quarter Report 2017-18 19
12. RELATED PARTIES
12.1 Disclosure of transactions and closing balances between the Company and relatedparties.
The related parties comprise associated companies, staff retirement funds, directorsand key management personnel. The Company in the normal course of businesscarries out transactions with various related parties.The Company enters intotransactions with related parties on the basis of mutually agreed terms. Significantbalances and transactions with related parties are as follows:
Nature of Transactions Nine monthsperiod ended
March 31,2018
Nine monthsperiod ended
March 31,2017
Relationshipwith the
Company
Sale of goods, services provided and
reimbursement of expenses Associates 52,442 927
Purchase of goods,services received and
reimbursement of expenses Associates 1,767,314 1,434,134
Purchase of short term investments Associates 1,200,000 600,000
Sale proceeds on redemption of
short term investments Associates 1,700,000 200,000
Profit on short term investments Associates 50,671 2,643
Rent, allied and other charges Associates 25,668 23,984
Royalty charges Associates 108,544 99,599
Insurance claims received Associates 6,502 2,563
Insurance commission income Associates 5,890 10,010
Purchase of property,plant and equipment Associates 1,197 20
Sale of property,plant and equipment Associates - 660
Contribution to staff retirement benefits Employee funds 52,054 77,354
Key management personnel
compensation paid Key management
personnel 47,265 46,829
Donations Associates 15,150 13,500
Dividend paid Associates 1,476,120 1,897,868
(Rupees in �000)

(Rupees in �000)
March 31,2018
(unaudited)
June 30,2017
(audited)
Nature of balances Relationshipwith the
Company
Third Quarter Report 2017-1820
21
Nine monthsperiod ended
March 31,2018
Nine monthsperiod ended
March 31,2017
Personal Care 24% 24%
Home Care 72% 73%
Others 4% 3%
100% 100%
Trade debts Associates 780 2,827
Loans and advances Associates 27,836 1,609
Other receivables Associates 2,187 470
Short term investments Associates 1,014,225 1,501,761
Trade and other payables Associates Refer note 7
13. ENTITY-WIDE INFORMATION
13.1 The Company constitutes of a single reportable segment, the principal classes ofwhich are Personal Care, Home Care and Others.
13.2 Information about products
The Company's principal classes of products accounted for the following percentagesof sales :
Zulfiqar Ali LakhaniChief Executive
Tasleemuddin Ahmed BatlayDirector
Mirza Rehan AhmedChief Financial Officer
13.3 Information about geographical areas
The Company does not hold non-current assets in any foreign country. Revenuesfrom external customers attributed to foreign countries in aggregate are not material.
13.4 Information about major customers
The Company does not have transactions with any external customer which amountto 10 percent or more of the Company's revenues.
14. DATE OF AUTHORISATION FOR ISSUE
These condensed interim financial statements were authorised for issue on April26, 2018 by the Board of Directors of the Company.

