third quarter budget implementation report - connect · ii foreword am delighted to present this...
TRANSCRIPT

BUDGET OFFICE OF THE FEDERATION
2013
Third Quarter Budget
Implementation
Report
F E D E R A L M I N I S T R Y O F F I N A N C E

ii
FOREWORD
am delighted to present this third Quarter Budget Implementation Report for
2013, which provides detailed information on the allocation of public resources
among competing socio-economic needs through the Federal Budget. These
Quarterly Budget Implementation Reports serve as instruments through which the
Ministries, Departments and Agencies (MDAs) of Government can be held
accountable for the expenditure and revenues they administer, and the realization of
objectives of government as elucidated in the Transformation Agenda.
The dissemination of this report is mandated by Section 30 and 50 of the Fiscal
Responsibility Act, 2007 which requires the Honourable Minister of Finance to
submit to the Joint Finance Committee of the National Assembly and the Fiscal
Responsibility Commission, quarterly budget implementation reports. These reports
are also disseminated to the wider public through electronic and print media. The
2013 1st and 2
nd Quarters Budget Implementation Reports were duly published
earlier in the year, and the 3rd
Quarter Report continues this reporting tradition.
The 3rd
Quarter Budget Implementation Report is the product of meticulous
planning, monitoring, evaluation and analytical work conducted by the Budget
Office of the Federation in collaboration with MDAs, Civil Society Organizations
and the Media. I commend the team for their hard work and also wish to recognize
the active roles of the National Assembly’s Joint Finance Committee and the Fiscal
Responsibility Commission in promoting best practices in public financial
management through their collaborative efforts. I look forward to more of this
cooperative work in future.
Lastly, I advise all readers of this Report to continue to display active interest in
government’s ability to live up to its promises. This will serve as the necessary
impetus for the efficient and effective management of government finances.
Dr. Ngozi Okonjo-Iweala
Coordinating Minister for the Economy and
Honourable Minister of Finance
I

iii
PREFACE
n pursuant to Section 30 of the Fiscal Responsibility Act, 2007, the Budget
Office of the Federation produces budget implementation reports on a quarterly
basis. This Report, which is the third series for the 2013 fiscal year fulfils this
obligation and also provide a means of demonstrating Government’s commitment to
the transparent and prudent management of public finances.
The 2013 Budget was prepared with a theme - fiscal consolidation with inclusive
growth. In order to achieve this goal, the Budget, among other considerations,
focused mainly on achieving macroeconomic stability and investing in priority
sectors. As such, Government desire was to ensure prudent management of scarce
fiscal resources so as to lay the foundation for rapid and sustainable growth as well
as create jobs which are consistent with the objectives of the Transformation
Agenda of the government.
The implementation of the 2013 Budget in the third quarter was quite challenging in
several respects. Apart from the shortfalls in projected revenue which affected the
full implementation of the budget in the quarter, the resolution of critical issues
identified in 2013 Appropriation Act which was submitted to the National
Assembly through a proposal for the amendment of the 2013 Budget was only
passed in August 2013. The delay in passing the amendment by the National
Assembly was a major setback to the successful implementation of the 2013
Budget.
This Report is a product of the joint efforts of financial and statistical agencies of
government which provide necessary macro-economic data, and the concerted
efforts of various departments of the Budget Office of the Federation, particularly
Budget Monitoring and Evaluation Division. I commend their efforts and wish them
every success as they continue to perform this important function.
Dr. Bright Okogu
Director General, Budget Office of the Federation
I

iv
TABLE OF CONTENTS
FOREWORD…………………………………………………………….………………..ii
PREFACE…………………………………………….…………………………………..iii
TABLE OF CONTENT……………………………………………….………………….iv
EXECCUTIVE SUMMARY……………………..…………………………….…..……..v
1.0 INTRODUCTION………………………………………………………....….……1
2.0 MACROECONOMIC DEVELOPMENT AND ANALYSIS…………………...3
3.0 FINANCIAL ANALYSIS OF THE 2013 BUDGET IMPLEMENTATION……9
3.1 Key Assumptions and Projections……………………………………9
3.2 Analysis of Revenue Performance……………………………..……11
3.3 FGN Budget Revenue…………………………………………………..19
3.4 Excess Crude Account……………………………………….………..21
3.5 Expenditure Development……………………………………………..22
3.5.1 Non-Debt Recurrent Expenditure…………………………….22
3.5.2 Debt Service………………………………………………………23
3.5.3 Statutory Transfers…………………………………...………...27
3.5.4 Capital Expenditure Performance…………………...…….…27
3.5.5 Performance of the Financing Items………………….……..30
4.0 CONCLUSION …………………………………………...………………...…….31

v
EXECUTIVE SUMMARY
The 2013 Budget was prepared based on the Transformation Agenda of the
Federal Government which was also in line with Nigeria Vision 20:2020
document. Data from the National Bureau of Statistics (NBS) shows GDP
grew by 6.81% in the third quarter of 2013 as against the 6.18% and 6.48%
recorded in the second quarter of 2013 and third quarter of 2012
respectively. Overall GDP growth for 2013 was estimated at 6.91% as
against 6.58% recorded in 2012. During the quarter, the non-oil sector
remained the major driver of growth recording 7.95% growth as against the
oil sector that contracted by 0.53%. Inflationary pressure continued to
moderate, partly in response to the rigid stance of monetary policy adopted
by the Central Bank of Nigeria (CBN) and also because of a robust
performance by the agricultural sector. The year-on-year headline inflation
increased slightly from 8.4% in June to 8.7% in July before declining to 8.2%
and 8% in August and September 2013 respectively. Similarly, year-on-year
food inflation rose from 9.6% in June to 10% and 9.7% in July and August
respectively before falling to 9.4% in September 2013. Overall, headline
inflation remained below 10% for eight consecutive months. Figures from
the Central Bank of Nigeria (CBN) reveal a fall in Nigeria’s gross external
reserves in the third quarter of 2013 which stood at US$44.11 billion as at
30thSeptember 2013.
Data from the Office of the Accountant General of the Federation (OAGF)
show that a net sum of N1,738.65 billion was shared among the three tiers
of government in the third quarter of 2013; implying a shortfall of N152.22
billion in the quarter. A total of N929.53 billion, excluding revenue from other
funding sources was received to fund the Federal Budget in the third quarter
of 2013 thereby presenting a shortfall of N95.53 billion (or 9.32%). This
affected the implementation of the 2013 Budget in the quarter.
The data also indicate that the implementation of recurrent (non-debt)
expenditure was 88.45% as at 30th September 2013. A total of N807.87
billion had been released and cash-backed for the implementation of MDAs
capital projects/programmes as contained in the 2013 Appropriation Act.

vi
The data also show that N545.87 billion (or 67.57%) of the total amount cash-
backed had been utilized by MDAs as at 30th September 2013. An analysis of
fifty (50) MDAs reported upon by the OAGF reveal different levels of utilization
among the MDAs. Eight (or 16%) of the MDAs including: Presidency, Police
Affairs, Works, National Sports Commission and Niger Delta utilized more than
the overall average utilization rate of 67.57% of the amount cash-backed. The
utilization report also shows that 21 MDAs (or 42%), which include Agriculture,
Water Resources, Defence, Education, Head of Service, Aviation and Niger
Delta utilized above 50% of their cash-backed funds. Twenty-nine (or 58%) of
MDAs including Women Affairs, Trade & Investment, Power, Justice, Science
& Technology, Transport, Petroleum, Housing and Environment had a
utilization rate of less than 50% during the period.
In addition to the regular budget, a total of N227.55 billion (or 83.2%) of the
N273.5 billion appropriated for SURE-P in the 2013 Budget was released as
at 30th September 2013 while N119.65 billion (or 52.58%) of the released
amount was utilized for major capital and social programmes. This assisted
in the area of infrastructure development.
The monitoring and evaluation of projects across MDAs showed varying
degree of progress. A sample of projects for the exercise was based on their
relevance to the Transformation Agenda, geographical spread, immediate
and long term socio-economic impact as well as their level of
implementation. Some of the key projects that were monitored and
evaluated are already impacting positively on the socio-economic activities
in the project-areas including the Provision of Engineering Infrastructure to
Abuja Technology Village, Procurement/Rehabilitation of Coaches and
Locomotives, and the Dualization of Kano – Maiduguri Road which has
improved traffic flow significantly within the area.

1
1.0 INTRODUCTION
he 2013 Budget was prepared based on the Transformation Agenda of
the Federal Government which was also in line with the Nigeria Vision
20:2020 document. The Budget was structured to further enhance the
country’s macro-economic gains recorded in recent years and create an
atmosphere that will enable Nigerians benefit from these gains through the
execution of tangible projects and programmes that will improve their living
standards and also create jobs. As in the past, the Budget is built on the
foundation of macroeconomic stability, structural reforms, governance &
institutions and investment in priority sectors with an overall theme of Fiscal
Consolidation and Growth.
2. The Budget is a product of the 2013-2015 Medium Term Fiscal
Framework (MTFF). The assumptions in the framework were based on the
happenings in the domestic and global economies. To this end, the Budget
was put together with the aim of reducing the effect of external shocks on our
economy, particularly in respect of the price of oil, eliminating waste in
government expenditure, diversifying government’s revenue base and
reducing government’s borrowing profile while making provision for payment of
maturing debt obligations.
3. Like the previous budgets, the 2013 Budget priority focused on critical
economic and social sectors. While activities in some of these sectors are
largely private sector driven, others require a great deal of public sector
support. In this regard, key allocations were made as follows: Critical
Infrastructure (including Power, Works, Transport, Aviation, Gas Pipelines and
Federal Capital Territory) – N497 billion; Human Capital Development (i.e.
Education and Health) – N705 billion; Agriculture & Water Resources – N175
billion; and National Security (comprising Police, Armed Forces, Office of the
National Security Adviser and the Ministry of Interior) – N953 billion.
4. The 2013 Budget proposal was prepared in record time and passed by
T

2
the National Assembly. However, it had several challenges that had to be
addressed. The 2013 Amendment Budget was eventually passed by the
National Assembly in August, 2013.
5. This Report presents detailed information on 2013 third quarter Budget
implementation. The rest of the Report is arranged as follows: a brief review of
the macroeconomic environment under which the Budget was implemented is
presented, followed by a detailed analysis of government’s revenue receipts
and expenditure in the quarter. A chapter on the outcome of the physical
monitoring and evaluation of capital projects and programmes is presented,
followed by a brief conclusion to the report.

3
2.0 MACROECONOMIC DEVELOPMENTS AND ANALYSIS
Global Economy
he recovery of the global economy continued on a slow course with
financial systems responding to, among others, the possibility of the
United States tightening its accommodative monetary policy posture
and higher long-term interest rates as the economy entered the recovery
mode. This move signified uncertainties in external conditions for up-and-
coming markets and developing economies including Nigeria. Meanwhile, the
primary risk of a depression in the Euro-zone, weak domestic demand and
slowing growth in China created rigid financial conditions capable of reducing
global growth prospects if and when monetary contractions begin in the
United States, Japan and the other advanced economies. However, with the
German election over, outstanding issues in the zone would be brought to
closure.
7. The International Monetary Fund (IMF or the Fund) affirmed that global
growth is strengthening on the back of accommodative monetary policy in the
period. The Fund also highlighted that even if an end to unconventional
monetary policy was certain, its impact would largely depend on country
specific situations and the rate of recovery recorded by various economies.
The optimistic outlook in the advanced economies compensated somewhat for
the slowdown of growth in the major emerging markets. Overall, it projected a
global growth of 3.1% projected for 2013.
Domestic Economy
8. Data from the National Bureau of Statistics (NBS) show that the
country’s GDP grew by 6.81% in the third quarter of 2013 as against the
6.18% and 6.48% recorded in the second quarter of 2013 and third quarter of
T

4
2012 respectively. The GDP growth for 2013 was estimated at 6.91% as
against 6.58% recorded in 2012. During the quarter, the non-oil sector
remained the major driver of growth recording 7.95% growth as against the oil
sector that contracted (year-on-year) by 0.53%. The drivers of the non-oil
sector growth were largely the agriculture sector, banking and insurance
activities, real estate, hotels and restaurants, building and construction, and
solid mineral production. The continued decline in the contribution of the oil
sector to overall GDP growth in recent times is due principally to the reported
incidence of growing crude oil theft and pipeline vandalism. These led to the
decline in output volumes in the face of an uncertain international oil market
signals, challenging infrastructure and downside risks due to discovery of
shale oil and the appearance of other African oil exporters competing for
Nigeria’s traditional oil markets.
9. Inflationary pressure continued to moderate, partly in response to the
supportive fiscal policies of the Federal Government which have improved
performance in the agricultural and other sectors and also, strong monetary
policy stance of Central Bank of Nigeria. The year-on-year headline inflation
increased slightly from 8.4% in June to 8.7% in July before declining to 8.2%
and 8% in August and September 2013 respectively. Similarly, year-on-year
food inflation rose from 9.6% in June to 10% and 9.7% in July and August
respectively before falling to 9.4% in September 2013. On the other hand,
year-on-year core inflation increased from 5.5% in June to 6.3%, 6.7% and
7.3% in July, August and September 2013 respectively. Overall, headline
inflation has remained below 10% for eight consecutive months.

5
Chart1: Inflation and M2 Growth Rate (September 2012 – September 2013)
Source: Central Bank of Nigeria, 2013 & National Bureau of Statistics, 2013
10. CBN data show that broad money supply (M2) fell by N1,221.88 billion
(or 7.84%) in September below the level in June 2013, that is, from
N15,593.26 billion in June to N14,371.38 billion in September. The net
aggregate domestic credit decreased by N192.9 million (or 1.45%) from
N13,294.51billion in June to N13,101.61 billion in September 2013. Credit to
the private sector increased slightly from N15,692.03 billion in June to
N16,292.28 billion in September 2013. Similarly, credit to government sector
also rose by N793.15million (or 33.08%) within the same period, from
N2,397.52 billion in June to N3,190.67 billion in September 2013. The average
prime lending rate declined slightly from16.56% in June to 16.47% and
16.55% in July and August respectively before rising to 16.76% in September
2013. On the other hand, the average maximum lending rate increased slightly
from 24.58% in June to 24.62% in July and fell to 24.46% in August before
rising again to 25.12% in September 2013.
11. Like the preceding quarters, the CBN carried on with a fixed Monetary
Policy Rate (MPR) of 12% in the third quarter of 2013 in pursuit of price
stability. The interest rates in the interbank money market moved in tandem
-10
-5
0
5
10
15
Sep.12 Oct.12 Nov.12 Dec.12 Jan.13 Feb.13 Mar.13 Apr.13 13-May Jun.13 Jul.13 Aug.13 Sep.13Gro
wth
(Pe
rce
nt)
M2 Growth Rate Headline Inflation Core Inflation Food Inflation

6
with the level of liquidity conditions in the banking system. Thus the average
interbank call rate fell from 11.59% in June to 10.63% in July before rising to
15.24% and 16.22% in August and September 2013 respectively. The trends
in interest rates in the third quarter of 2013 are presented below in Chart 2.
Chart 2: Interest Rates Trend (September 2012 – September 2013)
Source: Central Bank of Nigeria, 2013
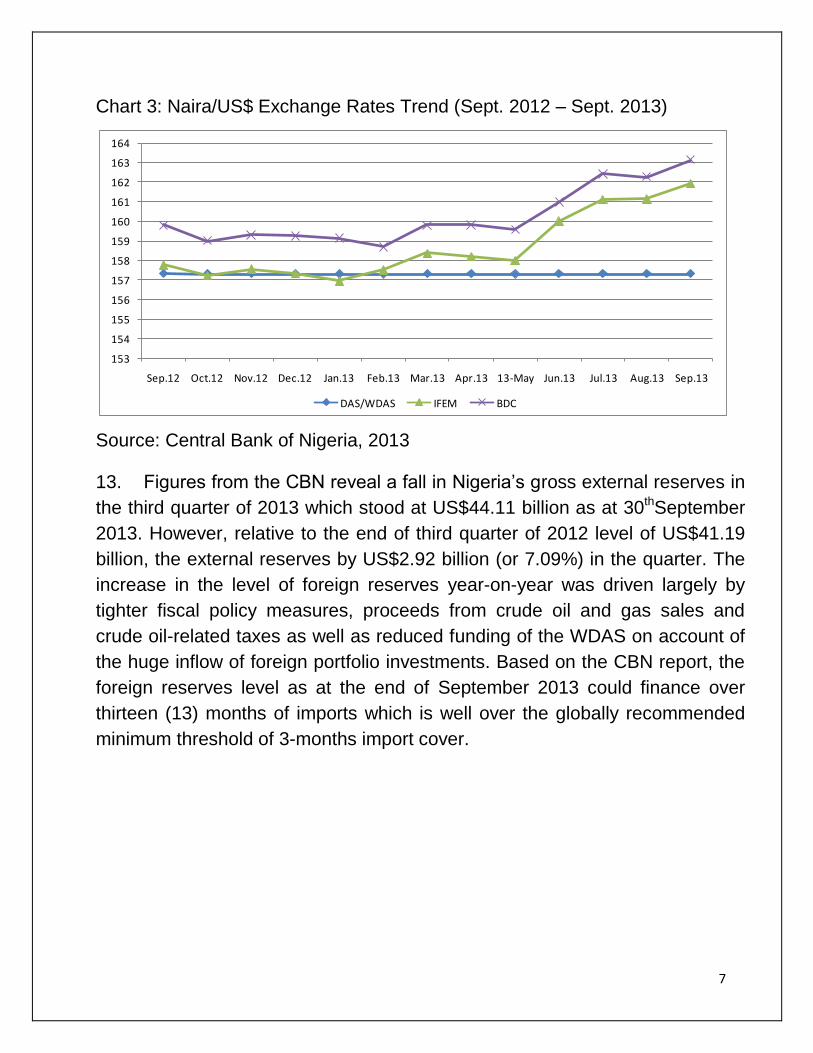
12. The average official Wholesale Dutch Auction System (WDAS)
Naira/Dollar exchange rate like in the previous quarter remained stable at
N157.31/$ during the period. On the other hand, the average Inter-bank and
Bureau de Change exchange rates depreciated from N160.02/$ and
N160.98/$ in June to N161.96/$ and N163.14/$ in September 2013
respectively. On the other hand, the pressure on the Naira exchange rate in
both the Interbank and Bureau De Change (BDC) appears to be driven by
sentiments.
0
5
10
15
20
25
30
Sep.12 Oct.12 Nov.12 Dec.12 Jan.13 Feb.13 Mar.13 Apr.13 13-May Jun.13 Jul.13 Aug.13 Sep.13
Pe
rce
nt
MPR Prime Lending Rate Maximum Lending Rate Inter-Bank Call Rate
7
Chart 3: Naira/US$ Exchange Rates Trend (Sept. 2012 – Sept. 2013)
Source: Central Bank of Nigeria, 2013
13. Figures from the CBN reveal a fall in Nigeria’s gross external reserves in
the third quarter of 2013 which stood at US$44.11 billion as at 30thSeptember
2013. However, relative to the end of third quarter of 2012 level of US$41.19
billion, the external reserves by US$2.92 billion (or 7.09%) in the quarter. The
increase in the level of foreign reserves year-on-year was driven largely by
tighter fiscal policy measures, proceeds from crude oil and gas sales and
crude oil-related taxes as well as reduced funding of the WDAS on account of
the huge inflow of foreign portfolio investments. Based on the CBN report, the
foreign reserves level as at the end of September 2013 could finance over
thirteen (13) months of imports which is well over the globally recommended
minimum threshold of 3-months import cover.
153
154
155
156
157
158
159
160
161
162
163
164
Sep.12 Oct.12 Nov.12 Dec.12 Jan.13 Feb.13 Mar.13 Apr.13 13-May Jun.13 Jul.13 Aug.13 Sep.13
DAS/WDAS IFEM BDC

8
Chart 4: Level of External Reserves in Billion Dollars (Sept.2012 – Sept. 2013)
Source: Central Bank of Nigeria, 2013
36
38
40
42
44
46
48
Sep.12 Oct.12 Nov.12 Dec.12 Jan.13 Feb.13 Mar.13 Apr.13 13-May Jun.13 Jul.13 Aug.13 Sep.13

9
3.0 FINANCIAL ANALYSIS OF THE 2013 BUDGET IMPLEMENTATION
3.1 Key Assumptions and Projections:
he 2013 Budget was based on the 2013-2015 Medium Term Fiscal
Framework (MTFF) which was prepared after extensive deliberations
and consultations with relevant stakeholders. Developments in the
world economy also formed the basis for some of the assumptions in the
formulation of this framework.
Table 1: Key Assumptions and Targets for the 2013 Budget
Source: BOF, NNPC, FIRS and NCS
KEY ASSUMPTION & TARGETS 2013
Projected Production (in mbpd) 2.52
Budget Benchmark Price (per barrel in US) 79
Technical Cost of JVC Pbl to Oil Companies
Operating Expenses (T1) in US $ 9.84
Capital Expenses (T2) in US $ 11.07
Technical Cost of PSC Pbl to Oil Companies
Operating Expenses (T1) in US $ 8.36Capital Expenses (T2) in US $ 16.28Investment Tax Credit 5.27Technical Costs of SC pbl to Oil CompanyOperating Expenses (T1) in US $ 9.06Capital Expenses (T2) in US $ 36.18
Investment Allowances 7.8Weighted Average Contribution RatesWeighted Average Rate of PPT-JV/AF/Independent/Marginal Oil 85%Weighted Average Rate of PPT-PSC Oil 51.35%Weighted Average Rate of PPT-SC Oil 85%Weighted Average Rate of Royalties-JV/AF/Independent/Marginal Oil 18.67%Weighted Average Rate of Royalties -PSC Oil 2.81%Weighted Average Rate of Royalties SC Oil 18.5%
Average Exchange Rate (NGN/US$) 160VAT Rate 5%CIT Rate 30%
T

10
Budget Benchmark Oil Price and Production
15. Due to the instability in the price of oil at the international market,
Government in recent times has worked out a precautious system of
determining the benchmark price of oil for its annual budgets. As such, budget
expenditures are delinked from the unstable world of oil prices. In view of this,
the benchmark price of oil for the 2013 Budget was fixed at US$79/barrel while
oil production was set at 2.52 million barrels per day (mbpd). The projected oil
production for 2013 budget represents a marginal increase of 0.04 mbpd (or
1.61%) above the 2.48 mbpd estimated for the 2012 Budget.
16. Details of projected contributions of oil production by business
arrangements are presented in Chart 5 below while the breakdown of
contributions and charges for the major oil taxes that are expected to accrue
to the Federal Government are also illustrated in Table 2 below.
Chart 5: Budget Oil Production by Business Arrangements 2009 – 2013
Source: NAPIMS/NNPC
0
0.5
1
1.5
2
2.5
3
2009 Actual 2010 Actual 2011 Actual 2012 Actual 2013 Budget
Joint Ventures 0.91 0.995 0.955 1 0.991
Alternative Funding 0.36 0.455 0.474 0.5 0.477
Prod. Sharing Contracts 0.736 0.868 0.793 0.843 0.947
Independents 0.113 0.115 0.122 0.11 0.104
Service Contracts 0.009 0.007 0.008 0.005 0.013
Marginal Fields 0.011 0.01 0.022 0.02 0.019
Mill
ion
Bar
rels
Pe
r D
ay
11
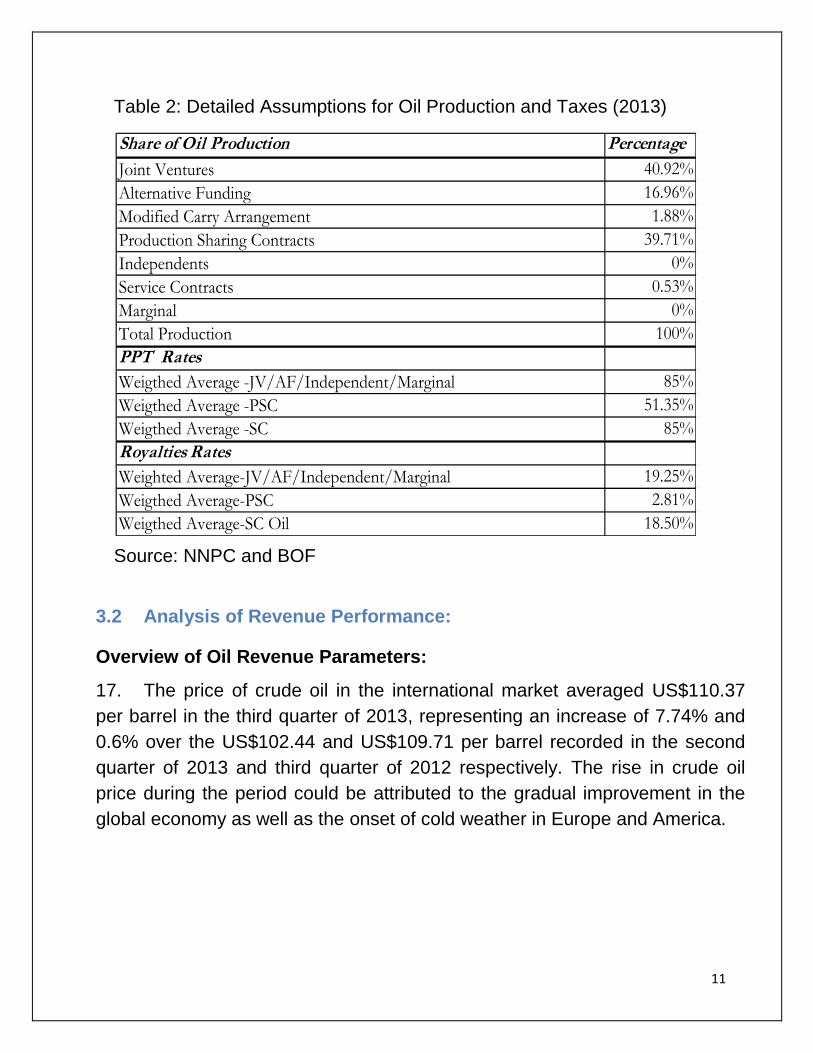
Table 2: Detailed Assumptions for Oil Production and Taxes (2013)
Source: NNPC and BOF
3.2 Analysis of Revenue Performance:
Overview of Oil Revenue Parameters:
17. The price of crude oil in the international market averaged US$110.37
per barrel in the third quarter of 2013, representing an increase of 7.74% and
0.6% over the US$102.44 and US$109.71 per barrel recorded in the second
quarter of 2013 and third quarter of 2012 respectively. The rise in crude oil
price during the period could be attributed to the gradual improvement in the
global economy as well as the onset of cold weather in Europe and America.
Share of Oil Production Percentage
Joint Ventures 40.92%
Alternative Funding 16.96%
Modified Carry Arrangement 1.88%
Production Sharing Contracts 39.71%
Independents 0%
Service Contracts 0.53%
Marginal 0%
Total Production 100%
PPT Rates
Weigthed Average -JV/AF/Independent/Marginal 85%
Weigthed Average -PSC 51.35%
Weigthed Average -SC 85%
Royalties Rates
Weighted Average-JV/AF/Independent/Marginal 19.25%
Weigthed Average-PSC 2.81%
Weigthed Average-SC Oil 18.50%

12
18. Provisional data from the Nigerian National Petroleum Corporation
(NNPC) show that the average oil lifting (including Condensates) in the third
quarter of 2013 was 2.26mbpd representing a shortfall of 0.26 (or 10.32%)
below the 2.52mbpd projected for the 2013 Budget. The volume of oil lifted in
the period exceeded 2.06mbpd recorded in the previous quarter by 0.2mbpd,
but falls short of 2.46mbpd recorded in the third quarter of 2012 by 0.2mbpd.
The drop in the volume of oil lifted during the quarter could be ascribed to
supply challenges following unrelenting crude oil theft, illegal bunkering and
pipeline vandalism that had persisted in the period.
19. The 2013 Fiscal Framework presents a gross Federally collectible
revenue estimate of N11,339.78 billion, made up of N7,734.15 billion (or
68.2%) oil revenue and N3,605.63 billion (or 31.8%) non-oil revenue. Below is
an analysis of the actual performance of the oil and non-oil revenue receipts in
the second quarter of 2013.
Oil Revenue Performance
20. A breakdown of the oil revenue performance in the third quarter of 2013
shows that only royalties (oil & gas) of N220.96 billion and petroleum profit &
gas taxes of N619.41 billion exceeded their respective quarterly expected
estimate of N190.27 billion and N590.79 billion by N30.69billion (or
16.13%)and N28.62billion (or 4.85%). On the other hand, crude oil sales of
N719.35 billion, gas sales of N61.84 billion, rent of N0.03 billion, gas flared
penalty of N0.55 billion and other oil & gas revenue of N0.65 billion fell below
their quarterly projections of N1,060.98 billion, N89.9 billion, N0.22 billion,
N0.62 billion and N0.77 billion by N341.63 billion (or 32.2%), N28.06 billion (or
31.21%), N0.19 billion (or 87.49%), N0.07 billion (or 10.64%) and N0.12 billion
(or 15.07%) respectively. Please see Table 3.1.

13
Net Oil Revenue:
21. In the third quarter of 2013, the actual net oil revenue that accrued into
the Federation Account was N1,005.33 billion, indicating a shortfall of N208.47
billion (or 17.18%) below the projected quarterly estimate of N1, 213.8 billion.
Similarly, the net oil revenue in the third quarter was lower than the N1,091.07
billion net oil revenue recorded in the second quarter by N85.75billion (or
7.86%). In spite of the favourable oil prices at the international market, the
less-than-projected performance of the net oil revenue in the third quarter of
2013 can be attributed to the fall in oil lifting figure during the period. These
data are presented in Table 3.1.
Year-to-Date:
22. As at end of September 2013, the gross Royalties (Oil & Gas) of
N684.45 billion, Gas Flared Penalty of N2.72 billion and Petroleum Profit Tax
of N2,159.21 billion exceeded their respective three quarter year projections of
N570.81 billion, N1.86billion and N1,772.36 billion by N113.64 billion (or
19.91%), N0.86 billion (or 46.14%) and N386.84 billion (or 21.83%). On the
other hand, Crude Oil Sales of N2,208.71 billion, Gas Sales of N200.59 billion,
Rent of N0.15 billion and Other Oil and Gas Revenue of N1.39 billion fell
below their corresponding three quarter year projections of N3,182.93 billion,
N269.69 billion, N0.66 billion and N2.3 billion by N974.22 billion (or 30.61%),
N69.1 billion (or 25.62%), N0.51 billion (or 76.91%) and N0.92 billion (or
39.88%). These low performances were due to the reasons earlier adduced.
Non-Oil Revenue Performance:
23. In recent times, the Government, through the Budget Office of the
Federation and the Federal Ministry of Finance has adopted different
measures aimed at boosting non-oil revenue collection and remittances to the
treasury. The outcome of these measures as well as the Budget Office’s
regular engagement with the Agencies has led to the continued growth in
targets and actual revenues from the non-oil sector. This trend, as presented

14
in Table 3.2 and Table 3.3, is expected to continue over the 2012 - 2015
period.
24. In the third quarter of 2013, the actual gross non-oil revenue of N766.93
billion was received. This implies an increase of N54.01 billion (or 7.58%)
above the quarterly estimate of N712.92 billion. A breakdown of the non-oil
revenue items show that only Company Income Tax of N475.08 billion was
above its quarterly projected estimate of N248.01 billion by N227.07 billion (or
91.56%). All others fell below their quarterly projected estimates. Value Added
Tax of N194.41 billion and Customs & Excise Duties of N97.44 billion were
below their quarterly estimates of N236.32 billion and N198.24 billion by
N41.91 billion (or 17.74%) and N100.8 billion (or 50.85%) respectively. When
compared to their respective second quarter outcomes, Value Added Tax,
Company Income Tax and Customs & Excise Duties grew by N0.76 billion (or
0.39%), N292.04 billion (or 159.55%) and N0.19 billion (or 0.19%) respectively
The increase in performances of these non-oil revenue items in the period as
against the second quarter can be ascribed to the increase in economic
activities during the period and it is expected that the trend will continue in the
last quarter of the year.
Year-to-Date:
25. The gross non-oil receipts in the three quarters of the year amounted to
N1,694.66 billion depicting a shortfall of N444.1 billion (or 20.76%) below the
three quarter year estimate of N2,138.76 billion. The performance also reveals
that with the exception of Company Income Tax, the other non-oil revenue
items fell below their respective estimates. Company Income Tax of N816.45
billion was above its three quarter year estimate of N744.03 billion by N72.42
billion (or 9.73%). On the other hand Value Added Tax of N573.58 billion and
Customs & Excise Duties of N304.64 billion respectively fell short by N135.38
billion (or 19.1%) and N290.07 billion (or 48.78%) when compared with their
three quarter year projections. However, as has been the trend in recent
years, we expect revenue collection in these categories to improve in the last
quarter of the year.

15
Table 3.1: Net Distributable Revenue as at September, 2013 (Oil Revenue at Benchmark Assumptions)
Source: OAGF and Budget Office of the Federation
Annual Quarterly 3QTRS First
Quarter
Second
Quarter
Third
Quarter
3QTRS
A OIL REVENUE N'bn N'bn N'bn N'bn N'bn N'bn N'bn N'bn % N'bn % N'bn %
1 Crude Oil Sales 4,243.90 1,060.98 3,182.93 724.84 764.52 719.35 2,208.71 (341.63) (32.20) (45.17) (5.91) (974.22) (30.61)
2Gas Sales (NLNG Feedstock slaes &
Upstream Liquid Gas)359.58 89.90 269.69 64.00 74.75 61.84 200.59 (28.06) (31.21) (12.91) (17.27) (69.10) (25.62)
3 Royalties Oil & Gas 761.08 190.27 570.81 216.01 247.48 220.96 684.45 30.69 16.13 (26.53) (10.72) 113.64 19.91
4 Rent 0.88 0.22 0.66 0.10 0.03 0.03 0.15 (0.19) (87.49) (0.00) (7.91) (0.51) (76.91)
5 Gas Flared Penalty 2.48 0.62 1.86 1.12 1.05 0.55 2.72 (0.07) (10.64) (0.50) (47.19) 0.86 46.14
6 PPT & Gas Tax @CITA 2,363.15 590.79 1,772.36 814.22 725.57 619.41 2,159.21 28.62 4.85 (106.16) (14.63) 386.84 21.83
7 Other Oil and Gas Revenue 3.07 0.77 2.30 0.38 0.36 0.65 1.39 (0.12) (15.07) 0.29 82.27 (0.92) (39.88)
8 Sub-Total 7,734.15 1,933.54 5,800.61 1,820.65 1,813.76 1,622.79 5,257.21 (310.74) (16.07) (190.97) (10.53) (543.40) (9.37)
9 Joint Venture Cash Calls 1,182.33 295.58 886.75 284.92 286.51 285.91 857.34 (9.67) (3.27) (0.60) (0.21) (29.41) (3.32)
10Domestic Fuel Subsidy (NNPC) and
Marketers971.14 242.78 728.35 - - - - (242.78) (100.00) - (728.35) (100.00)
11 Under Remittance of Funds by NNPC - - - - - - - - -
12 Oil Excess Revenue - - 22.35 - - 22.35 - - 22.35
13 Subt-Total 5,580.68 1,395.17 4,185.51 1,513.39 1,527.25 1,336.88 4,377.52 (58.29) (4.18) (190.37) (12.46) 192.01 4.59
14 Transfer to Excess Crude Account - - 400.92 273.15 181.34 855.40 181.34 (91.81) (33.61) 855.40
15 Balance of Oil Revenue 5,580.68 1,395.17 4,185.51 1,112.46 1,254.11 1,155.55 3,522.12 (239.62) (17.18) (98.56) (7.86) (663.39) (15.85)
16 13% Derivation of Net Oil Revenue 725.49 181.37 544.12 144.62 163.03 150.22 457.88 (31.15) (17.18) (12.81) (7.86) (86.24) (15.85)
17 TO FEDERATION ACCOUNT 4,855.19 1,213.80 3,641.39 967.84 1,091.07 1,005.33 3,064.24 (208.47) (17.18) (85.75) (7.86) (577.15) (15.85)
B NON-OIL REVENUE - - - - - - - - -
18 Value Added Tax (VAT) 945.28 236.32 708.96 185.53 193.64 194.41 573.58 (41.91) (17.74) 0.76 0.39 (135.38) (19.10)
19Corporate Tax, CIT, Stamp Duties &
CGT992.04 248.01 744.03 158.33 183.04 475.08 816.45 227.07 91.56 292.04 159.55 72.42 9.73
20 Customs: Import, Excise & Fees 792.95 198.24 594.71 109.94 97.26 97.44 304.64 (100.80) (50.85) 0.19 0.19 (290.07) (48.78)
21 Special Levies (Federation Account) 121.42 30.35 91.06 - - - - (30.35) (100.00) - (91.06) (100.00)
22 Sub-Total 2,851.68 712.92 2,138.76 453.80 473.94 766.93 1,694.66 54.01 7.58 292.99 61.82 (444.10) (20.76)
23 Cost of Collection and Other Deductions 151.50 37.87 113.62 21.45 21.87 33.60 76.92 (4.27) (11.28) 11.73 53.63 (36.70) (32.30)
24 Cost of Collection (VAT) 37.81 9.45 28.36 7.42 7.75 7.78 22.94 (1.68) (17.73) 0.03 0.41 (5.42) (19.10)
25 4% Cost of Collection (CIT) 39.68 9.92 29.76 6.33 7.32 19.00 32.66 9.08 91.56 11.68 159.60 2.90 9.73
267% Cost of Collection (Customs and
Special Levies)64.01 16.00 48.00 7.70 6.81 6.82 21.32 (9.18) (57.37) 0.01 0.21 (26.68) (55.58)
27 FIRS Tax Refunds 10.00 2.50 7.50 - - - - (2.50) (100.00) - (7.50) (100.00)
28 TO FEDERATION ACCOUNT (NON-OIL) 1,792.72 448.18 1,344.54 254.24 266.17 546.70 1,067.11 98.52 21.98 280.53 105.39 (277.43) (20.63)
29 Total VAT Pool 907.47 226.87 680.60 178.11 185.90 186.63 550.64 (40.24) (17.74) 0.73 0.39 (129.96) (19.10)
30 Net Non-Oil Revenue 2,700.18 675.05 2,025.14 432.35 452.07 733.33 1,617.74 58.28 8.63 281.26 62.22 (407.39) (20.12)
31 Sub-Total: FEDERATION ACCOUNT 6,647.91 1,661.98 4,985.93 1,222.08 1,357.24 1,552.02 4,131.35 (109.95) (6.62) 194.78 14.35 (854.58) (17.14)
32Balances in Special Account End of
Previous Year 20128.13 2.03 6.10 - - - - (2.03) (100.00) - (6.10) (100.00)
33 TOTAL FEDERATION ACCOUNT 6,656.03 1,664.01 4,992.03 1,222.08 1,357.24 1,552.02 4,131.35 (111.98) (6.73) 194.78 14.35 (860.68) (17.24)
C TOTAL DISTRIBUTION - - - - - - - - -
1 Federation Account 6,656.03 1,664.01 4,992.03 1,222.08 1,357.24 1,552.02 4,131.35 (111.98) (6.73) 194.78 14.35 (860.68) (17.24)
2 VAT Pool Account 907.47 226.87 680.60 178.11 185.90 186.63 550.64 (40.24) (17.74) 0.73 0.39 (129.96) (19.10)
3 GRAND TOTAL 7,563.50 1,890.88 5,672.63 1,400.19 1,543.14 1,738.65 4,681.99 (152.22) (8.05) 195.51 12.67 (990.64) (17.46)
BUDGETS/NO 3RD Quarter Actual Vs
Quarterly Budget
3RD Quarter Vs 2ND
Quarter (Actual)
Actual Vs Budget
(3QTRS)
ACTUAL VARIANCEITEMS
16
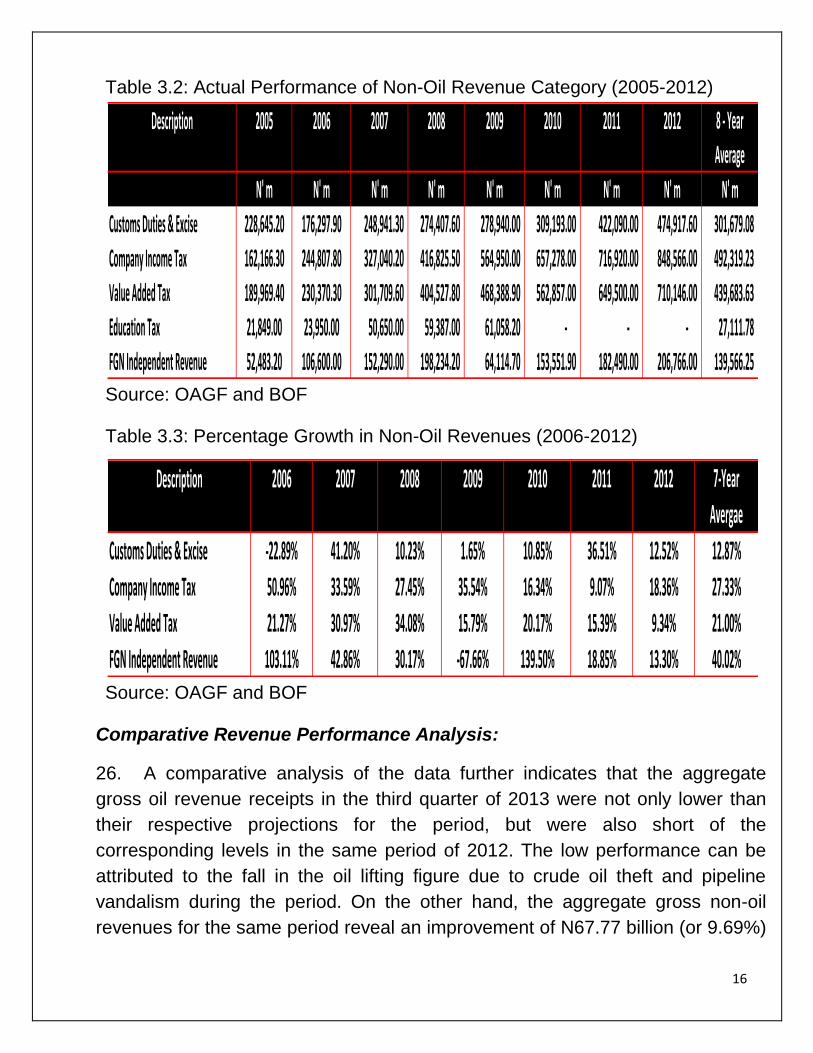
Table 3.2: Actual Performance of Non-Oil Revenue Category (2005-2012)
Source: OAGF and BOF
Table 3.3: Percentage Growth in Non-Oil Revenues (2006-2012)
Source: OAGF and BOF
Comparative Revenue Performance Analysis:
26. A comparative analysis of the data further indicates that the aggregate
gross oil revenue receipts in the third quarter of 2013 were not only lower than
their respective projections for the period, but were also short of the
corresponding levels in the same period of 2012. The low performance can be
attributed to the fall in the oil lifting figure due to crude oil theft and pipeline
vandalism during the period. On the other hand, the aggregate gross non-oil
revenues for the same period reveal an improvement of N67.77 billion (or 9.69%)
Description 2005 2006 2007 2008 2009 2010 2011 2012 8 - Year
Average
N' m N' m N' m N' m N' m N' m N' m N' m N' m
Customs Duties & Excise 228,645.20 176,297.90 248,941.30 274,407.60 278,940.00 309,193.00 422,090.00 474,917.60 301,679.08
Company Income Tax 162,166.30 244,807.80 327,040.20 416,825.50 564,950.00 657,278.00 716,920.00 848,566.00 492,319.23
Value Added Tax 189,969.40 230,370.30 301,709.60 404,527.80 468,388.90 562,857.00 649,500.00 710,146.00 439,683.63
Education Tax 21,849.00 23,950.00 50,650.00 59,387.00 61,058.20 - - - 27,111.78
FGN Independent Revenue 52,483.20 106,600.00 152,290.00 198,234.20 64,114.70 153,551.90 182,490.00 206,766.00 139,566.25
Description 2006 2007 2008 2009 2010 2011 2012 7-Year
Avergae
Customs Duties & Excise -22.89% 41.20% 10.23% 1.65% 10.85% 36.51% 12.52% 12.87%
Company Income Tax 50.96% 33.59% 27.45% 35.54% 16.34% 9.07% 18.36% 27.33%
Value Added Tax 21.27% 30.97% 34.08% 15.79% 20.17% 15.39% 9.34% 21.00%
FGN Independent Revenue 103.11% 42.86% 30.17% -67.66% 139.50% 18.85% 13.30% 40.02%

17
above the corresponding figures recorded in 2012. Please see data below in
Table 3.4
Table 3.4: Performance of Revenue in the Third Quarter of 2013 Vs 2012
Source: OAGF and Budget Office of the Federation
Chart 3.1: 2012 Vs 2013 Revenue Performance (Third Quarter)
Source: OAGF and Budget Office of the Federation
27. Chart 3.2 below is a graphical illustration of the actual performance of
revenue categories compared to their budgeted estimates as at September 2013.
3rd Quarter
Actual
3rd Quarter
Actual
Oil Revenue N bns N bns N bns %
Crude Oil Sales 741.92 719.35 -22.57 -3.04
Petroleum Profit Tax (PPT) 824.82 619.41 -205.41 -24.90
Royalties 276.45 220.96 -55.49 -20.07
Gross Oil Revenue 1,913.30 1,622.79 -290.51 -15.18
Net Oil Receipts 868.39 1,005.33 136.94 15.77
Non-Oil Revenue
Value Added Tax (VAT) 173.57 194.41 20.84 12.01
Company Income Tax (CIT) 398.65 475.08 76.43 19.17
Customs & Excise Duties 126.94 97.44 -29.50 -23.24
Gross Non-Oil Revenue 699.16 766.93 67.77 9.69
Net Non-Oil Receipts 667.39 733.33 65.94 9.88
Revenue Items 3rd Quarter 2013 Vs 3rd
Quarter 2012
Variance2012 2013
0.00
100.00
200.00
300.00
400.00
500.00
600.00
700.00
800.00
900.00
Crude Oil Sales Petroleum ProfitTax (PPT)
Royalties Value Added Tax(VAT)
Company IncomeTax (CIT)
Customs & ExciseDuties
Reve
nue
in B
illio
n N
aira
2012 Third Quarter Actual 2013 Third Quarter Actual

18
Chart 3.2: Projected Vs Actual FAAC Revenue Receipts (as at September 2013)
Source: Budget Office of the Federation
Distributable Revenue:
28. The net distributable revenue is the balance of funds in the Federation
Account available for distribution among the three tiers of government after
taking out all costs and statutory deductions. A net sum of N1,738.65 billion was
available for sharing in the third quarter of 2013. This implies a shortfall of
N152.22 billion (or 8.05%).
29. Chart 3.3 below presents the percentage contribution of the various
revenue categories to distributable revenue in the third quarter of 2013.
Chart 3.3: Contributions to Distributable Revenue (in the 3rd Quarter of 2013)
Source: Budget Office of the Federation
0.00
500.00
1,000.00
1,500.00
2,000.00
2,500.00
3,000.00
3,500.00
4,000.00
Crude Oil & Gas Sales Oil Taxes & Others Non-Oil Taxes
Reve
nue
Rece
ipts
(in
N'B
illio
n)
Revenue Category
Budget
Actual
Oil Revenue58%
Value Added Tax11%
Company Income Tax26%
Customs & Excise Duties
5%

19
3.3 FGN Budget Revenue
30. In line with the approved 2013 Budget framework, the sum of N4,100.18
billion was projected to fund the Federal Budget implying a quarterly share of
N1,025.05 billion. In the third quarter of 2013, the sum of N487.58 billion received
from oil sources was lower than the quarterly estimate of N588.69 billion by
N101.11 billion (or 17.18%). With the exception of Company Income Tax of
N221.2 billion which was above its quarterly estimate of N114.26 billion by
N106.94 billion (or 93.59%) other non-oil revenue items fell below their quarterly
projections. FGN share of VAT of N26.13 billion and Customs & Excise Duties of
N43.95 billion were short of their respective quarterly projections of N31.76 billion
and N103.11 billion by N5.63 billion (or 17.74%) and N59.16 billion (or 57.37%).
The foregoing followed the same pattern of their respective performances at the
Federation Account level. The data are presented below in Table 3.5.
Chart 3.4: FGN Revenue (Budget Vs Actual as at September2013)
Source: The OAGF and Budget Office of the Federation
0.00
200.00
400.00
600.00
800.00
1,000.00
1,200.00
1,400.00
1,600.00
1,800.00
2,000.00
Oil Revenue Company Income Tax
Value Added Tax
Customs & Excise Duties
Independent Revenue
Am
ou
nt
in B
illio
n N
aira
Revenue Category
Budget
Actual

21
Table 3.5: Inflows to the 2013 Federal Budget as at September 2013
Source: Budget Office of the Federation and the OAGF
Annual
Quarterly 3QTRS
First
Quarter
Second
Quarter
Third
Quarter 3QTRS
Inflow for the Federal Budget N'bn N'bn N'bn N'bn N'bn N'bn N'bn N'bn % N'bn % N'bn %
1 FGN Share of Oil Revenue 2,354.77 588.69 1,766.08 469.40 529.17 487.58 1,486.16 (101.11) (17.18) (41.59) (7.86) (279.92) (15.85)
2 FGN Share of Non-Oil Revenue 1,000.45 250.11 750.34 148.24 155.12 291.28 594.64 41.16 16.46 136.16 87.78 (155.71) (20.75)
3 FGN Share of Value Added Tax
(VAT) 127.05 31.76 95.28 24.94 26.03 26.13 77.09 (5.63) (17.74) 0.10 0.39 (18.19) (19.10)
4 FGN Share of Customs Duty 412.42 103.11 309.32 49.59 43.87 43.95 137.41 (59.16) (57.37) 0.08 0.19 (171.91) (55.58)
5 FGN Share of Company Income
Tax (CIT) 457.04 114.26 342.78 73.72 85.22 221.20 380.14 106.94 93.59 135.97 159.55 37.36 10.90
6 FGN Share of Actual Balances in
Special Account 3.94 0.99 2.96 - - - - (0.99) (100.00) - (2.96) (100.00)
7 FGN Independent Revenue 455.78 113.95 341.84 65.03 17.18 150.47 232.67 36.52 32.05 133.29 775.95 (109.17) (31.93)
8 FGN Balances of Special
Accounts as at 31/12/12 28.02 7.01 21.02 - 21.00 - 21.00 (7.01) (100.00) (21.00) (100.00) (0.02) (0.07)
9 Unspent Balance from Previous
Fiscal Year 261.21 65.30 195.91 22.86 0.06 0.20 23.12 (65.10) (99.70) 0.14 242.21 (172.79) (88.20)
10 Sub-Total 4,100.23 1,025.06 3,075.18 705.53 722.52 929.53 2,357.58 (95.53) (9.32) 207.00 28.65 (717.60) (23.34)
11 Other Financing Sources - 139.99 156.33 31.65 327.97 31.65 (124.68) (79.76) 327.97
12 Augmentation of Shortfall - - - 74.71 91.03 31.65 197.39 31.65 (59.39) (65.24) 197.39
13 Excess Crude Account Special
Distribution - - - 65.29 65.30 - 130.59 - (65.30) (100.00) 130.59
14 Total Revenue Available for
Implementation 4,100.23 1,025.06 3,075.18 845.52 878.85 961.17 2,685.55 (63.89) (6.23) 82.32 9.37 (389.63) (12.67)
S/NO
BUDGET
3RD Quarter Actual Vs
Quarterly Budget
3RD Quarter Vs 2ND
Quarter (Actual)
Actual Vs Budget
(3QTRS)
ACTUAL VARIANCE
ITEMS

21
31. A total of N929.53 billion, excluding other funding sources, was received in
the third quarter of 2013. This amount was N95.53 billion (or 9.32%) lower than
the quarterly projection of N1,025.06 billion and N207 billion (or 28.65%) higher
than the actual receipt of N722.52 billion recorded in the second quarter of 2013.
However, the aggregate revenue in the third quarter of 2013 was N205.01 billion
(or 28.3%) higher than the N724.52 billion recorded in the third quarter of 2012.
Chart 3.5: Contributions to the FGN Budget Revenue in the Third Quarter of 2013 (Excluding
FGN’s Unspent Balances and FGN’s Balances in Special Accounts)
Source: The OAGF and Budget Office of the Federation
3.4 Excess Crude Account
32. The Excess Crude Account (ECA) was set up to serve as a stabilization
and savings account. Inflows into the ECA in the third quarter of 2013 amounted
to N181.34 billion. The inflow in the third quarter was N91.81 billion (or 33.61%)
and N363.74 billion (or 66.73%) lower than the N273.15 billion and N545.08
billion recorded in the second quarter of 2013 and third quarter of 2012
respectively.
Oil and Gas Revenue52%
Value Added Tax3%
Company Income Tax
24%
Customs & Excise Duties
5%
Independent Revenue
16%

22
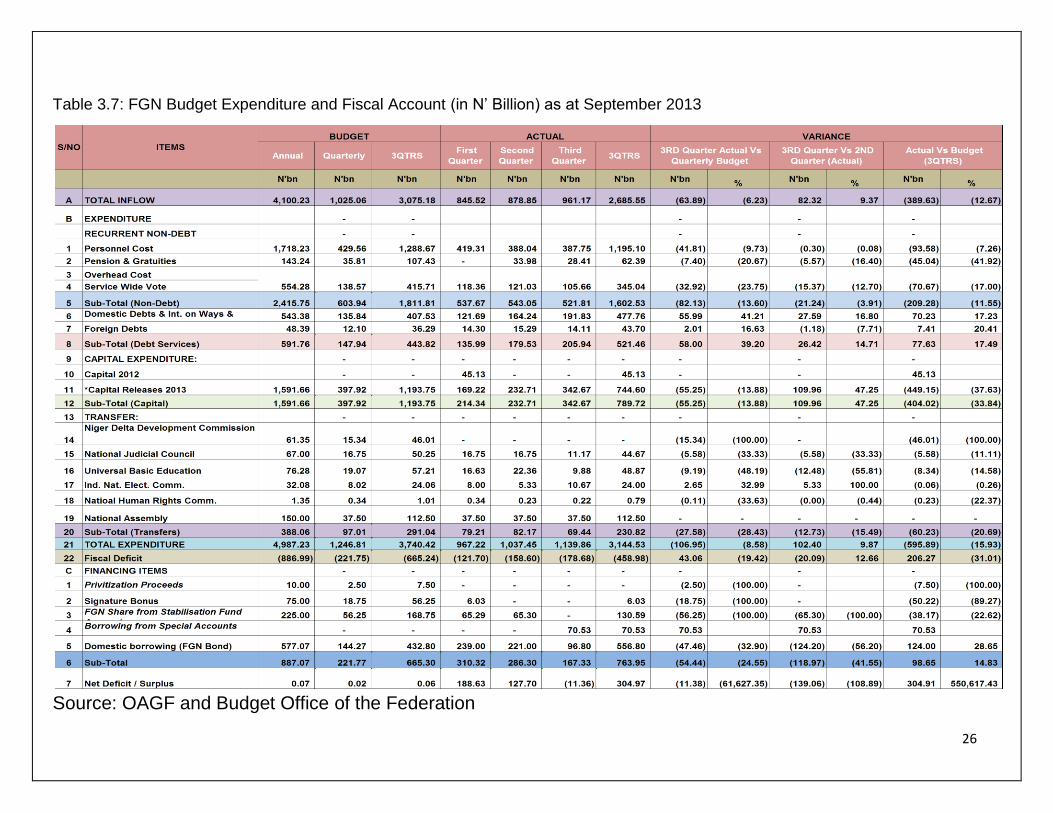
3.5 Expenditure Developments
33. A total of N5,260.72 billion was appropriated for expenditure in the 2013
Amended Budget. Of this amount, N4,987.22 billion was for the regular budget
for 2013 while N273.5 billion was for the implementation of social safety net and
specific infrastructure projects and programmes under the Subsidy Reinvestment
and Empowerment Programme (SURE-P). The regular budget for 2013 is made
up of N2,415.75 billion (or 48.44%) for recurrent (non-debt) expenditure, N591.76
billion (or 11.87%) for debt service, N388.05 billion (or 7.78%) for Statutory
Transfers and N1,591.66 billion (or 31.91%) for Capital expenditure.
3.5.1 Non-Debt Recurrent Expenditure
34. In crafting the 2013 Budget, Government kept focus on its plan to
strategically check the growth of recurrent expenditures as indicated in the 2013-
2015 Fiscal Framework and Fiscal Strategy Paper. To achieve this, government
was resolute in cutting down the cost of governance. As such, the share of
recurrent spending in total expenditure was reduced from 74.4% in 2011 to
68.09% in 2013. In addition, the government hopes to continue the roll-out of
IPPIS across all MDAs which will eventually result to savings in personnel costs.
Chart 3.6: 2009 – 2013 Budget Expenditure Profile
Source: Budget Office of the Federation
2009
2010
201120122013
0
5000
10000
Naira
in B
illion
s
Statutory Transfers Debt Services Capital ExpenditureRecurrent (Non-Debt)
ExpenditureAggregate Expenditure
2009 168.62 283.65 1,280.71 1,824.71 3,557.69
2010 183.58 542.38 1,764.69 2,669.01 5,159.66
2011 417.83 495.1 1,146.75 2,425.07 4,484.74
2012 372.59 559.58 1,339.99 2,425.05 4,697.21
2013 387.98 591.76 1,621.48 2,386.03 4,987.24

23
35. Data from the OAGF indicates that a total of N521.81 billion was expended
on non-debt recurrent expenditure in the third quarter of 2013. This amount
represents a decrease of N82.13 billion (or 13.6%) from the quarterly estimate of
N603.94 billion.
Chart 3.7: Personnel, Overhead and Capital Expenditure Trends (2008 – 2013)
Source: BOF and OAGF
3.5.2 Debt Service
36. Provisional data from the Debt Management Office (DMO) show that as at
30th September 2013, the Federal Government domestic debt stock stood at
N7,032.88 billion depicting an increase of N182.13 billion (or 2.66%) over the
N6,850.75 billion recorded in the second quarter of 2013; and also exceeds the
N6,346.04 billion reported in the same period of 2012 by N686.84 billion (or
10.82%). A breakdown of the domestic debt stock as at 30thSeptember indicates
that N4,215.04 billion (or 59.93%) is for FGN Bonds, N2,483.29 billion (or
35.31%) is for Nigeria Treasury Bills (NTBs) and N334.56 billion (or 4.76%) is for
Treasury Bonds. The rise in domestic debt in the third quarter can be attributed
to the issuance of additional Federal Government Bonds. The sum of N191.83
billion was released for domestic debt servicing in the third quarter of 2013 while
2008 Budget
2009 Budget
2010 Budget
2011 Budget
2012 Budget
2013 Budget
Personnel Costs (MDAs) 29.88% 24.08% 28.66% 40.01% 33.89% 3.37%
Capital Spending 29.66% 36.00% 34.20% 25.57% 27.47% 21.01%
Overheads 12% 27.20% 23.06% 14.07% 5.57% -15.94%
Recurrent (Non Debt) 41.88% 51.28% 51.72% 54.07% 49.72% -1.62%
-40.00%
-20.00%
0.00%
20.00%
40.00%
60.00%
80.00%
100.00%
Perc
enta
ge o
f agg
rega
te s
pend
ing

24
the actual domestic debt payment was N163.47 billion. The sum of N27.63 billion
(or 20.34%) difference between the quarterly budgeted estimate of N135.84
billion for domestic debt services and the actual domestic debt services was
mainly due to additional issues of FGN Bonds above the amount projected to be
issued as a result of changes in the issuance calendar and the rising cost of
rolling over NTBs.
37. Nigeria’s external debt stock (mostly low interest funds from multilateral
financial institutions) as at 30th September, 2013, stood at US$8,264.34 million
representing an increase of US$1,344.24 million (or 19.43%) and US$1,968.17
million (or 31.26%) over the US$6,920.1 million and US$6,296.17 million
recorded in the second quarter of 2013 and the third quarter of 2012 respectively.
The increase was due mainly to the increases in multilateral and ICM (Euro-
Bond) debt drawdown. A breakdown of the external debt stock in the third quarter
of 2013 indicates that Multilateral Debts amounted to US$5,887.1 million
(71.23%), Non-Paris Club Bilateral Debts amounted to US$850.42 million (or
10.29%) while Commercial and ICM (Euro-Bond) accounted for the balance of
US$1,526.82 million (or 18.47%).
38. The actual external debt service payment in the third quarter of the year
amounted to US$95.67 million. A breakdown of the payments indicated that
US$47.64 million (or 49.8%) was to Multilateral Creditors, US$21.41 million (or
22.38%) was to Non-Paris Bilateral Creditors and US$26.62 million (or 27.82%)
was to Commercial and ICM (Euro-Bond) Creditor.
39. The total public debt stock as at 30th September 2013 stood at US$53.42
billion (or N8.32 trillion). The breakdown consists of US$8.26 billion (or N1.29
trillion or 15.5%) for external debt while the balance of US$45.15 billion (or N7.03
trillion or 84.5%) was for domestic debt stock. The total net value of Debt/GDP
(external and domestic) ratio as at the end of September 2013 was significantly
below the global threshold of 40%.
26
Table 3.7: FGN Budget Expenditure and Fiscal Account (in N’ Billion) as at September 2013
Source: OAGF and Budget Office of the Federation

27
3.5.3 Statutory Transfers:
40. In the third quarter of 2013, a total of N69.44 billion was released as
statutory transfers. A breakdown of the actual transfers in the third quarter
reveals that N11.17 billion was to National Judicial Council, N9.88 billion was to
the Universal Basic Education Commission (UBEC), N10.67 billion was to
Independent National Electoral Commission, N0.22 billion was to National
Human Right Commission and N37.5 billion was to the National Assembly. It is
noteworthy that quarterly releases under this subhead are made on demand by
the beneficiaries subject to budgetary provisions.
3.5.4 Capital Expenditure Performance
41. In preparing the Budget, the government continued its policy of re-
balancing its expenditure in favour of capital investment over the medium term.
As such, capital spending as a share of total expenditure has increased from
25.6% in 2011 to 31.91% in 2013. In 2013, the Government focused on critical
economic and social sectors. Some key allocations were made as follows:
Critical infrastructure (including Power, Works, Transport, Aviation, Gas Pipeline
and Federal Capital Territory) – N497 billion; Human Capital Development (i.e.
Education and Health) – N705 billion; Agriculture /Water Resources – N175
billion and over N950 billion for national security purposes comprising of N320
billion for the Police, N364 billion for the Armed Forces, N115 billion for the
Office of the National Security Adviser (NSA) and N154 billion for the Ministry of
Interior.
MDAs’ Capital Vote Utilization:
42. Data from the OAGF reveals that as at 30th September, 2013, a total of
N807.87 billion had been released and cash-backed through the First Quarter
Development Capital Warrant of N210.48 billion, Second Quarter Development
Capital Warrant of N168.27 billion, Third Quarter Development Capital Warrant of
N147.33 billion and Authority to Incur Expenditure (AIEs) of N281.78 billion for
the implementation of MDAs capital projects/programmes as contained in the
2013 Appropriation Act. It is important to note that the first and second quarter
capital warrants were released before the conclusion and approval by the
National Assembly of the 2013 Amended Budget.

28
Performance as at 30thSeptember, 2013
43. The data also show that N545.87 billion (or 67.57%) of the total amount
cash-backed had been utilized by MDAs as at 30th September 2013. Appendix 1
to this Report shows the funds released to and utilized by MDAs in the period. An
analysis of fifty (50) MDAs reported upon by the Office of the Accountant-General
of the Federation OAGF reveals varying levels of utilization among the MDAs.
Eight (or 16%) of the MDAs including: Presidency, Police Affairs, Works, National
Planning, National Sports Commission, Office of National Security Adviser, Niger
Delta and Special Duties had utilized more than the overall average utilization
rate of 67.57% of the amount cash-backed. Six out of these, including National
Sports Commission, Presidency, Police Affairs, Office of National Security
Adviser, Niger Delta and Special Duties had utilized over 70% of their respective
cash-backed funds.
44. The utilization report also shows that 21 MDAs (or 42%), which include
Agriculture, Water Resources, Defence, Education, Head of Service, Aviation,
Youth Development, Finance, Health, Mines & Steel, Communication
Technology, Presidency, Police Affairs, Works, National Planning, National
Sports Commission, Office of National Security Adviser, Niger Delta and Office
for Special Duties had utilized above 50% of their cash-backed funds. Twenty
nine (or 58%) of MDAs including Women Affairs, Office of the Secretary to
Government of the Federation, Office of the Auditor-General of the Federation,
ICPC, Trade & Investment, Power, Information, Interior, Justice, Science &
Technology, Transport, Petroleum, Housing, Environment, Code of Conduct
Bureau, FCSC, Federal Character Commission, Police Service Commission and
Public Complaint Commission had a utilization rate of less than 50%. Table 3.8
below is an extract from Appendix 1 highlighting the utilization rates of ten
selected MDAs.
45. In addition to the regular budget, an extra provision of N273.5 billion (N180
billion as additional revenue and N93.5 billion as carryover of outstanding
provisions from 2012 budget)was made for major capital and social programmes
under the SURE-P window, and this assisted in the area of infrastructure
development in the third quarter of 2013.A total of N227.55 billion (or 83.2%) of

29
the appropriated sum was released while N119.65 billion (or 52.58%) of the
released amount was utilized as at 30thSeptember, 2013.
Table 3.8: A Sample of MDAs’ Capital Budget Utilization (as at 30thSept. 2013)
Source: OAGF and BOF
Chart 3.8: Pictorial Representation of Selected MDAs Utilization
Source: BOF and OAGF
Annual
Appropriation
Total Amount
Released
Total Amount
Cash Backed
N N N N As % of Annual
Capital
Appropriation
As % of Cash
Backed Funds
As % of
Budgetary
Releases
Power 73,347,958,463 39,162,517,048 39,162,517,048 16,884,838,682 23.02 43.11 43.11
Transport 44,527,673,725 19,575,445,044 19,575,445,044 9,022,995,694 20.26 46.09 46.09
Health 60,047,469,275 28,838,439,775 28,838,439,775 19,108,867,982 31.82 66.26 66.26
Agriculture 50,727,871,428 20,419,251,358 20,419,251,358 11,938,302,349 23.53 58.47 58.47
Water Resources 80,306,966,365 26,862,139,301 26,862,139,301 15,536,278,736 19.35 57.84 57.84
Education 71,230,438,355 29,870,164,921 29,870,164,921 15,940,847,953 22.38 53.37 53.37
Works 164,661,148,188 63,593,280,261 63,593,280,261 44,487,966,309 27.02 69.96 69.96
Niger Delta 62,399,922,222 25,563,253,618 25,563,253,618 18,692,383,982 29.96 73.12 73.12
FCTA 56,600,000,000 23,799,218,838 23,799,218,838 16,532,213,570 29.21 69.47 69.47
Police Formation &
Commands
14,096,000,000 6,822,113,291 6,822,113,291 3,805,852,375 27.00 55.79 55.79
34.3 67.57 67.57
Utilization
Total Average Utilization (by all MDAs)
MDA
-
10
20
30
40
50
60
70
80
-
20,000,000,000
40,000,000,000
60,000,000,000
80,000,000,000
100,000,000,000
120,000,000,000
140,000,000,000
160,000,000,000
180,000,000,000
Power Transport Health Agriculture Water Resources
Education Works Niger Delta FCTA Police Formation
&
Commands
Perc
enta
ge U
tiliz
atio
n
Am
ount
in N
aira
Sampled MDAs
Annual Appropriation Total Amount Released Total Amount Cash Backed Utilization Percentage Utilization

30
3.5.5 Performance of the Financing Items:
46. The 2013 Fiscal Framework portrays a quarterly deficit of N221.77 billion to
be financed through privatization proceeds of N2.5 billion, signature bonus of
N18.75 billion, FGN’s share from the Stabilization Fund Account of N56.25 billion
and domestic borrowing (FGN Bond) of N144.27 billion.
47. In the third quarter, a total of N167.33 billion was realized from financing
item sources implying a shortfall of N54.44 billion (or 24.55%) below the
quarterly estimate of N221.77 billion as some of the items, such as signature
bonus did not materialize.
31
4.0 CONCLUSION
acroeconomic indicators from the NBS for the third quarter indicate
resilience of the domestic economy. The real GDP grew by 6.81% for
the third quarter of 2013, an improvement over the 6.48% recorded
for same period in 2012.The non-oil sector remained the main driver of growth
with a contribution of 7.95% as against the decline year-on-year of 0.53% by
the oil sector. In spite of the economic challenges, the country’s external
remained at a sustainable level of about US$44.11 billion.
49. Provisional data from the OAGF shows that a net distributable sum of
N1,738.65 billion accrued to the Federation Account for distribution among the
three tiers of government in the quarter, indicating a shortfall of about N152.22
billion when compared with N1,890.88 billion estimated for the quarter. This
follows from the shortfall in oil revenue by N208.47 billion - arising mainly from
lower oil lifting due to crude oil theft and pipeline vandalism. Largely resulting
from this situation, implementation of the federal budget in the quarter was
underfunded by about N95.53 billion (or 9.32%) when compared with the
estimate of N1,025.06 billion.
50. The implementation of recurrent expenditures in the third quarter
remained largely on track. A total of N807.87 billion out of the N1,193.75 billion
projected for capital budget implementation in the year-to-date had been
released to MDAs as at September 2013. Of this amount, N807.86 billion had
been cash-backed while N545.87 billion (or 67.57%) had been utilized by the
MDAs as at 30th September 2013.
51. This provisional Report is focused on presenting the macroeconomic
environment under which the Budget was implemented in the quarter. It also
provides a financial analysis of the Budget’s implementation in the year to date.
In collaboration with MDAs, Civil Society Organizations and representatives of
media organizations, the Budget Office of the Federation embarked on physical
monitoring and evaluation of selected capital projects for the quarter. Their
findings will be consolidated with this Report and published in due course.
M