third quarter 2017 results - liberty mutual quarter 2017 results 2 cautionary statement regarding...
TRANSCRIPT

1
November 2, 2017
Third Quarter 2017 Results
2
Cautionary Statement Regarding Forward Looking Statements
This report contains forward looking statements that are intended to enhance the reader’s ability to assess the future financial and business
performance of Liberty Mutual Holding Company Inc., the parent corporation of the Liberty Mutual Insurance group of entities (the "Company" or
"LMHC"). Forward looking statements include, but are not limited to, statements that represent the Company’s beliefs concerning future
operations, strategies, financial results or other developments, and contain words and phrases such as “may,” “expects,” “should,” “believes,”
“anticipates,” “estimates,” “intends” or similar expressions. Because these forward looking statements are based on estimates and assumptions
that are subject to significant business, economic and competitive uncertainties, many of which are beyond the Company’s control or are
subject to change, actual results could be materially different.
Some of the factors that could cause actual results to differ include, but are not limited to the following: the occurrence of catastrophic events
(including terrorist acts, hurricanes, hail, tornados, tsunamis, earthquakes, floods, snowfall and winter conditions); inadequacy of loss reserves;
adverse developments involving asbestos, environmental or toxic tort claims and litigation; adverse developments in the cost, availability or
ability to collect reinsurance; disruptions to the Company’s relationships with its independent agents and brokers; financial disruption or a
prolonged economic downturn; the performance of the Company’s investment portfolios; a rise in interest rates; risks inherent in the Company’s
alternative investments in private limited partnerships (“LP”), limited liability companies (“LLC”), commercial mortgages and natural resource
working interests; difficulty in valuing certain of the Company’s investments; subjectivity in the determination of the amount of impairments taken
on the Company’s investments; unfavorable outcomes from litigation and other legal proceedings, including the effects of emerging claim and
coverage issues and investigations by state and federal authorities; the Company’s exposure to credit risk in certain of its business operations;
the Company’s inability to obtain price increases or maintain market share due to competition or otherwise; inadequacy of the Company’s
pricing models; changes to insurance laws and regulations; changes in the amount of statutory capital that the Company must hold to maintain
its financial strength and credit ratings; regulatory restrictions on the Company’s ability to change its methods of marketing and underwriting in
certain areas; assessments for guaranty funds and mandatory pooling arrangements; a downgrade in the Company’s claims-paying and
financial strength ratings; the ability of the Company’s subsidiaries to pay dividends to the Company; inflation, including inflation in medical
costs and automobile and home repair costs; the cyclicality of the property and casualty insurance industry; political, legal, operational and
other risks faced by the Company’s international business; potentially high severity losses involving the Company’s surety products; loss or
significant restriction on the Company’s ability to use credit scoring in the pricing and underwriting of personal lines policies; inadequacy of the
Company’s controls to ensure compliance with legal and regulatory standards; changes in federal or state tax laws; risks arising out of the
Company’s securities lending program; the Company’s utilization of information technology systems and its implementation of technology
innovations; difficulties with technology or data security; insufficiency of the Company’s business continuity plan in the event of a disaster; the
Company's ability to successfully integrate operations, personnel and technology from its acquisitions; insufficiency of the Company’s enterprise
risk management models and modeling techniques; and changing climate conditions. The Company’s forward looking statements speak only as
of the date of this report or as of the date they are made and should be regarded solely as the Company’s current plans, estimates and beliefs.
For a detailed discussion of these and other cautionary statements, visit the Company’s Investor Relations website at
www.libertymutualgroup.com/investors. The Company undertakes no obligation to update these forward looking statements.
3
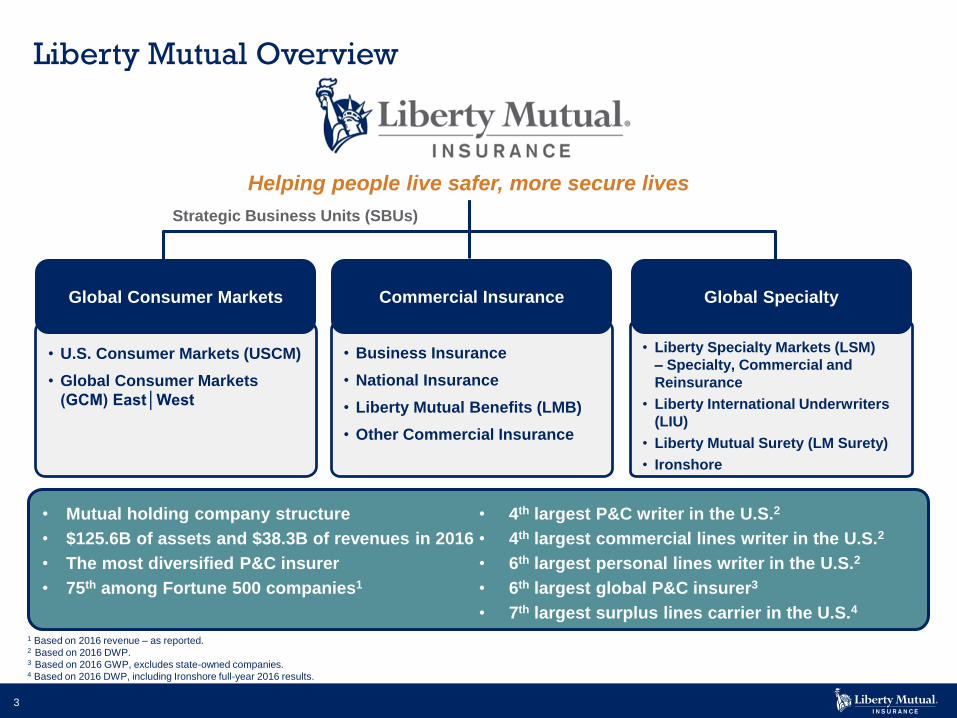
1 Based on 2016 revenue – as reported.2 Based on 2016 DWP.3 Based on 2016 GWP, excludes state-owned companies.4 Based on 2016 DWP, including Ironshore full-year 2016 results.
Strategic Business Units (SBUs)
Liberty Mutual Overview
Helping people live safer, more secure lives
• U.S. Consumer Markets (USCM)
• Global Consumer Markets
(GCM) East│West
• Liberty Specialty Markets (LSM)
– Specialty, Commercial and
Reinsurance
• Liberty International Underwriters
(LIU)
• Liberty Mutual Surety (LM Surety)
• Ironshore
• Business Insurance
• National Insurance
• Liberty Mutual Benefits (LMB)
• Other Commercial Insurance
Global Consumer Markets Commercial Insurance Global Specialty
• Mutual holding company structure
• $125.6B of assets and $38.3B of revenues in 2016
• The most diversified P&C insurer
• 75th among Fortune 500 companies1
• 4th largest P&C writer in the U.S.2
• 4th largest commercial lines writer in the U.S.2
• 6th largest personal lines writer in the U.S.2
• 6th largest global P&C insurer3
• 7th largest surplus lines carrier in the U.S.4
4
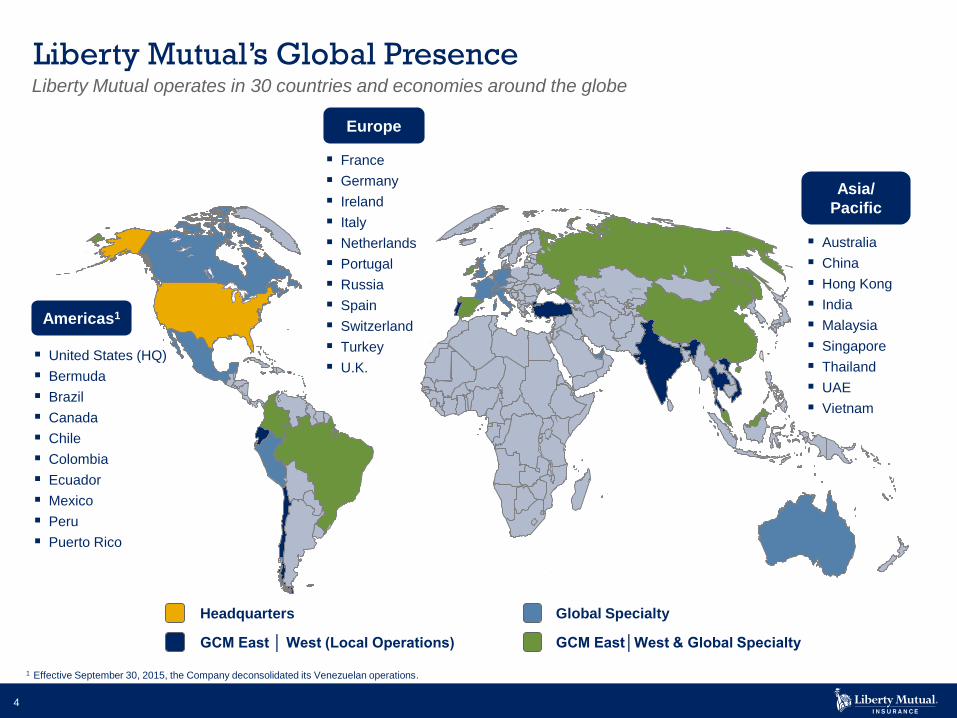
Americas1
United States (HQ)
Bermuda
Brazil
Canada
Chile
Colombia
Ecuador
Mexico
Peru
Puerto Rico
France
Germany
Ireland
Italy
Netherlands
Portugal
Russia
Spain
Switzerland
Turkey
U.K.
GCM East │ West (Local Operations)
Australia
China
Hong Kong
India
Malaysia
Singapore
Thailand
UAE
Vietnam
Global Specialty
Europe
Asia/
Pacific
Liberty Mutual’s Global Presence
Headquarters
GCM East│West & Global Specialty
1 Effective September 30, 2015, the Company deconsolidated its Venezuelan operations.
Liberty Mutual operates in 30 countries and economies around the globe
5
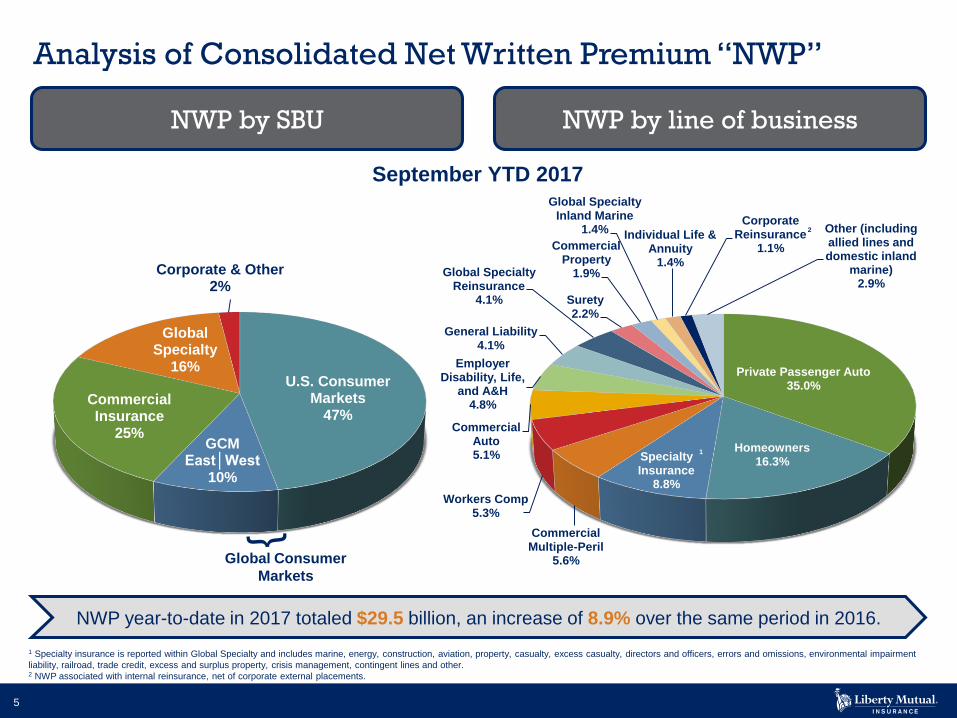
Analysis of Consolidated Net Written Premium “NWP”
U.S. Consumer Markets
47%
GCM East│West
10%
Commercial Insurance
25%
Global Specialty
16%
Corporate & Other2%
Global Consumer
Markets
NWP by SBU NWP by line of business
1 Specialty insurance is reported within Global Specialty and includes marine, energy, construction, aviation, property, casualty, excess casualty, directors and officers, errors and omissions, environmental impairment
liability, railroad, trade credit, excess and surplus property, crisis management, contingent lines and other.2 NWP associated with internal reinsurance, net of corporate external placements.
September YTD 2017
Private Passenger Auto35.0%
Homeowners16.3%Specialty
Insurance8.8%
Commercial Multiple-Peril
5.6%
Workers Comp5.3%
Commercial Auto5.1%
Employer Disability, Life,
and A&H4.8%
General Liability4.1%
Global Specialty Reinsurance
4.1% Surety2.2%
Commercial Property
1.9%
Global Specialty Inland Marine
1.4% Individual Life & Annuity
1.4%
Corporate Reinsurance
1.1%
Other (including allied lines and domestic inland
marine)2.9%
NWP year-to-date in 2017 totaled $29.5 billion, an increase of 8.9% over the same period in 2016.
1
2
6
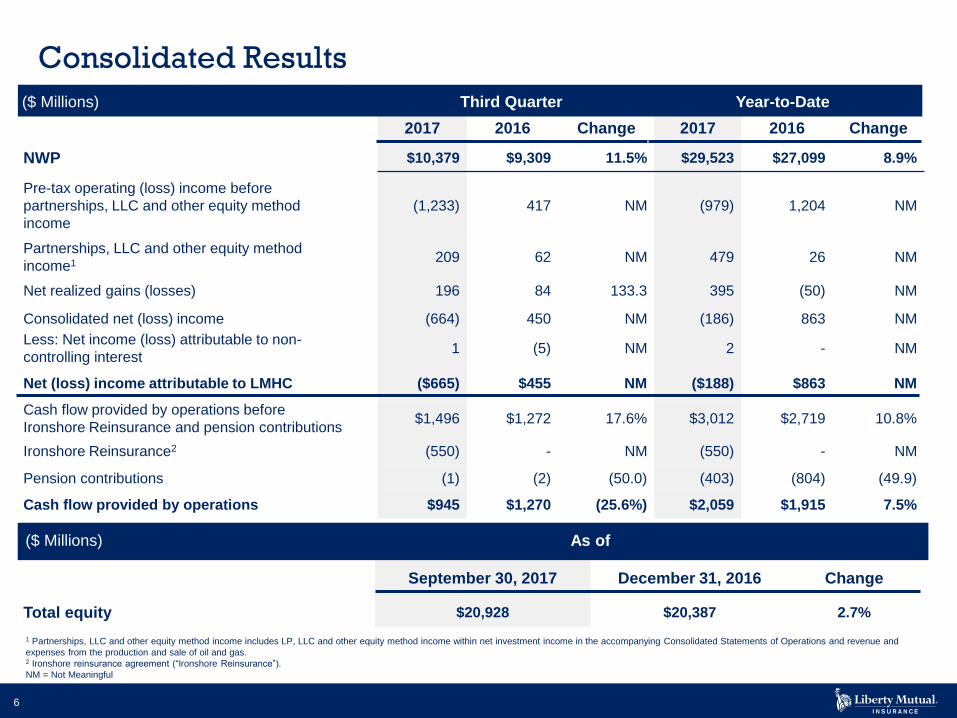
September 30, 2017 December 31, 2016 Change
Total equity $20,928 $20,387 2.7%
2017 2016 Change 2017 2016 Change
NWP $10,379 $9,309 11.5% $29,523 $27,099 8.9%
Pre-tax operating (loss) income before
partnerships, LLC and other equity method
income
(1,233) 417 NM (979) 1,204 NM
Partnerships, LLC and other equity method
income1 209 62 NM 479 26 NM
Net realized gains (losses) 196 84 133.3 395 (50) NM
Consolidated net (loss) income (664) 450 NM (186) 863 NM
Less: Net income (loss) attributable to non-
controlling interest1 (5) NM 2 - NM
Net (loss) income attributable to LMHC ($665) $455 NM ($188) $863 NM
Cash flow provided by operations before
Ironshore Reinsurance and pension contributions$1,496 $1,272 17.6% $3,012 $2,719 10.8%
Ironshore Reinsurance2 (550) - NM (550) - NM
Pension contributions (1) (2) (50.0) (403) (804) (49.9)
Cash flow provided by operations $945 $1,270 (25.6%) $2,059 $1,915 7.5%
Consolidated Results
1 Partnerships, LLC and other equity method income includes LP, LLC and other equity method income within net investment income in the accompanying Consolidated Statements of Operations and revenue and
expenses from the production and sale of oil and gas.2 Ironshore reinsurance agreement (“Ironshore Reinsurance”).
NM = Not Meaningful
Third Quarter Year-to-Date($ Millions)
($ Millions) As of
7
Fourth Quarter Full Year
2017 2016Change
(Points)2017 2016
Change
(Points)
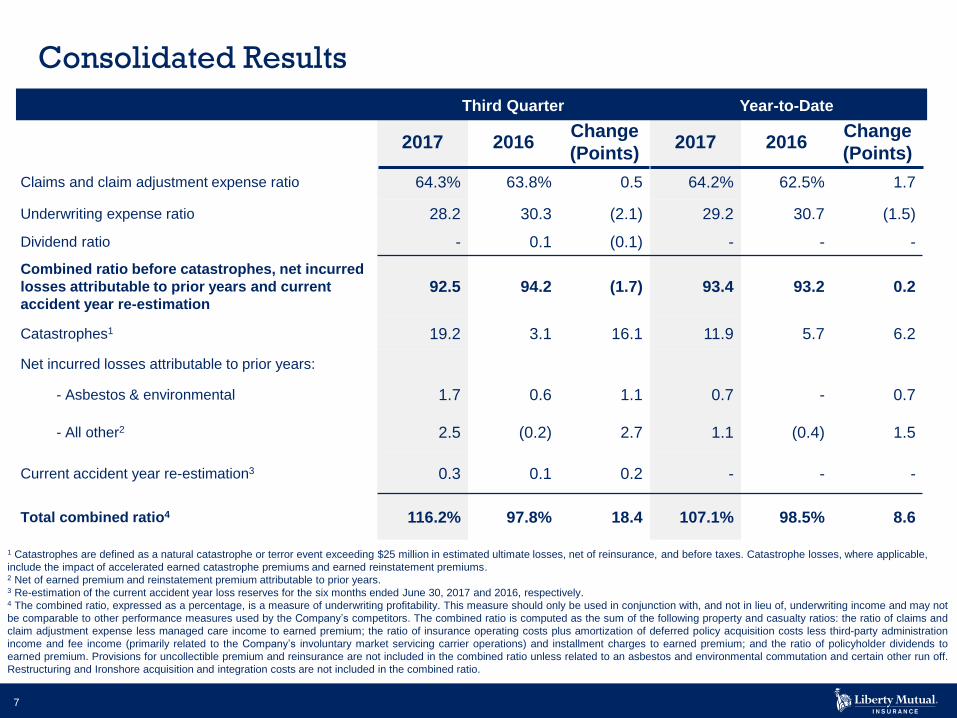
Claims and claim adjustment expense ratio 64.3% 63.8% 0.5 64.2% 62.5% 1.7
Underwriting expense ratio 28.2 30.3 (2.1) 29.2 30.7 (1.5)
Dividend ratio - 0.1 (0.1) - - -
Combined ratio before catastrophes, net incurred
losses attributable to prior years and current
accident year re-estimation92.5 94.2 (1.7) 93.4 93.2 0.2
Catastrophes1 19.2 3.1 16.1 11.9 5.7 6.2
Net incurred losses attributable to prior years:
- Asbestos & environmental 1.7 0.6 1.1 0.7 - 0.7
- All other2 2.5 (0.2) 2.7 1.1 (0.4) 1.5
Current accident year re-estimation3 0.3 0.1 0.2 - - -
Total combined ratio4 116.2% 97.8% 18.4 107.1% 98.5% 8.6
Consolidated Results
1 Catastrophes are defined as a natural catastrophe or terror event exceeding $25 million in estimated ultimate losses, net of reinsurance, and before taxes. Catastrophe losses, where applicable,
include the impact of accelerated earned catastrophe premiums and earned reinstatement premiums.2 Net of earned premium and reinstatement premium attributable to prior years.3 Re-estimation of the current accident year loss reserves for the six months ended June 30, 2017 and 2016, respectively.4 The combined ratio, expressed as a percentage, is a measure of underwriting profitability. This measure should only be used in conjunction with, and not in lieu of, underwriting income and may not
be comparable to other performance measures used by the Company’s competitors. The combined ratio is computed as the sum of the following property and casualty ratios: the ratio of claims and
claim adjustment expense less managed care income to earned premium; the ratio of insurance operating costs plus amortization of deferred policy acquisition costs less third-party administration
income and fee income (primarily related to the Company’s involuntary market servicing carrier operations) and installment charges to earned premium; and the ratio of policyholder dividends to
earned premium. Provisions for uncollectible premium and reinsurance are not included in the combined ratio unless related to an asbestos and environmental commutation and certain other run off.
Restructuring and Ironshore acquisition and integration costs are not included in the combined ratio.
Third Quarter Year-to-Date
8
($ Millions) Fourth Quarter Full Year
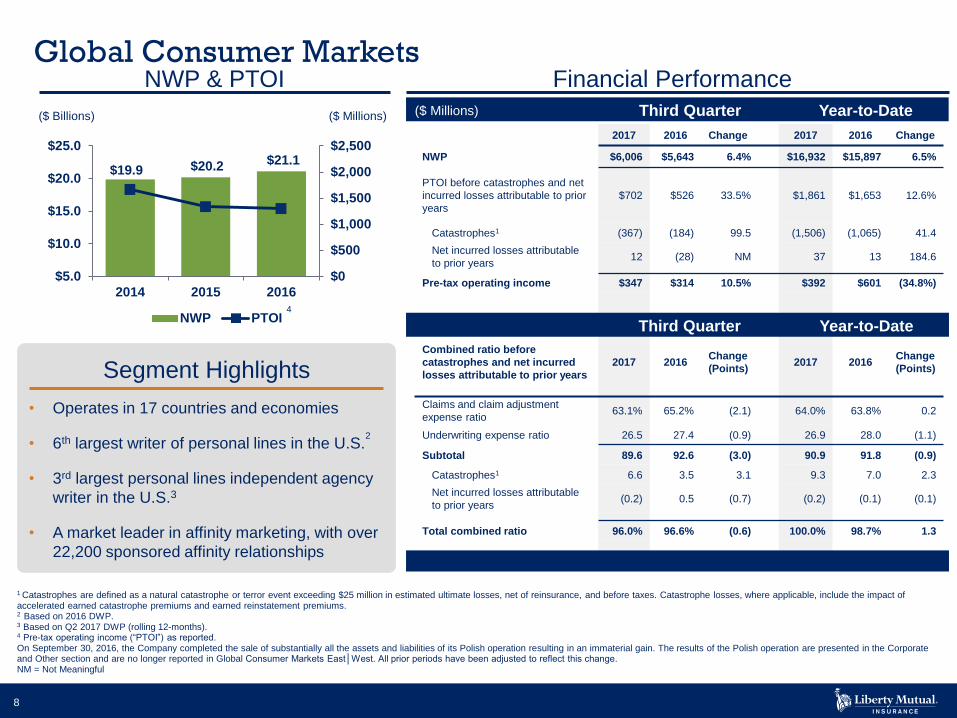
2017 2016 Change 2017 2016 Change
NWP $6,006 $5,643 6.4% $16,932 $15,897 6.5%
PTOI before catastrophes and net
incurred losses attributable to prior
years
$702 $526 33.5% $1,861 $1,653 12.6%
Catastrophes1 (367) (184) 99.5 (1,506) (1,065) 41.4
Net incurred losses attributable
to prior years12 (28) NM 37 13 184.6
Pre-tax operating income $347 $314 10.5% $392 $601 (34.8%)
Combined ratio before
catastrophes and net incurred
losses attributable to prior years
2017 2016Change
(Points)2017 2016
Change
(Points)
Claims and claim adjustment
expense ratio63.1% 65.2% (2.1) 64.0% 63.8% 0.2
Underwriting expense ratio 26.5 27.4 (0.9) 26.9 28.0 (1.1)
Subtotal 89.6 92.6 (3.0) 90.9 91.8 (0.9)
Catastrophes1 6.6 3.5 3.1 9.3 7.0 2.3
Net incurred losses attributable
to prior years(0.2) 0.5 (0.7) (0.2) (0.1) (0.1)
Total combined ratio 96.0% 96.6% (0.6) 100.0% 98.7% 1.3
• Operates in 17 countries and economies
• 6th largest writer of personal lines in the U.S.2
• 3rd largest personal lines independent agency
writer in the U.S.3
• A market leader in affinity marketing, with over
22,200 sponsored affinity relationships
($ Billions)
NWP & PTOI
Segment Highlights
Financial Performance
($ Millions)
Global Consumer Markets
$19.9 $20.2 $21.1
$0
$500
$1,000
$1,500
$2,000
$2,500
$5.0
$10.0
$15.0
$20.0
$25.0
2014 2015 2016
NWP PTOI
1 Catastrophes are defined as a natural catastrophe or terror event exceeding $25 million in estimated ultimate losses, net of reinsurance, and before taxes. Catastrophe losses, where applicable, include the impact of accelerated earned catastrophe premiums and earned reinstatement premiums.2 Based on 2016 DWP. 3 Based on Q2 2017 DWP (rolling 12-months).4 Pre-tax operating income (“PTOI”) as reported.On September 30, 2016, the Company completed the sale of substantially all the assets and liabilities of its Polish operation resulting in an immaterial gain. The results of the Polish operation are presented in the Corporate and Other section and are no longer reported in Global Consumer Markets East│West. All prior periods have been adjusted to reflect this change.NM = Not Meaningful
Third Quarter Year-to-Date($ Millions)
Third Quarter Year-to-Date
4

9
Global Consumer Markets NWP Distribution
U.S. Consumer Markets83%
Global Consumer Markets East│West
17%
U.S. Private Passenger Auto
51%
U.S. Homeowners & Other
32%
Intl. Private Passenger Auto
11%
Intl. Other6%
5.4%
12.2%
U.S. Consumer Markets
Global Consumer Markets East│West
YOY Change in NWP
6.7%
3.4%
13.3%
U.S. Private PassengerAuto
U.S. Homeowners &Other
Intl. Private PassengerAuto
YOY Change in NWP
1September YTD 2017
NWP by market segment NWP by line of business
NWP year-to-date in 2017 totaled $16.9 billion, an increase of 6.5% over the same period in 2016.
1 Premium related to life and health, commercial auto, homeowners, and other personal and commercial lines including personal accident, bonds, workers compensation, small and medium enterprise, marine
and cargo, and commercial property lines of business.
YOY: year-over-year
10
($ Millions)
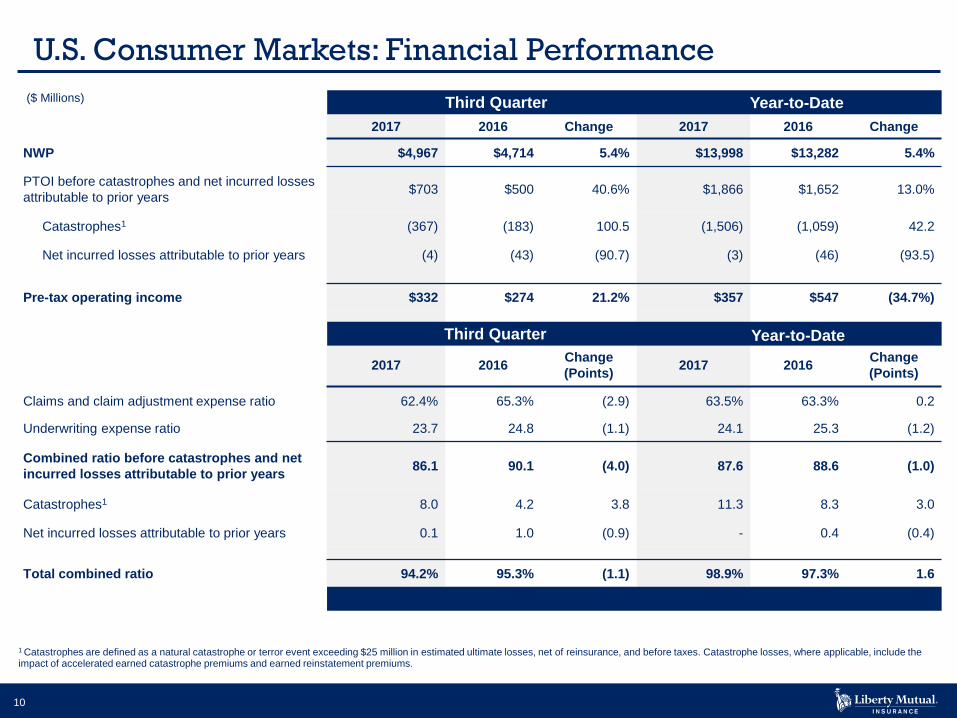
2017 2016 Change 2017 2016 Change
NWP $4,967 $4,714 5.4% $13,998 $13,282 5.4%
PTOI before catastrophes and net incurred losses
attributable to prior years$703 $500 40.6% $1,866 $1,652 13.0%
Catastrophes1 (367) (183) 100.5 (1,506) (1,059) 42.2
Net incurred losses attributable to prior years (4) (43) (90.7) (3) (46) (93.5)
Pre-tax operating income $332 $274 21.2% $357 $547 (34.7%)
2017 2016Change
(Points)2017 2016
Change
(Points)
Claims and claim adjustment expense ratio 62.4% 65.3% (2.9) 63.5% 63.3% 0.2
Underwriting expense ratio 23.7 24.8 (1.1) 24.1 25.3 (1.2)
Combined ratio before catastrophes and net
incurred losses attributable to prior years86.1 90.1 (4.0) 87.6 88.6 (1.0)
Catastrophes1 8.0 4.2 3.8 11.3 8.3 3.0
Net incurred losses attributable to prior years 0.1 1.0 (0.9) - 0.4 (0.4)
Total combined ratio 94.2% 95.3% (1.1) 98.9% 97.3% 1.6
U.S. Consumer Markets: Financial Performance
1 Catastrophes are defined as a natural catastrophe or terror event exceeding $25 million in estimated ultimate losses, net of reinsurance, and before taxes. Catastrophe losses, where applicable, include the impact of accelerated earned catastrophe premiums and earned reinstatement premiums.
Third Quarter Year-to-Date
Third Quarter Year-to-Date
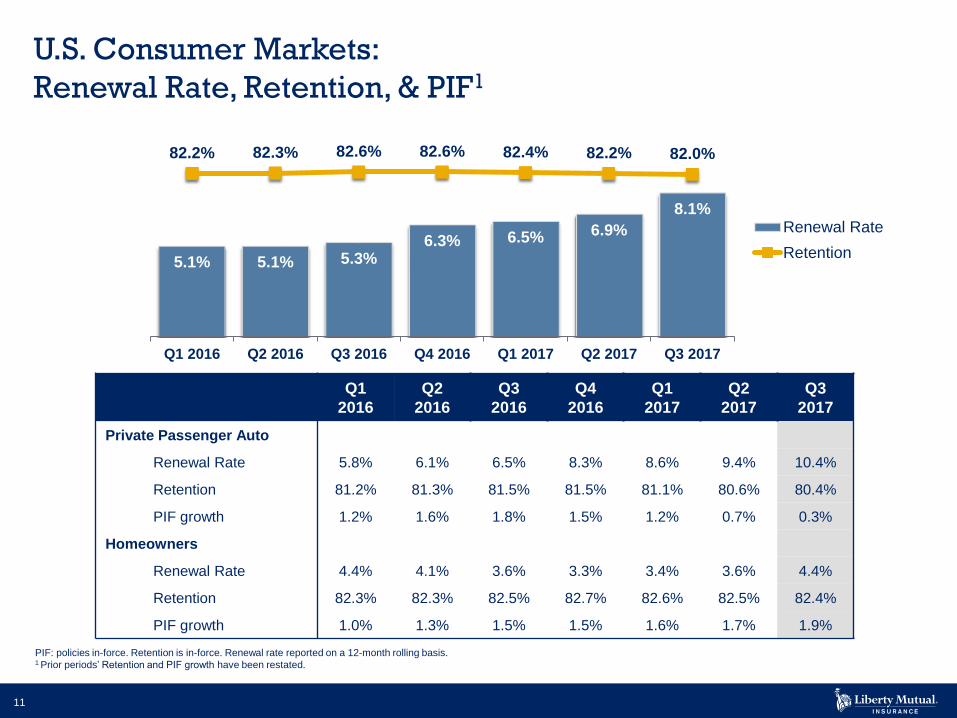
11
U.S. Consumer Markets:
Renewal Rate, Retention, & PIF1
Q1
2016
Q2
2016
Q3
2016
Q4
2016
Q1
2017
Q2
2017
Q3
2017
Private Passenger Auto
Renewal Rate 5.8% 6.1% 6.5% 8.3% 8.6% 9.4% 10.4%
Retention 81.2% 81.3% 81.5% 81.5% 81.1% 80.6% 80.4%
PIF growth 1.2% 1.6% 1.8% 1.5% 1.2% 0.7% 0.3%
Homeowners
Renewal Rate 4.4% 4.1% 3.6% 3.3% 3.4% 3.6% 4.4%
Retention 82.3% 82.3% 82.5% 82.7% 82.6% 82.5% 82.4%
PIF growth 1.0% 1.3% 1.5% 1.5% 1.6% 1.7% 1.9%
PIF: policies in-force. Retention is in-force. Renewal rate reported on a 12-month rolling basis.1 Prior periods’ Retention and PIF growth have been restated.
5.1% 5.1% 5.3%6.3% 6.5% 6.9%
8.1%
82.2% 82.3% 82.6% 82.6% 82.4% 82.2% 82.0%
Q1 2016 Q2 2016 Q3 2016 Q4 2016 Q1 2017 Q2 2017 Q3 2017
Renewal Rate
Retention
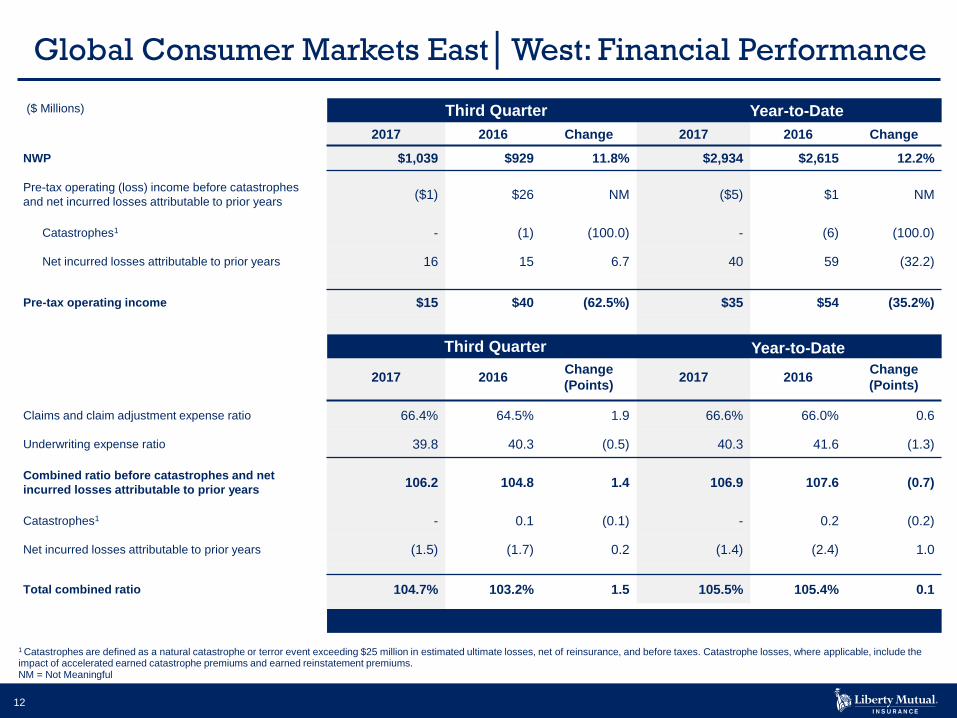
12
Global Consumer Markets East│West: Financial Performance
($ Millions)
2017 2016 Change 2017 2016 Change
NWP $1,039 $929 11.8% $2,934 $2,615 12.2%
Pre-tax operating (loss) income before catastrophes
and net incurred losses attributable to prior years($1) $26 NM ($5) $1 NM
Catastrophes1 - (1) (100.0) - (6) (100.0)
Net incurred losses attributable to prior years 16 15 6.7 40 59 (32.2)
Pre-tax operating income $15 $40 (62.5%) $35 $54 (35.2%)
2017 2016Change
(Points)2017 2016
Change
(Points)
Claims and claim adjustment expense ratio 66.4% 64.5% 1.9 66.6% 66.0% 0.6
Underwriting expense ratio 39.8 40.3 (0.5) 40.3 41.6 (1.3)
Combined ratio before catastrophes and net
incurred losses attributable to prior years106.2 104.8 1.4 106.9 107.6 (0.7)
Catastrophes1 - 0.1 (0.1) - 0.2 (0.2)
Net incurred losses attributable to prior years (1.5) (1.7) 0.2 (1.4) (2.4) 1.0
Total combined ratio 104.7% 103.2% 1.5 105.5% 105.4% 0.1
1 Catastrophes are defined as a natural catastrophe or terror event exceeding $25 million in estimated ultimate losses, net of reinsurance, and before taxes. Catastrophe losses, where applicable, include the impact of accelerated earned catastrophe premiums and earned reinstatement premiums. NM = Not Meaningful
Third Quarter Year-to-Date
Third Quarter Year-to-Date
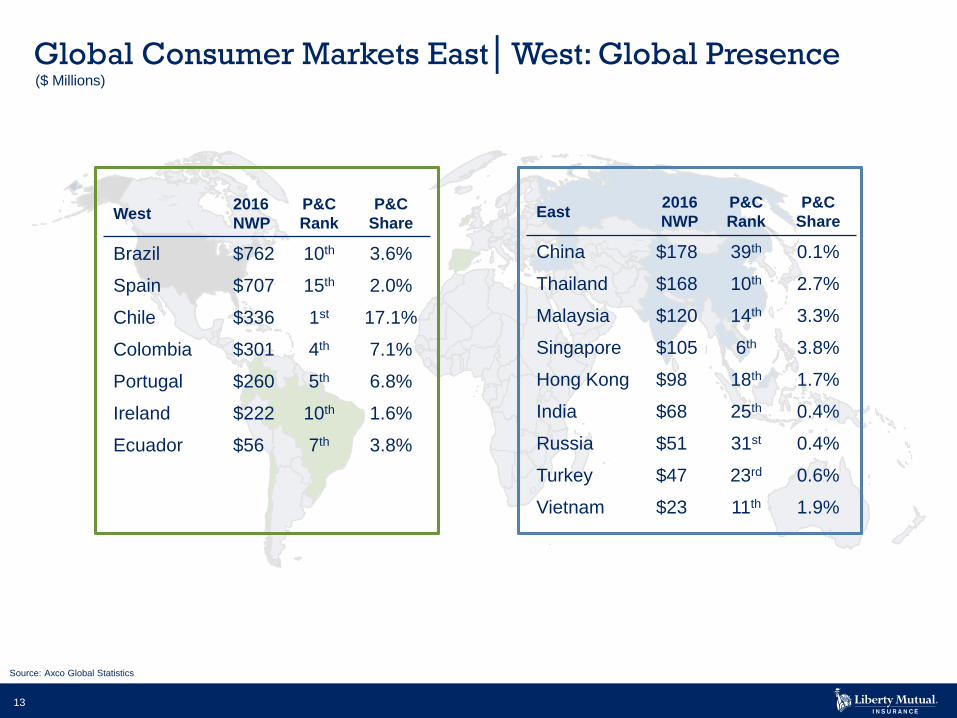
13
Global Consumer Markets East│West: Global Presence
Source: Axco Global Statistics
($ Millions)
East2016
NWP
P&C
Rank
P&C
Share
China $178 39th 0.1%
Thailand $168 10th 2.7%
Malaysia $120 14th 3.3%
Singapore $105 6th 3.8%
Hong Kong $98 18th 1.7%
India $68 25th 0.4%
Russia $51 31st 0.4%
Turkey $47 23rd 0.6%
Vietnam $23 11th 1.9%
West2016
NWP
P&C
Rank
P&C
Share
Brazil $762 10th 3.6%
Spain $707 15th 2.0%
Chile $336 1st 17.1%
Colombia $301 4th 7.1%
Portugal $260 5th 6.8%
Ireland $222 10th 1.6%
Ecuador $56 7th 3.8%
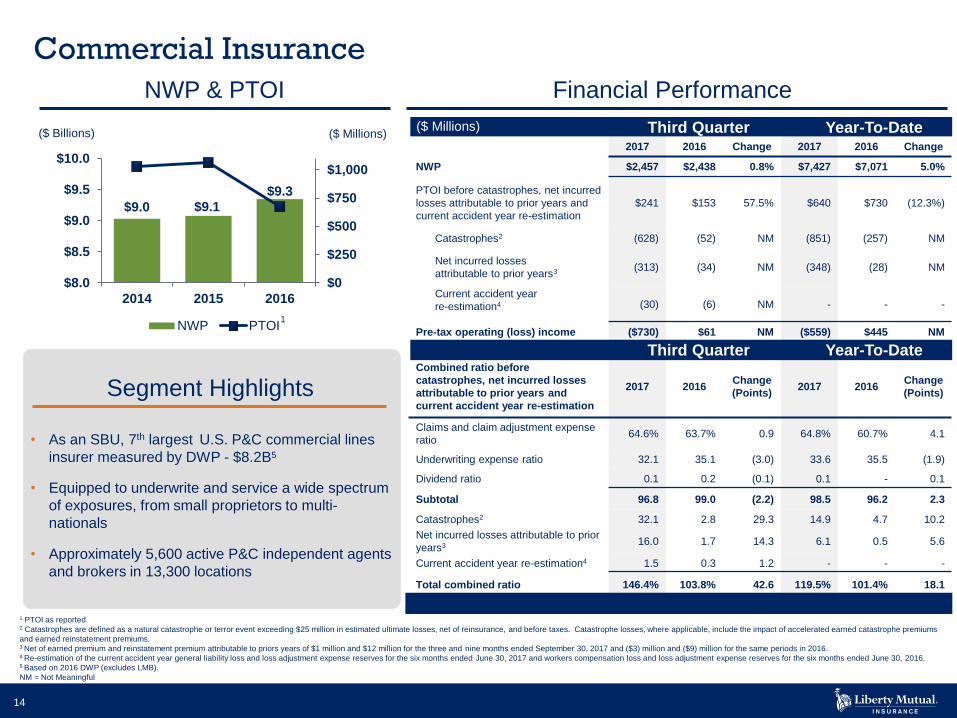
14
($ Billions)
NWP & PTOI Financial Performance
($ Millions)
Commercial Insurance
1 PTOI as reported.2 Catastrophes are defined as a natural catastrophe or terror event exceeding $25 million in estimated ultimate losses, net of reinsurance, and before taxes. Catastrophe losses, where applicable, include the impact of accelerated earned catastrophe premiums
and earned reinstatement premiums. 3 Net of earned premium and reinstatement premium attributable to priors years of $1 million and $12 million for the three and nine months ended September 30, 2017 and ($3) million and ($9) million for the same periods in 2016.4 Re-estimation of the current accident year general liability loss and loss adjustment expense reserves for the six months ended June 30, 2017 and workers compensation loss and loss adjustment expense reserves for the six months ended June 30, 2016.5 Based on 2016 DWP (excludes LMB).
NM = Not Meaningful
$9.0 $9.1
$9.3
$0
$250
$500
$750
$1,000
$8.0
$8.5
$9.0
$9.5
$10.0
2014 2015 2016
NWP PTOI
First Quarter
First Quarter
($ Millions)
• As an SBU, 7th largest U.S. P&C commercial lines
insurer measured by DWP - $8.2B5
• Equipped to underwrite and service a wide spectrum
of exposures, from small proprietors to multi-
nationals
• Approximately 5,600 active P&C independent agents
and brokers in 13,300 locations
Segment Highlights
$ Millions
2017 2016 Change 2017 2016 Change
NWP $2,457 $2,438 0.8% $7,427 $7,071 5.0%
PTOI before catastrophes, net incurred
losses attributable to prior years and
current accident year re-estimation
$241 $153 57.5% $640 $730 (12.3%)
Catastrophes2 (628) (52) NM (851) (257) NM
Net incurred losses
attributable to prior years3 (313) (34) NM (348) (28) NM
Current accident year
re-estimation4 (30) (6) NM - - -
Pre-tax operating (loss) income ($730) $61 NM ($559) $445 NM
Combined ratio before
catastrophes, net incurred losses
attributable to prior years and
current accident year re-estimation
2017 2016Change
(Points)2017 2016
Change
(Points)
Claims and claim adjustment expense
ratio64.6% 63.7% 0.9 64.8% 60.7% 4.1
Underwriting expense ratio 32.1 35.1 (3.0) 33.6 35.5 (1.9)
Dividend ratio 0.1 0.2 (0.1) 0.1 - 0.1
Subtotal 96.8 99.0 (2.2) 98.5 96.2 2.3
Catastrophes2 32.1 2.8 29.3 14.9 4.7 10.2
Net incurred losses attributable to prior
years3 16.0 1.7 14.3 6.1 0.5 5.6
Current accident year re-estimation4 1.5 0.3 1.2 - - -
Total combined ratio 146.4% 103.8% 42.6 119.5% 101.4% 18.1
Third Quarter Year-To-Date
Third Quarter Year-To-Date
($ Millions)
1
15
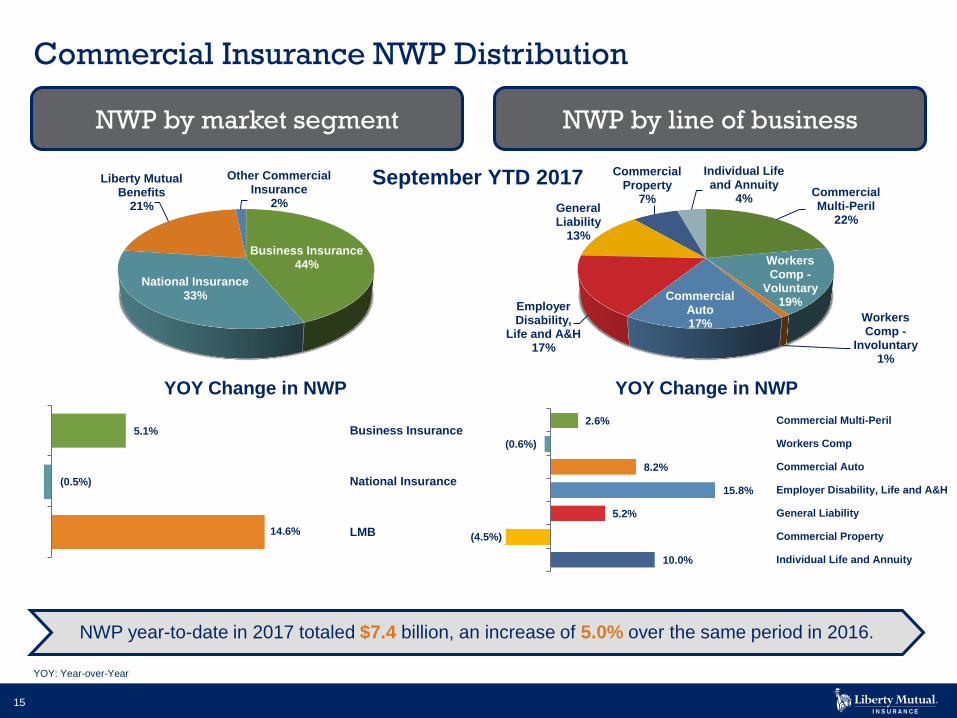
Commercial Insurance NWP Distribution
Business Insurance44%
National Insurance33%
Liberty Mutual Benefits
21%
Other Commercial Insurance
2%
NWP year-to-date in 2017 totaled $7.4 billion, an increase of 5.0% over the same period in 2016.
Commercial Multi-Peril
22%
Workers Comp -
Voluntary19%
Workers Comp -
Involuntary1%
Commercial Auto17%
Employer Disability,
Life and A&H17%
General Liability
13%
Commercial Property
7%
Individual Life and Annuity
4%
2.6%
(0.6%)
8.2%
15.8%
5.2%
(4.5%)
10.0%
Commercial Multi-Peril
Workers Comp
Commercial Auto
Employer Disability, Life and A&H
General Liability
Commercial Property
Individual Life and Annuity
YOY Change in NWP
5.1%
(0.5%)
14.6%
Business Insurance
National Insurance
LMB
YOY Change in NWP
YOY: Year-over-Year
September YTD 2017
NWP by market segment NWP by line of business
16
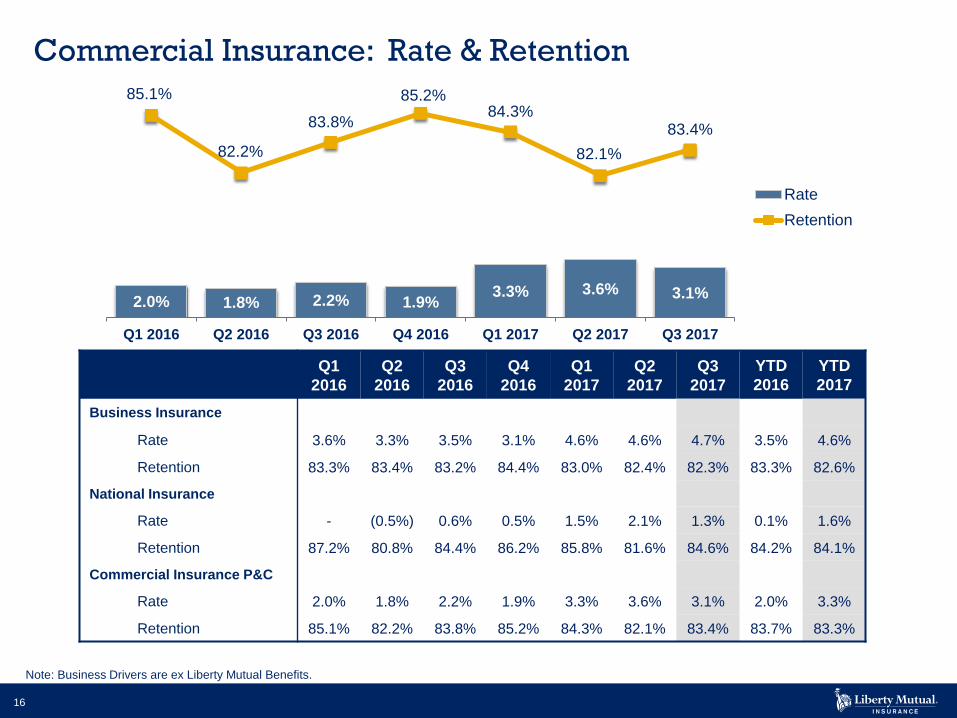
Commercial Insurance: Rate & Retention
2.0% 1.8% 2.2% 1.9%3.3% 3.6% 3.1%
85.1%
82.2%
83.8%
85.2%84.3%
82.1%
83.4%
Q1 2016 Q2 2016 Q3 2016 Q4 2016 Q1 2017 Q2 2017 Q3 2017
Rate
Retention
Note: Business Drivers are ex Liberty Mutual Benefits.
Q1
2016
Q2
2016
Q3
2016
Q4
2016
Q1
2017
Q2
2017
Q3
2017
YTD
2016
YTD
2017
Business Insurance
Rate 3.6% 3.3% 3.5% 3.1% 4.6% 4.6% 4.7% 3.5% 4.6%
Retention 83.3% 83.4% 83.2% 84.4% 83.0% 82.4% 82.3% 83.3% 82.6%
National Insurance
Rate - (0.5%) 0.6% 0.5% 1.5% 2.1% 1.3% 0.1% 1.6%
Retention 87.2% 80.8% 84.4% 86.2% 85.8% 81.6% 84.6% 84.2% 84.1%
Commercial Insurance P&C
Rate 2.0% 1.8% 2.2% 1.9% 3.3% 3.6% 3.1% 2.0% 3.3%
Retention 85.1% 82.2% 83.8% 85.2% 84.3% 82.1% 83.4% 83.7% 83.3%
17
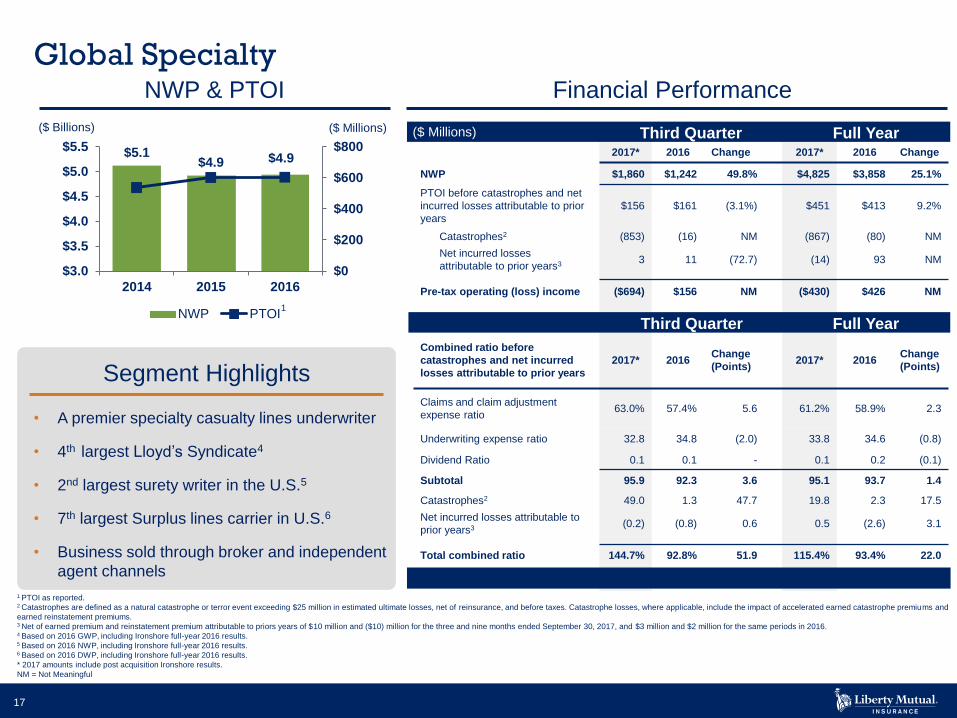
$ Millions
2017* 2016 Change 2017* 2016 Change
NWP $1,860 $1,242 49.8% $4,825 $3,858 25.1%
PTOI before catastrophes and net
incurred losses attributable to prior
years
$156 $161 (3.1%) $451 $413 9.2%
Catastrophes2 (853) (16) NM (867) (80) NM
Net incurred losses
attributable to prior years3 3 11 (72.7) (14) 93 NM
Pre-tax operating (loss) income ($694) $156 NM ($430) $426 NM
Combined ratio before
catastrophes and net incurred
losses attributable to prior years
2017* 2016Change
(Points)2017* 2016
Change
(Points)
Claims and claim adjustment
expense ratio63.0% 57.4% 5.6 61.2% 58.9% 2.3
Underwriting expense ratio 32.8 34.8 (2.0) 33.8 34.6 (0.8)
Dividend Ratio 0.1 0.1 - 0.1 0.2 (0.1)
Subtotal 95.9 92.3 3.6 95.1 93.7 1.4
Catastrophes2 49.0 1.3 47.7 19.8 2.3 17.5
Net incurred losses attributable to
prior years3 (0.2) (0.8) 0.6 0.5 (2.6) 3.1
Total combined ratio 144.7% 92.8% 51.9 115.4% 93.4% 22.0
($ Billions)
NWP & PTOI Financial Performance
($ Millions)
Segment Highlights
• A premier specialty casualty lines underwriter
• 4th largest Lloyd’s Syndicate4
• 2nd largest surety writer in the U.S.5
• 7th largest Surplus lines carrier in U.S.6
• Business sold through broker and independent
agent channels
Global Specialty
$5.1$4.9 $4.9
$0
$200
$400
$600
$800
$3.0
$3.5
$4.0
$4.5
$5.0
$5.5
2014 2015 2016
NWP PTOI
Third Quarter Full Year($ Millions)
Third Quarter Full Year
1 PTOI as reported. 2 Catastrophes are defined as a natural catastrophe or terror event exceeding $25 million in estimated ultimate losses, net of reinsurance, and before taxes. Catastrophe losses, where applicable, include the impact of accelerated earned catastrophe premiums and
earned reinstatement premiums.3 Net of earned premium and reinstatement premium attributable to priors years of $10 million and ($10) million for the three and nine months ended September 30, 2017, and $3 million and $2 million for the same periods in 2016.4 Based on 2016 GWP, including Ironshore full-year 2016 results.5 Based on 2016 NWP, including Ironshore full-year 2016 results.6 Based on 2016 DWP, including Ironshore full-year 2016 results.
* 2017 amounts include post acquisition Ironshore results.
NM = Not Meaningful
1
18
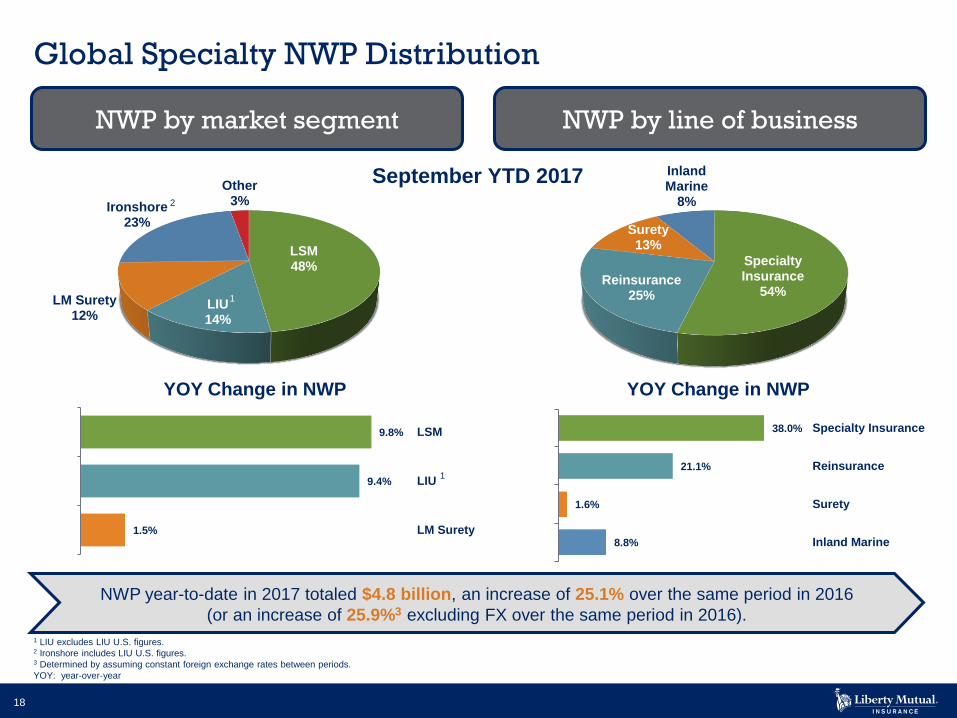
Global Specialty NWP Distribution
LSM48%
LIU14%
LM Surety12%
Ironshore23%
Other3%
NWP year-to-date in 2017 totaled $4.8 billion, an increase of 25.1% over the same period in 2016
(or an increase of 25.9%3 excluding FX over the same period in 2016).
Specialty Insurance
54%Reinsurance
25%
Surety13%
Inland Marine
8%
9.8%
9.4%
1.5%
LSM
LIU
LM Surety
YOY Change in NWP
38.0%
21.1%
1.6%
8.8%
Specialty Insurance
Reinsurance
Surety
Inland Marine
YOY Change in NWP
1 LIU excludes LIU U.S. figures.2 Ironshore includes LIU U.S. figures.3 Determined by assuming constant foreign exchange rates between periods.
YOY: year-over-year
September YTD 2017
NWP by market segment NWP by line of business
2
1
1
19
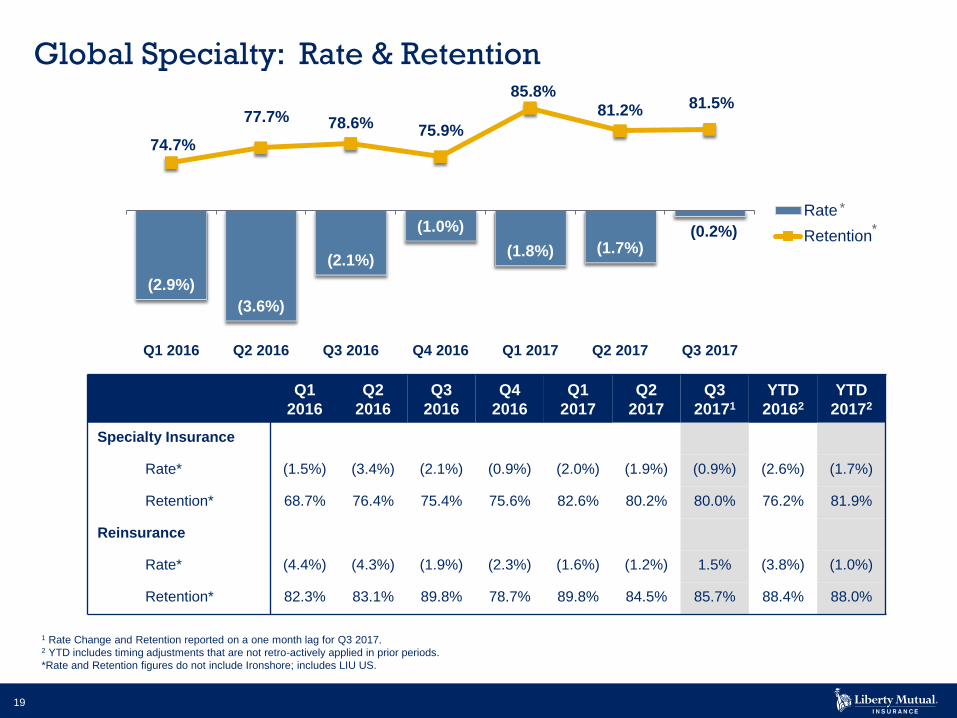
Global Specialty: Rate & Retention
Q1
2016
Q2
2016
Q3
2016
Q4
2016
Q1
2017
Q2
2017
Q3
20171
YTD
20162
YTD
20172
Specialty Insurance
Rate* (1.5%) (3.4%) (2.1%) (0.9%) (2.0%) (1.9%) (0.9%) (2.6%) (1.7%)
Retention* 68.7% 76.4% 75.4% 75.6% 82.6% 80.2% 80.0% 76.2% 81.9%
Reinsurance
Rate* (4.4%) (4.3%) (1.9%) (2.3%) (1.6%) (1.2%) 1.5% (3.8%) (1.0%)
Retention* 82.3% 83.1% 89.8% 78.7% 89.8% 84.5% 85.7% 88.4% 88.0%
(2.9%)
(3.6%)
(2.1%)
(1.0%)
(1.8%) (1.7%)(0.2%)
74.7%
77.7% 78.6%75.9%
85.8%
81.2% 81.5%
Q1 2016 Q2 2016 Q3 2016 Q4 2016 Q1 2017 Q2 2017 Q3 2017
Rate
Retention
1 Rate Change and Retention reported on a one month lag for Q3 2017.2 YTD includes timing adjustments that are not retro-actively applied in prior periods.
*Rate and Retention figures do not include Ironshore; includes LIU US.
*
*
20
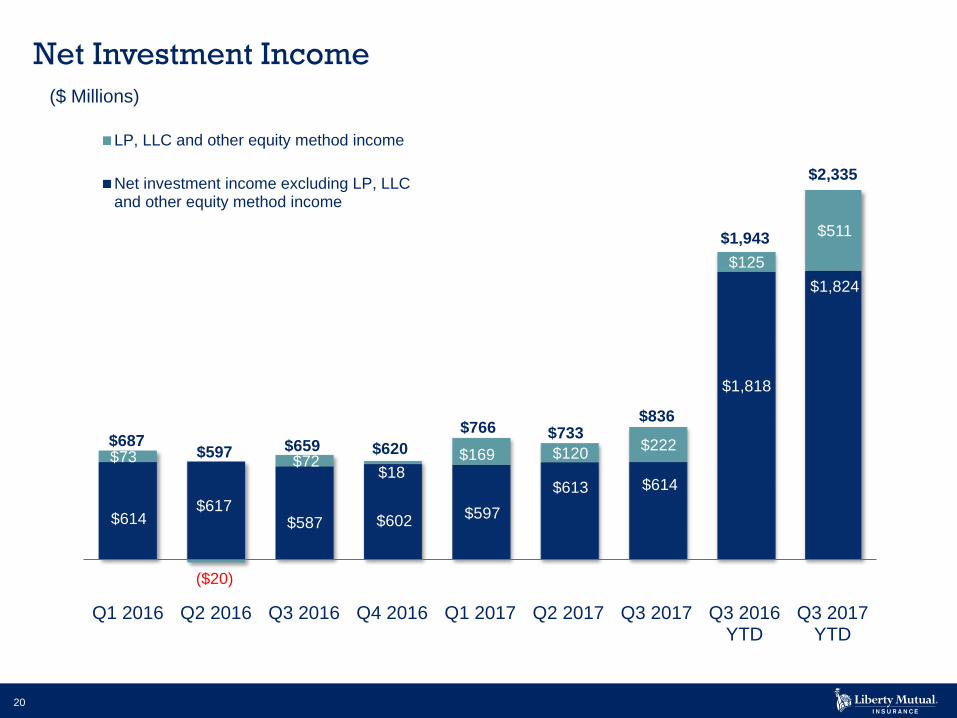
Net Investment Income
($ Millions)
$614 $617
$587 $602 $597
$613 $614
$1,818
$1,824
$73
($20)
$72 $18
$169 $120 $222
$125
$511
Q1 2016 Q2 2016 Q3 2016 Q4 2016 Q1 2017 Q2 2017 Q3 2017 Q3 2016YTD
Q3 2017YTD
LP, LLC and other equity method income
Net investment income excluding LP, LLCand other equity method income
$687$597 $659 $620
$766 $733$836
$1,943
$2,335
21
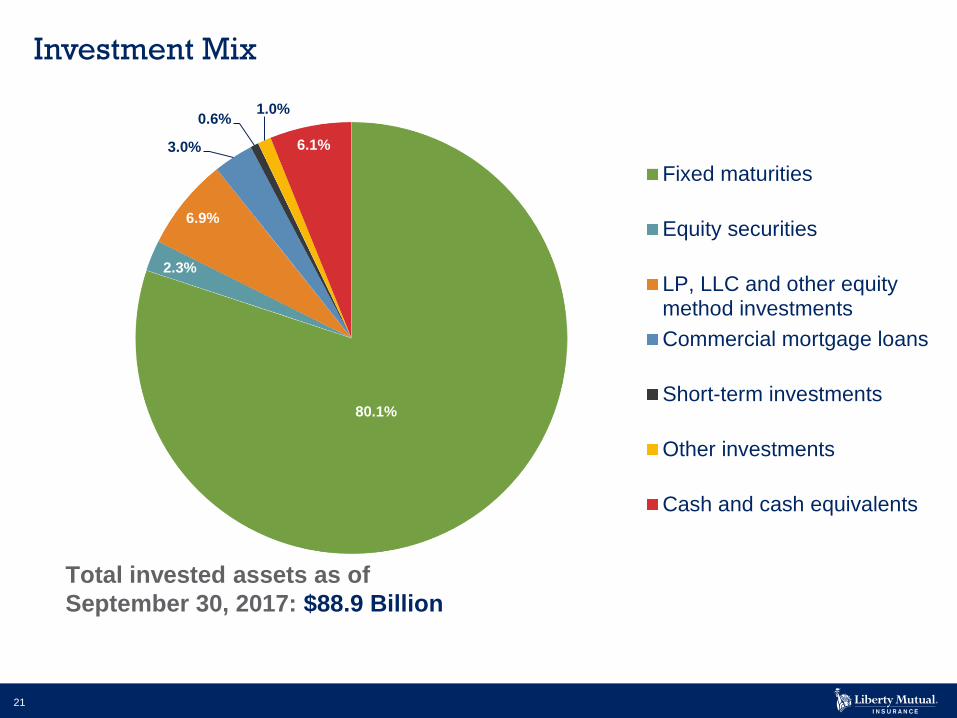
Investment Mix
80.1%
2.3%
6.9%
3.0%
0.6%1.0%
6.1%
Fixed maturities
Equity securities
LP, LLC and other equitymethod investments
Commercial mortgage loans
Short-term investments
Other investments
Cash and cash equivalents
Total invested assets as of
September 30, 2017: $88.9 Billion
22
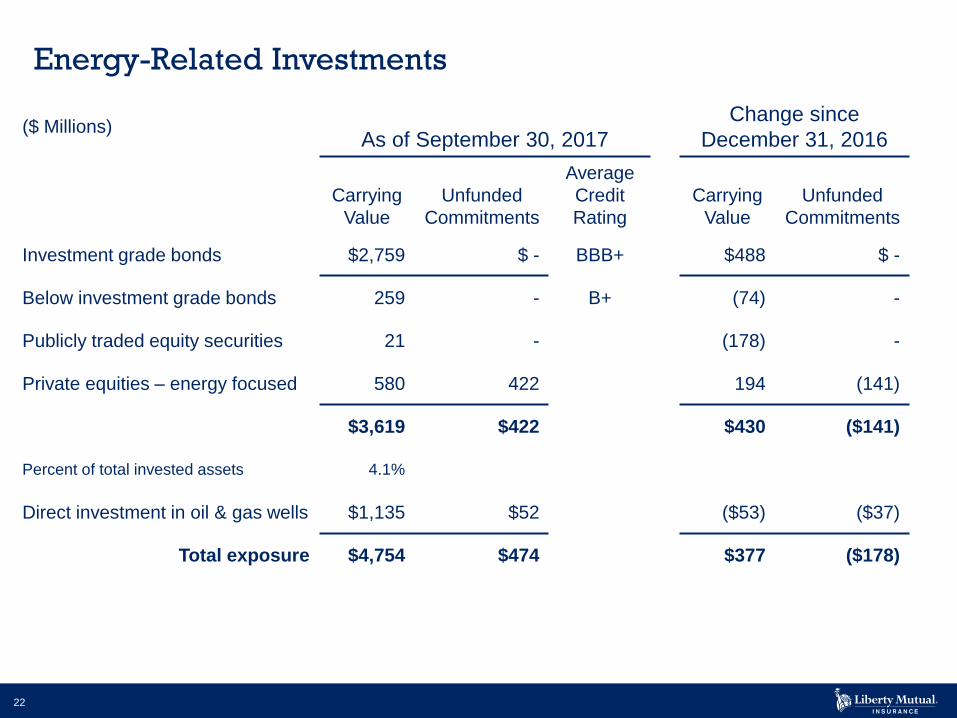
Energy-Related Investments
($ Millions)As of September 30, 2017
Change since
December 31, 2016
Carrying
Value
Unfunded
Commitments
Average
Credit
Rating
Carrying
Value
Unfunded
Commitments
Investment grade bonds $2,759 $ - BBB+ $488 $ -
Below investment grade bonds 259 - B+ (74) -
Publicly traded equity securities 21 - (178) -
Private equities – energy focused 580 422 194 (141)
$3,619 $422 $430 ($141)
Percent of total invested assets 4.1%
Direct investment in oil & gas wells $1,135 $52 ($53) ($37)
Total exposure $4,754 $474 $377 ($178)
23
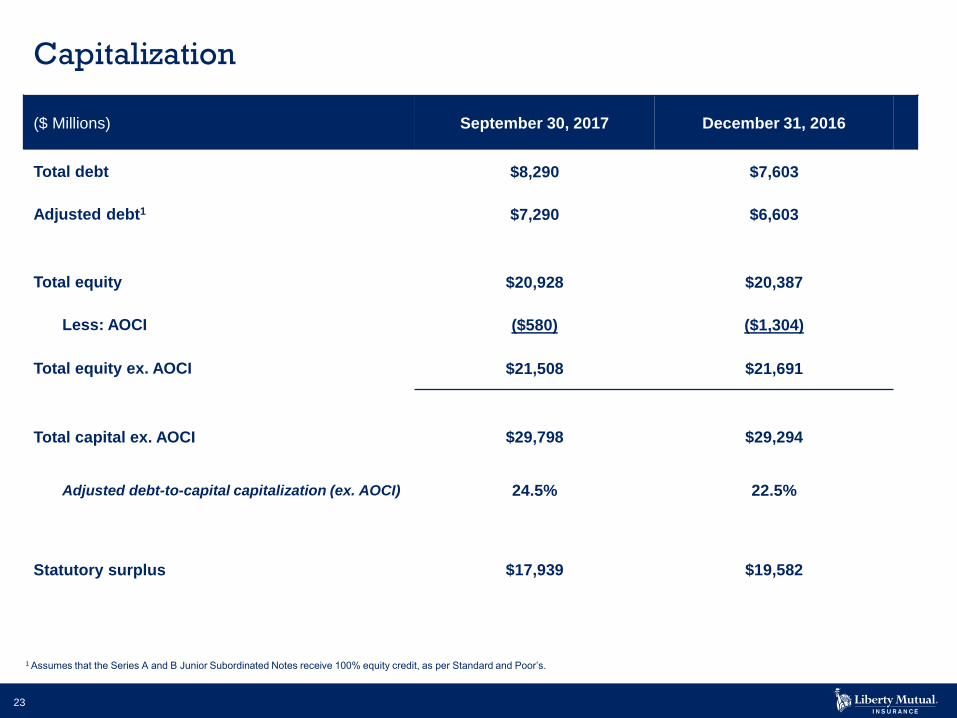
Capitalization
($ Millions) September 30, 2017 December 31, 2016
Total debt $8,290 $7,603
Adjusted debt1 $7,290 $6,603
Total equity $20,928 $20,387
Less: AOCI ($580) ($1,304)
Total equity ex. AOCI $21,508 $21,691
Total capital ex. AOCI $29,798 $29,294
Adjusted debt-to-capital capitalization (ex. AOCI) 24.5% 22.5%
Statutory surplus $17,939 $19,582
1 Assumes that the Series A and B Junior Subordinated Notes receive 100% equity credit, as per Standard and Poor’s.
24
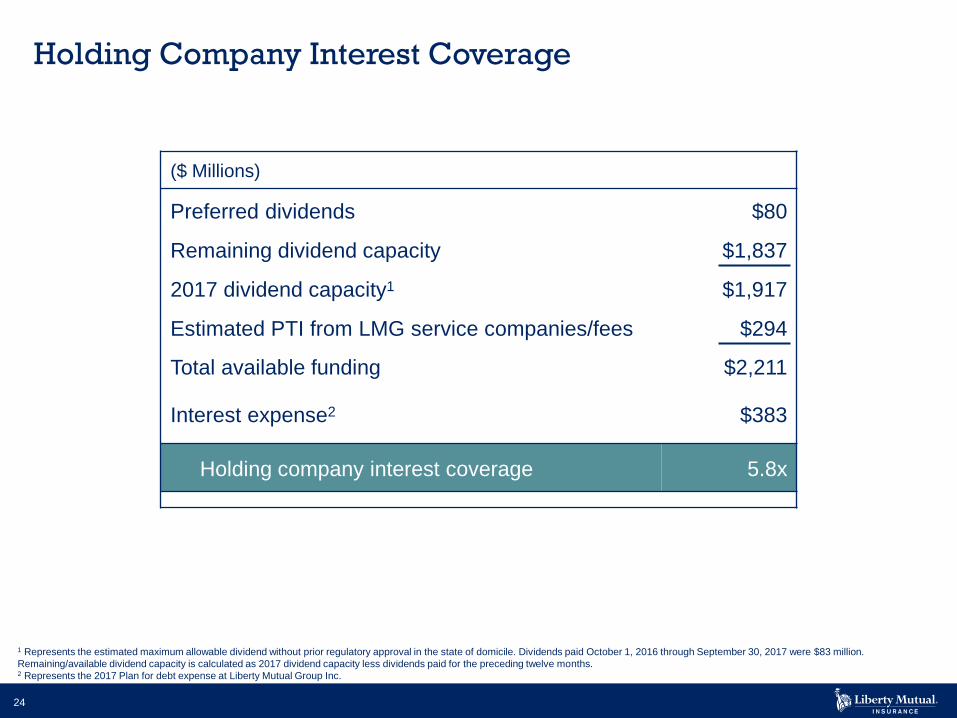
Holding Company Interest Coverage
1 Represents the estimated maximum allowable dividend without prior regulatory approval in the state of domicile. Dividends paid October 1, 2016 through September 30, 2017 were $83 million.
Remaining/available dividend capacity is calculated as 2017 dividend capacity less dividends paid for the preceding twelve months. 2 Represents the 2017 Plan for debt expense at Liberty Mutual Group Inc.
($ Millions)
Preferred dividends $80
Remaining dividend capacity $1,837
2017 dividend capacity1 $1,917
Estimated PTI from LMG service companies/fees $294
Total available funding $2,211
Interest expense2 $383
Holding company interest coverage 5.8x

25
Reconciliation of Statement of Income to Combined Ratio
For the three months ended September 30, 2017 ($ Millions)
Combined ratio components: Statement of income Presentation reclass1 Less: Life insurance2
Less: Non-underwriting
expenses and other
adjustments3
Combined Ratio
Premiums earned $9,858 $ - ($536) $ - $9,322
Benefits, claims and claim
adjustment expenses8,772 - (570) (2) 8,200
Operating costs and expenses 1,741 (5) (136) (273) 1,327
Amortization of deferred policy
acquisition costs1,326 - (24) (2) 1,300
Dividends to policyholders N/A 5 (1) - 4
Total combined ratio 116.2%
For the three months ended September 30. 2016 ($ Millions)
Combined ratio components: Statement of income Presentation reclass1 Less: Life insurance2
Less: Non-underwriting
expenses and other
adjustments3
Combined Ratio
Premiums earned $8,888 $ - ($485) ($1) $8,402
Benefits, claims and claim
adjustment expenses6,230 - (564) (1) 5,665
Operating costs and expenses 1,734 (7) (120) (218) 1,389
Amortization of deferred policy
acquisition costs1,178 - (21) - 1,157
Dividends to policyholders N/A 7 (2) - 5
Total combined ratio 97.8%
1 Dividends to policyholders.2 Life and annuity business excluded from P&C combined ratio.3 Includes adjustments for non-underwriting expenses primarily related to the Company’s energy production and service operations, fee income, and installment charges.
26
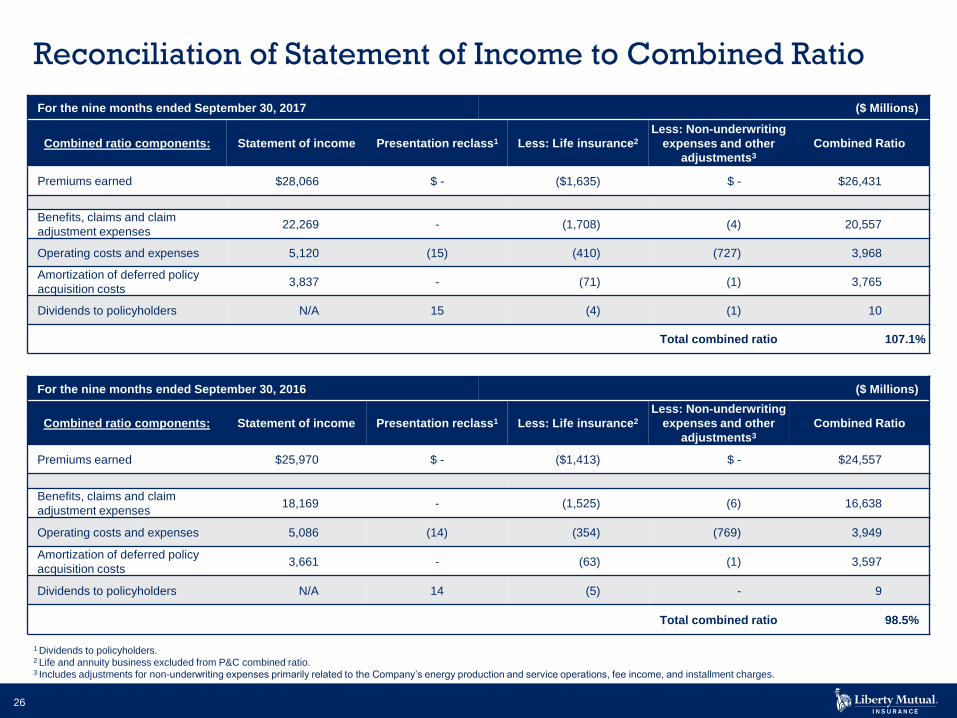
Reconciliation of Statement of Income to Combined Ratio
For the nine months ended September 30, 2017 ($ Millions)
Combined ratio components: Statement of income Presentation reclass1 Less: Life insurance2
Less: Non-underwriting
expenses and other
adjustments3
Combined Ratio
Premiums earned $28,066 $ - ($1,635) $ - $26,431
Benefits, claims and claim
adjustment expenses22,269 - (1,708) (4) 20,557
Operating costs and expenses 5,120 (15) (410) (727) 3,968
Amortization of deferred policy
acquisition costs3,837 - (71) (1) 3,765
Dividends to policyholders N/A 15 (4) (1) 10
Total combined ratio 107.1%
For the nine months ended September 30, 2016 ($ Millions)
Combined ratio components: Statement of income Presentation reclass1 Less: Life insurance2
Less: Non-underwriting
expenses and other
adjustments3
Combined Ratio
Premiums earned $25,970 $ - ($1,413) $ - $24,557
Benefits, claims and claim
adjustment expenses18,169 - (1,525) (6) 16,638
Operating costs and expenses 5,086 (14) (354) (769) 3,949
Amortization of deferred policy
acquisition costs3,661 - (63) (1) 3,597
Dividends to policyholders N/A 14 (5) - 9
Total combined ratio 98.5%
1 Dividends to policyholders.2 Life and annuity business excluded from P&C combined ratio.3 Includes adjustments for non-underwriting expenses primarily related to the Company’s energy production and service operations, fee income, and installment charges.
27
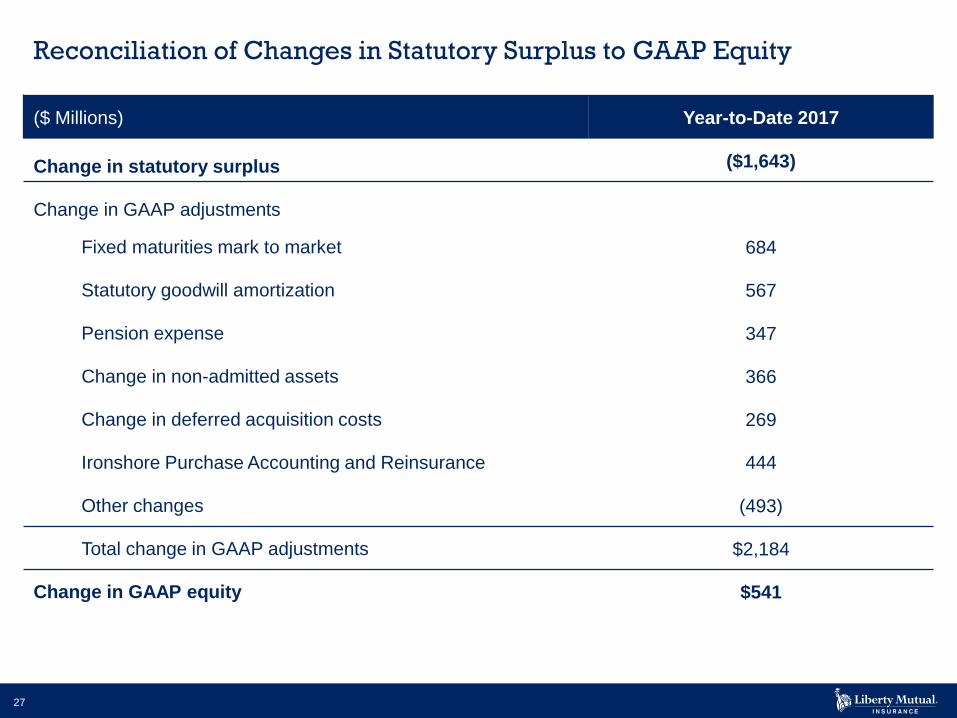
Reconciliation of Changes in Statutory Surplus to GAAP Equity
($ Millions) Year-to-Date 2017
Change in statutory surplus ($1,643)
Change in GAAP adjustments
Fixed maturities mark to market 684
Statutory goodwill amortization 567
Pension expense 347
Change in non-admitted assets 366
Change in deferred acquisition costs 269
Ironshore Purchase Accounting and Reinsurance 444
Other changes (493)
Total change in GAAP adjustments $2,184
Change in GAAP equity $541
28
About Liberty Mutual Insurance
Boston-based LMHC, the parent corporation of the Liberty Mutual Insurance group of entities, is a diversified
global insurer and fourth largest property and casualty insurer in the U.S. based on 2016 direct written
premium. The Company also ranks 75th on the Fortune 100 list of largest corporations in the U.S. based on
2016 revenue. As of December 31, 2016, LMHC had $125.592 billion in consolidated assets, $105.205
billion in consolidated liabilities, and $38.308 billion in annual consolidated revenue.
LMHC, through its subsidiaries and affiliated companies, offers a wide range of property and casualty
insurance products and services to individuals and businesses alike. In 2001 and 2002, the Company
formed a mutual holding company structure, whereby the three principal mutual insurance companies,
Liberty Mutual Insurance Company, Liberty Mutual Fire Insurance Company and Employers Insurance
Company of Wausau, each became separate stock insurance companies under the ownership of LMHC.
Functionally, the Company conducts substantially all of its business through the SBUs, with each operating
independently of the others with dedicated sales, underwriting, claims, actuarial, financial and certain
information technology resources. Management believes this structure allows each business unit to execute
its business strategy and/or to make acquisitions without impacting or disrupting the operations of the
Company’s other business units.
LMHC employs more than 50,000 people in over 800 offices throughout the world. For a full description of
the Company’s business operations, products and distribution channels, please visit Liberty Mutual’s
Investor Relations web site at www.libertymutualgroup.com/investors.
29
Additional Notes
The Company’s financial results, management's discussion and analysis of operating results
and financial condition, accompanying financial statements and other supplemental financial
information for the three and nine months ended September 30, 2017 are available on the
Company's Investor Relations website at http://www.libertymutualgroup.com/investors.
The Company’s discussions related to net income are presented in conformity with U.S.
generally accepted accounting principles (“GAAP”) on an after-tax basis. All other discussions
are presented on a pre-tax GAAP basis, unless otherwise noted. Further, the Company notes
that it may make material information regarding the Company available to the public, from time
to time, via the Company’s Investor Relations website at
http://www.libertymutualgroup.com/investors (or any successor site).
The Company’s annual audited financial statements and the Report of Independent
Registered Public Accounting Firm on the Effectiveness of Internal Control Over Financial
Reporting are also published on the Company’s Investor Relations website at
http://www.libertymutualgroup.com/investors.

30