third quarter 2013 - catella.com · third quarter 2013 catella ab catella is an independent...
TRANSCRIPT
Third quarter 2013 Catella AB
Catella is an independent financial advisor and asset manager. We have a presence in 12 European countries and employ some 450 professionals. Catella has a strong offering in financial services through our business breadth. geographical diversity and leadership in the property sector.

2
The period in brief
Increased net sales and improved profit, in year-on-year terms Increased transaction volumes and net sales within
property advisory service Good earnings in the fund business The banking operations charged profit There is still work to be done to establish the bank
as a profitable niche player The initiatives to increase profitability and
efficiency is taking longer than expected
21 N OV E MB E R , 2013 C A T E LLA
* Operating profit before acquisition-related items and items affecting comparability. ** Profit before tax regarding 2012 is adjusted for items affecting comparability of SEK 34 M.
2013 2012 2013 2012SEK M Jul-Sep Jul-Sep Jan-Sep Jan-SepNet sales 259 231 689 689 Corporate Finance 112 100 252 266 Asset Management 150 134 442 426 Other -3 -3 -5 -3Operating profit/loss * 11 -1 -11 -13Profit/loss before tax ** 16 5 -8 11Employees at end of period - - 439 439

3
Income statement Group
21 N OV E MB E R , 2013 C A T E LLA
* Operating profit before acquisition-related items and items affecting comparability.
SEK M 2013 2012 2013 2012 2013 2012 2013 2012
Net sales 189 231 240 227 259 231 689 689Other operating income 4 3 6 4 1 4 11 12Total income 194 234 246 232 260 235 700 701
Direct assigment costs and commission -49 -50 -50 -60 -55 -57 -154 -166Operating expenses -179 -186 -185 -182 -194 -180 -557 -547Operating profit/loss * -34 -2 12 -10 11 -1 -11 -13
Depreciation of acquisition-related intangible assets
-1 -1 -2 -1 -2 -1 -4 -3
Items affecting comparability 0 0 0 0 0 -34 0 -34Operating profit/loss -36 -3 11 -11 9 -37 -16 -50
Financial income and expense - net -5 12 7 8 6 7 8 27Profit/loss before tax -41 9 17 -2 15 -30 -8 -23
Tax 1 -3 -6 0 -6 -2 -10 -5Net profit/loss for the period -39 7 11 -3 9 -32 -18 -28
9 MonthsQ1 Q2 Q3

4
Financial position per 30 September 2013
21 N OV E MB E R , 2013 C A T E LLA
* Cash and cash equivalents for the Group excluding Catella Bank are SEK 288 M as of 30 September 2013
2013 2013 2013 2013 2013 2013 2013 2013SEK M 30 Sep 30 Jun 30 Sep 30 Jun 30 Sep 30 Jun 30 Sep 30 Jun
Intangible assets 60 60 195 197 50 50 305 307Non-current securities 0 0 1 1 224 216 226 218Non-current receivables 7 8 299 309 40 39 346 355Other 8 9 61 60 0 0 69 69Current receivable and investments 99 105 496 535 -3 3 592 642Cash and cash equivalents * 78 59 1,787 1,840 49 59 1,914 1,958Total assets 253 240 2,838 2,942 360 368 3,452 3,550
Total Equity 155 133 569 577 183 186 906 896
Non-current liabilities 4 5 10 12 217 217 231 234Current liabilities 95 102 2,260 2,352 -40 -35 2,315 2,419Total liabilities 99 107 2,270 2,365 177 182 2,546 2,654
Total equity and liabilities 253 240 2,838 2,942 360 368 3,452 3,550
Equity/Asset ratio % 61% 55% 20% 20% 51% 51% 26% 25%
Corporate Finance Asset Management Other Group

5
0
100
200
300
400
500
600
2009 2010 2011 2012 2013
SEK M
-60
-40
-20
0
20
40
60
80
2009 2010 2011 2012 2013
SEK M
Corporate finance operating segment – Q3 2013
Increased transaction volumes and net sales within property advisory service The overall transaction market for property in
Europe, excluding the UK, increased 20% in year-on-year terms Increased access to capital and larger risk
appetite drives the market Property transactions where Catella served as
advisor totalled SEK 24.5 Bn (8.8), of which: France SEK 11.4 Bn Sweden SEK 7.9 Bn Catella decided to close its property advisory
services operation in Oslo because of poor profit performance in recent years. Norway remains a prioritised market Work on developing the German property
advisory services. Continued growth Growing demand for advisory services within
financial advisory services
C A T E LLA 21 N OV E MB E R , 2013
PROFIT/LOSS BEFORE TAX, ROLLING 12 MONTHS, PER QUARTER Q4 2011 – Q3 2013
NET SALES, ROLLING 12 MONTHS, PER QUARTER 2009 – Q3 2013

6
Income statement Corporate Finance
21 N OV E MB E R , 2013 C A T E LLA
* Operating profit before acquisition-related items and items affecting comparability.
2013 2012 2013 2012 Rolling 2012SEK M Jul-Sep Jul-Sep Jan-Sep Jan-Sep 12 Months Jan-DecNet sales 112 100 252 266 397 412Other operating income 1 2 5 4 8 7Total income 113 101 257 270 405 419
Direct assigment costs and commission -5 -10 -11 -22 -20 -30Income excl. direct assignment costs and commission 108 91 245 248 386 389
Operating expenses -87 -82 -243 -246 -347 -350Operating profit/loss * 22 9 2 2 39 39
Depreciation of acquisition-related intangible assets 0 0 0 0 0 0Items affecting comparability 0 0 0 0 0 0Operating profit/loss 22 9 2 2 39 39
Financial income and expense - net 0 -1 0 -2 0 -2Profit/loss before tax 22 8 3 0 39 37
Tax -4 -4 -5 -2 -18 -15Net profit/loss for the period 17 4 -2 -2 21 22Employees at end of period - - 216 212 - 212
3 Months 9 Months 12 Months

7
Asset management operating segment – Q3 2013 Volumes under management increased by SEK 2.5
Bn, from SEK 43.5 to 46.1 Bn. Net inflow was SEK 1.0 Bn
Property funds Volumes under management increased by 2%, from
SEK 19.5 to 19.8 Bn
Equity, hedge and fixed income funds Volumes under management increased by 5%, from
SEK 16.9 to 18.8 Bn Continued strong net inflows of just over SEK 0.8
Bn. The largest inflows was to fixed income and hedge funds
Wealth Management Volumes under management increased by 4%, from
SEK 7.1 to 7.4 Bn
21 N OV E MB E R , 2013 C A T E LLA
Broad-based asset management expertise with unique investment services

8
0100200300400500600700800900
2009 2010 2011 2012 2013
SEK M
-40-20
020406080
100120140
2009 2010 2011 2012 2013
SEK M
Cont: Asset management operating segment – Q3 2013
C A T E LLA 21 N OV E MB E R , 2013
PROFIT/LOSS BEFORE TAX, ROLLING 12 MONTHS, PER QUARTER Q4 2011 – Q3 2013 *
NET SALES, ROLLING 12 MONTHS, PER QUARTER 2009 – Q3 2013
* Profit/loss before tax for 2012 is adjusted for items affecting comparability of SEK -32 M
Fund operations Profit of SEK 19 M in the third quarter and
SEK 60 M for the nine-month period
Banking operations Loss of SEK 18 M in the third quarter and
SEK 45 M for the nine-month period Extensive and costly restructuring work: Create cost-effective wealth management Build greater capacity and infrastructure,
and adapt operations to new regulatory structures Enable growth in card and payment
operations – Business volumes increased in the third quarter
in quarter-on-quarter terms, but remain at historically low levels
Focus is on optimising existing payment flows The initiatives continues
9
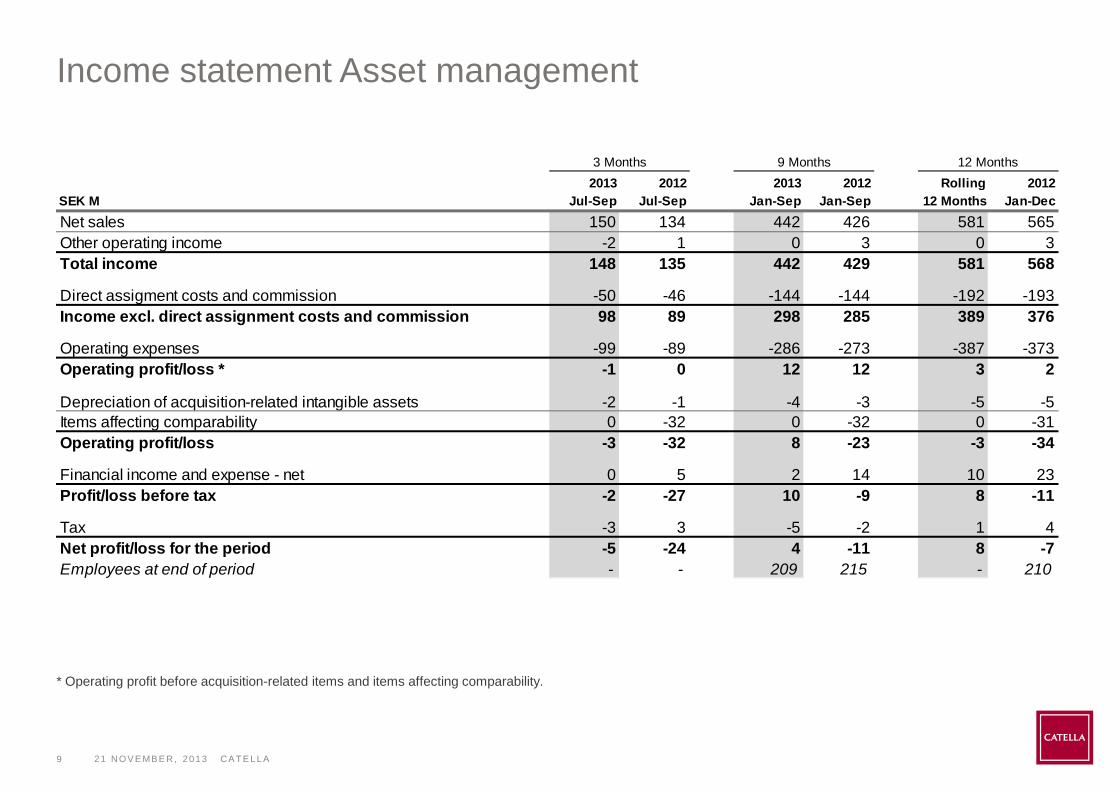
Income statement Asset management
21 N OV E MB E R , 2013 C A T E LLA
* Operating profit before acquisition-related items and items affecting comparability.
2013 2012 2013 2012 Rolling 2012SEK M Jul-Sep Jul-Sep Jan-Sep Jan-Sep 12 Months Jan-DecNet sales 150 134 442 426 581 565Other operating income -2 1 0 3 0 3Total income 148 135 442 429 581 568
Direct assigment costs and commission -50 -46 -144 -144 -192 -193Income excl. direct assignment costs and commission 98 89 298 285 389 376
Operating expenses -99 -89 -286 -273 -387 -373Operating profit/loss * -1 0 12 12 3 2
Depreciation of acquisition-related intangible assets -2 -1 -4 -3 -5 -5Items affecting comparability 0 -32 0 -32 0 -31Operating profit/loss -3 -32 8 -23 -3 -34
Financial income and expense - net 0 5 2 14 10 23Profit/loss before tax -2 -27 10 -9 8 -11
Tax -3 3 -5 -2 1 4Net profit/loss for the period -5 -24 4 -11 8 -7Employees at end of period - - 209 215 - 210
3 Months 9 Months 12 Months

10
Knut Pedersen new president and CEO 20 years of experience from the financial
sector, a solid international background and a strong leader profile Recent managing director at ABG Sundal
Collier in Sweden. Was also responsible for ABG’s global Markets unit He has previously worked for UBS, Nordea
and Öhman in various roles in Sweden and internationally Knut Pedersen will take up his post on 1
January 2014 Johan Ericsson will remain as president and
CEO until 1 January 2014 and will then continue in a senior operational role within Catella
C A T E LLA 21 N OV E MB E R , 2013

11
Financial calendar 2013/2014
Year-end Report, January-December 2013 21 February 2014 Annual Report 2013 25 April 2014 Interim Report January-March 2014 9 May 2014 Annual General Meeting 2014 22 May 2014 Interim Report January-June 2014 25 August 2014 Interim Report January-September 2014 7 November 2014 Year-end Report January-December 2014 19 February 2015
C A T E LLA 21 N OV E MB E R , 2013
12
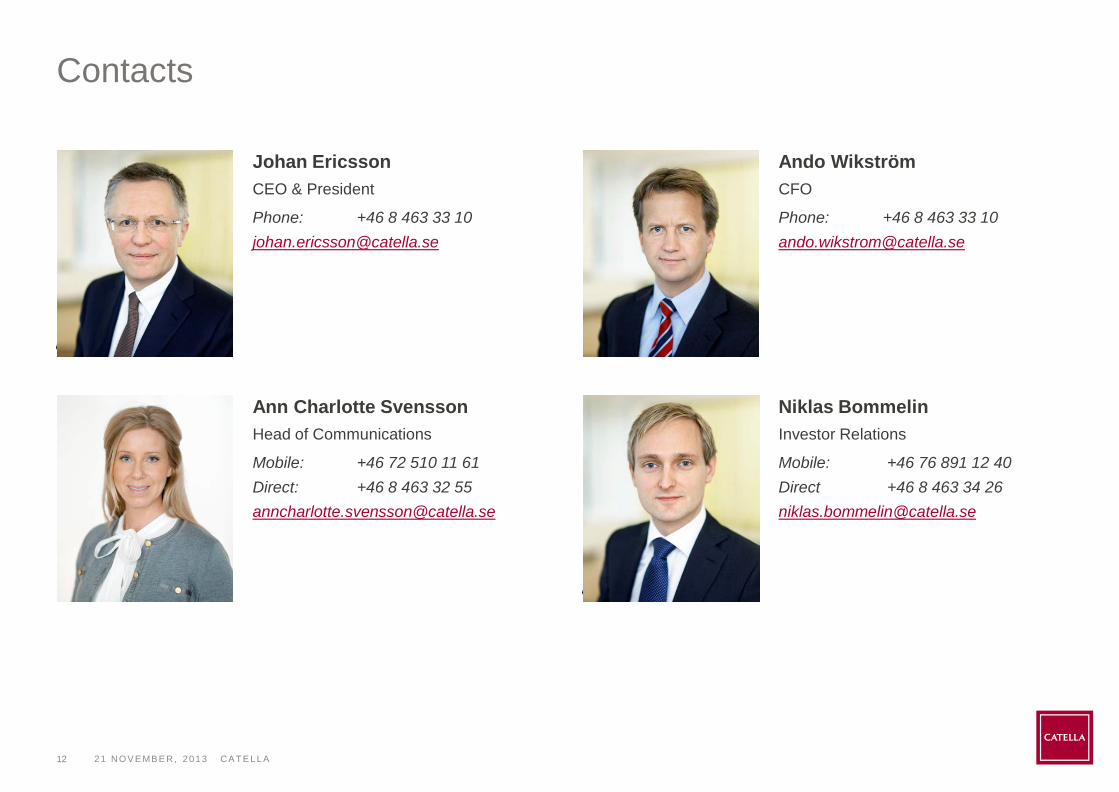
Contacts
Johan Ericsson CEO & President
Phone: +46 8 463 33 10 [email protected]
Ann Charlotte Svensson Head of Communications
Mobile: +46 72 510 11 61 Direct: +46 8 463 32 55 [email protected]
Ando Wikström CFO
Phone: +46 8 463 33 10 [email protected]
Niklas Bommelin Investor Relations
Mobile: +46 76 891 12 40 Direct +46 8 463 34 26 [email protected]
21 N OV E MB E R , 2013 C A T E LLA

Thank you!