thinking project management in the age of complexity
TRANSCRIPT
HAL Id: tel-00546695https://tel.archives-ouvertes.fr/tel-00546695
Submitted on 14 Dec 2010
HAL is a multi-disciplinary open accessarchive for the deposit and dissemination of sci-entific research documents, whether they are pub-lished or not. The documents may come fromteaching and research institutions in France orabroad, or from public or private research centers.
L’archive ouverte pluridisciplinaire HAL, estdestinée au dépôt et à la diffusion de documentsscientifiques de niveau recherche, publiés ou non,émanant des établissements d’enseignement et derecherche français ou étrangers, des laboratoirespublics ou privés.
Thinking project management in the age of complexity :particular implications on project risk management
Ludovic-Alexandre Vidal
To cite this version:Ludovic-Alexandre Vidal. Thinking project management in the age of complexity : particular impli-cations on project risk management. Business administration. Ecole Centrale Paris, 2009. English.�NNT : 2009ECAP0047�. �tel-00546695�

ÉCOLE CENTRALE DES ARTS ET MANUFACTURES
« ÉCOLE CENTRALE PARIS »
THÈSE présentée par
Ludovic-Alexandre VIDAL
pour l’obtention du
GRADE DE DOCTEUR Spécialité : Génie Industriel Laboratoire d’accueil : Laboratoire Génie Industriel SUJET :
THINKING PROJECT MANAGEMENT IN THE AGE OF COMPLEXIT Y.
PARTICULAR IMPLICATIONS ON PROJECT RISK MANAGEMENT. soutenue le : 18 décembre 2009
devant un jury composé de : M. Germain LACOSTE, INPT / ENSIACET Examinateur M. Rémy GAUTIER, Arts et Métiers ParisTech Rapporteur M. Didier GOURC, Ecole des Mines d’Albi-Carmaux Rapporteur M. Guy-Jacques BARLET, Alstom Transport Examinateur M. Jean-Claude BOCQUET, Ecole Centrale de Paris Directeur de thèse M. Franck MARLE, Ecole Centrale de Paris Co-encadrant de thèse 2009ECAP0047


A mon grand-père, Grégoire, parti un peu trop tôt.
A mes sœurs, Frédérique et Sabrina, à qui j’ai souvent pensé durant ce travail.
A Julien, sans le soutien (et les mélodies) de qui ce travail aurait été impossible.
Et surtout à mes parents, Jean-Paul et Bernadette, à qui je dois d’être qui je suis aujourd’hui.
Merci.


RemerciementsRemerciementsRemerciementsRemerciements
Ces remerciements sont assez longs, qu’on me pardonne. Certains y verront ma bonhommie,
d’autres y verront mon enthousiasme, d’autres y souligneront mon sentimentalisme et d’autres
enfin y repérerons ma propension naturelle à la démesure. Chers lecteurs, quoi que vous y voyez,
soyez certains qu’ils ne sont que le reflet sincère des petits instants de vie qui me reviennent en
pensant à mon travail de thèse de doctorat !
En premier lieu, je tiens à remercier M. Le Professeur Jean-Claude BOCQUET pour avoir accepté
de mettre son expertise scientifique, son énergie et son humour sans égal dans la direction de
cette thèse de doctorat. Ses précieux conseils et son ouverture d’esprit m’auront éclairé et permis
de prendre du recul tout au long de ce travail. Bill, j’ai à jamais un de tes tableaux chez moi !
Ces premiers remerciements trouvent pleinement leur sens en y ajoutant ceux adressés à M.
Franck MARLE, maître de conférences. Merci à lui pour ses compétences techniques et son
regard critique qui ont toujours su challenger mon travail et recadrer ma recherche. Merci à lui
pour son soutien, son sourire et son intelligence humaine, trois éléments grâce auxquels je suis
fier de dire aujourd’hui que de notre relation encadrant-doctorant sont nés un binôme solide de
collègues et une véritable relation amicale au fil des années…
Je tiens en second lieu à remercier le reste des membres de mon jury de thèse de doctorat. Tout
d’abord, les rapporteurs de ma thèse : M. Rémy GAUTIER, maître de conférences et M. Didier
GOURC, maître de conférences. Leurs connaissances et leur niveau d’exigence m’auront permis
de repousser mes limites dans la finition de ce travail de doctorat et je les remercie pour leurs
critiques constructives et leur regard toujours précis. M. Le Professeur Germain LACOSTE
m’aura fait quant à lui l’honneur de présider mon jury de thèse et je le remercie pour son
investissement dans ce travail. Enfin, je remercie M. Georges LABET pour son regard
expérimenté dans l’examen de mes travaux et M. Guy-Jacques BARLET pour son expertise, son
professionnalisme et son ouverture au moment de l’application industrielle de partie de mes
travaux.
Mes derniers remerciements liés au contenu scientifique / industriel de ma thèse de doctorat
s’adressent à M. Jean-Louis GIORDANO qui m’aura apporté le recul sur les sciences de la
complexité que lui auront apporté ses années de travail chez Renault. Mes remerciements
s’adressent aussi à l’ensemble des partenaires industriels de cette thèse et des participants à
l’étude Delphi menée dans le cadre de ce travail.

De plus, ces années au sein du Laboratoire Génie Industriel de l’Ecole Centrale Paris, qui ont
suivi ma scolarité en tant qu’élève ingénieur à l’Ecole, n’auraient pas été les mêmes sans les
relations que j’ai pu nouer avec nombre de mes collègues : s’ils y prêtent attention, ils pourront
voir qu’une partie de chacun d’eux peut se trouver quelque part dans cette thèse de doctorat.
Parmi eux, je tiens particulièrement à remercier :
• Sylvie GUILLEMAIN, ma maman du labo, qui m’aura rendu bien des services et avec qui
j’aurai tant partagé. Nous serons toujours unis par le pouvoir du 13 janvier !
• Corinne OLLIVIER, Carole STOLL et Anne PREVOT, trois complices à de multiples
niveaux et qui m’ont enlevé beaucoup d’épines du pied.
• Evren SAHIN et Yves DALLERY, deux soutiens, deux amis, deux pros ! Merci à vous
deux d’avoir été là durant ces années et bisous à Tom-Alexandre, qui porte un ravissant
prénom !
• Aude SCHINDLER, ma partenaire number one dans ces années de thèse. Deux parcours
qui se ressemblent : deux Centraliens, thésards au LGI, qui finiront par créer leur
entreprise, et qui auront pendant des mois fait retentir leur rire si particulier au
laboratoire ! Merci pour ta gentillesse et ta bonne humeur sans borne : ce n’est que le
début.
• Oualid JOUINI, mon co-bureau pendant des années, complice s’il en est ! T’es un chef et je
trouve que les théories dans lesquelles tu excelles sont décidément extraordinaires :-)
• Julie LE CARDINAL, pour nos collaborations, nos discussions et nos rires partagés !
• Annie-Claude et toutes ses collègues pour m’avoir toujours assuré un environnement de
travail confortable et avoir aussi déclenché de bonnes rigolades au son des Antilles !
• Leila BOUZAIENE-MARLE, Marija JANKOVIC, Chao FANG, Anne-Françoise
CUTTING-DECELLE, Asma GHAFFARI, Zied JEMAI, Céline GICQUEL, Chaaben
KOUKI, Emna BENZARTI, Angela MINZONI-DESROCHE, Wided SGAHIER, Marinita
SCHUMACHER, Abir FATHALLAH, Véronique EZRATTY, Myriam KAROUI, Brigitte
BONAN, Christophe DELAUNAY,… pour les échanges sympathiques et les fous rires que
nous avons pu avoir durant ces années !
• Et enfin les nombreux autres que j’ai la maladresse d’oublier alors que j’ai passé de très
bons moments avec eux… Sachez que votre nom peut-être absent de ces lignes par
mégarde, mais qu’il ne le sera pas de ma mémoire !
Enfin, si la bonne qualité de l’environnement professionnel est une condition nécessaire à la
poursuite agréable d’un travail de doctorat, celle de l’environnement personnel l’est tout autant. Il
est donc temps de remercier ces personnes de la sphère privée dont le soutien a aussi porté ce
travail :
• Mes amis des promos 2005 et 2006 de la formation ingénieur de l’Ecole Centrale, et en
particulier Françoise LY pour son indéfectible soutien et Alexandra PRIEUX pour sa
fidélité en toutes circonstances.

• L’ensemble des artistes avec qui je collabore dans mon autre vie. La magie de nos
collaborations et l’énergie de nos spectacles auront toujours alimenté le moteur du
créateur (chercheur ou artiste) qui vit en moi. Merci tout particulièrement à la troupe du
spectacle LE PRINCE ET LE PAUVRE, et plus spécifiquement à Caroline GAUDFRIN
(P2004), François BORAND, Jeanne REGGIANI, et Arnaud DELMOTTE qui ont été plus
au courant que d’autres des difficultés que j’ai pu rencontrer dans ce travail de thèse. Un
merci tout spécial s’adresse à d’autres amis artistes qui auront été des sources d’énergie
continuelles durant ces années : pour ne citer qu’eux, Fabrice TODARO, le frérot, Carole
CLIN, Charlotte FILOU, Michel FRANTZ, Anthony MICHINEAU et Matthieu D’AUREY
pour la dernière ligne droite.
• Un immense merci (et ces deux mots seront toujours trop faibles) s’adresse tout
naturellement à Julien SALVIA (P2006), mon complice ad vitam aeternam, ma moitié
créatrice. Toutes les chansons et tous les spectacles que nous avons écrits ensemble
durant ces années ont été autant de pierres sur lesquelles me reposer quand le courage
me manquait devant l’ampleur de ce travail de recherche. Je n’ai plus que six mots pour
toi : à nous de décrocher le ciel !
• Enfin, mes derniers remerciements (ne garde-t-on pas le meilleur pour la fin ?) s’adressent
à mes parents, Jean-Paul & Bernadette VIDAL, qui n’ont jamais cessé d’être présents
pendant ce travail de thèse, et pour ainsi dire, pendant toute ma vie. Ils m’ont donné
depuis ma plus tendre enfance le sens de l’émerveillement et m’ont inculqué des valeurs
essentielles : la curiosité, le respect, l’exigence et l’humilité. Ils sont donc en quelque sorte
et sans nul doute les premiers facteurs de réussite de ce doctorat ! Simplement merci…
Merci enfin à vous de me donner l’occasion de clôturer ces remerciements par les plus
beaux mots de la langue française : je vous aime.
Ludovic-Alexandre VIDAL


Table of contents PROLOGUE – OVERALL INTRODUCTION OF THIS WORK 1
CHAPTER I – BASICS ABOUT PROJECTS AND PROJECT MANAGEMENT THROUGH SYSTEMS THINKING 5
I.1. The increasing share of projects 6 I.2. Systems thinking 8 I.3. Describing projects 9
I.3.1. First level of description: project systems and their subsystems 9 I.3.2. Second level of description: the project activity system 10 I.3.3. Second level of description: the project management system 11
I.4. Underlining project specificities and their implication 11 I.4.1. Projects facing their temporariness 11 I.4.2. Projects facing their uniqueness 12
I.5. Conclusion 13
II. CHAPTER II – BUILDING UP A PROJECT COMPLEXITY FRAMEWORK 15 II.1. Introduction: the lack of consensus on complexity and project complexity 16 II.2. Identifying project complexity factors 20
II.2.1. Project complexity teleological and genetic aspects 21 II.2.2. Project complexity functional aspects 23 II.2.3. Project complexity ontological aspects 25 II.2.4. First version of the project complexity framework 27 II.2.5. Application of this framework 30 II.2.6. Case study: Renault Multi-Purpose Vehicle (MPV) development projects 32
II.2.6.i. Introduction 32 II.2.6.ii. Application for retrospective complexity analysis 34
II.3. Conducting a Delphi study to refine the framework 37 II.3.1. The Delphi methodology 37 II.3.2. Panel selection and survey scales definition 39 II.3.3. Results and discussion 39 II.3.4. Refining the project complexity framework 43
II.4. Conclusions and perspectives 44
III. CHAPTER III – MEASURING PROJECT COMPLEXITY 47 III.1. Introduction: the limits of existing project complexity measures 48 III.2. Exploring the evaluation of project complexity as a multi-criteria problem 51
III.2.1. Introduction 51 III.2.2. Requirements for a multi-criteria method to evaluate project complexity 51 III.2.3. Critical state of the art of multi-criteria decision-making methods 53
III.2.3.i. Elementary methods 53 III.2.3.ii. Multi-criteria optimization methods 53 III.2.3.iii. Outranking methods 54 III.2.3.iv. Single criterion synthesis approach method 54 III.2.3.v. Critical synthesis of the methods 55
III.3. Using the Analytic Hierarchy Process (AHP) to assess project complexity 57

III.3.1. The AHP methodology 57 III.3.2. Building up the hierarchical structure 59 III.3.3. Proposing a relative measure for project complexity 60
III.4. Sensitivity analysis 62 III.4.1. The AHP score reformulation 62 III.4.2. Overall gradient analysis 62 III.4.3. Deeper gradient sensitivity analysis 64
III.4.3.i. Sensitivity regarding criteria weights 64 III.4.3.ii. Sensitivity regarding sub-criteria weights 66
III.5. Case study 66 III.5.1. Introduction 66 III.5.2. Results and discussion 68
III.6. Conclusions and perspectives 73
IV. CHAPTER IV – UNDERSTANDING THE STAKES OF PROJECT COMPLEXITY. IMPLICATIONS ON PROJECT RISK MANAGEMENT 77
IV.1. Introduction 78 IV.2. Understanding the stakes of project complexity 79
IV.2.1. The consequences of project complexity 79 IV.2.1.i. Project ambiguity 80 IV.2.1.ii. Project uncertainty 81 IV.2.1.iii. Project propagation phenomena 81 IV.2.1.iv. Project chaos 82
IV.2.2. Project complexity and project risks 82 IV.3. Implications on project risk management 83
IV.3.1. Project risks 83 IV.3.2. State of the art on project risk management methodologies 84
IV.3.2.i. Project risk identification 86 IV.3.2.ii. Project risk analysis 87 IV.3.2.iii. Project risk response planning 88 IV.3.2.iv. Project risk monitoring and control 89
IV.3.3. Critical analysis of these methods and tools 89 IV.3.3.i. Overall synthesis of the methods 89 IV.3.3.ii. Issues regarding project risk identification 89 IV.3.3.iii. Issues regarding project risk analysis 91 IV.3.3.iv. Issues regarding project risk response planning, monitoring and control
91 IV.4. Conclusion: proposing research issues to integrate complexity aspects in project risk
management processes 92 IV.4.1. Project ambiguity: increasing one’s awareness 93 IV.4.2. Project propagation phenomena: understanding them better 93
V. CHAPTER V - A SYSTEMS THINKING-BASED APPROACH. FROM PROJECT
RISK MANAGEMENT TO PROJECT VULNERABILITY MANAGEMENT 95 V.1. Introduction: using a systemi approach to assist project risk management 96 V.2. The concept of project vulnerability 96
V.2.1. State of the art on the concept of vulnerability 96 V.2.1.i. Health 99 V.2.1.ii. Climatology and sustainable development 100 V.2.1.iii. Industrial engineering and project management 102

V.2.2. Synthesis of the characteristics of vulnerability 103 V.2.3. Defining the concept of project vulnerability 104
V.3. Proposal of a project vulnerability management process 107 V.3.1. Challenging the definition of a project risk 107 V.3.2. A methodology to model and manage project vulnerability 107 V.3.3. The project vulnerability identification step 109
V.3.3.i. Identification of vulnerable values, processes and elements 109 V.3.3.ii. Identification of process and elementary vulnerabilities 111
V.3.4. The project vulnerability analysis step 112 V.3.5. The project vulnerability response plan step 113 V.3.6. The project vulnerability monitoring and control step 115 V.3.7. Synthesis: comparison with the project risk management process 115
V.4. Case study : the FabACT project 116 V.4.1. Introduction 116 V.4.2. Results and discussion 119
V.4.2.i. Identification of project vulnerabilities 119 V.4.2.ii. Analysis of project vulnerabilities 123 V.4.2.iii. Vulnerability response plan 124 V.4.2.iv. Comparison with a traditional risk management process 124
V.5. Conclusions and perspectives 125
VI. CHAPTER VI - AN ANALYTICAL APPROACH – INTERACTIONS-BASED CLUSTERING AND OTHER TOOLS TO ASSIST COMPLEX PROJECT RISK MANAGEMENT 129
VI.1. Introduction 131 VI.2. Identifying and measuring project risk interactions 132
VI.2.1. Defining project risk interactions 132 VI.2.2. Claiming for the conjoint use of graph theory and the Design Structure Matrix
(DSM) approach 133 VI.2.2.i. Graph theory elementary tools and definitions 133 VI.2.2.ii. The DSM approach 134
VI.2.3. Building up the Risk Structure Matrix (RSM) 135 VI.2.4. Building up the Risk Numerical Matrix (RNM) 137 VI.2.5. Direct use of these matrices as an assistance to project risk management 139
VI.2.5.i. Identifying project risk loops 139 VI.2.5.ii. Studying the possible propagation of a project risk 139
VI.3. Interactions-based clustering of project risks 141 VI.3.1. Problem definition 141 VI.3.2. State of the art on graph partitioning and clustering 141
VI.3.2.i. Vertex similarity-based criteria and methodologies 142 VI.3.2.ii. Cluster fitness measure-based criteria and methodologies 142
VI.3.3. Problem formulation as a linear programming model 143 VI.3.4. Discussing the invariance of the results 145 VI.3.5. Proposals of approximate iterative algorithms 147 VI.3.6. Refining solutions through similarity-based clustering 148 VI.3.7. Looking at this issue through the eyes of the connectivity concept 149 VI.3.8. Proposing performance measures for these algorithms 150
VI.4. Case studies 151 VI.4.1. A stage musical production project 151
VI.4.1.i. Introduction 151

VI.4.1.ii. Results and discussions 152 VI.4.2. The case of a large infrastructure project 156
VI.4.2.i. Introduction 156 VI.4.2.ii. Results and discussions 160
VI.5. Conclusions and perspectives 164
EPILOGUE – OVERALL CONCLUSION OF THIS WORK 167 PUBLICATIONS LIST 173 FIGURE LIST 175 BIBLIOGRAPHY 179

- 1 -
ProloguePrologueProloguePrologue
Overall introduction of this workOverall introduction of this workOverall introduction of this workOverall introduction of this work A project is a temporary and unique endeavour undertaken to deliver a result. This result is
always a change in the organization, whatever it is in its processes, performance, products or
services. This transformation consists then in a gap between a start and a final state. Time and
resources are consumed to produce results, which may be deliverables and/or performance
improvement and/or resource improvement (skills, knowledge). Each project is unique because
there is always at least one of the following parameters that changes: targets, resources and
environment. As projects became more and more present into organizations, and as they had
bigger and bigger amounts at stake, it became impossible to let them live without specific and
rigorous methodology. As a consequence, project management was created as a formalized and
structured methodology. It is usually admitted than modern project management appeared
during World War II and was initially dedicated to big military and construction projects.
For all practical purposes, lots of studies have been done, based on statistical calculations or
surveys. Limits and lacks have been detected in research as well as in industry about the project
predictability, since usual parameters (time, cost and quality) are clearly not sufficient to describe
properly the complete situation at a given time. As a whole, the conclusion of these studies is that
current methods have shown their limits, since they cannot face anymore the stakes of ever
growing project complexity. For instance, as noted during discussions with consulting
practitioners, in the case of oil industry, it is clear that engineering projects today are larger,
involve more sophisticated technology and are organised with a higher number of contractors and
partners compared to 40 years ago. As a whole, project complexity results in damages or failures
for the projects. In other words, project ever growing complexity is an ever growing source of
project risks.
This Ph.D. thesis thus aims at addressing this issue by answering the following principal
research questions (which will find their justifications thanks to the states of the art which was
performed throughout the different chapters).
� What is project complexity? What are its characteristics and sources? How can it be
described?
� In order to manage, one needs to measure. The question is then how can project
complexity be measured to assist decision-making in complex project management?

- 2 -
FFFFigure igure igure igure 1111. Overall structure of this Ph.D. thesis. Overall structure of this Ph.D. thesis. Overall structure of this Ph.D. thesis. Overall structure of this Ph.D. thesis

- 3 -
� What are the stakes of project complexity? What are its implications on project risk
creation? What are the lacks of traditional project risk management methodologies
regarding the integration of complexity?
� Can innovative methodologies and tools be developed to integrate better complexity
related aspects into project risk management? Can these innovative approaches, whether
systemic or analytical, permit to assist complex project risk management?
In order to answer these questions, this Ph.D. thesis is structured as seen before (Figure 1). This
structure corresponds to a way to explore the different aspects of this thesis and tries to bring
clarity in how to understand and handle project complexity.
Each chapter makes the point of a specific introduction to a more detailed problem setting which
permits to explicit better the overall research questions of this Ph.D. work.
Chapter 1 Chapter 1 Chapter 1 Chapter 1 –––– Basics about project and project management through systems thinkingBasics about project and project management through systems thinkingBasics about project and project management through systems thinkingBasics about project and project management through systems thinking
Chapter 1 permits to explore the basics of project management in order to set up definitions,
describe what a project is and underlines the specificities of project so that no confusion is made
throughout the Ph.D. thesis. It also underlines how projects can be considered as complex
systems.
Chapter 2 Chapter 2 Chapter 2 Chapter 2 –––– Building up a project complexity frameworkBuilding up a project complexity frameworkBuilding up a project complexity frameworkBuilding up a project complexity framework
Chapter 2 proposes the construction of a standard project complexity framework as a basis for the
identification of project complexity sources. An international Delphi study permits to draw some
conclusions on project complexity and refine the framework for future use. Application is
proposed to former vehicle development projects at Renault.
Chapter 3 Chapter 3 Chapter 3 Chapter 3 –––– Assessing project complexityAssessing project complexityAssessing project complexityAssessing project complexity
Chapter 3 claims for the use of a multi-criteria approach to evaluate project complexity. An AHP
hierarchical structure is built up thanks to the refined framework which is elaborated in Chapter
2. The practical use of such a measure is discussed. Application is proposed to a project portfolio
in a start-up firm within the stage musicals production industry.
Chapter 4 Chapter 4 Chapter 4 Chapter 4 –––– Understanding the stakes of project complexity. Implications on project risk Understanding the stakes of project complexity. Implications on project risk Understanding the stakes of project complexity. Implications on project risk Understanding the stakes of project complexity. Implications on project risk
management.management.management.management.
Chapter 4 permits to underline the consequences of project complexity in terms of ambiguity,
uncertainty, propagation and chaos. Implications on project risks are underlined and limits of
conventional project risk management methodologies are exposed.

- 4 -
Chapter 5 Chapter 5 Chapter 5 Chapter 5 –––– Systemic approach. From project risk management to project vulnerability Systemic approach. From project risk management to project vulnerability Systemic approach. From project risk management to project vulnerability Systemic approach. From project risk management to project vulnerability
managmanagmanagmanagement.ement.ement.ement.
Chapter 5 proposes a systems thinking- based approach around the concept of project
vulnerability. It depicts the process of project vulnerability management around several steps and
shows how vulnerability can help to highlight the existing weaknesses of a project system.
Application is proposed to a software development project within the healthcare industry.
Chapter 6 Chapter 6 Chapter 6 Chapter 6 –––– Analytical approach. InteractionsAnalytical approach. InteractionsAnalytical approach. InteractionsAnalytical approach. Interactions----based clustering and other tools to assist project based clustering and other tools to assist project based clustering and other tools to assist project based clustering and other tools to assist project
risk managementrisk managementrisk managementrisk management
Chapter 6 proposes an analytical approach to permit a better integration of complexity in project
risk management processes. By introducing risk interactions and building up a project risk
network, risk propagation is studied thanks to matrix representation and its associated
indicators. An innovative approach to cluster risks according to their possible interactions is
finally proposed as a tool to assist complex project risk management. Application is proposed to a
project in the stage musicals production industry and to a large infrastructure project (a tramway
infrastructure).
EpilogueEpilogueEpilogueEpilogue
This Ph.D. thesis then draws a brief synthesis of this research work. It highlights how this work
proposes some answers to the research questions which have been raised. It finally proposes a
possible integration of all results and possible research perspectives.

- 5 -
Chapter I - Basics about project and project management through systems thinking
Abstract
The overall ambition of this chapter is to be a prologue for this Ph.D. thesis thanks to the
introduction of the main, though sometimes basic, concepts about projects and project
management which are likely to be used throughout this thesis.
In order to present them, we however propose to use an innovative approach to highlight
them. By following a systems thinking-based approach, we aim at being complete about the
description of projects, underlining what a project is, what it is composed of, what it performs
during its execution, what its objectives are,
This chapter also underlines project specificities (notably compared to other
organisational systems), mainly in terms of uniqueness and temporariness, and what this implies
on project management and its complexity.
This chapter is thus to be the necessary basis to explore projects as complex systems.
Chapter Keywords
Project, Project Management, Systems, Systems Thinking, Uniqueness, Temporariness.

- 6 -
I.1. The increasing share of projects
Broadly, the activity of an organisation (a firm, an association, a non-profit organisation, etc…)
can be divided into two main categories: operations and projects. Operations involve repetitive
and ongoing activities, such as production, whereas projects are in essence unique and one-shot
initiatives. As for them, as highlighted by (Schneider, 2008), “projects are the microcosm where
different functions, management levels, and professional backgrounds, with their respective
worldviews, collide”. Examples of projects can be the following ones:
• Developing and launching new products (product development projects).
• Designing new organisations (organisation projects).
• Improving existing processes within a firm (process improvement projects).
• Staging a play (event project).
• Searching for an innovative process, product, or material (R&D projects).
• Developing a new software (IT projects).
• Constructing a building (construction projects).
As Shenhar and Dvir underline it (Shenhar and Dvir, 2007), “with high demand for growth and
innovation, the share of operations in most organizations is declining and the share of projects is
on the rise”, as shown on Figure 2. As they explain it, this trend is present in almost every
organization and industry since “the only way organizations can change, implement a strategy,
innovate, or gain competitive advantage is through projects”.
Figure 2. The increasing share of projects (Shenhar and Dvir, 2007)
However, when most of firms or organisations have kept on improving their operations (through
theories and concepts such as lean manufacturing or six sigma), despite the fact that projects
have been encountered everywhere, few organisations have been paying as great attention to
their projects. But, “no business enterprise can survive if it is focused only on improving its
operations” (Shenhar and Dvir, 2007). As a consequence, focusing on projects, focusing on
innovative, efficient and effective approaches to manage them is to create great value for modern
organisations.

- 7 -
That is why this Ph.D. thesis concentrates on projects and project management, particularly
focusing on the phenomenon of project complexity and its implications on project management
and project risk management. Before carrying out any pertinent research on the subject, one is
first to define properly what a project is (and also what project management is). Basically, a lot of
definitions do exist, as highlighted in (AFNOR, 2004), (Marle, 2002), (Gautier, 2004) for instance.
This work is based on the Project Management Institute (PMI) definition (PMI, 2004):
Definition – adapted from (PMI, 2004)
A project in an organisation is a temporary endeavour undertaken to deliver a result.
As mentioned before, this result is always a change in the organization, whatever it is in its
processes, performance, products or services. This transformation consists then in a gap between
a start and a final state. Time and resources are consumed to produce results, which may be
deliverables and/or performance improvement and/or resource improvement (skills, knowldege).
Each project is unique because there is always at least one of the following parameters that
changes: targets, resources and environment. As projects became more and more present into
organizations, and as they had bigger and bigger amounts at stake, it became impossible to let
them live without specific and rigorous methodology. As a consequence, project management was
created as a formalized and structured methodology. It is usually admitted than modern project
management appeared during World War II and was initially dedicated to big military and
construction projects, when the first principles of organization, planning, and overall
management were proposed. Project management has then grown up and spread around the
world to become what it is today, that is to say a set of theories, principles, methodologies and
practices (WBS -Work Breakdown Structure, PERT -Progamme Evaluation and Review
Technique- networks, etc…), sometimes included in a standard body of knowledge such as PMI
(PMI, 2004) and IPMA (IPMA, 2006). However, there can still be some lack of consensus on the
definition and description of projects as well as their objectives, processes and elements.
PROBLEM SETTING OF THIS CHAPTER
As a consequence, this chapter proposes to use a systems thinking-based approach to describe
projects. This description is not innovative in its content as it is notably based on a state of the art
on traditional project management standards (notably (PMI,2004)), but it permits a
reorganization of information which is driven by project final objectives in terms of values
creation. The ambition of this prologue chapter is thus to
• Describe project systems and their main subsystems (activity system, management
system).
• Underline the specificities of projects (uniqueness and temporariness) and their
implications on project management.
These points are going to be the basic concepts which are references for this Ph.D. thesis.

- 8 -
I.2. Systems thinking
In order to do so, this Ph.D. thesis claims for the use of systems thinking to explore the
description of projects. Basically, our systems thinking-based approach is notably based on or at
least consistent with the works of (Boulding, 1956), (Simon, 1968), (Von Bertalanffy, 1972), (Le
Moigne, 1990), (Penalva, 1997), (Heylighen and al., 2006), (Bocquet and al., 2007), (Schindler and
al., 2007) or (Vidal and al. 2007). This Ph.D. work considers the following definition of a system.
Definition - adapted from (Vidal and al., 2007)
A system can be defined as an object, which, in a given environment, aims at reaching some
objectives (teleological aspect) by doing an activity (functional aspect) while its internal structure
(ontological aspect) evolves through time (genetic aspect) without losing its own identity.
According to this definition, a project can be undoubtedly considered as a system. Indeed, it
possesses the four aspects listed above. A project exists within a specific environment and aims at
reaching objectives given this context (teleological aspect). A project has to accomplish a network
of activities using some methods and methodologies (functional aspect). A project has an internal
structure composed of resources, deliverables, tools, workers, etc… (ontological aspect). Finally, a
project evolves through time, via resource consumption, product delivery, members’ changes and
gain of experience, without losing its own identity (genetic aspect). In the systems thinking
vision, the project system evolution is to be considered with the assumption that future is under
perpetual construction (Prigogine, 1996), which excludes the use of analytical tools. In order to
provide innovative practical tools for complex project management, this Ph.D. work is to claim for
the use of a shared epistemology which permits to define, when necessary, methods and tools
based on analytical decompositions, but which use or are at least compatible with the systems
thinking-based vision of projects as four aspect entities.
Figure 3. A systems thinking-based approach to describe projects

- 9 -
We firstly do so in this chapter as it claims for the use of a systems thinking-based organisation
design methodology, SCOS’D (Bocquet and al., 2007), (Schindler and al., 2007), meaning
Systemics for Complex Organisational Systems Design, in order to describe project systems. In
essence, this method calls for the description or design of organisational systems thanks to a four
step process which consists in:
• The identification of the system’s phases. (Genetic pole)
• In each phase, the identification of its goals and targets in terms of value creation (due to
the expectations and constraints of the project environment, clients and stakeholders)
(Teleological pole).
• For each value, the identification of the tasks and processes which are to be performed in
order to reach the project objectives in terms of values creation (Functional pole).
• For each task or process, the identification of the elements which are needed to perform
them, that is to say actors, resources, and any other inputs. (Ontological pole)
• A feedback loop can be performed in order to check that the supposed phases of the
project system are consistent with the evolution of the obtained system. This is notably to
ensure the robustness of the whole approach.
We claim for the use of these principles to describe project systems in order to ensure the
robustness of their description. These principles (which are in essence at the edge of systems
thinking and analytical decompositions) will also be used in other parts of this Ph.D. thesis,
especially in Chapters 2 and 5.
I.3. Describing projects
I.3.1. First level of description: project systems and their subsystems Basically, traditional approaches of project management consider that a project system evolves
over time according to five principal phases (genetic aspect), which are:
• Project initiation (including pre-contract and contract elaboration processes).
• Project planning (in terms of budget, resource allocation, time planning, etc…)
• Project execution (to create project deliverables)
• Project monitoring and control (to watch over the project correct execution)
• Project closure (to end the project correctly after completion)
In order to describe the entire reality of projects, a systems approach should be carried out for any
of these phases. In this paragraph, we propose to concentrate only on the phases of project
execution and project monitoring and control in order to highlight the existence of two
subsystems: the project management system and the project activity system. Another system, the
project information system, though existing (as in the canonical decomposition of Le Moigne (Le
Moigne, 1990), is not highlighted here (and it will not be addressed in this Ph.D. work). This is
consistent with other systems thinking oriented ones (Gourc, 1997), (Stal Le Cardinal, 2000),
(Marle, 2002), (Jankovic, 2006). We now propose to apply the SCOS’D process for project systems.

- 10 -
During these phases, the targeted values (teleological pole) of the project system are to be
notably:
• The quality of project deliverables.
• The cost of the project (keeping it under a certain value), and thus the profit obtained
from the project.
• The time to complete the project (target is to close the project at a certain date D).
• The quality of project management processes.
• Other performance values such as societal or environmental values.
The three first proposed values (Giard, 1991) constitute the so-called triple constraint or iron
triangle (Atkinson, 1999). Deviations from this triangle are undoubtedly seen as a negative sign,
which must be prevented or corrected. The organisation’s management board (which is part of a
more global governance system) is to require high standard project management processes in
order to guarantee as much as possible the success of their projects. Modern projects also tend to
include other performance values to judge of the success of a project such as societal or
environmental values as mentioned hereinbefore. That is why the former bulleted list of project
values is proposed.
So that it can reach the objectives of values creation, a project is to perform a lot of activities
during these phases. The identification of theses activities permits to underline the existence of
two sub-systems within a project system: the project activity system and the project management
system.
The two next sections explore respectively the description of the project activity system and the
project management system. The ambition of this description is not to be exhaustive, but to be set
up in all minds what a project within an organisation is.
I.3.2. Second level of description: the project activity system The project activity system is expected to:
• Deliver a final product, service, deliverable which corresponds to the expectations of the
project’s client(s).
• More generally, create performance values (particularly industrial, societal and
environmental) as expected by the project management system and the organisation’s
management.
• Deliver a regular activity reports and results (regarding the targeted project objectives) to
the project management system.
• Share a vision of the project which is consistent with its objectives and with the strategic
objectives announced by the organisation’s management.
The project activity system must work, knowing that:
• The project management system gives information, previsions and objectives to it.
• The organisation’s management gives to it a set of values and a strategic vision to cling to.

- 11 -
• The other project activity systems existing within the organisation may be compared to it,
notably in terms of performances and outcomes.
As a whole, the project activity system must therefore perform efficient and effective processes in
order to meet the achieve these seven last points. These ones are to be performed thanks to
project resources (material, machines, etc…), project actors and other inputs (information, etc…),
which constitute the core elements of the project activity system.
I.3.3. Second level of description: the project management system
As for it, the project management system is expected to:
• Define the project objectives over time as the project activity system needs them.
• Make decisions to reach these objectives as the project activity system needs them.
• Measure and monitor regularly the project, notably in terms of advancement reaching its
final performances targets regarding values creation.
• Communicate regularly with the organisation’s management on the project advancement
thanks to the delivery of regular project reports and reviews.
• Be consistent with the strategic vision of the organisation’s management.
• Deliver regular project management reports and indicators.
The project management system must work, knowing that:
• The activity system gives to it regular project activity reports and results.
• The organisation’s management gives to it a strategic vision and objectives to
communicate to the project activity system.
• The other project management systems existing within the organisation may be compared
to it, notably in terms of performances and outcomes.
As a whole, the project activity system must therefore perform efficient and effective processes in
order to achieve these nine last points. These ones are to be performed thanks to project
resources, project actors and other inputs which are often gathered into a project steering
committee. The reader should note that actors may be present into the activity and management
subsystems.
I.4. Underlining project specificities and their implications
I.4.1. Projects facing their temporariness
In essence, a project is temporary, which means that is expected to have a start date and a finish
date. This implies that projects have a temporary existence within organisations. As highlighted
by several research works (Lundin, 1995), (Packendorff, 1995), (Turner and Müller, 2003), this
results in several implications:
• First, the projects which exist in an organisation are themselves forms of temporary
organisation which have to coexist with the permanent entities of the organisation in

- 12 -
which it is executed. This coexistence may imply difficulties in managing the
interdependencies between projects and permanent entities, such as when dealing with
the question of scheduling or resource attribution.
• Moreover, temporariness implies that objectives are to be met under a certain constraint
of time, which is to add pressure in a project. There is consciousness of a short, or at least,
limited duration / lifetime of the project system, which means that project member are
aware of the future termination of their coexistence within the system. Depending on
one’s culture or character, this notably often results in lower or higher implication in the
structure. This also often implies a longer time for people to feel they belong to a same
project team / system.
• Finally, temporariness evokes therefore a non-routine process and/or a non-routine
product/service. This non-routine aspect, which makes project management even more
complex, is even more highlighted by the project uniqueness.
I.4.2. Projects facing their uniqueness
Indeed, a project is in essence unique. This means that, due to their own characteristics and
context, projects are all different. Two projects with the same objectives, processes and resources,
but which do not start at the same date can for instance be very different because of their own
specific context.
The implication of this uniqueness is that, contrary to operations (which are in essence
repetitive), no standard methodology or calculation can be handled without paying particularly
great attention to the specific context and characteristics of the project. Projects are thus more
difficult to manage and project performance is all the more difficult to optimise since this absence
of repetition implies that no lessons learned can be directly reused in an absolute manner for the
future.
The value of lessons learned in project management is an issue the importance of which has been
highlighted by several researchers, such as (Pritchard, 1997), (Schindler and Eppler, 2003),
(Aiyer and al., 2005) or (Besner and Hobbs, 2006). Shenhar (Shenhar, 2007) stresses that no “one
size fits all” which would consist in the use (though correct) of standard project management tools
can be applied to project management due to the core uniqueness of any project. Actually, the
systematic application of such standard tools, if not adapted to a specific project context, may lead
to project failure. But the fact is that projects need to use lessons learned so the organisation does
not reinvent the wheel at each new project start (Newell, 2004). That is why, even though not
addressing this issue deeper in this Ph.D. thesis, it claims for efficient and proactive learning
processes as well as clear project governance and management systems support in order to learn
lessons and use them in the future to assist complex project management (Trevino and
Anantatmula, 2008).

- 13 -
I.5. Conclusion
Project systems are as a whole temporary and unique organisations within larger organisations
which aim at creating business results and other values thanks to their execution. The use of
systems thinking to describe project proves us that projects are composed of many diverse
elements which interact along processes in order to deliver these targeted created values. Project
systems in the end appear to be technological and organisational systems, the characteristics of
which (notably temporariness and uniqueness which have been underlined as project definition-
driven characteristics) make it all the more complex to manage.
This issue of the complexity of project systems is therefore to be addressed in this Ph.D. thesis.
That is why, keeping in mind the principles of systems thinking, the two following chapters
concentrate on the two following issues:
• Project complexity definition, identification and categorization into a framework thanks to
the conduction of a broad state of the art and an international Delphi study (Chapter 2).
• Project complexity measure in order to highlight particularly complex projects within a
portfolio, or project zones within a project (Chapter 3).

- 14 -

- 15 -
Chapter II. Building up a project complexity framework
Abstract
The overall ambition of this chapter is to define and understand what project complexity
is, despite the lack of consensus on this issue in the literature. In addition to the traditional
project management methodologies, we argue for a conjoint paradigm shift which claims for
project management through a complex system-oriented view. Identifying project complexity
sources is then all the more interesting since it can have direct implications on project
management. Understanding better the manifestation of project complexity is understanding
better how complex projects can be managed.
This chapter permits to describe better what project complexity is thanks to the
elaboration of a standardized framework, which consists in a 2×4 table. First, two kinds of project
complexity are considered: organisational complexity and technological complexity. Moreover,
four groups of project complexity factors are studied: project size factors, project variety factors,
project interdependency factors and project context-related factors. This first version illustrates
that organisational complexity is likely to be the greatest source of complexity in projects (given
the number of identified sources). In order to illustrate the direct application and benefits of this
framework to highlight industrial project complexity sources in fieldwork, the multi-purpose
vehicle development projects within the firm Renault (Espace, Twingo, Scenic, Modus) are partly
analysed regarding this framework. Such analysis permits to claim for the use of this complexity
factors framework as a check-list when executing a project.
However, due to the quite large size of this framework, an international Delphi study has
been conducted over 38 international academics and industrials. This survey permitted us not
only to refine the framework but also to draw interesting conclusions both on project complexity
and on the perception of this concept within the interrogated population.
Chapter Keywords
Project, Complexity, Framework, Delphi methodology, Expert judgement.

- 16 -
II.1. Introduction – The lack of consensus on complexity and
project complexity Complexity is everywhere and is continuously growing. Research works on the concept of
complexity have been conducted for years and have produced some interesting results and
notions. There are historically two main scientific approaches of complexity (Schlindwein and
Ison, 2005). The first one, usually known as the field of descriptive complexity, considers
complexity as an intrinsic property of a system, a vision which incited researchers to try to
quantify or measure complexity. An example of this vision is the work of Baccarini (Baccarini,
1996). He considers project complexity through the concepts of technological complexity and
organisational complexity. He regards them as the core components of project complexity which
he tries to describe exhaustively. The other one, usually known as the field of perceived
complexity, considers complexity as subjective, since the complexity of a system is improperly
understood through the perception of an observer. Both approaches can apply to project
complexity and project management complexity. For all practical purposes, a project manager
deals with perceived complexity as he cannot understand and deal with the whole reality and
complexity of the project. We do aim at creating a link between those two traditional visions of
complexity. Knowing that one tries to cope with perceived complexity, this research work aims at
bridging the gap between perceived complexity and real complexity by defining, describing and
modelling better real project complexity. The definition and identification of a list of project
complexity factors which could be used as a check-list for instance may then permit to
complement one’s perception and intuition when analysing the complexity of a given project. This
new frame of reference would then enable anyone who shares this representation to talk about
project complexity with less ambiguity (due to their own perception).
The difficulty is that there is actually a lack of consensus on what project complexity really is. As
Sinha and al. (Sinha and al., 2001) underline it, “there is no single concept of complexity that can
adequately capture our intuitive notion of what the word ought to mean”. Complexity can be
understood in different ways, not only in different fields but has also different connotations
within the same field (Morel & Ramanujam, 1999). However, Edmonds (Edmonds, 1999) proposes
an overview of the concept of complexity within different fields and finally tries to give a generic
definition of what complexity is: “Complexity is that property of a model which makes it difficult
to formulate its overall behaviour in a given language, even when given reasonably complete
information about its atomic components and their inter-relations”. This definition, which is quite
appropriate to encompass all the aspects of project complexity, emphasises that complexity is
generally related to the way the project system is modelled. To some extent, the model is the first
layer of project perception, the second layer being the perception when understanding the project
model.

- 17 -
Other attempts to describe and define complexity exist in the literature. Karsky (Karsky, 1997)
considers three kinds of complexity:
• The first one, spatial complexity, is the structural complexity of a system, in terms of the
number and variety of elements and their interrelations.
• The second one, unpredictable complexity, refers partially to chaos, fluctuations and
bifurcations, considering that the behaviour of a system is in essence unpredictable since
it is characterized by non-trivial non-linearity, an aspect emphasized by Prigogine
(Prigogine, 1996).
• Finally, the third one, dynamic complexity, considers that no one is able to analyse,
understand and assess efficiently the evolution of a system, due to the presence of
interrelations and positive or negative feedback loops.
These three kinds of complexity do exist in project management. Spatial complexity is created by
the number and variety of project resources, actors, tasks, processes, etc… and can notably be
shown through simple models (such as the Work Breakdown Structure which permits to define
and group a project’s tasks in order to help to define the project scope). Unpredictable complexity
is notably due to the fact that a project is an organisation including people: by their actions,
decisions and behaviours, they involve non-trivial non-linearity in the system. Finally, dynamic
complexity can be shown for instance through models of a projects such as PERT (Project
Evaluation and Review Technique) networks (including interrelations and loops) which permit to
analyse and represent the tasks that must be completed to achieve a given project.
On his side, Biggiero (Biggiero, 2001) analyses the sources of complexity in human systems and is
thus relevant for projects. He identifies six classes of complexity:
• The first one is the logical complexity referring to the non-simultaneity of the properties of
coherence and completeness of any formal system: for all practical purposes, it means that
the understanding of a coherent system is to remain incomplete.
• The second one is relational complexity when interactions occur between observers and
shape their communication.
• The third one is gnosiological complexity which underlines the fact that no observer can
completely perceive all the information a system and its environment contain.
• The fourth one is semiotic complexity, this one referring to the ambiguity of information
due to subjectivity.
• The fifth one is chaotic complexity, which is related to disorder, emergence, bifurcations
and unpredictability as very small errors at the beginning can largely amplify until the
final outcomes are produced.
• Finally, the sixth and last one is the computational complexity, which is very similar to the
complexity of the algorithms.
Each of these classes of complexity can once again apply to projects and project management.
Indeed, logical complexity is to be faced when working on any project model since the coherence of
this model implies the incompleteness of its understanding. A project faces relational complexity

- 18 -
between team members, shareholders, steering committee members and whatnot. Gnosiological
and semiotic complexity are very close to the considerations around perceived complexity, i.e.
inability to perceive the whole reality and ambiguity of the perceived information. Chaotic
complexity is also present in projects since very small errors for inputs can give very large errors
for outputs. Finally, computational complexity is found when formulating some project issues
such as the scheduling problem.
As for him, Genelot (Genelot, 2001) considers complexity as one of the greatest stakes of today’s
management, and thinks it should be understood at three different levels:
• The first level, real complexity, consists of internal characteristic of a system.
• The second level, perceived complexity, consists of one’s representation and model of the
system.
• The third level is the feedback on the real system of the actions decided thanks to the
system’s representation.
In this case, real project complexity is very close to the notion of structural project complexity and
is an absolute property of the project system. Perceived complexity is what we have already
discussed before. The third aspect of retroaction on reality is present in the case of project
management since a project manager uses for instance some models to make some decisions for
the project.
Genelot defines a complex phenomenon as a phenomenon that cannot be understood and totally
kept under control, emphasizing that complexity manifests itself at the three above-cited levels.
In the end, he insists on the fact that anyone should keep in mind that being complex is in
essence different from being complicated and that confusion must be avoided between these two
different notions: a complicated phenomenon can always be understood and kept under control
thanks to work, expertise and computation.
On the contrary, when some aspects of complexity tend to be understood and controlled by an
observer, then other aspects of complexity do appear, so that it can never be neither understood
nor controlled. Ulrich and Probst (Ulrich and Probst, 1988) also insist on the difference between
the terms complicated and complex, categorizing systems in four families in terms of structural
complexity: simple systems, complicated systems, complex systems and very complex systems (see
Figure 4). According to this classification, projects are to be considered as very complex systems
since they are composed of a large number of differentiated elements that are non-trivially
interrelated.
According to Marle and Bocquet (Marle and Bocquet, 2001), who notably follows the concepts of
Genelot, it must be emphasized that complexity is the property of a system that causes on one
hand the emergence of new properties that none of the elements of the system owns, and on the
other hand the apparition of phenomena that could not be predicted thanks to the sole knowing,
even complete, of the behaviour and interactions of the elements of the system. As a matter of
fact, complexity can have both a negative aspect (in terms of difficulty to be understood or
controlled) and a positive one on the project system (thanks to the emergence of opportunities).

- 19 -
Figure 4. The structural nature of systems: simplicity, complication and complexity.
As a whole, whatever the vision of complexity one has, project systems can be considered as (very)
complex systems. Understanding project complexity to improve project management (and
therefore project success rate) has thus become an even more strategic issue for organisations.
Still, some work has to be done to clarify the notion of project complexity in order to cope with it
more efficiently (Vidal and al., 2007). Due to the lack of consensus between the different visions
and definitions of complexity, even though the manipulated concepts are sometimes very near,
many research works tried to define and identify some key factors and drivers of project
complexity. However, there is no standardized and commonly-agreed list of project complexity
drivers in the literature either.
PROBLEM SETTING OF THIS CHAPTER
As a consequence, the aim of this chapter is to build up a project complexity framework which
could help in the end complexity understanding and analysis in terms of project complexity
sources definition and identification. Through this definition and identification process, we hope
to create an assistance to future complex project management. First, this framework is to
encompass all the aspects of project complexity and bridge the gap between the existing visions of
project complexity. Then, the aim of this framework is to concentrate on the specific factors of
project complexity.
To build this framework properly, the points which need to be addressed to answer this issue are:
• The identification and classification of a list of major project complexity factors.
• The description of the direct implications of these factors on project complexity and
project management, and how they can assist project management for all practical
purposes.
• The proposal of a new definition of project complexity.
• The identification of major sources of complexity in order to highlight project managers
and project teams where they should pay particular attention thanks to an international
Delphi study.
Simple Systems
Very Complex systemsComplex Systems
Complicated Systems

- 20 -
II.2. Identifying project complexity factors First, a literature review on project management and project complexity factors was carried out.
The ambition of this literature review is to be relevant, and illustrative of what complexity is in
fieldwork (as the final framework is to encompass all the aspects of project complexity). However,
it must be underlined that some factors may be absent from this version of the framework, and
that this one is likely to be evolving. This state of the art was performed, keeping in mind the
definition of Edmonds which underlines complexity as the property which makes it difficult to
formulate the behaviour of the project system (both in terms of diagnostic and prediction). We
chose this approach in order to draw the state of the art by the consequences of project
complexity, so that implications on project management processes are more direct. As a
consequence, an important work hypothesis is the following one.
Hypothesis H1: Project ambiguities and uncertainties are to be considered as manifestations of
the difficulty to formulate the project behaviour. This means they are considered here as a
consequence (and as crucial stakes) of project complexity. Therefore, uncertainty or ambiguity-
related factors are not present in the framework, although sometimes cited as project complexity
sources in the literature.
Note that a deeper look at the relationships between the concepts of complexity, ambiguity,
uncertainty, propagation and chaos will however be addressed in Chapter 4. This chapter is to
highlight that this hypothesis is to be particularly underlined, since feedback contributions
undoubtedly exist between these concepts.
This work hypothesis being stated, the methodology which was followed to identify these factors
was the following:
• Step 1 – Identification of the aspects of project complexity which should be encompassed
in the framework.
• Step 2 – Constitution of a first list of factors thanks to a state of the art based on:
o Some project management academic standards (PMI, 2004), (IPMA, 2006a),
(IMPA, 2006b).
o Some project management industrial standards (ISO, 2003), (AFNOR, 2004),
(AFNOR, 2007)
o Some publications focusing on complexity and project complexity aspects
(Baccarini, 1996), (Calinescu and al., 19998), (Edmonds, 1999), (Williams, 1999),
(Laurikkala and al., 2001), (Sinha and al., 2001), (Bellut, 2002), (Corbett and al.,
2002), (Jaafari, 2003), (Koivu and al., 2004), (Sherwood Jones and Anderson,
2005)
• Step 3 – Gathering of some complexity factors under a same common denomination and
obtaining as a consequence a refined list of factors.

- 21 -
• Step 4 – Gathering of factors into several groups thanks to the analysis of the factors list
and the identification done during Step 1.
• Step 5 – Final construction of the first version framework
Step 1 is a direct following of the piece of information given in Chapter 1. In order to structure the
literature review in the best possible way in terms of robustness and exhaustiveness (even though
exhaustiveness can never be reached, particularly when dealing with complexity, which means
that new aspects may be added), we indeed argue that the manifestations of project complexity
are to be seen in every aspect of systems thinking, which completely describes a project system.
As a consequence, a first structure around the aspects of systems thinking is proposed here:
teleological and genetic aspects, functional aspects and ontological aspects of project complexity
are thus to be identified. Paragraphs II.2.1 to II.2.3 are a synthesis of steps 2 and 3 of the
methodology which has just been presented. Paragraph II.2.4 proposes a synthesis thanks to the
construction of an innovative project complexity framework. Paragraph II.2.5 details how this
framework can be helpful to propose a standard definition for project complexity and to assist
directly project management under complex situations at different project phases. Finally,
paragraph II.2.6. illustrates on a case study how project complexity analysis (in this case,
retrospective analysis for lessons learned) can be performed thanks to the framework.
II.2.1. Project complexity teleological and genetic aspects As exposed in Chapter 1, the genetic aspect of a project system describes its evolution (i.e. the
phases it evolves in). As for it, the teleological aspect of a project system addresses the issue of
project values creation by identifying the expected target values (objectives) of a project (thanks
to the identification of the project stakeholders and environment). Project complexity teleological
and genetic aspects are to be mainly related to these aspects of the project system.
During the steps 2 and 3, several project complexity factors regarding project teleological and
genetic aspects were identified and gathered under a common denomination. These factors are:
• Competition
A competitive context is a more demanding and complex one since the targeted business is
to choose the best products, processes, etc… in terms of expected values. Competition can
be either technological or organisational.
• Cultural configuration and variety
A project with a variety of cultures (social, technological, organisational,…) which need to
be managed altogether appears to be more complex. Cultural configuration and variety
can appear within the project or in its environment.
• Environment complexity (networked environment)
Environment complexity in terms of network (networked environment) is to increase
project complexity and make its management harder. Indeed, the management of the
relationships with the project environment is one of the core activities of project

- 22 -
management. Performing this activity in a networked environment is more complex since
the impact of any relationship or decision is to propagate through this network.
• Institutional configuration
The more complex is the institutional configuration and organisation, the more complex
the project is, since one is likely to cope with higher coordination difficulties.
• Local laws and regulations
Local laws and regulations (in both organisational and technological aspects) can increase
project complexity since they may impact notably some differentiation in the project
processes/outcomes according to the geographical zone where they are performed/created.
• New laws and regulations
New laws and regulations (in both organisational and technological aspects) can increase
project complexity since they may result in the need for changes in the
processes/outcomes, given the requirements of new laws and regulations (such as security
norms for instance).
• Degree of innovation
Degree of innovation (organisational or technological) is to have an influence on project
complexity. For instance, the lack of experience (due to innovation requirements) makes it
more difficult to formulate the behaviour of the project, and is thus part of project
complexity.
• Demand of creativity
Demand of creativity is very similar to degree innovation in the way it can influence
project complexity, since it implies new processes or elements, the behaviour of which is
harder to formulate.
• Scope for development
The larger the scope for development of a project is, the more complex the project is.
Indeed, large scope for development imply more pressure, more long-term strategies and
long-term aspects which make the project more complex.
• Significance on public agenda
Significance on public agenda increases project complexity since overall pressure
increases (due to necessary delay respect and possible impacts of a project failure),
making the behaviour of the project system more complex to analyse, manage and predict.
• Number of deliverables
When project deliverables are more numerous, then the project is likely to be more
complex, since more aspects are to be controlled and achieved properly, which makes the
project more complex.
• Number of objectives
When project objectives are more numerous, then more aspects must be controlled, which
make it more difficult to control and predict the whole behaviour of the project.
• Variety of the interests of the stakeholders

- 23 -
When the stakeholders’ interests are varied, then project coordination and control is more
complex because conflicting interests are likely to appear during the project definition and
execution.
II.2.2. Project complexity functional aspects As exposed in Chapter 1, the functional aspect of a project system focuses on what the project
system executes in terms of tasks and processes. This functional aspect is the principal cause of
interactions and interrelationships within the project system since resources, actors, information
systems, etc… interact when project tasks are executed. Project complexity functional aspects are
thus to be mainly related to these aspects of the project system.
During the steps 2 and 3, several project complexity factors regarding project functional aspects
were identified and gathered under a common denomination. These factors are:
• Availability of people, material and of any resources due to sharing
Projects may share their people, material and all their resources within the firm.
Moreover, within a given project some resources may be shared between people, tasks,
etc… Such a non-availability of resources during a project make it in essence more
complex.
• Combined transportation
Combined transportation of project inputs and outputs imply more project complexity
since the project transportation plans are intertwined with other transportation plans.
• Dependencies between schedules
Dependencies between schedules make it all the more complex to manage people within a
project. Indeed, for instance, if a change happens in a project team member schedule, then
other project team members schedules may change. But, these schedules are constrained
(notably by permanent organizations). As a consequence, the needed changes may not be
possible, which make project management processes even more complex.
• Relations with permanent organizations
In most cases, within a firm, several projects have to coexist with several permanent
organisations. Any project team member is to be involved in one or several projects and in
one or several permanent organisations. Relations with permanent organizations make it
more complex to manage a given project since these permanent structures may exert
constraints on the project. For instance, the dependencies between the corresponding
schedules generate complexity when trying to accommodate them and meet the
requirements of each of them.
• Level of interrelations between phases
The level of interrelations between phases is a project complexity factor. Indeed, the more
project phases are interrelated, the more decisions made during a phase may impact the

- 24 -
following ones, and the more a failure occurring during a phase is to be cured by rework in
other phases. As a whole, predicting the project evolution is therefore more difficult.
• Dependencies with the environment
During the execution phase of the project, dependencies with the environment make it all
the more complex to manage the project since a constant look is to be given to changes
within the environment as they may impact the project evolution and outcomes.
• Dynamic and evolving team structure
The project team structure is to be evolving during its execution. Changes in the team
structure over time imply difficulty to analyse, predict and control the behaviour of the
whole project system.
• Interconnectivity and feedback loops in the task and project networks
Such loops in the task network and other project networks (information networks, etc…)
make it impossible to analyse the recursive phenomena which exist, making the project
more complex.
• Interdependence between actors
Interdependence between actors which execute the project, whatever their nature
(information exchange, hierarchical interdependence, social relationship, etc…), make it
all the more complex to coordinate the project efficiently.
• Interdependence between sites, departments and companies
Similarly, interdependence between sites, departments and companies which are involved
in the project make it more complex to manage, since other constraints due to their
relationships may notably influence the project evolution.
• Interdependence of information systems
In the same way, interdependence of information systems make the project more complex
since any failure or dysfunction in any information system may impact dramatically the
whole information systems architecture of the project.
• Interdependence of objectives
The interdependence of project objectives make the project evolution more difficult to
formulate since any change in any project objective may involve changes for the other
project objectives, which may make project outcomes inconsistent with the new objectives.
• Specifications interdependence, Interdependence between the components of the product
and Resource and raw material interdependencies.
Similarly, in terms of outcomes specifications, product components, and raw material (3
distinct factors), interdependencies are to generate more project complexity.
• Stakeholders interrelations
Stakeholders interrelations make it difficult to predict the evolution of a project since
project objectives may for instance be redefined by stakeholders because of their
relationships. Managing the relations with stakeholders thus appears to be crucial.
• Processes interdependence

- 25 -
Similarly, project processes (organisational or technological) interdependence, resulting in
failure propagation for instance, make it all the more complex to manage a project.
• Number of interfaces in the project organization
Interfaces in the project organization are potential sources of project complexity. Indeed,
interfaces are information or material exchange zones which need to be coordinated under
some pressure conditions (coming from each part of the interface). These coordination
activities, often based on compromise and adaptation, are difficult to analyse and foresee.
• Team cooperation and communication
Low team cooperation and communication make it all the more complex to manage the
project since project strategies, decisions, objectives and processes may for instance be
shared less effectively by the project team.
• Duration of the project
The impact of duration of the project on complexity is difficult to assess, even though this
criteria is often cited in the literature. The longer a project lasts, the more project
complexity sources are to influence the project and the more difficult it is to predict the
project evolution. But the shorter a project lasts, the more it is constrained, resulting in
higher pressure and difficulties to manage the project. A good compromise might thus be
found when defining the duration of a project.
• Number of activities
When project activities (or tasks) are numerous, then the project is more complex since
numerous activities require higher coordination and finer analysis to formulate the whole
behaviour of the project.
• Number of decisions to be made
The more decisions are to be made, the more the coordination of the project and the
prevision of the impact of these decisions is difficult to tell.
II.2.3. Project complexity ontological aspects As exposed in Chapter 1, the ontological aspect of a project system focuses on what the project
system is in terms of its constituting elements which permit the execution of tasks and processes
(resources, actors, information systems, etc…). Project complexity ontological aspects are thus to
be mainly related to these aspects of the project system.
During the steps 2 and 3, several project complexity factors regarding project ontological aspects
were identified and gathered under a common denomination. Two main aspects do appear:
number or size of project elements and variety of project elements. These factors are:
• Staff quantity
When the project staff is more numerous, then project coordination (and thus the project)
is more complex.

- 26 -
• Number of companies / projects sharing their resources, Largeness of capital investment,
Number of departments involved, Number of hierarchical levels, Number of information
systems, Number of investors, Number of stakeholders, Number of structures / groups /
teams to be coordinated, Number and quantity of resources, Largeness of scope (number
of components, etc…)
We choose to talk about these criteria together since they are very similar. Basically,
when these elements are more numerous, then more aspects must be controlled, which
make it more difficult to control and predict the whole behaviour of the project.
• Diversity of staff (experience, social span …).
When the staff is varied, notably in terms of work experience, social span or culture, then
the project coordination and control appear to be more complex.
• Geographic location of the stakeholders (and their mutual disaffection)
When stakeholders of the project are far from one another in terms of geographic location,
then the project analysis, coordination and prediction are harder because of numerous
effects (loss of information during information exchange, lack of information sharing due
to their mutual disaffection, variety of local contexts of the stakeholders, etc…).
• Variety of resources to be manipulated
Manipulating more resources during the project requires more project coordination and
control (stocks and availability of resources, compatibility of resources, etc…), which
makes projects more complex.
• Variety of the stakeholders’ status
When the stakeholders’ statuses are diverse, then it is more complex to coordinate the
project since the control of the relationships with the stakeholders may imply varied
procedures or behaviours for instance.
• Variety of information systems to be combined
When information systems are varied, then the compatibility and conjoint use of these
information systems appear to be complexity sources for project management.
• Variety of skills needed
The more diverse the needed project skills are (whether organisational or technical), the
harder the project is to analyse, predict and control, which makes it more complex.
• Variety of interdependencies, Variety of the product components, Variety of the
technologies used during the project, Variety of financial resources, Variety of
hierarchical levels within the organisation, Variety of project management methods and
tools applied, Variety of the resources to be manipulated
Similarly, these seven other factors appear to make the project more complex.

- 27 -
II.2.4. First version of the project complexity framework The point is that speaking in terms of teleological, genetic, functional and ontological aspects of
project complex is not the easiest manner to communicate about complexity in real projects and
see what are the concrete phenomena behind these notions. We thus claim for a gathering of
these factors into four more intuitive groups (see Figure 5). These groups, which are closely linked
to the four aspects of systems thinking, are all necessary but non-sufficient conditions for project
complexity. The first group gathers the factors that are relative to the size of the project system.
The second one gathers those that are relative to the variety of the project system. These two first
groups globally correspond to the ontological aspect of the project system. The third one gathers
those that are relative to the interdependencies and interrelations within the project system,
which corresponds to some extent to the functional pole of the project system. Finally, the fourth
one deals with the context-dependence of project complexity, which mainly corresponds to the
teleological and genetic poles of the project system.
Figure 5. Drivers of project complexity
The gathering of the identified project complexity factors into these four distinct groups makes more meaning
both for direct industrial use (as these denominations make more sense for fieldwork) and for academic
establishment (since these denominations have widely been used in research articles for instance). Indeed:
• Project size is to be defined as a whole as the sizes of elementary objects which exist
within the project system. These sizes are likely to be assessed thanks to appropriate
quantitative measure (for instance time scale, cardinal scale, etc…). This aspect of project
size (which is somewhat close to the ontological aspect of project complexity in terms of
number of identified elements) then appears to be a necessary condition for project
complexity which makes sense. Indeed, recent papers notably state that any
organisational system should be over a minimum critical size to be considered as a
complex system (Corbett and al.,2002).
• Project variety is to be defined as a whole as the diversity of elementary objects which
exist within the project system. This aspect of project variety (which is somewhat close to
the ontological aspect of project complexity in terms of diversity of identified elements)
indeed appears to be a group which makes sense. Indeed, as mentioned by Sherwood and
Anderson (Sherwood Jones and Anderson, 2005) , “diversity relates closely to the number
of emergent properties”. Moreover, as underlined by Corbett and al. (Corbett and

- 28 -
al.,2002), “the one thing that comes through loud and clear is that complexity is tied up
with variety, be it in the world of biology, physics or manufacturing”.
• Project interdependence is to be defined as the existence of relationships between
elementary objects within the project system. This aspect of project interdependence
(which is somewhat close to the functional aspect of project complexity in terms of
interactions between elements to execute the project) indeed appears to be another
category which makes sense. As underlined by several authors, interdependencies (and all
the notions related with them such as interactions, interrelationships or interfaces) are
even likely to be the greatest drivers of project complexity. Besides, Rodrigues and Bowers
(Rodrigues and Bowers, 1996) explain that “experience suggests that the
interrelationships between the project’s components are more complex than is suggested
by the traditional work breakdown structure of project network”, suggesting that
traditional project management tools cannot be sufficient to catch the reality of
interdependence. This seems all the more problematic since “there is a complete
interdependence between the components of the complexity: each element will depend and
influence on the others” (Calinescu and al., 1998).
• Project context is defined here as what refers to the environment within which a project is
undertaken. This aspect of project context-dependence (which is somewhat close to the
teleological and genetic aspects of project complexity) indeed appears to be another
category which makes sense. First, Chu and al. (Chu and al., 2003) underline that
contextuality is an essential feature of complexity, considering it as a common
denominator of any complex system. The context-dependence of project complexity is also
stressed by Koivu and al. (Koivu and al., 2004) who notably insist on the fact that “the
context and practices that apply to one project are not directly transferable to other
projects with different institutional and cultural configurations, which have to be taken
into account in the processes of project management and leadership”. Note that this point
is also underlined in Chapter 1, when addressing the question of the value of lessons
learned in project management.
As a whole, this literature review and proposed classification permits to build a project complexity
framework which aims at being a reference for any project manager to identify and characterize
some aspects of its project complexity, so that he can understand more efficiently the stakes of its
project complexity management. Once again, even though we had the ambition to be quite
exhaustive, some others project complexity factors are likely to be added to this framework.
Knowing that, we insist on the fact that this project complexity framework is a descriptive vision
of complexity: for all practical purposes, the perceived complexity of the real system throughout
this framework is finally the one that is being managed. Moreover, one should keep in mind that
this framework is a form of consensus on project complexity and that complexity cannot in
essence be managed and handled through a generic consensus. This framework should as a
consequence be considered as a basis to understand better complex projects and particularly

- 29 -
identify the principal sources of complexity within a given project (Vidal and al., 2008), (Vidal and
Marle, 2008).
Figure 6. First version of the project complexity framework
Hereinbefore, on Figure 6, the completed project complexity framework we have built thanks to
this research is exposed. It has to be noticed that approximately 70% of the identified complexity
factors are related to organizational aspect, not technical. Principal sources of project complexity

- 30 -
are thus likely to be organisational factors, as underlined by some former works on this issue
(Shenhar, 2007). Moreover, even though the factors belonging to the family of interdependencies
within the project system are hardly more numerous that the others, this group appears to be in
the literature as the most important for project complexity and day-to-day project management
(Marle,2001). Interactions management is likely to be both one of the causes of greatest value
creation during the project and one of the riskiest parts of the project.
II.2.5. Applications of this framework
This state of the art being made, this framework being elaborated and the concepts being
discussed, we now propose a refined definition of project complexity. We state that:
Definition
Project complexity is the property of a project which makes it difficult to understand, foresee and
keep under control its overall behaviour, even when given reasonably complete information about
the project system. Its drivers are factors related to project size, project variety, project
interdependence and project context.
Every aspect of systems thinking is part of the overall behaviour of the project system, which
means that, according to this definition, project complexity is the property which makes it
difficult to understand, foresee and keep under control any of these aspects. The reader is to keep
in mind this definition until the end of this Ph.D. thesis.
In the end, many complexity-related phenomena can explain the difficulties to understand,
foresee and keep under control the behaviour of a project, due to its complexity. These reasons
and their links with project management will be addressed in Chapter 4. But, before detailing
these phenomena and stakes linked with project complexity, applications of the framework (direct
applications, refinements, definition of a project complexity measure, etc…) are to be developed in
this chapter and in Chapter 3.
As a whole, as noticed by Ivan and Sandu (Ivan and Sandu, 2008), there are three types of project
complexity (as in the case of the majority of project characteristics): estimated, planned and
actual. According to them, “Estimated complexity is based mostly on expertise gathered from of
similar past projects. Planned complexity is a refinement of the estimated complexity, as some
corrections are applied in order to adapt to the distinct project context. Actual complexity is
finally measured after the project has been implemented.” This classification permits us to insist
on three direct possible uses of the project complexity framework which is proposed here:
• Predictive project complexity analysis.
This application consists in the a priori project complexity evaluation. This finds direct
implications in the management of the pre-project period and the project start processes.
As underlined in (Gareis, 2000) “the project start is the most important project
management subprocess, because in it the bases for the other project management

- 31 -
subprocesses, such as the project plans, the project communication structures, the
relationships to relevant environments, are established”. As for them, (Dvir and al., 1998)
also note that “pre-contract activities […] are highly influential in all types of projects”.
Predictive project complexity analysis is thus a crucial issue to achieve properly the pre-
contract and project start phases. Using the project complexity framework as a checklist is
to ensure a better identification of possible complexity sources within the project. It may
also influence decisions which are directly made during these phases. For instance, project
team constitution should be addressed in terms of possible complexity sources by focusing
on the factors “staff quantity”, “diversity of staff (experience, social span,…)”, etc… By
paying attention to such phenomena when making decisions during the pre-contract and
start phases, one is to avoid some unnecessary or undesired complexity sources.
• Diagnostic project complexity analysis.
Diagnostic project complexity analysis is to be performed during the execution phase of
the project. This analysis permits to assist project management processes during the
execution phase, such as planning and re-planning, monitoring and control, decision-
making, etc… The identification of existing project complexity sources during the project
permits to stand back on some issues of the execution phase. We claim for the conjoint use
of traditional project management tools as a basis and a more holistic approach which can
permit to analyse more properly project complex situations. This approach is facilitated by
the project complexity framework which is proposed here. Generally, people have a
tendency to focus on some detail which appear to them as existing crucial problems in a
project. But focusing on detail does not permit them to solve the problem, which causes
some project failures (Shenhar and Dvir, 20007). Looking at these problems through the
glass of complexity permits to have a holistic vision of the tackled issue and thus to make
more influent decisions. Having a better vision of interdependencies for instance permits
to understand better propagation phenomena and change implications on a whole project.
In the case of design engineering for example, such understanding of change propagation
is to avoid unnecessary and costly rework during the project (Austin and al., 2002),
(Clarkson and al., 2004), (Steffens and al., 2007). Adaptive management practices should
thus be employed when facing complex situations (Shenhar, 2007), (Lindkvist, 2008).
• Retrospective project complexity analysis.
Retrospective project complexity analysis thanks to the project complexity framework is to
assist project closure and return on experience processes. Indeed, the a posteriori
identification of complexity sources which existed during the project permits to assess
what happened and thus draw some lessons for the future. The overall processes of
lessons identification and lessons learned future use is to give some precious experience to
the firm. As underlined by Williams (Williams, 2003), “management’s role in facilitating
and encouraging learning from projects is vital”, and particularly in the context of
complex projects. Learning finally improves project maturity and future project
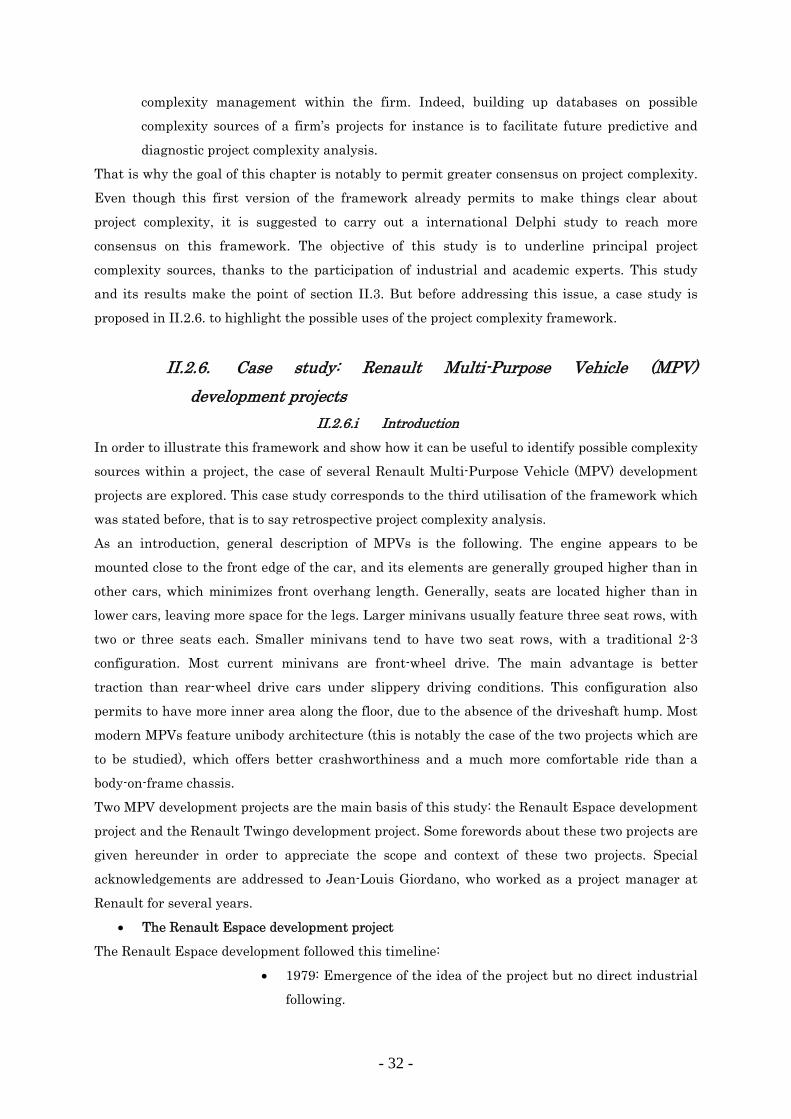
- 32 -
complexity management within the firm. Indeed, building up databases on possible
complexity sources of a firm’s projects for instance is to facilitate future predictive and
diagnostic project complexity analysis.
That is why the goal of this chapter is notably to permit greater consensus on project complexity.
Even though this first version of the framework already permits to make things clear about
project complexity, it is suggested to carry out a international Delphi study to reach more
consensus on this framework. The objective of this study is to underline principal project
complexity sources, thanks to the participation of industrial and academic experts. This study
and its results make the point of section II.3. But before addressing this issue, a case study is
proposed in II.2.6. to highlight the possible uses of the project complexity framework.
II.2.6. Case study: Renault Multi-Purpose Vehicle (MPV) development projects
II.2.6.i Introduction In order to illustrate this framework and show how it can be useful to identify possible complexity
sources within a project, the case of several Renault Multi-Purpose Vehicle (MPV) development
projects are explored. This case study corresponds to the third utilisation of the framework which
was stated before, that is to say retrospective project complexity analysis.
As an introduction, general description of MPVs is the following. The engine appears to be
mounted close to the front edge of the car, and its elements are generally grouped higher than in
other cars, which minimizes front overhang length. Generally, seats are located higher than in
lower cars, leaving more space for the legs. Larger minivans usually feature three seat rows, with
two or three seats each. Smaller minivans tend to have two seat rows, with a traditional 2-3
configuration. Most current minivans are front-wheel drive. The main advantage is better
traction than rear-wheel drive cars under slippery driving conditions. This configuration also
permits to have more inner area along the floor, due to the absence of the driveshaft hump. Most
modern MPVs feature unibody architecture (this is notably the case of the two projects which are
to be studied), which offers better crashworthiness and a much more comfortable ride than a
body-on-frame chassis.
Two MPV development projects are the main basis of this study: the Renault Espace development
project and the Renault Twingo development project. Some forewords about these two projects are
given hereunder in order to appreciate the scope and context of these two projects. Special
acknowledgements are addressed to Jean-Louis Giordano, who worked as a project manager at
Renault for several years.
• The Renault Espace development project
The Renault Espace development followed this timeline:
• 1979: Emergence of the idea of the project but no direct industrial
following.

- 33 -
• 1982-1983: Cooperation agreement between Matra and Renault.
The project is launched.
• 1984: The Renault Espace I is commercialised.
• Successive developments: New versions of the Renault Espace (II,
III, and IV) appeared successively in 1988, 1996 and 2002.
The Renault Espace was a very innovative concept, which was originally based on Volkswagen
minibus. The aim was to develop a familial vehicle, with a large internal volume, with a large
trunk for luggage and take-down seats. Moreover, the Renault Espace was the first Renault
vehicle with a composite main body and a tinned frame. At the time of development of the first
Espace, the firm was not very mature for project management, which was a somewhat new
discipline within the organization. In the end, this project appeared to be very crucial in the firm
development. It was highly symbolic (new brand image of Renault), and strategic (since Renault
was the first European firm to work on MPVs). The project required also many technical and
creative skills (as this was a very innovative project) and implied complex managerial aspects,
due to the cooperation with Matra.
Figure 7. The Renault ESPACE VI
• The Renault Twingo development project
The description of this project is also permitted thanks to the works of Midler (Midler, 2004). The
Renault Twingo development project follows this timeline:
• 1986-1987: Emergence of the idea of the project but no direct
industrial following.
• 1989-1992: Emergence of the project. Design and execution of the
project.
• Sept. 1992: The Renault Twingo is presented to the auto show in
Paris.
• Spring 1993: The Renault Twingo is commercialised.

- 34 -
• Successive developments: The Renault Twingo II appeared in
2007.
Figure 8. The Renault TWINGO
The first motivation of the Renault Twingo development project was the financial difficulties that
Renault was having in the mid 1980s. Indeed, some former vehicle development projects appeared
to be relative failures, the sales of the Renault Clio and Super 5 were in decline and the firm of
Billancourt had just closed. Then, the aim of the Renault Twingo development project was to help
Renault come back to its financial balance. In order to do so, Renault wanted to develop a new
multi-purpose vehicle which would be original, innovative and non-costly. The project thus
followed a Design-to-Cost approach, which implied a higher level of competition between the
project suppliers.
II.2.6.ii Application for retrospective complexity analysis The project complexity framework which is proposed permits to perform a retrospective project
complexity analysis of these two projects. The ambition of this sub-paragraph is not to be
exhaustive on all the complexity sources which occurred during these two vehicle development
projects. The aim is to highlight how the use of this framework as a checklist permits to identify
specific possibly important complexity sources in MPVs development project, which can assist
future project management of such projects. Examples of retrospectively identified project
complexity sources of these two projects are the following ones. The synthetic denominations
correspond to the organisation of the framework (Size, Variety, Interdependency and Context-
dependence crossing Organisational and Technological).
• Example of SIZE-ORG factors
Number of stakeholders can affect project complexity. For instance, in the case of the
Renault Espace development project, the coordination between the employees,
cultures, processes, etc… of Renault and Matra due to the cooperation of these two
firms implied greater managerial and organisational complexity.

- 35 -
• Example of VAR-ORG factor
Diversity of staff (experience, social span,…) appeared to be a critical complexity
factor in the Renault Espace development project. Indeed, some professional cultures
needed to be coordinated, which cause some managerial difficulties. The specific cases
of the different visions and cultures of the workers from the Engineering and design
department and the ones from Marketing department were interesting in that case.
Ideal definitions of a familial car were viewed by the marketing department and
conflicting technical views could often be objected. Managing the projects with
compromise and adaptation around such visions which emerge due to the diversity of
the staff made the project more complex. We do insist on the fact that these different
visions were indeed a source of difficulties, but also a great source of opportunities for
the project.
• Example of INT-ORG factors
Level of interrelation between phases appear to be very critical in these two projects.
For instance, in the Renault Twingo project, some specifications (notably technical
with the door handles) which had been validated during the project first phases
appeared to be meaningless and or impossible while performing the project execution.
This implied to redefine these specifications, which implied even more changes
because of project specifications interdependence (INT-TECH factor).
• Examples of INT-TECH factors
Interdependence of the components of the product appeared to be a critical complexity
factor in the Renault Espace development project. The technological innovation due to
the MPV format implied changes in the windscreen inclination. Even though they had
not been predicted, because of the component interdependence, this implied changes
in the front windscreen wipers and also in the engine position.
As for the Renault Twingo development project, resource and raw material
interdependence made the project more complex regarding the same components.
Indeed, a new kind of glass was used to elaborate the windscreen. But it had not been
seen that this new material which was used was not compatible with the glue which
was formerly used to fix the windscreen wipers. This implied some changes and
rework in the end.
• Examples of CONT-ORG factors
Local laws and regulations appeared to make these two projects more complex when
trying to extend the commercialisation and production of these vehicles into different
European countries. For instance, new local laws and norms appeared in the mid
1980s in Germany. These ones were not all compatible with the Renault Espace
technical specifications and production processes, which implied major changes in
order to keep the possibility for the Renault Espace to exist in Germany.

- 36 -
Project complexity Factors Renault Espace Development Project Renaul Twingo Development ProjectSIZE-ORG FACTORSNumber of stakeholders 3 NegligibleNumber of information systems Negligible NegligibleNumber of structures / groups / teams to be coordinated 3 1Number of companies / projects sharing their resources 2 NegligibleNumber of departments involved 2 2Number of deliverables 1 1Number of objectives 2 2Largeness of scope (number of components, etc…) 2 2Number of hierarchical levels Negligible NegligibleNumber of investors 1 NegligibleNumber of activities 2 2Largeness of capital investment 2 2Staff quantity 1 1Number of decisions to be made 2 1Duration of the project 2 2SIZE-TECH FACTORSLargeness of scope (number of components, etc…) 1 1Number and quantity of resources 1 1VAR-ORG FACTORSVariety of information systems to be combined Negligible NegligibleGeographic location of the stakeholders (and their mutual disaffection) 2 1Variety of the interests of the stakeholders 3 NegligibleDiversity of staff (experience, social span,…) 3 2Variety of the stakeholders' status 1 NegligibleVariety of hierarchical levels within the organisation Negligible NegligibleVariety of financial resources Negligible NegligibleVarierty of organisational interdependencies Negligible NegligibleVariety of organisational skills needed 1 NegligibleVariety of project management methods and tools applied 1 3VAR-TECH FACTORSVariety of the technologies used during the project 2 1Variety of the product components Negligible NegligibleVariety of resources to be manipulated 2 1Variety of technological dependencies 1 1Variety of technological skills needed 1 NegligibleINT-ORG FACTORSDependencies with the environment 2 1Availability of people, material and of any resources due to sharing 2 1Interdependence between sites, departments and companies 2 1Interconnectivity and feedback loops in the task and project networks 1 1Team cooperation and communication 3 1Dependencies between schedules 3 1Interdependence of information systems Negligible NegligibleInterdependence of objectives 1 2Level of interrelations between phases 2 2Processes interdependence Negligible NegligibleStakeholders interrelations 2 2Combined transportation Negligible NegligibleInterdependence between actors 2 2Number of interfaces in the project organization Negligible NegligibleDynamic and evolving team structure 1 NegligibleRelations with permanent organizations 1 1INT-TECH FACTORSSpecifications interdependence 1 1Interdependence between the components of the product 3 3Technological processes dependencies 3 2Resource and raw material interdependencies 2 2CONT-ORG FACTORSCultural configuration and variety 3 1Environment complexity (networked environment) 2 1Organisational degree of innovation 1 3New laws and regulations 1 1Institutional configuration Negligible NegligibleLocal laws and regulations 2 1Competition 2 2CONT-TECH FACTORSEnvironment complexity (networked environment) 1 1Technological degree of innovation 3 1Cultural configuration and variety 2 1New laws and regulations 1 1Demand of creativity 3 2Local laws and regulations 1 1
Figure 9. Synthesis of the retrospective project complexity analysis

- 37 -
Furthermore, the significance on public agenda appeared to be a very important factor
in the case of the Renault Twingo development project. As mentioned in the
introduction, the Renault Twingo was a very strategic project for the firm, which
implied higher levels of stress and pressure when executing this project.
• Examples of CONT-TECH factors
This cited local laws in the case of the Renault Espace implied higher technical
competition with German firms, such as Volkswagen, which tried to use this needed
rework for Renault as a possibility to bridge the technical gap about MPVs. Higher
pressure thus existed because of this competition. Moreover, in these two cases, the
technological degree of innovation was very high and there was an important demand
of creativity. These two projects were thus even more complex to manage due to the
constant emergence of new ideas or situations which had not been experienced in the
past. For instance, thinking about the creation of a large internal volume and unibody
car in the case of the Renault Espace development project was a very new situation.
These were examples of project complexity factors which can be identified thanks to the use of the
project complexity framework. As a whole, a synthesis of identified project complexity factors in
these two projects thanks to this retrospective analysis is proposed in Figure 9, where expert
judgments attributed some importance (from negligible to 3) to possible project complexity
factors. Still, if this list of factors permit to have a closer look on projects in terms of complexity,
the factors are still very numerous and no a priori classification of these factors (in terms of the
importance of their average contribution to project complexity) is proposed. That is why we
carried out an international Delphi study to refine this framework.
II.3. Conducting a Delphi study to refine the framework II.3.1. The Delphi methodology
As stated in II.2.5., refining our results thanks to an international Delphi study is indeed to
permit to have a more reliable definition and understanding of the project complexity framework
we have built. The Delphi methodology (Linstone and al., 2002), which was originally developed
in the 1950’s, is a systematic and interactive method which relies on a panel of independent
experts. It is a very flexible tool which permits to reach a consensus, through the collection of
experts’ opinions on a given issue during successive stages of questionnaire and feedback. Direct
confrontation of the experts, whose anonymity is kept at every stage of the study, is avoided
(Okoli and Pawlowski, 2004). As mentioned in (Skulmoski and al., 2007), “ the Delphi method is
well suited as a research instrument when there is incomplete knowledge about a problem or
phenomenon”. It has proven over the years to be a very popular tool for framework building,
forecasting, issues prioritizing, decision-making, etc… It has been used for several studies in the
field of industrial engineering and project management, which encouraged us in our research

- 38 -
work. For instance, Schmidt and al. used the Delphi method in order to build up a list of common
risk factors in software projects (Schmidt and al., 2001). Our research methodology is based on a
two-round Delphi process (see Figure 10):
Figure 10. Conduction of the Delphi study according to a two-round process.
The Delphi survey was conducted thanks to blind copy electronic mail sending to international
academic and industrial experts in project management in order to save time and expenses for
both the surveyor and the experts. The questionnaire was introduced by a page explaining, such
as in (Bryant and Abkowitz, 2007), the overall purpose and structure of the survey as well as the
experts anonymity conditions at each stage of the study. The questionnaire was divided into eight
sections, following the structure of the first version of the project complexity framework: SIZE-
ORG, SIZE-TECH, VAR-ORG, VAR-TECH, INT-ORG, INT-TECH, CONT-ORG, CONT-TECH.
The questions were formulated thanks to a 5-level Likert scale, in order to express the importance
of the contribution of a given factor to project complexity (from no contribution -1- to essential
contribution -5-, leaving the possibility to answer “do not know” and “do not want to answer”).
Furthermore, participants could leave commentaries and questions at any moment on any point
of the Delphi questionnaire in order to generate some discussions about it or to suggest other
potential project complexity factors. At each round, a little more than three weeks were left to the
panelists to answer the survey. The statistical analyses of round 1 and round 2 correspond to the
results expressed in the discussions paragraph. It must be noted that the results of round 1 and
round 2 are the same since the synthesis and proposition which was done after round 1 satisfied
all experts, reaching global consensus at this stage. No change was as a consequence done
between the answers of round 1 and round 2. Only some commentaries and suggestions appeared
during round 2.

- 39 -
II.3.2. Panel selection and survey scales definition The Delphi survey group size appears to be very different in the literature. However, it is often
recommended to have a group between 9 and 18 participants in order to draw some relevant
conclusions and avoid at the same time difficulty to reach consensus among experts. We argue,
such as in (Okoli and Pawlowski, 2004), that an experts categorization should be made properly
before undertaking the Delphi survey in order to build up the most representative panel. As for
them, Skulmoski and al. require different aspects for the participants to be selected in the Delphi
survey panel (Skulmoski and al. 2007):
• Sufficient knowledge and experience about the survey issues,
• Capacity, willingness and time to participate,
• Good communication skills.
Our prospective panel was constituted of 38 experts, 19 of them being industrial practitioners and
19 being academics, and at the same time 19 being men, 19 being women. Of those 38 solicited
experts, 18 actually participated to the study from the beginning to the end, 10 of them being
academics and 8 being industrials, and at the same time 10 of them being women, and 8 being
men. Academics were notably identified thanks to their publications regarding project complexity
in the Web of Science and specialized conferences or revues (International Journal of Project
Management, PMI Research Conference, etc…). Industrial practitioners were identified thanks to
the browsing of some professional social networks (Linkedln), the identification of some project
managers of large firms websites, and the identification of project managers whose education was
followed in some high standard schools, universities and institutions. We thus consider that the
overall results are going to be relevant since the interrogation of 18 experts permits to trust them.
In order to do comparisons and generate discussions during the next section, we also study
separately men, women, academics and industrials. Even though the suggested minimum quota
of 9 experts is not reached for men and industrials (8 for each category instead of 9), we will
consider the results as relevant.
II.3.3. Results and discussions II.3.3.i. Global results
Our discussion starts with the overall analysis of the panelists’ answers to our survey. A
synthesis of their reached consensus can be seen after in Figure 11 and in Figure 12.
Figure 11. Global Delphi results for each factor family

- 40 -
Average scores and mean deviations were calculated to perform the analysis of this questionnaire.
Mean standard deviation of the answers, as shown in Figure 11, is 0.682, which makes it a
satisfying consensus for (also notice that all standard deviations are less than 1). Figure 12 shows
the statistical results of the survey. Average values lie between 2.278 and 4.889. When having a
closer look at the answer of the panel, some points are to be noticed about project complexity:
• First, of the first 18 identified project complexity drivers after the panelists’
evaluation (the mean value of which is over 4.500), only 2 of them are of a
technological type (11.1%), as shown in figure 4. Organizational complexity
thus seems to be the greatest source of complexity for projects and project
management today. Project managers should thus focus on organizational
issues when tackling and dealing with complexity. This also appears to be
legitimate when discussing with industrials facing their project day-to-day
life.
• Second, of these first 18 project complexity drivers, 11 of them belong to the
family of project interdependencies (61.1%), making it the most contributive
family of project complexity drivers, before context-dependence and variety
(both 16,7%) and size (5.6%). This also appears to be consistent with former
works of the academic literature and with the industrials’ feelings about
complexity when discussing with me. This is also enlightened by the number
of tools and works that have been developed to try to better catch project
interactions and interdependencies, such as interactions model (Marle,
2002), or Design Structure Matrices (Steward, 1981).
• However, when analyzing Figure 12, we can express (according to average
values) that
onalOrganizatiicalTechnodependenceContextVarietySizedenceInterdepen
≈−≈
logff
We must notice here that this average value classification is to be taken
with caution, for two reasons. First, the number of factors coming from each
category are not the same. Indeed, in our first version of the framework,
organizational complexity factors are much more numerous than
technological ones (44 compared to 26). The multiplicity of sources of
complexity of a drivers’ category is to increase real project complexity and
the relative importance of this category, which thus highlights the influence
of organizational factors. Moreover, if organizational factors represent 63%
of the number of identified project complexity factors, they represent 89% of
the factors among the 18 first factors (those over the score of 4.500), which
underlines even more their crucial importance.

- 41 -
Figure 12. Synthesis of Delphi results for each criterion, sorted by decreasing average

- 42 -
• The issues are in essence complex when dealing with project complexity.
But surprisingly, the convergence of the experts was fast, even though they
were of different origins and backgrounds. Although none of the experts
changed their answers at this stage, they all accepted the consensus
proposal at second round. Another iteration of the evaluation process was
not required.
• It must finally be noted that the factors which appear earlier in the Delphi
questionnaire do not receive significantly higher or lower scores than the
factors which appear in the end of the Delphi questionnaire. This implies
that there is no direct correlation between the order of the questions and the
scores of the factors. This was notably observed when alternating the orders
of the tabs in the Delphi questionnaire without observing a change in the
average scores of each group of factors.
II.3.3.ii. Position comparison
Results of the comparisons between academic and industrial experts can be seen hereinafter in
Figure 13. Two aspects are to be enlightened to compare those two populations:
Figure 13. Professional comparison of the Delphi study
• First, mean standard deviations appear to be different between populations
since academics mean standard deviation on the survey is 0.615 and
industrials’ one is 0.738. This difference can express the fact that, even
though there are very conscious of and interested in the concept of project
complexity, they might not all understand it the same proper way. This
observation is also enlightened by some commentaries during the Delphi
survey, since some industrials wanted to have some details on some criteria,
not understanding them, or not seeing them first as complexity sources.
• Slight differences can be observed in the judgments of the two populations.
First, SIZE-TECH complexity factors appear to be judged more important by
academics than industrials (4.350 VS 3.938). Similarly, CONT-ORG and
CONT-TECH are judged more important by academics than industrials
(3.914 VS 3.696 and 3.790 VS 3.513). This is to be related with some
commentaries and questions of industrials during the survey, as some of

- 43 -
them did not understand or catch globally the concept of context-dependence
and the factors belonging to this category. To some extent, this lower
maturity around the conceptual vision of project complexity is to explicit the
lower assessments of these factors by industrials. However, some work
should be carried out to clarify those relative divergence zones, which
remain quite isolated, the whole survey showing a relative common vision of
project complexity between academics and industrials.
II.3.3.iii. Gender comparison One of the ambitions of this research work was also to compare two other populations, men and
women, in order to see if their perception of project complexity, whether they are industrial
practitioners or academics, was the same or not. Others works had indeed shown that no
difference was observed between men and women when dealing with managerial tasks (Toren
and al., 1998). The results synthesized in Figure 14 give us a part of answer, since the results
obtained for those two populations are impressively similar. Mean standard deviation is 0.699 for
men and 0.734 for women. Mean evaluations of organizational and technological complexity
appear to be the same (3.963 VS 3.990 and 4.045 VS 4.028). Gender does not thus seem to be a
source of different project complexity perception.
Figure 14. Gender comparison of the Delphi study
II.3.4. Refining the project complexity framework
Thanks to the Delphi survey, we propose a refined project complexity framework (Figure 15) with
the most important complexity drivers according to the panellists (factors evaluated essential, i.e.
over 4.500). This framework is to be handled more easily than the original framework with 68
factors. However, for all practical purposes, this simplified version of the framework is to be
accompanied by a version of the framework with 41 drivers (those over 4.000) and the original
one.
However, one should notice that the criteria cuts (above 4.000 and 4.500) are quite absolute and
arbitrary criteria. We do insist of the fact that these refinements should be taken with caution
and that, in any case, any user of the framework or the refined framework should always feel free
to incorporate lower scores factors or even new factors.

- 44 -
Figure 15. Refined project complexity framework
II.4. Conclusions and perspectives As a whole, this chapter proposes an approach to define and describe with greater consensus the
concept of project complexity. It answers the problem setting of this chapter since it permitted
• The identification and classification of a list of major project complexity factors.
• A short description of the direct implications of these factors on project complexity and
project management.
• The proposal of a new definition of project complexity.
• The identification of major sources of complexity.
Indeed, the standard framework of identified and classified project complexity factors which is
proposed on the basis of four distinct groups (size, variety, interdependency and context-
dependence) and of the traditional dichotomy of Baccarini (project organisational and
technological aspects) is trying to make things clear on project complexity. These factors and their
links to project complexity are also underlined. Finally, an international Delphi study (the
participants of which are academic and industrial practitioners) is carried out to reach more
consensus and identify crucial project complexity factors. Moreover, some important trends were
underlined as this study calls for the highlight of organisational complexity factors, and more
precisely (as shown by the refined framework) of factors belonging to the INT-ORG part of the
matrix.
However, some limitations and perspectives do appear
• First, the size of the sample used during the Delphi study could appear to be a
limitation for the validation of the results. Even though the size appears to be
enough for validation when performing a Delphi process, and even though the

- 45 -
experts were carefully selected, we aim at confirming the results of this Delphi
study, notably through the possible interview of non-respondents.
Incorporating their results and remarks regarding the results of the Delphi
study should indeed be of great interest in order to validate even more the
standard framework. Another perspective would be to explore other kinds of
respondents. Indeed, for the moment, the panellists have been expert project
managers or researchers in project management: incorporating the visions of
other project team members / practitioners could be of high interest in order to
refine this study.
• Another perspective of this work makes the point of ongoing research. It
consists in a deep correlation analysis of the factors with the answers of the
panellists. Kruskall-Wallis tests are presently being performed in order to
identify correlations. Identified correlations are to make the point of deeper
interviews with project management experts.
• Moreover, we do insist on the fact that exhaustiveness remains in essence an
utopia when trying to describe project complexity. Indeed, even though the
ambition was to be exhaustive, and even though the state of the art process
was carried out with a methodology including both industrial and academic
works on the issue of project complexity definition and description, the
obtained list of factors is to be the basis for a check-list when identifying and
handling project complexity. New factors are likely to be added in the future.
• Furthermore, one should remember that if this work aims at reaching greater
consensus around the concept of project complexity, consensus is not
meaningful when managing complex projects. This could even be
counterproductive. Indeed, one should always remain that in essence, project
complexity is specific to any project or firm context. As a consequence, this is
another reason why this proposal of standard project complexity framework
should be a basis for project complexity analysis. As a whole, this framework
is to be adaptive.
• Finally, new applications and case studies are to be performed, notably on
projects which are to be in their execution, start or pre-contract phases, in
order to study examples of predictive and diagnostic project complexity
analysis.
A final perspective should be the definition of measures or scales (or at least a procedure to define
them) to quantify the level of each project complexity factor which is in the framework. Indeed, as
stated by David Packard, the founder of Hewlett Packard, “You can’t manage what you can’t
measure”. Measuring project complexity and these factors is thus to be very helpful for modern
project management (this aspect is also underlined in several articles (Edmonds, 1999),
(Laurikkala and al., 2001)). That is why in the next chapter of this Ph.D. thesis, we aim at

- 46 -
proposing a relative measure of project complexity in order to assist decision-making. This
measure is to be founded on the project complexity framework we have built, but it can easily be
extended to any hierarchical structure / framework of project complexity factors.

- 47 -
Chapter III. Assessing project complexity
Abstract
The overall ambition of this chapter is to define a measure of project complexity in order
to assist decision-making (notably when analysing several projects existing in a portfolio, or when
studying different areas of a project in terms of complexity). A synthesised literature review on
existing project complexity and complexity measures is proposed in order to highlight the
limitations of existing measures. We then propose a multi-criteria approach to project complexity
evaluation, underlining the benefits of such an approach.
In order to solve properly this multi-criteria problem, we first conduct a critical state of
the art on multi-criteria methodologies. We then argue for the use of the Analytic Hierarchy
Process in order to assess project complexity, in multi-project environments or in mono-project
cases when dealing with possible future project scenarios. The hierarchical structure which is
used in order to perform this process corresponds to the refined project complexity framework
which is built in the former chapter.
In the end, this tool permits to define a relative project complexity measure, which can
notably assist decision-making. Complexity scales and subscales are defined in order to highlight
the most complex alternatives and their principal sources of complexity within the set of criteria
and sub-criteria which exist in the hierarchical structure.
Finally, a case study within a start-up firm in the entertainment industry (musicals
production) is finally performed. Conclusions, limitations and perspectives of research are given
in the end.
Chapter Keywords
Project, Complexity, Measure, Evaluation, Multi-criteria methodologies, Analytic Hierarchy Process (AHP).

- 48 -
III.1. Introduction – The limits of existing project
complexity measures
As an introduction to this chapter, this paragraph aims at giving a brief review on the literature
on complexity measures defined within the field of project management or that can be extended to
the field of project management. As shown on Figure 16, two different approaches mainly exist
when dealing with the issue of project complexity. The first one consists in a twisted approach:
these works focus on some issues of project management (such as the project scheduling problem)
and consider the complexity of the processes to obtain a solution regarding these issues as an
assessment of project complexity. The second one focuses on the project system structure:
researchers intend to assess project complexity thanks to a better understanding of the project
structure model complexity. As seen in the former chapters, this research work, which is notably
based on the principles of systems thinking, follows this approach.
Figure 16. Project complexity modelling through project structure or project issues
Several authors in the literature tried to define complexity measures in order to explain project
failures, to identify intricate situations, to understand better project complex phenomena and to
help decision-making. Indeed, such a measure is notably to assist decision-makers before
engaging their projects / portfolios into too complex situations since too early decisions when
facing complex and uncertain situations often fail to deliver the targeted performance. But before
choosing a suitable project complexity measure, one must be able to define a list of criteria that
can be used to assess if it is good or not. Latva-Koivisto (Latva-Koivisto, 2001) proposes a first list
in a research report which includes parameters such as reliability, ease of implementation and
intuitiveness for instance. As far as this research work is concerned, a literature review on
existing project complexity measures (or complexity measures which could be adapted to project

- 49 -
management) was performed. Once again, as explained on Figure 16, a focus was made on project
complexity in terms of systemic complexity (right side of the figure) and not of algorithmic
complexity when solving some issues about project management (such as the sequencing and
scheduling problem (Akileswaran and al., 1983)). The works of Edmonds (Edmonds, 1999), Latva-
Koivisto (Latva-Koivisto, 2001) and Nassar and Hegab (Nassar and Hegab, 2006) were crucial
sources to generate this list of indicators (about fourty complexity measures globally listed). For
instance, in his Ph.D. thesis, Edmonds (Edmonds, 1999) identified formulations and measures of
complexity, working on a large scope of fields and applications. As for him, Latva-Koivisto (Latva-
Koivisto, 2001) reviewed complexity measures to assess the structural complexity of business
processes. He argued that the complexity of business processes could be assessed through the
conversion of process charts (composed of activities, dependencies, information flows, material
flows and control flows) to graphs, giving the example of the resource-constrained project
scheduling problem. If interested, one should directly refer to these three references for more
information on complexity measures and formulations. Then, the obtained list of possible
complexity measures was refined thanks to the criteria. Four specific complexity measures are
given here since among the most appropriate ones for a use in project management.
• The coefficient of network complexity (CNC) defined by Kaimann (Kaimann, 1974) applies
to both PERT and precedence networks. In the case of PERT networks, the CNC is equal to
the quotient of activities squared divided by events. The CNC, thanks to an intuitive
definition is a good complexity measure to catch the structural complexity of systems that
are modelled thanks to graphs. However they take redundant arcs into account.
• The cyclomatic number defined by Temperley (Temperley, 1981) gives the number of
independent cycles in a graph. The equation calculation of the cyclomatic number is
equation (1). S is the cyclomatic number, A is the number of arcs, N is the number of nodes.
S = A – N + 1 (1) • The traditional static entropic measurement of complexity by the Shannon information
(Shannon, 1948) is based on the probability of receiving a message, as shown by equation
(2) where p(ni) is the probability of receiving a message ni. The Shannon information is also
a complexity measure since information and disorder are strongly related.
Sha = - Σ log2 (p(ni)) (2)
• Arguing that complexity measures such as CNC are imperfect since they take redundant
arcs into account and therefore show that the system is more complex than it actually is,
Nassar and Hegab (Nassar and Hegab, 2006) define a measure for project schedules. This
measure gives the degree of interrelationships between the activities in a schedule. This
complexity measure is the following equation (3) for an Activity On Node project network.
Cn = 100 × (Log(a/(n-1))/Log[(n2-1)/4(n-1)])% if n is odd
Cn = 100 × (Log(a/(n-1))/Log[n2/4(n-1)])% if n is even (3)

- 50 -
The point is that existing measures have shown their limits for several reasons:
• First, some limits have been highlighted about the reliability of such measures. For
instance, some counterexamples were found: indeed, some graphs and networks were
sharing the same CNC but were very different considering their easiness to be managed.
One of the main reasons for this lack of reliability is that those measures mainly refer to a
single aspect of (project) complexity, mainly in terms of interdependencies.
• Second, these measures are often non intuitive for the final users and thus give results
which are difficult to communicate on. Indeed, these mathematical formulations do not
permit a reference to real project complexity factors: both the identification of important
complexity sources and possible actions for complexity handling/reduction are not
facilitated. Moreover, such measures are sometimes difficult to calculate for non-skilled
users, which make it all the more complex to perform and analyse them. For instance, in
the case of the Shannon number, both difficulties are encountered for all practical purposes.
• Finally, these measures mainly refer to a model of the project system. Indeed, measures
such as the CNC, the cyclomatic number or the one proposed by Nassar and Hegab refer in
essence to an existing network or graph. Such graphs are specific models of the project
system, which restrict the view and understanding of project complexity. For instance, a
project can be modelled thanks to different WBS, PERT networks or Gantt charts,
depending on the detail level, willingness of the project manager, etc… Applying such
measures to these kinds of elementary models of the project systems cannot properly
account for a measure of project complexity since they are in essence relative to the model.
PROBLEM SETTING OF THIS CHAPTER
As a consequence, the aim of this chapter is to define a project complexity measure which could
help decision-making. This measure is notably to be used:
• When selecting projects within project portfolios (as one of the criteria used for
selection)
• When opting for a specific project scenario in the case of project management
• When analysing a project and understanding what are its principal areas of
complexity.
To overcome the limits of existing measures, we are to define an index which is as far as possible:
• Reliable, meaning the user can be confident with the measure.
• Intuitive and user-friendly, meaning it should be easily computed and
implemented, and that users must understand why it assesses project complexity.
• Independent of the project models, so that the measure is an evaluation of project
complexity and not an evaluation of the complexity of a given project model.
• Able to highlight project complexity sources when building up the measure, so
that the user can analyse more properly project complexity and thus make his
decisions with a better vision of the problem.

- 51 -
III.2. Exploring the evaluation of project complexity as a
multi-criteria problem
III.2.1. Introduction Chapter 2 underlined the different aspects of project complexity through the elaboration of the
project complexity framework proposed in this Ph.D. thesis. As a consequence, project complexity
appears to be a multi-attribute characteristic of a project. We do argue that one of the reasons of
the limitations of existing (project) complexity measures is that they do not take properly into
account the multiple aspects of project complexity. The following paragraphs thus propose the
construction of a project complexity relative measure on a multi-criteria approach. This measure
is to be obtained thanks to this five-step methodology:
• Step 1 – Identifying the requirements of such a method.
• Step 2 – Carrying out a state of the art of existing multi-criteria decision-making
methods.
• Step 3 –Identifying the most suitable or one of the most suitable multi-criteria method(s)
for project complexity evaluation.
• Step 4 – Applying the selected multi-criteria method and defining the project complexity
measure.
• Step 5 – Testing the whole on a case study in order both to give a first validation of the
reliability, intuitiveness and user-friendliness of the measure, and to underline how this
measure can be used as an assistance to some decision-making issues.
III.2.2. Requirements for a multi-criteria method to evaluate project complexity
Before the emergence of multi-criteria analysis, a major part of problems were solved by
optimizing a unique economic function, notably through the method of cost-benefit analysis.
However, the point is that some aspects are difficult to be expressed in terms of a monetary value,
which limits the application of such methodologies in complex problems. Indeed, in problems of
choice and decision-making, there is always a large number of aspects to consider (multiple
criteria which can be contradictory and whom impact on the final decision can be difficult to
quantify). Methods to support multi-criteria decision-making should take into consideration not
only the quantitative or objective criteria but also the ones that appear to be more qualitative or
subjective. Such methods are mainly designed to evaluate and compare alternatives, are
independent of the project models that are used (since they are mainly based on expert
judgement), and therefore represent a practical tool to assist managers’ choices. In order to cope
with the issue considered in our study, we reviewed the literature on multi-criteria decision-
making methods in order to select the most appropriate one in the context of our study.

- 52 -
In general, decision-making is the study of identifying and choosing alternatives based on the
values and preferences of the decision-maker. Making a decision implies that some alternative
are to be considered, and that one chooses the alternative(s) that possibly best fits with the goals,
objectives, desires and values of the problem. According to Baker and al. (Baker and al., 2001),
the decision-making process should start with the identification of the decision-maker(s) and
stakeholder(s) in the decision (which can be addressed through systems thinking as exposed in
Chapter 1), reducing the possible disagreement about the issue. Then, as they underline it, a
global decision-making process can be divided into the eight following steps: define the problem,
determine requirements, establish goals, identify alternatives, define criteria, select a decision-
making tool, evaluate alternatives against criteria, validate solutions against problem statement.
Requirements Description of requirements Multi-Criteria
The method should be capable to encompass different aspects and compare alternatives regarding multiple criteria of different nature.
Handle qualitative criteria
The method should be able to handle qualitative criteria in addition to quantitative ones.
Prioritise criteria
The method should enable the user to prioritise the criteria, since they are likely to have different influences on the final choice.
Evaluate a discrete set of alternatives
The method should be able to search for the best alternative among an initial discrete set of known alternatives.
Rank alternatives
The method should not only give the most complex project within the portfolio but also prioritise the projects functions of their complexity level
Rank alternatives according to a cardinal scale
The method should rank alternatives according to a cardinal scale. This cardinal scale is to be used afterwards to build up the relative complexity measure we propose.
Reliable
The method should give a reliable result to be eligible for decision-making support.
Computable
The method is to be computable to enable quick calculations on computers
Show great user-friendliness
The method should be user-friendly: this notably includes both the facts that no special/demanding skills should be necessary to perform the process and that results should be understood and handled easily.
Give autonomy
Users (mainly project managers) should be autonomous and should possibly suggest or do modifications.
Evolving Modifications (new criteria, etc..) need to be easily implemented.
Adapted to project environment
The method should be adapted to project environment decision processes (Stal Le Cardinal, 2000), (Jankovic, 2006) and characteristics (constraints, skills, information systems, need for reactivity, …)
Figure 17. Requirements for a multicriteria method to be used for project complexity evaluation

- 53 -
A deeper look at the literature reveals that the problem of selecting the appropriate method (Step
6) appears itself to be a multi-criteria problem. We do not use any of existing methods to solve it,
but we follow the forthcoming methodology to select the method used in our study: we first
conducted a literature review in order to define the requirements of the method that could enable
us to develop a good tool for project complexity evaluation. This literature review is notably based
on the works of Gershon (Gershon, 1981), Deason (Deason, 1984) and Tecle (Tecle, 1988). It
permits to build up Figure 18 in the end.
III.2.3. Critical state of the art of multi-criteria decision-making methods
The list of requirements being established, a literature review was carried out and permitted to
identify a large number of multi-criteria methods. They can mostly be grouped into one of the
three main families (multi-criteria optimization methods, outranking methods, multi-criteria
decision-making methods) described by Roy (Roy, 1985). As a consequence, after describing some
first elementary methods, these three families indeed permit a global classification of the critical
state of the art which is proposed hereinafter. A global synthesis is finally proposed in a table in
III.2.3.v.
III.2.3.i. Elementary methods Such methods are mainly based on basic mathematics, logics and rules. Such examples of
methods are for instance:
• The lexicographic method which consists in
o Ranking the criteria qualitatively
o Ranking the alternatives regarding their score on the first criterion
• The weighted sum methodology
• The traditional Minmax and Maxmin methods.
III.2.3.ii. Multi-criteria optimization methods
This family corresponds to mathematical methods which aim at optimizing a certain objective
function. This objective function is defined according to the multiple criteria which exist in the
addressed problem. Examples of such methods are for instance:
• Goal Programming (Charmes and Cooper, 1961)
Goal programming can be viewed as an extension/generalisation of linear
programming to handle multiple and possibly conflicting objective measures. Each
of these measures is given a target value to be achieved. Unwanted deviations from
this set of objective values are then minimised in an achievement function, which
depends on the goal programming variant used.
• Compromise Programming

- 54 -
III.2.3.iii. Outranking methods
These methods first aim at building binary relations in order to take into consideration the user’s
preferences. Then, these relations are used to formulate a recommendation (thanks to the one-to-
one comparison of the different alternatives). Some of these methods are for instance:
• ELECTRE (Roy, 1968), (Roy, 1978)
o The first step is the construction of one or several outranking relations, which aim
at comparing in a comprehensive way each pair of actions
o The second step corresponds to the exploitation procedure which elaborates on the
recommendations obtained in the first phase. The nature of the recommendation
depends on the problem being addressed: choosing, ranking or sorting.
o For instance, ELECTRE I aims at finding the best solution among an initial set of
alternatives.
o Note that the criteria in the ELECTRE methods have two distinct sets of
parameters: the importance coefficients and the veto thresholds
• PROMETHEE (Brans and Vincke, 1985)
o The first step calls for the user to fix for each criterion the curve and parameters
which describe it best (true criterion, quasi criterion, pre criterion, pseudo criterion,
Gaussian criterion)
o For each pair of alternatives, global preference is calculated (degree of
outranking).
o Flows are then calculated and permit to rank the alternatives.
III.2.3.iv. Single-criterion synthesis approach methods Finally, the third one corresponds to the methods which use the approach of the single synthesis
criterion. These methods are seeking for a synthetic answer thanks to performances and values
aggregation. They use a single criterion which corresponds to the aggregation of all the criteria
which are considered in the problem. Examples of these methods are
• Multiple Attribute Value Theory – MAVT (Keeney and Raifa, 1976)
o The first step corresponds to the construction of a matrix which gathers the
evaluation of each alternative on each criterion.
o Partial value functions are then built for each criterion. (Farquhar, 1984).
o Criteria weights are then determined.
o Final evaluation of all the alternatives is then permitted thanks to the definition of
a final utility function which corresponds to the aggregation of former values
(weighted sum, weighted product, etc…).
• Simple Multi-Attribute Rating Technique – SMART (Edwards, 1971)
o The first step corresponds to the classification of criteria in descending order.
o The second step permits to determine the weights of criteria.
o Weights are normalized in order to be between 0 and 1.

- 55 -
o Alternatives are then assessed on each criterion on a scale between 0 and 100.
o The final value of each alternative is then determined thanks to a weighted sum.
o Alternatives are then ranked in descending order.
• The Analytic Hierarchy Process – AHP
III.2.3.v. Critical synthesis of the methods Identified multi-criteria methods are assessed regarding the requirements which were identified,
as shown on Figure 18 next page. The five first criteria are evaluated on a Boolean scale which
permits to say if these criteria are respected by the method. These criteria are required for the
goal which is pursued in this study. As a consequence, when a method is assessed 0 on one of
these criteria, further evaluation of the method is not performed and the method is rejected.
Then, the set of the six last criteria are evaluated on a 5-level Likert scale. Evaluations of the five
first criteria of this set are mainly performed thanks to a state of the art which is notably based
on (Gershon, 1981), (Deason, 1984), (Tecle, 1988) and (Al-Shemmeri and al., 1997). Evaluation of
the sixth criteria (adapted to project environment) is notably based on a survey of scientific
databases (ISI, etc…) to identify the use of these methods in the project management literature.
A distance is then defined as a comparison in absolute value with the ideal method which would
be noted 5 on every criterion of this set. The two best scores are obtained for the Analytic
Hierarchy Process (AHP) and the PROMETHEE methodologies.
It is to be noted that the evaluation of these methods corresponds to our personal analysis of the
literature about decision-making methodologies and their applications within the field of project
management. For instance, some methods (such as MACBETH) are not present in this analysis
since not taken in consideration at the time it was performed. As a whole, this means that Figure
18 is notably to be confronted to a panel of experts and discussed in the future in order to explore
the possible suitability of other methods for the issue project complexity evaluation.
This point being underlined, regarding the issue of project complexity evaluation, preference is
notably finally given to the AHP, because of its numerous applications in the project management
context which were found in the literature (Al-Harbi, 2001). For instance, in (Ahmand and
Laplante, 2006), the AHP is used to select the most appropriate software project management
tool. The authors argue that “the AHP provides a flexible, systematic, and repeatable evaluation
procedure that can easily be understood by the decision maker in selecting the appropriate
software project management tool”. Other applications particularly consider the issue of project
evaluation or selection in the case of project outsourcing (Bea and Lloveras, 2007) or project
portfolio management (Liang, 2003). Indeed, in (Alhazmi and McCaffer, 2000), the development of
the project procurement system selection model (PPSSM) thanks to the AHP is presented.
Another example can be found in the works of Simpson and Cochran for construction project
prioritisation (Simpson and Cochran, 1987), who however argue that ‘the AHP methodology is
applicable to problem sizes from order 2 to about order 15 [and that] if a large number of projects
is to be considered, some means is required to reduce the number of candidate alternatives”.

- 56 -
Hand
le qualitative crite
riaPrioritise
criteria
Discrete alte
rnatives
Ranking alternatives
Cardinal sc
ale
Reliable
Compu
table
User‐friend
liness
Give Au
tono
my
Evolving
Adapted to projects
DISTA
NCE
IDEA
L METHOD
1 (necessary)
1 (necessary)
1 (necessary)
1 (necessary)
1 (necessary)
55
55
55
0
AHP
11
11
14
54
55
52
Categorical m
etho
d1
0
Compo
site Programming
11
10
Comprom
ise program
ming
11
10
Conjun
ctive metho
d1
0
Coop
erative Gam
e Theo
ry1
11
0
Cost‐ratio m
etho
d0
Disjun
ctive metho
d1
0
Displaced Ideal
11
11
15
43
44
37
ELECTR
E1
11
11
45
35
54
4
Evaluatio
n & Sen
sitivity
Anal. Pro.
11
11
14
33
44
39
Goal program
ming
0
JAS
11
11
14
44
55
35
Lexicographic metho
d1
11
10
MAU
T1
11
11
54
35
44
5
MAV
T1
11
11
45
35
54
4
Maxmin / Minmax
11
10
Multi‐crite
ria Q‐analysis
11
11
13
33
43
311
ORE
STE
11
11
14
53
55
35
Prob
abilistic Trade
‐Off De
v. M
et.
0
PROMETHEE
11
11
14
53
55
53
PROTR
ADE
0
QUALIFLEX
11
11
13
54
55
35
SMAR
T1
11
11
35
45
53
5
STEM
0
STEP
0
Surrogate Worth Trade
‐Off
0
TOPSIS
11
11
14
43
44
47
UTA
11
11
14
53
55
35
Weighted prod
uct m
etho
d1
11
11
25
55
54
4
Weighted sum m
etho
d1
11
11
25
55
54
4
Zion
ts‐W
allnius M
etho
d0
Figure 18. Critical analysis of multicriteria methods

- 57 -
Last but not least, another example in the field of project management is the works of Gourc
(Gourc, 2006) which use the AHP for project risk analysis and assessment, under the assumption
that project risks have multiple aspects. Finally, the reader should note that the AHP also has
many applications in different contexts which all underline the user-friendliness and
intuitiveness of the methodology (Lin and al., 2008), (Gerdsri and Kocaoglu, 2007), (Chiu and
Chen, 2007) which makes it both a very generic and project context-friendly method.
III.3. Using the Analytic Hierarchy Process (AHP) to
assess project complexity
III.3.1. The AHP methodology The Analytic Hierarchy Process (AHP) was developed by Thomas Saaty (Saaty, 1977), (Saaty,
1980), (Saaty, 1990). It is a multi-criteria decision-making method which permits the relative
assessment and prioritization of alternatives. As underlined by Saaty (Saaty, 1981) and exposed
in Fumey (Fumey, 2001), the AHP permits to integrate both quantitative and qualitative aspects
of decision –making, which makes it an efficient and effective method under complex contexts, as
synthesized in Figure 19.
Figure 19. Using the AHP under complex contexts (Fumey, 2001) adapted from (Saaty, 1981)
The AHP is based on the use of pairwise comparisons, which lead to the elaboration of a ratio
scale. The AHP uses a model of the decision problem as a hierarchy, consisting of an overall goal,
a group of alternatives, and a group of criteria which link the alternatives to the goal. Pairwise
comparisons are classically carried out by asking how more valuable an alternative A is to
criterion c than another alternative B. Saaty scales can transform these judgements into
numerical values. As shown hereinafter on Figure 20, pairwise comparisons constitute in the end
AHP
Complexity
Systems approach
Compromise
Multiple objectives
Interdependencies
Between the systems’s
Elements
Synthesis through
The evaluation of
A unique criterion
Hierarchical structure
Of several levels
Coherence and
Consistency of
Judgements
Measure of
Non-tangible
Characteristics

- 58 -
square matrices, the values of which are between 1/9 and 9, and the diagonal elements of which
are equal to 1 while the other elements verify two conditions:
• The i-jth element is equal to the comparison between element i and element j regarding the
considered criterion.
• For i different from j, the i-jth element is equal to the inverse of the j-ith element
⎥⎥⎥⎥⎥⎥⎥⎥⎥⎥⎥
⎦
⎤
⎢⎢⎢⎢⎢⎢⎢⎢⎢⎢⎢
⎣
⎡
1.../1.../1.../1/1........................
...1.../1.../1/1........................
......1.../1/1........................
.........1/1
.........1
21
21
21
22212
11112
jninnn
jnijjj
inijii
nji
nji
aaaa
aaaa
aaaa
aaaaaaaa
Figure 20. AHP pairwise positive reciprocal comparison matrices
This piece of information is processed mathematically, in order to transform user information,
objective or subjective, into mathematical one. Priorities are then determined thanks to these
matrices and a global consistency test can be performed to evaluate the coherence of the user’s
judgements. The final result is a table which gives a global evaluation of each alternative for the
objective, as well as for each criterion. The reader should note at this stage that the fact that the
AHP allows inconsistencies to a certain extent (being under a certain level for the consistency
index) is one of the specific strengths of this method. Indeed the AHP “does not expect perfect
consistency from imperfect humans” (Erkut and Tarmicilar, 1991). Actually, the priority of each
criteria and the final score of the alternatives can be calculated thanks to the maximal
eigenvalues and eigenvectors of the matrices. Indeed, if following (Saaty, 2003) and the famous
Perron-Frobenius theorem (Horn and Johnson, 1990), then the following assumption can be
proved. For a given positive matrix A, the only positive vector x and only positive constant c that
satisfy Ax = cx, is a vector x that is a positive multiple of the Perron vector (principal eigenvector)
of A, and the only such c is the Perron value (principal eigenvalue) of A. For strongly consistent
matrices (which means that rows are multiples of each other), then the rank of the matrix is 1,
and there is only one eigenvalue, which is in essence the maximal one. In the general case,
principal eigenvectors and values can be calculated thanks to the power iteration algorithm. This
algorithm does not compute a matrix decomposition, and hence it can be used on very large
sparse matrix. However, it can find only one eigenvalue (the one with the greatest absolute value)
but since the objective here is to find exactly this eigenvalue, we argue for the use of this
algorithm to facilitate calculations. The reader should note however that this algorithm may
converge slowly.

- 59 -
III.3.2. Building up the hierarchical structure According to Baker and al. (Baker and al., 2001), criteria used in multi-criteria decision making
methods should be:
• able to discriminate among the alternatives and to support the comparison of the
performance of the alternatives
• complete to include all goals,
• operational and meaningful,
• non-redundant,
• few in number.
With the refined project complexity framework, an AHP hierarchical structure is to be built
according to Figure 21. The overall goal (objective) is the ranking of alternatives. First level
criteria (intermediary goals) correspond to the four groups of project complexity factors, that is to
say project size, project variety, project interdependencies and project context-dependence.
Sub-criteria then correspond to the factors which exist in the refined framework. Default values
for the criteria weights can be kept (relative weights coming from the Delphi study) but we want
to leave the users the possibility to assess by themselves the criteria and sub-criteria weights
thanks to the whole AHP process. Moreover, the opportunity to add the complexity criteria which
were eliminated between the original and the refined version of the framework should also be left.
New criteria or new values should also be possibly added in order to be more consistent with the
project context the user is working in.
Figure 21. AHP hierarchical structure to assess project complexity
The hierarchical structure we propose here meets the requirements exposed at the beginning of
this paragraph. Indeed, criteria in the structure are:

- 60 -
• able to support the comparison of the performance of the alternatives, since Saaty scales
can easily be built to permit pair-wise comparisons of alternatives regarding each
criterion
• complete to include all goals, since they address any aspect of project complexity as they
correspond to the project complexity framework that was built
• operational and meaningful, since they were generated from a state of the art of
industrial and academic works
• non-redundant, since the construction of the framework included a step of gathering
similar factors under a same common denomination to avoid repetition
• few in number, since there are only 17 sub-criteria for the evaluation of a characteristic
which is in essence complex
III.3.3. Proposing a relative measure for project complexity
Given the ranking obtained thanks to the AHP calculations on the set of alternatives, a relative
measure of project complexity is proposed. Once again, we insist on the fact that alternatives can
be projects in a multi-project environment, possible future projects compared to former ones,
areas of a given project or project possible future scenarios in a mono-project environment, etc…
Let Si be the priority score of alternative Ai obtained thanks to AHP calculations (0 ≤ Si ≤ 1). We
propose that the relative complexity of alternative Ai, given the specific context of the set of
alternatives, can be expressed as the following ratio
10)max(
≤≤→= ii
ii CI
SS
CI
A relative project complexity scale between 0 and 1 can thus be built thanks to this method (this
index indeed permits to classify projects / project scenarios / project areas according to their global
score regarding the main project complexity sources). This scale thus permits to give a relative
indicator of project complexity (relative since it is related to the initial set of alternatives), but
which does not depend on the models of the projects (the only expert evaluation of the projects
regarding sub-criteria is needed). .Subscales can then be defined in the same manner to focus on
specific aspects of project complexity and highlight how a project is complex regarding
interdependencies or context for instance. An even more precise level can be defined similarly
(when descending to sub-criteria in the hierarchical structure) to underline how a project is
complex regarding specifications interdependence for instance. Before obtaining a first validation
on a case study, a last point should be stressed. As mentioned before, Saaty scales are built up to
transform the users’ evaluations into numerical data. An example of a basic Saaty scale is given
hereunder for team cooperation and communication criterion in Figure 22. When team
cooperation and communication is judged less achieved in project i than project j, then more
project complexity is generated in project i than project j. The corresponding Saaty scale is built

- 61 -
to express numerically this difference with odd values. The reader should note that margin is
given since intermediary even values can be used to refine the judgments.
Team cooperation and communication criterion Saaty scale
Team cooperation and communication is judged equal in projects i and j. Aij = 1
Team cooperation and communication is judged is moderately less
achieved in project i than project j.
Aij = 3
Team cooperation and communication is judged is strongly less achieved
in project i than project j.
Aij = 5
Team cooperation and communication is judged is very strongly less
achieved in project i than project j.
Aij = 7
Team cooperation and communication is judged is extremely less achieved
in project i than project j.
Aij = 9
Figure 22. Example of a basic Saaty scale (Team cooperation and communication criterion)
However, such judgments can be uncertain for such evaluation scales are directly influenced by
the users’ subjectivity. This work thus proposes that, whenever it is possible, Saaty scales should
be refined by objective measures or evaluations. An example is to be given later in the case study
as an illustration. No absolute Saaty scales which could be used for any project in any firm is
defined in this work. This would seem to be irrelevant, since a given project may appear much
more complex in a firm A than in a firm B, for instance because of differences in project
management maturity within the two firms. This remark does not diminish the pertinence and
usefulness of the complexity measure which is proposed. Indeed, what is interesting for final
users is to know whether a given project is complex within a portfolio or regarding their usual
industrial activity (for instance compared to their usual projects) and what sources of complexity
appear in this specific project. The methodology and measure proposed here permits to answer
this question, as illustrated by the case study in paragraph III.5.
But before going on, as underlined by some works (Isaacs, 1963), (Erkut and Tarimcilar, 1991),
(Bayazit, 2005), (Cheng and al., 2007), sensitivity analysis in multi-criteria decision-making, and
notably when using the AHP, should be performed in order to underline the robustness of a
choice. Sensitivity analysis indeed permits to understand the consequences of a change in the
weights of criteria and sub-criteria. For instance, decision makers are likely to change their
opinion about (sub-)criteria over time because of an evolving context. Or in the case of multiple
decision makers, disagreements when performing the AHP evaluations may involve future
changes or some confidence intervals for the definition of the weights. In the end, whatever the
reasons of the doubts and the ‘what if” questions, sensitivity analysis improves the credibility and
reliability of the AHP model and results. That is why the next paragraph analyses the sensitivity
of the proposed project complexity evaluation model.

- 62 -
III.4. Sensitivity analysis
III.4.1. The AHP score reformulation
As a whole, in the AHP hierarchy proposed in the formulation of our problem, the decision-maker
formulates several pair-wise comparison matrices:
• A matrix C comparing the four criteria to one another (size, variety, interdependency and
context-dependence), the eigenvector of which permits to identify the relative weights of
these categories W1, W2, W3, W4.
• For each j from 1 to 4, let Kj be the number of sub-criteria corresponding to criterion Cj.
Four matrices SC1, SC2, SC3 and SC4 permit to compute T other weights )( jkw , where
∑=
=4
1jjKT . Kj can easily be identified thanks to the reading of the refined framework.
However, new sub-criteria might be included in the hierarchy or some existing sub-
criteria might be deleted from the hierarchy in order to cling better to a specific industrial
context. That is why we choose to keep this generic formulation here.
• Then, T comparison matrices are built up to compare the alternatives regarding each sub-
criterion. This permits to define for each evaluated project Pi a set of T scores )( jkib .
In the end, the overall score of project Pi (which permit to perform the ranking of the projects and
identify the most complex ones in the end) can be formulated as
∑∑= =
=4
1 1
)()()(j
K
k
jki
jkj
j
bwWiS
This formulation of the score of each project Pi is the one which is going to be used to perform the
several steps of the sensitivity analysis that is proposed in this Ph.D. thesis.
III.4.2. Overall gradient analysis
A first overall sensitivity analysis is proposed. In order to do, S(i) is to be rewritten in the
following manner
∑∑∑== =
==T
kkik
j
K
k
jki
jkj bwbwWiS
j
1
4
1 1
)()()( ,
Where
)4()(
)4(443
)3()(
)3(332
)2()(
)2(221
)1()1(11
321321
2121
11
,&,)1(,
,&,)1(,
,&,)1(,
,&,1,
iKKKkkiKKKkk
iKKkkiKKkk
iKkkiKkk
kikikk
bbiwWwKkKk
bbiwWwKkKk
bbiwWwKkKk
bbiwWwKkk
−−−−−−
−−−−
−−
=∀=≤≤+∀
=∀=≤≤+∀
=∀=≤≤+∀
=∀=≤≤∀
Moreover, we know that the following condition is respected on the overall weights wk
∑=
=T
kkw
11

- 63 -
As suggested in (Erkut and Tarimcilar, 1991) with calculations on cases with T = 2 or T =3, we
propose that S(i) can be considered as a linear function of a given weight under certain conditions.
Let us suppose that a weight wr can vary from 0 to 1 and that the ratios of the other weights are
fixed (to keep the same proportion that is given after performing pair-wise comparisons). The
gradient sensitivity can be studied in order to analyze in a first manner the sensitivity to the
variation of wr. In order to facilitate the notations, let us suppose that one wants to study the case
of w1. Let the ratios of other weights be
T
TT
k
kk w
wp
ww
pww
pww
p 12
2
1
4
32
3
21 ,...,,...,, −
−+
+ ====
Then,
1....)(....)()(
...,,1.......
,1.......
2
1
2
2
2
11
4424211
3311
=++++++
=+++++++=++++++
ΠΠΠ−
−=
−
=
−
=TTl
T
klTl
T
lTl
T
l
Tk
Tk
wwpwpwpw
wwwwpwppwwwwwpw
As a whole, we can write
))(1(
)1(2
1
21
∑Π−
=
−
=
+
−= T
ml
T
ml
T
p
ww,
And
))(1(
)1)((),1(2, 2
1
2
1
2
)1(
∑Π
Π−
=
−
=
−
−=
+
−=−≤≤∀ T
ml
T
ml
l
T
klk
p
wpwTkk
As a whole, for any i, we can rewrite the score S(i) as
))(1(
)1()
))(1(
)1)((()( 2
1
21
1
1
22
1
2
1
2
)1(11
∑Π∑ ∑
∑Π
Π−
=
−
=
=
−
=−
=
−
=
−
−=
+
−+
+
−+== T
ml
T
ml
Tiki
T
k
T
kT
ml
T
ml
l
T
klikik
p
bwb
p
wpbwbwiS ,
Meaning that S(i) can be rewritten as an expression which is linear in w1,
)))(1())(1(
)(()
))(1())(1(
)(()( 2
1
2
1
22
1
2
2
)1(2
1
2
1
22
1
2
2
)1(11
∑Π∑
∑Π
Π
∑Π∑
∑Π
Π−
=
−
=
−
=−
=
−
=
−
−=
−
=
−
=
−
=−
=
−
=
−
−=
++
++
+−
+−= T
ml
T
ml
TiT
kT
ml
T
ml
kil
T
klT
ml
T
ml
TiT
kT
ml
T
ml
kil
T
kli
p
b
p
bp
p
b
p
bpbwiS
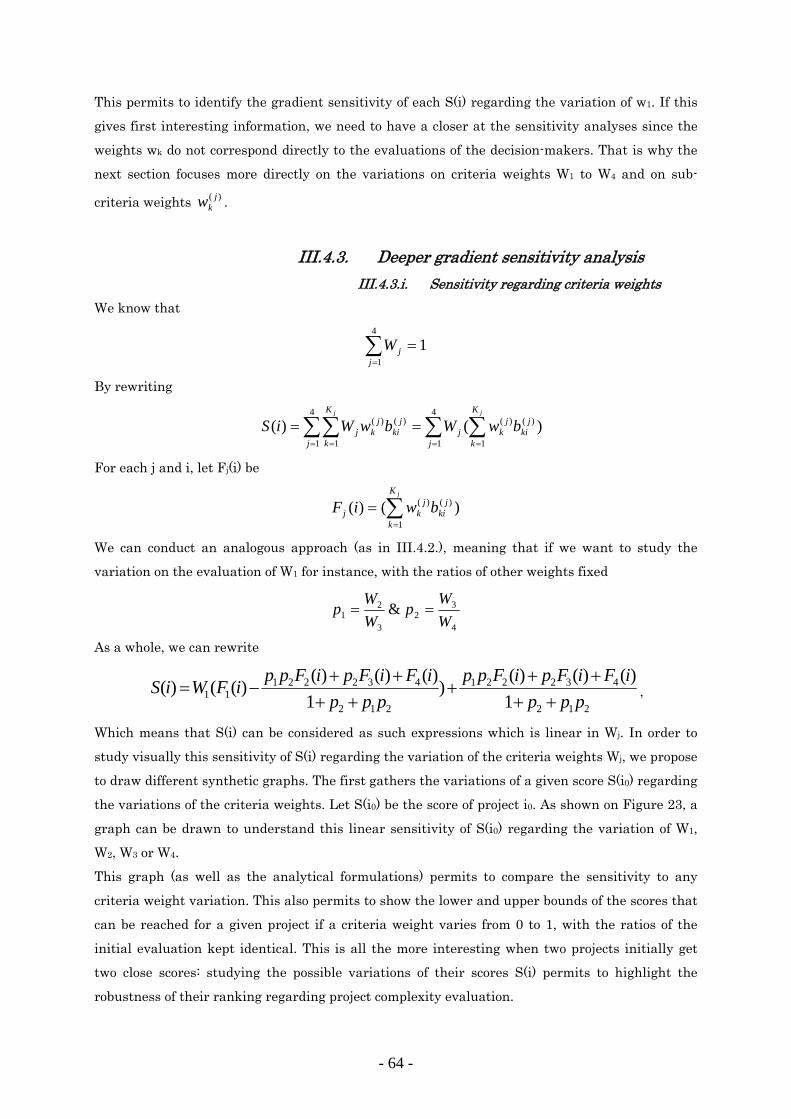
- 64 -
This permits to identify the gradient sensitivity of each S(i) regarding the variation of w1. If this
gives first interesting information, we need to have a closer at the sensitivity analyses since the
weights wk do not correspond directly to the evaluations of the decision-makers. That is why the
next section focuses more directly on the variations on criteria weights W1 to W4 and on sub-
criteria weights )( jkw .
III.4.3. Deeper gradient sensitivity analysis
III.4.3.i. Sensitivity regarding criteria weights
We know that
∑=
=4
11
jjW
By rewriting
∑ ∑∑∑= == =
==4
1 1
)()(4
1 1
)()( )()(j
K
k
jki
jkj
j
K
k
jki
jkj
jj
bwWbwWiS
For each j and i, let Fj(i) be
∑=
=jK
k
jki
jkj bwiF
1
)()( )()(
We can conduct an analogous approach (as in III.4.2.), meaning that if we want to study the
variation on the evaluation of W1 for instance, with the ratios of other weights fixed
4
32
3
21 &
WW
pWWp ==
As a whole, we can rewrite
212
432221
212
43222111 1
)()()()
1)()()(
)(()(ppp
iFiFpiFppppp
iFiFpiFppiFWiS
++++
+++
++−= ,
Which means that S(i) can be considered as such expressions which is linear in Wj. In order to
study visually this sensitivity of S(i) regarding the variation of the criteria weights Wj, we propose
to draw different synthetic graphs. The first gathers the variations of a given score S(i0) regarding
the variations of the criteria weights. Let S(i0) be the score of project i0. As shown on Figure 23, a
graph can be drawn to understand this linear sensitivity of S(i0) regarding the variation of W1,
W2, W3 or W4.
This graph (as well as the analytical formulations) permits to compare the sensitivity to any
criteria weight variation. This also permits to show the lower and upper bounds of the scores that
can be reached for a given project if a criteria weight varies from 0 to 1, with the ratios of the
initial evaluation kept identical. This is all the more interesting when two projects initially get
two close scores: studying the possible variations of their scores S(i) permits to highlight the
robustness of their ranking regarding project complexity evaluation.

- 65 -
Figure 23. Sensitivity analysis of score S(i0) regarding the variations of any criteria weight Wj
Another interesting graph which can be built up can be seen on Figure 24.
Figure 24. Sensitivity analysis of any score S(i) regarding the variations of criteria weight Wj0
W1
W4
W2
W3
S(1)
S(2)
S(3)
S(5)
S(4)

- 66 -
This graph shows the possible variations of the scores of all evaluated projects S(i) regarding the
variation of a criteria weight Wj0. This gives particular insights as the variations of the scores are
compared. Interestingly, by studying first the close neighbourhood of the initial evaluation, one
can analyse the robustness of the initial ranking. Moreover, one can underline when and how the
initial ranking of the projects is going to change thanks to the crossings of the lines on the graph.
This point is interesting since it permits to see the level of variation which is needed to have a
change in the initially obtained ranking. In other terms, this permits to stress how robust the
initial ranking is by defining the interval of possible variation of Wj0, where the ranking is kept
the same.
III.4.3.ii. Sensitivity regarding sub-criteria weights
Here, we want to understand the sensitivity of the scores S(i) regarding the variations of sub-
criteria weights. In order to so, we fix a certain sub-criterion weight )( jkw , for instance )2(
1w . Then
we suppose that the ratios of all other )2(kw are fixed and we note that
∑=
=2
1
)2( 1K
kkw
Then, we can rewrite the scores S(i) in the following manner
)()(2
1
)2()2(2
4
21 1
)()(4
1 1
)()( ∑∑∑∑∑=
≠= == =
+==K
kkik
jj
K
k
jki
jkj
j
K
k
jki
jkj bwWbwWbwWiS
jj
By performing analogous calculations as in the former paragraphs, we can rewrite
))()(()( )2(12
4
21 1
)()( iiwWbwWiSjj
K
k
jki
jkj
j
πθ ++= ∑∑≠= =
Where )(iθ and )(iπ can be calculated similarly as in III.4.2. by replacing T and K2. As a whole,
this permits to show that S(i) can be considered as this expression which is linear in )2(1w . That is
why we suggest the drawing and analysis of similar graphs than those built up in III.4.3.i.
III.5. Case study
III.5.1. Introduction The case study takes place within a start-up firm, the main activity of which is the production of
stage musicals in France. Staging musicals or theatre plays are definitely projects, as underlined
by Lehner (Lehner, 2009): it refers to all artisitical, technical and organizational processes which
permit to stage a musical. Project start corresponds to the idea and choice of the show to stage.
Project end is generally considered as the first performance or the first week of performances (the
activities which follow are often considered as the core day-to-day running activities of a theatre
production firm). In the case studied, the firm has a portfolio of 7 projects of musicals to be staged

- 67 -
in 2010-2011. The managers of the firm, who are at the start of their activity (with both artistic
and industrial backgrounds), are assisted by several possible investors and partners. They
wonder which show(s) they should produce first.
As for them and as for us, project complexity appears here as one of the criteria which should be
considered before making a decision on this issue. Other criteria may notably be linked with the
overall project performance regarding the values creation processes of the project (notably in
terms of profit, image, etc…). A global project selection process may then be defined after this
study in order to include all these factors in a multi-criteria approach to select the best project.
Here, we do focus on project complexity evaluation for the moment. Actually, in the context of this
firm, the importance of project complexity as a factor for selection is all the more true than the
lack of experience in star-up firms implies even greater difficulties to handle properly project
complexity. As a consequence, a proper evaluation of relative project complexity appears to be
really necessary. Some project complexity aspects are very present or specific to this sector, and
as an introduction to this case study, we need to describe this specific context.
• Since they progress in the cultural sector, such projects are very likely to face scarcity and
problems of matching incomes and expenses. The struggle for income also means that
most long-term planning must be kept open for very swift changes as new orders and
constraints are likely to appear. Incomes are also very difficult to foresee in France since
French audiences are not used to musicals (for the staging of musicals has been rarer
than in other countries for decades).
• Project management techniques are generally very new in this sector, and the majority of
stakeholders may not be used to it. This lack of experience and maturity may imply some
difficulties when dealing with project complex issues. Lack of experience is also present in
this case since these projects occur within a start-up firm: people have very little
experience working together for the majority of them.
• Logistic and technical constraints are much higher in the sector of musicals than in any
other artistic domains. First, three artistic disciplines and thus three cultures (comedy,
singing, dancing) have to coexist. Moreover, technological complexity is generally greater
than in other artistic domains since musicals’ sets and direction often imply more
elaborated technological tools and mechanisms for staging.
In Figure 25, the reader can find a brief description of the 7 projects. Cast, creative team and
project team size are notably given hereunder. Note that global budget is a first assessment of the
overall budget of the project and that project duration is estimated work before staging. The
achievement of the first performance is considered as part of the project. Project 1 is the
production of a French adaptation of a Broadway musical, whereas projects 2 to 7 are original
creations. Projects 1, 2, 6 and 7 include some special effects (notably pyrotechnical ones for some
of them). Projects 1 to 6 require detailed work on costume and set design (notably with advanced
mechanical structures and machinery for some of them).
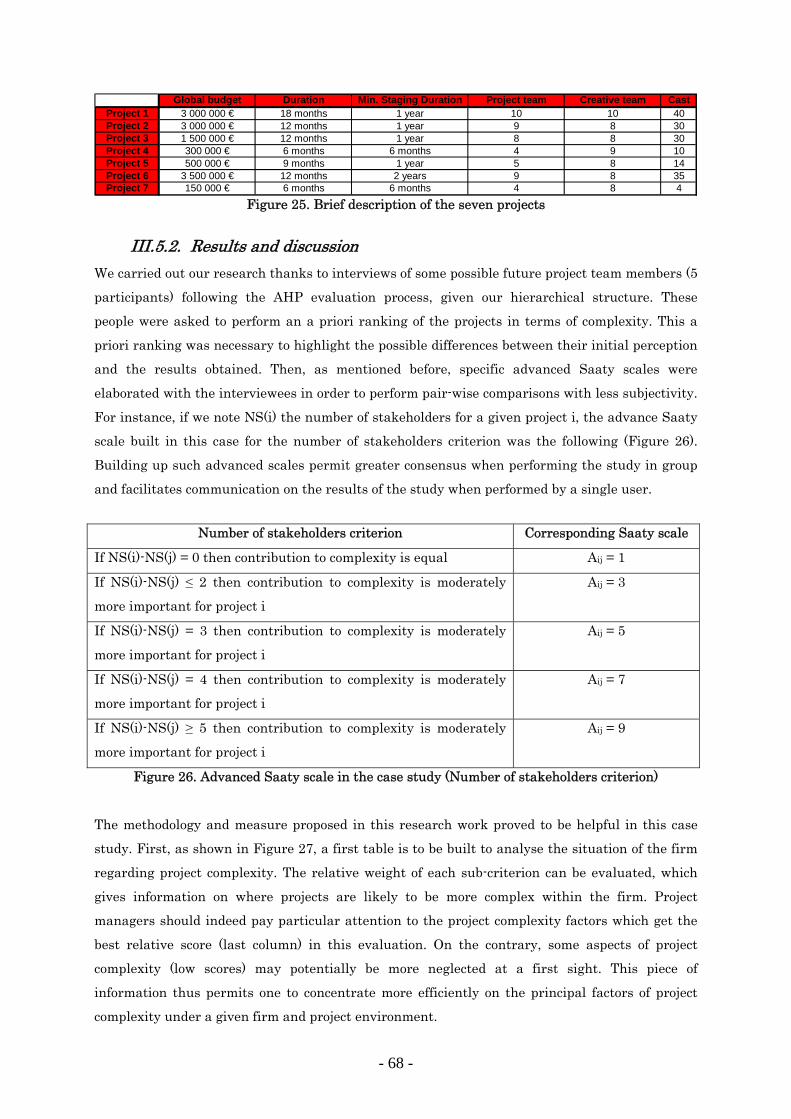
- 68 -
Global budget Duration Min. Staging Duration Project team Creative team CastProject 1 3 000 000 € 18 months 1 year 10 10 40Project 2 3 000 000 € 12 months 1 year 9 8 30Project 3 1 500 000 € 12 months 1 year 8 8 30Project 4 300 000 € 6 months 6 months 4 9 10Project 5 500 000 € 9 months 1 year 5 8 14Project 6 3 500 000 € 12 months 2 years 9 8 35Project 7 150 000 € 6 months 6 months 4 8 4
Figure 25. Brief description of the seven projects
III.5.2. Results and discussion
We carried out our research thanks to interviews of some possible future project team members (5
participants) following the AHP evaluation process, given our hierarchical structure. These
people were asked to perform an a priori ranking of the projects in terms of complexity. This a
priori ranking was necessary to highlight the possible differences between their initial perception
and the results obtained. Then, as mentioned before, specific advanced Saaty scales were
elaborated with the interviewees in order to perform pair-wise comparisons with less subjectivity.
For instance, if we note NS(i) the number of stakeholders for a given project i, the advance Saaty
scale built in this case for the number of stakeholders criterion was the following (Figure 26).
Building up such advanced scales permit greater consensus when performing the study in group
and facilitates communication on the results of the study when performed by a single user.
Number of stakeholders criterion Corresponding Saaty scale
If NS(i)-NS(j) = 0 then contribution to complexity is equal Aij = 1
If NS(i)-NS(j) ≤ 2 then contribution to complexity is moderately
more important for project i
Aij = 3
If NS(i)-NS(j) = 3 then contribution to complexity is moderately
more important for project i
Aij = 5
If NS(i)-NS(j) = 4 then contribution to complexity is moderately
more important for project i
Aij = 7
If NS(i)-NS(j) ≥ 5 then contribution to complexity is moderately
more important for project i
Aij = 9
Figure 26. Advanced Saaty scale in the case study (Number of stakeholders criterion)
The methodology and measure proposed in this research work proved to be helpful in this case
study. First, as shown in Figure 27, a first table is to be built to analyse the situation of the firm
regarding project complexity. The relative weight of each sub-criterion can be evaluated, which
gives information on where projects are likely to be more complex within the firm. Project
managers should indeed pay particular attention to the project complexity factors which get the
best relative score (last column) in this evaluation. On the contrary, some aspects of project
complexity (low scores) may potentially be more neglected at a first sight. This piece of
information thus permits one to concentrate more efficiently on the principal factors of project
complexity under a given firm and project environment.

- 69 -
Criteria (C) C weights Sub-criteria (SC) SC weights Total weights Relative value
C1 - Project Size 0,142 SC1 - Number of stakeholders 1,000 0,142 0,804
C2 - Project variety 0,151 SC2 - Variety of informations systems to be combined 0,057 0,009 0,049
SC3 - Geographic location of the stakeholders 0,295 0,045 0,252
SC4 - Variety of the interests of the stakeholders 0,649 0,098 0,555
C3 - Project interdependencies 0,556 SC5 - Dependencies with the environment 0,092 0,051 0,290
SC6 - Availability of people, material and… due to sharing 0,042 0,024 0,133
SC7 - Interdependence between sites, departments and… 0,062 0,034 0,194
SC8 - Interconnectivity/Feedback loops in the project networks 0,020 0,011 0,062
SC9 - Team cooperation and communication 0,189 0,105 0,596
SC10 - Dependencies between schedules 0,042 0,024 0,133
SC11 - Interdependence of information systems 0,019 0,011 0,060
SC12 - Interdependence of objectives 0,122 0,068 0,383
SC13 - Level of interrelations between phases 0,094 0,052 0,297
SC14 - Specification Interdependence 0,318 0,177 1,000
C4 - Project context-dependence 0,151 SC15 - Cultural configuration and variety 0,633 0,096 0,542
SC16 - Environment organisational complexity 0,260 0,039 0,223
SC17 - Environment technological complexity 0,106 0,016 0,091 Figure 27. Overall criteria and sub-criteria weights: project complexity factors comparison
As said before, we left the users the possibility to follow the entire AHP process, meaning that the
relative weights of each criterion and sub-criteria obtained thanks to the Delphi study were not
given to the users. It is undoubtedly interesting to see that the panel of interviewees in our case
study obtained a ranking of the criteria and sub-criteria which were consistent with the one
obtained with the Delphi study. For instance, as shown on Figure 28, project interdependencies
notably appear as the greatest source of global project complexity, since they globally account for
more than 55% of the final sum score of the project in our evaluation. The reader should note that
in this case, project context appears to be a slightly more important driver of project complexity
than in the Delphi study (accounting for around 15% of the final score, equal to the score of
variety and slightly superior to the one of project size).
Size Variety Interdependencies Context TotalProject 1 0,029 0,056 0,142 0,064 0,292Project 2 0,031 0,019 0,096 0,017 0,162Project 3 0,017 0,017 0,058 0,012 0,105Project 4 0,004 0,007 0,024 0,006 0,040Project 5 0,007 0,009 0,026 0,014 0,055Project 6 0,051 0,038 0,185 0,033 0,308Project 7 0,003 0,006 0,025 0,005 0,038
Total 0,142 0,151 0,556 0,151 1,000 Figure 28. Relative weights of the seven projects

- 70 -
Figure 29. Relative project complexity index in the case study
In the end, final results are obtained and permit to realise a ranking of projects according to a
complexity scale / index (from 0 to 1), as shown on Figure 29. It can be noted that two projects (P6
and P1) appear to be much more complex than the others, then Project 2 appears to be
significantly more complex than the other ones.
First, the existence of a numerical relative evaluation of project complexity within a project
portfolio appears to be promising since it permits to know which projects are to be the most
complex ones, but also how complex projects are. Future research works are carried out to set out
a methodology which could define a threshold value (in the context of the studied project portfolio)
over which projects could be rejected (notably given the experience and project maturity of the
firm). Moreover, this global ranking according to the relative project complexity index we propose
is all the more interesting in this case study since the employees which were interviewed had
made an a priori ranking which was different. In that a priori ranking, P3 was ranked second and
P7 was ranked third, whereas P6 was only placed fourth. With this numerical assessment of
complexity and this ranking given, discussions were held with the participants, and
communication around the notion of complexity was facilitated.
They started to share their experience on complexity factors and realized that the difference with
the a priori ranking they had done was mainly due to some communication and psychological
barriers they had. For instance, P7 was a priori ranked by them third because the majority of
them did not know where to find the skills and competence for the design of a specific special
effect. Four of them had thus ranked this project as one of the most complex ones (two of them
had even ranked it as the most complex). But when performing the pair-wise comparisons, the

- 71 -
fifth employee, who had ranked a priori P7 as the less complex, said that he had already worked
with such special effects and knew who could design them easily. The others changed their minds.
Such example in our case study proves both the necessity to facilitate and promote
communication in order to manage complex projects more efficiently and the benefits obtained
with the project complexity refined framework and index we propose.
Figure 30. Specific graphical comparison of projects 1 and 6.
Finally, before performing a sensitivity analysis, as shown on Figure 30, we claim for the use of
specific numerical and graphical comparisons of projects which obtain close scores. For instance,
in this case, project 6 obtains a global score of 0.308 when project 1 obtains a score of 0.292, which
makes in the end a small difference (around 5%). In order to assist the decision-makers with their
decisions, a closer look is to be done over the two projects. When realizing that the score of
interdependencies (the main factor) is 0.185 for project 6 and 0.142 for project 1 (difference of
around 25%), the people which were interviewed in this case study definitely evaluated project 6
more complex that project 1. Indeed, when analysing closer why such a difference was obtained,
the participants underlined notably a greater specifications interdependence and interdependence
of information systems for project 6. These specific interdependencies seemed all the more
difficult to handle for the participants, which led them to the conclusion to reject project 6 at the
time of this study. More precise comparisons can even be performed when descending to the level
of sub-criteria and comparing projects on 0 to 1 relative subscales, as shown on Figure 31 with
specifications interdependence sub-criterion.
Specifications interdepence indexProject 1 0,499Project 2 0,554Project 3 0,219Project 4 0,096Project 5 0,071Project 6 1,000Project 7 0,140
Figure 31. Building up comparison subscales on sub-criteria
Project 1 Project 6Size
Context
Interdependencies
Variety
0
Project 1 Project 6Size
Context
Interdependencies
Variety
0

- 72 -
Finally, sensitivity analyses are likely to be performed in order to study the variation and
robustness of the results and ranking which is obtained, so that decision-makers are more
confident with the decisions they make. For instance, we notably studied the possible variations
of the seven project scores regarding any criteria weight variation.
We knew that, with the notations of III.4.3.i.,
212
432221
212
43222111 1
)()()()
1)()()(
)(()(ppp
iFiFpiFppppp
iFiFpiFppiFWiS
++++
+++
++−=
Whatever j and i, the scores Fj(i) can be calculated with the results that were obtained before
(they can be found hereunder in Figure 32). F1( i) F 2( i) F3 (i) F4 (i)
P rojec t 1 0,2 04 0,37 1 0 ,255 0 ,4 24P rojec t 2 0,2 18 0,12 6 0 ,173 0 ,1 13P rojec t 3 0,1 20 0,11 3 0 ,104 0 ,0 79P rojec t 4 0,0 28 0,04 6 0 ,043 0 ,0 40P rojec t 5 0,0 49 0,06 0 0 ,047 0 ,0 93P rojec t 6 0,3 59 0,25 2 0 ,333 0 ,2 19P rojec t 7 0,0 21 0,04 0 0 ,045 0 ,0 33
Figure 32. Synthesis of the Fj(i) scores
This permits to draw four graphs which synthesise the sensitivities of all scores S(i) regarding
any criteria weight variation (W1 related to size, W2 related to variety, W3 related to
interdependency and W4 related to context-dependence). The one related to W3 can be found
hereunder in Figure 33 and is built up thanks to following equations corresponding to the
sensitivity to W3 variation.
3
3
3
3
3
3
3
014,0031,0)7(058,0275,0)6(021,0068,0)5(005,0038,0)4(001,0103,0)3(022,0151,0)2(080,0335,0)1(
WSWSWSWS
WSWSWS
×+=×+=×−=×+=×+=×+=×−=
As a whole, we can see that the obtained results are not too sensitive since the rankings of the
project do not vary so much. Project 2, Project 3 and Project 5 are to keep always the same
ranking whatever the value of W3 (with ratios of other weights kept constant): project 2 is third,
project 3 is fourth, project five is fifth. Project 4 and Project 7 are always very close to one another
and alternate the position of fifth and sixth project. The two first projects are the most sensitive
ones to a variation in the value of W3. When W3 is inferior to 0.435, then project 1 is the most
complex. Project 6 is the most complex in the other case, and thus notably when W3 is 0.556
(corresponding to the initial evaluation of the members). The obtained ranking may in the end
give quite good confidence in the analysis made for decision-making (regarding a change in W3)
since no change in the ranking occurs if W3 is kept between 0.435 and 0.778. In other terms,
unless a variation of 21.7% downwards and 39.9% upwards.
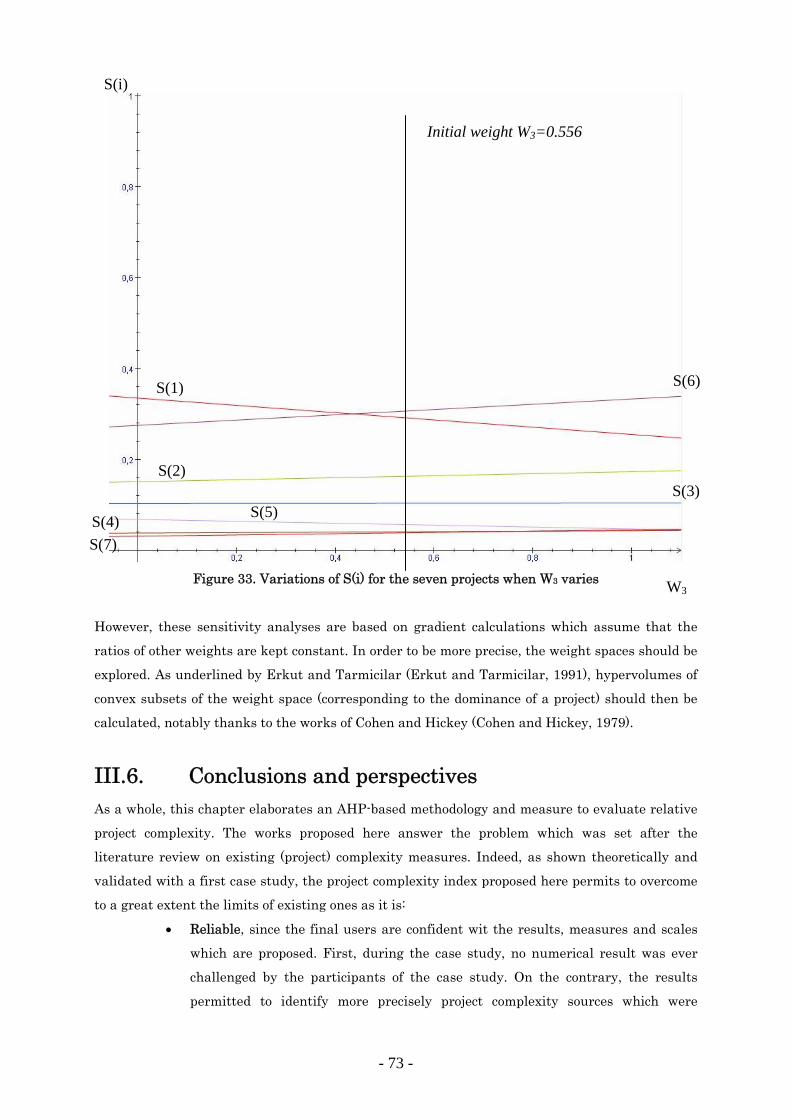
- 73 -
Figure 33. Variations of S(i) for the seven projects when W3 varies
However, these sensitivity analyses are based on gradient calculations which assume that the
ratios of other weights are kept constant. In order to be more precise, the weight spaces should be
explored. As underlined by Erkut and Tarmicilar (Erkut and Tarmicilar, 1991), hypervolumes of
convex subsets of the weight space (corresponding to the dominance of a project) should then be
calculated, notably thanks to the works of Cohen and Hickey (Cohen and Hickey, 1979).
III.6. Conclusions and perspectives
As a whole, this chapter elaborates an AHP-based methodology and measure to evaluate relative
project complexity. The works proposed here answer the problem which was set after the
literature review on existing (project) complexity measures. Indeed, as shown theoretically and
validated with a first case study, the project complexity index proposed here permits to overcome
to a great extent the limits of existing ones as it is:
• Reliable, since the final users are confident wit the results, measures and scales
which are proposed. First, during the case study, no numerical result was ever
challenged by the participants of the case study. On the contrary, the results
permitted to identify more precisely project complexity sources which were
W3
S(i)
S(1)
S(2)
S(3)
S(4) S(5)
S(6)
S(7)
Initial weight W3=0.556

- 74 -
consciously or unconsciously felt without being clearly mentioned or stated.
Furthermore, the reliability of the results was also underlined when comparing
with the a priori ranking which was made. The obtained results permitted to
underline what they had forgotten in their a priori ranking and all the users
agreed in the end on the ranking obtained by the complexity index proposed in
this work.
• Intuitive and user-friendly, since the users understand the construction of the
measure and scales, and why they do measure project complexity or the level of
complexity regarding a given criterion, sub-criteria, or set of (sub-)criteria. This
results in the end in a facilitation of communication on project complexity and
project complexity factors. Finally, the measures and scales were easily computed
and permitted rapid calculations and quick changes, which was an important
requirement for an industrial use.
• Globally independent of the project models which are used for project
management. Indeed, no reference to project management tools or models (WBS,
PERT networks, GANTT charts, risk lists, etc…). was ever made during the
construction of the measure or during the case study. This means that none of
these models is needed as a reference to assess project complexity through this
method. However, a limitation exists on this point. The (refined) project
complexity framework built in Chapter 2 is the basis of the measure proposed in
this Chapter. But, one should not forget that this framework is in essence a
specific model, not of a project, but of what project complexity stands for. As a
consequence, the measure which is proposed refers theoretically to this project
complexity model. However, the final user is free to add some aspects (project
complexity factors) in the AHP hierarchical structure proposed in this study. The
methodology which is proposed here is thus quite generic with the project
complexity model used, as long as it can be modelled as a hierarchical structure of
project complexity factors.
• Able to highlight project complexity sources when building up the global
complexity scale and the subscales. As shown by the case study, these scales
enable the user to address many issues regarding decision-making and project
complexity:
o Project prioritization within a portfolio in order to focus on the most
complex projects (the ones where more complexity-related management
methods and tools are needed).
o Project areas (for instance thanks to a classical WBS decomposition, or
according to geographical areas) prioritization in order to focus on the
most complex areas of a given project (the ones where more complexity-
related management methods and tools are needed).

- 75 -
o Comparison of present projects with past projects.
o Project scenario prioritization in the case of mono-project management.
o One-to-one detailed comparison of two projects which exist in the same
portfolio in terms of project complexity.
o Global identification of the principal project complexity sources within a
given project / a given portfolio / any set of projects.
• Finally, some sensitivity analyses can be conducted in order to analyse the
robustness and stability of a given ranking which is obtained. Such analyses
permit to elaborate linear equations which describe the possible variations when
the weight scores may evaluate due to a change.
However, some limitations do appear in this work and offer perspectives for future research on
project complexity evaluation.
• First, the Analytic Hierarchy Process has received some criticisms on the fact that
rankings can vary when adding or subtracting an alternative to the set of
alternatives on which the study is performed (Holder, 1990). We thus recommend
the users to give specific attention to the step when the set of alternatives to be
compared is selected. First, all alternatives in this set should strictly correspond
to the final selection or comparison objective which is addressed. Second, projects
on which the final users have few information or data may not be selected first as
the quality of pair-wise comparisons may be considerably reduced. Finally, even
with these recommendations, we need to underline that as for any decision-
making process and tools, great caution and awareness should be taken when
making the final decision (significant gaps should exist between scores and results
may not be too sensitive).
• Second, despite the sensitivity analyses which are proposed here, uncertainty in
the judgment of the users is not much taken into account with this methodology.
To address this issue, we plan to introduce a fuzzy AHP-based method with
triangular fuzzy numbers in future research works. Such applications of this
method in project management can notably be found in (Mahmoodzadeh and al,
2007)
• Finally, future research is going to explore the possible to extend this model to a
ANP (Analytic Network Process) model. Indeed, Taslicali and Ercan (Taslicali and
Ercan, 2006) say that their results suggest that “the ANP model represents
reality as well as reliability better than the AHP model” due to the better
integration of the interactions which exist between criteria. However, “the
managerial implications of the execution of ANP and AHP are factors that vary
from organization to organization” and the AHP seems to be an easier
methodology which may be accepted and understood better by managers. We
think that in our case, exploring the possibility of using the AHP may be

- 76 -
interesting since in essence, the criteria and sub-criteria of our structure are not
independent. Building up a ANP network structure for project complexity
evaluation may then be interesting as it includes interdependence and feedback.
However, the number of judgement elicitations needed are likely to increase and
become tougher when dealing with the interrelation between criteria or sub-
criteria.

- 77 -
Chapter IV. Understanding the stakes of project complexity. Implications on project risk management.
Abstract
The overall ambition of this chapter is to describe the consequences of project complexity
and to understand the stakes of project complexity management. In order to do so, an analysis of
some academic works permits to identify four kinds of complexity-driven phenomena:
• Project ambiguity as a lack of awareness of the project system and a lack of a
shared vision within the project team.
• Project uncertainty as the inability to pre-evaluate the impact of events, actions
and decisions and thus foresee and control the project evolution.
• Project propagation phenomena due to the interdependence of project elements,
including loops.
• Project chaos, mainly in terms of the sensitive dependence on initial conditions.
Practical implications on project risk management are then underlined. First, a state of
the art on project risk management methodologies is proposed. Then, some lacks regarding the
integration of complexity-driven effects lead in the end to the proposal of two research issues:
• A systemic approach to integrate complexity in the project risk management
process through the concept of project vulnerability (Chapter 5).
• An analytic approach to integrate complexity in the project risk management
process through the identification of risk interactions and the clustering of risks
regarding these interactions (Chapter 6).
As a consequence, this chapter is a transition between the two main parts of this thesis.
Indeed, after understanding and measuring project complexity to focus on the most complex
projects or zones of a project (Chapters 2 and 3), we propose to understand the stakes of project
complexity and show the lacks of existing methods (Chapter 4) in order to raise research issues
for the end of this Ph.D. thesis (Chapters 5 and 6).
Chapter Keywords
Project, Complexity, Ambiguity, Uncertainty, Propagation, Risk.

- 78 -
IV.1. Introduction
Project must be managed to achieve their objectives (Turner and al, 1988) but project risks are
likely to prevent them from doing so (Gautier and al., 1997). Even if the relation between risks
and complexity is still to be clarified, project complexity is defined in this work as the property of
a project which makes it difficult to understand, foresee and keep under control its overall
behaviour, even when given reasonably complete information about the project system.
As mentioned in the project complexity framework that was built in Chapter 2, there is a great
number and high diversity of objects to manage, with a high number and great diversity of
parameters that characterize them. The amount and diversity of interactions and
interdependencies between these objects are so huge that they rapidly become unmanageable
thanks to the sole use of classical tools and methods of project management. Identifying specific
zones of complexity within a project or particularly complex projects within a portfolio thanks to
the results of Chapter 3 then permits to focus on smaller parts of a project (or a portfolio), which
assists project (portfolio) management.
As seen in the former chapters, this work claims for the conjoint use of traditional methodologies
and new complexity-integrating tools in order to establish more efficient and effective project
management processes. Indeed, both the complexity of the evolving environment and the internal
complexity of the project justify the need for this new approach that would assist the existing
ones. But before doing so, one should understand what the complexity-driven phenomena within
a project are and what the stakes of project complexity management and integration into project
management processes are.
PROBLEM SETTING OF THIS CHAPTER
That is why this chapter focuses on the stakes and consequences of project complexity in order to
rise some research questions. As shown after, project complexity consequences regarding project
risk management are to be studied.
In order to do so, the following points must be addressed:
• Understanding the stakes and consequences of complexity by linking it with the concepts
of ambiguity, uncertainty, propagation and chaos.
• Understanding as a whole the implications on project risks.
• Carrying out a state of the art on existing project risk management methodologies and
tools.
• Identifying the lacks of the traditional project risk management and tools.
• Rising research issues regarding the integration of complexity into innovative project risk
management methodologies and tools. (These questions are to be solved in Chapters 5 and
6 of this Ph.D. thesis).

- 79 -
IV.2. Understanding the stakes of project complexity
This section aims at describing some of the consequences of project complexity (thanks to an
analysis of the literature review) in order to understand the stakes of project complexity
management and to characterize how it can be helpful to assist project risk management. The
links between project complexity, project risks, project uncertainty and project performance are
still unclear in the academic world as well as in the industrial one. For instance, Parsons-Hann
and Liu state that “it is clear that requirements complexity contributes to project failure in
organisations, what is not apparent is to what degree this statement holds true” (Parsons-Hann
and Liu, 2005).
IV.2.1 The consequences of project complexity Uncertainty appears as one of the possible negative consequences of project complexity. This
paragraph illustrates how project complexity can be a source of uncertainty, thus making a
distinction between these concepts as some research works argued for it before (Pich and al.,
2007), (Little, 2005). In order to follow this paragraph more easily, the reader should refer to the
drawn synthesis on Figure 34.
Figure 34. Project complexity-driven phenomena
Let a project manager analyse a project system at a given time T in order to plan his decisions
and actions for the next period to reach a state at time T+1. The project system can be described
by its real state at time T, a state the real complexity of which can also be considered at time T.

- 80 -
IV.2.1.i. Project ambiguity
When analysing and monitoring the project system at time T, the project manager first perceives
the real state at time T, introducing a difference between the real project state at time T and the
perceived project state at time T (∆1(T)).
This difference has two principal causes. On one hand, the project manager has its own culture
and references, and thus, his perception of the project system alters reality. On the other hand,
real project complexity implies that the project system cannot in essence be completely
understood. Indeed, there is always an irreducible residual source of non-exactitude caused by
complexity (mainly due to the high number and variety of elements and interactions that cannot
be completely neither identified nor understood) when trying to identify the project system state.
For the same reasons, there is a difference (and thus another source of non-exactitude ∆2(T))
between perceived project complexity at time T and real project complexity at time T.
This question of perception is approached by Jaafari (Jaafari, 2003) and appears to be a crucial
issue for project complexity. Jaafari insists on the fact that individuals, depending on their
mental models and representations, perceive the outside reality in their own way. As a
consequence, project complexity is dealt with through a filter, which is the individual perception
of the project system and environment (based on one’s representations). This is all the more true
since the semantics used may be different from a project team member to another. In other terms,
the difficulty is that the gaps ∆1(T) and ∆2(T) are different for any project team member as anyone
has its own perception of reality.
These two phenomena can be grouped under the sole name of project ambiguity. Referring to
some works (Pich and al., 2007), (Haas, 2008), a definition of project ambiguity is proposed
hereunder
Definition
Project ambiguity can be divided into two main aspects:
• The lack of awareness of elements, events and their characteristics (due to
the overall lack of understandability of the project system), particularly
when evaluating them.
• The differences in the perception of the project system by team members,
notably because of their different cultures.
Axiom: Project ambiguity is a consequence of project complexity.
The leadership and adaptability of the project manager is thus crucial in order to try to share a
common reference and perception of reality within the project team, so that part of project
ambiguity can be reduced.

- 81 -
IV.2.1.ii. Project uncertainty
Let us now have an overall look at the global process of project management. The project manager
analyses the state of the project at a given time T and considers the difference δ between this
state at time T and the state he planned for the next period at time T+1. The project manager
then makes decisions under the constraints of project context and perceived complexity and does
the corresponding actions to influence the project evolution in order to reach the planned state at
time T+1. This process is also altered by complexity-driven phenomena in terms of uncertainties.
First, decisions can be directly altered by real project complexity. For instance, the transmission
of the information on a decision can be altered because of cultural variety, staff diversity and staff
interdependences: as a matter of fact, when turning this decision into an action (at the end of the
information transmission process), the real action can be different from the action the project
manager wanted. Moreover, real complexity has an influence on the impact of the decisions made
and the subsequent actions done. The project manager deals with perceived (and not real) project
complexity when making its decisions and moreover, real project complexity entails the project
manager’s inability to forecast efficiently both the impact of its decisions and the project
evolution. Because of these those two reasons, real project complexity is one of the causes of the
difference between the planned state at time T+1 and the real state at time T+1, introducing
another difference ∆3(T). This difference calls for project uncertainty.
Definition
Project uncertainty corresponds to the inability to pre-evaluate project objectives and
characteristics of the project elements as well as the impact of actions and decisions.
Axiom: Project uncertainty is a consequence of project complexity.
IV.2.1.iii. Project propagation phenomena
Finally, project complexity is also a source of non-exactitude in terms of propagation. Indeed, let
an uncertain parameter P be in the project system, meaning that the value of P is known under
conditions of uncertainty P± δP.(confidence interval). P can be for instance the duration of a task,
the cost of a deliverable, or any dimension of any object of the project system. Since the project
system is complex, it includes interdependencies and interconnectivities between its elements
(tasks, resources,…). As a consequence, the corresponding uncertainty δP on a parameter P can
spread through the entire system, as any element in relation with parameter P faces uncertainty
and transmits to all its neighbours in the same manner.
Definition
It corresponds to the fact that any change in the parameters of the project system is to propagate
through the entire project system due to its numerous and varied interdependencies.

- 82 -
Axiom: Project propagation phenomena are a consequence of project complexity.
As Heylighen and al. (Heylighen and al., 2006) underline it, “as technological and economic
advances make production, transport and communication ever more efficient, we interact with
ever more people, organizations, systems and objects.” In the case of project management, one of
the main consequences is that any change in any component in the project system may thus affect
any other component of the project system in an unpredictable way because of change
propagation.
Propagation phenomena are all the more complex to manage since a project, as any complex
system, has a high number of various elements and interactions, meaning for example that
uncertainty on the duration of a task Ti can be transmitted in terms of uncertainty on the
duration of a task Tj, which can be transmitted in terms of uncertainty on the cost of a deliverable
D, which can then be transmitted in terms of uncertainty on the quality of the global project
outcome… In other terms, propagation in the project system is even more complex since the
project manager has to manage the change of the nature of non-exactitude at each stage it is
transmitted within the system. The reader should particularly note that ambiguities and
uncertainties are to be analysed regarding propagation phenomena.
IV.2.1.iv. Project chaos Chaos and turbulence phenomena may appear in a project due to complexity. Chaos refers to a
situation, where the short-term developments cannot be accurtely predicted, notably because of
the joint impact of interdependence and variability (Tavistock 1966), which were identified as
complexity drivers. Chaotic phenomena are sometimes hard to separate from ambiguity,
uncertainty and propagation phenomena. However, they particularly correspond to a sensitive
dependence on initial conditions. This Ph.D. thesis work does not insist on the aspects of chaos
and turbulence. However, the interested reader may find appropriate concepts and references in
(Dörner, 1996), (Laufer, 1997), (Bertelse and Koskela, 2003) and (Pich and al., 2007 ).
IV.2.2 Project complexity and project risks Complexity-driven phenomena are as a whole of four kinds: ambiguity, uncertainty, propagation
and chaos. These phenomena are a major source of non-decidability and unpredictability for the
project system (meaning that the inability to know what is to happen implies difficulties in
decision-making processes). As a consequence, complexity-driven phenomena are a major source
of risks for the project. These risks (whether coming from uncertainties, ambiguity, propagation
or chaotic phenomena) are to increase project complexity (defined in this work as the property of a
project which confers the inability to understand, foresee and keep under control the project’s
overall behaviour). This leads to the existence of a vicious circle as shown next page in Figure 35.

- 83 -
This circle between the project system universe and the project risk universe is to be attentively
kept in mind (as already mentioned in Chapter 2).
Figure 35. Project complexity and project risks
The point is that the project complexity framework is not sufficient to identify efficiently project
risks and to quantify them under complex situations. Notably, there is a crucial need for efficient
risk management processes and tools in order to identify and assess those risks. That is why,
after defining the concept of project risk, the next section reviews the existing traditional project
risk management methods and tools. It also aims at analysing these methodologies regarding
complexity, addressing how such methods can or cannot take into account complexity-driven
phenomena.
IV.3. Implications on project risk management
IV.3.1. Project risks Many definitions of project risks can be found in the literature:
• A risk corresponds to the possibility that the objectives of a system regarding a certain
goal are not achieved. (Haller, 1976)
• A risk measures the probability and the impact of possible damaging events. (Lowrance,
1976)
• A risk consists in the realisation of a feared event with negative consequences (Rowe,
1977).

- 84 -
• A project risk is the possibility that a project is not executed with conformity to the
previsions of end date, budget and requirements, the gaps between previsions and reality
being considered as not or moderately acceptable. (Giard, 1991)
• A project risk is the possibility that an event occurs, an event the occurrence of which
would imply positive or negative consequences for the project execution (Gourc, 1999)
In this Ph.D. thesis, the definition of the PMBOK (PMI, 2004), which seems to encompass most of
the aspects of most of risk definitions, is firstly used for project risk, stating that
Definition
A project risk is defined as an event that, if it occurs, causes either a positive or a negative impact
on a project.
This definition underlines two aspects: risk probability and risk impact. In the rest of this Ph.D.
thesis, a project positive risk is to be called an opportunity, and a project negative risk is to be
called a risk as a simplification. One should keep in mind this semantic simplification. Another
important mention is that ambiguity, uncertainty, propagation phenomena and chaos are
aggravating conditions for the existence of project risks defined that way.
Finally, before going on, we remind the reader that, because of the property of emergence,
complexity can be a source of risks as well as a source of opportunities. The aspect of opportunity
seizing is not dealt within this Ph.D. thesis but the reader should undoubtedly keep in mind that
complexity is not only a cause of problems. In other terms, no project manager should struggle for
complexity reduction: the stake is to properly manage project complexity in order to avoid the
negative aspects of it and seize at the same time the opportunities that it creates. For instance,
when staffing a project, one should keep in mind some aspects of complexity such as staff
quantity (avoiding oversize,…) or staff diversity. Millhiser and Solow indeed explain for example
that, in theory, an optimal level of interaction can be reached in order to make the best
compromise between opportunity and project risk emergence when facing complex situations
(Millhiser and Solow, 2007).
IV.3.2. State of the art on project risk management methodologies From the birth of project management, the notion of risk has grown within the field of project
management, even if there are still lots of theoretical problems and implementation lacks
(Gautier, 1991). For all practical purposes, the growing interest in risk management is often
pushed by law & regulation evolutions. The society is namely more and more risk averse, and
stakeholders are more and more asking for risk management, in order to cover themselves
against financial or juridical consequences. People can be accountable during or after the project
for safety, security, environmental, commercial or financial issues.

- 85 -
Everybody have to manage their own responsibility and own risks. That is why it has become
more and more important to manage effectively and efficiently project risks (Ariyo and al., 2007),
in order to give more success warranty and comfort to project stakeholders, or at least to warn
them from possible problems or disasters (Cooper and Chapman, 1987).
According to Raz and Hillson, “the origins of operational risk management can be traced to the
discipline of safety engineering”. Modern risk management has evolved from this concern with
physical harm that may occur as a result of improper equipment or operator performance (Raz
and Hillson, 2005). Lots of risk management methodologies and associated tools have been
developed, with qualitative and/or quantitative approaches, often based on the two concepts of
probability and impact (or gravity) of the risky event. As for it, the PMI, in its worldwide
standard PMBOK, describes project risk management purpose as “the increase of probability and
impact of positive events, and the decrease of probability and impact of negative events” (PMI,
2004). Other processes aim at increasing the success probability.
As a consequence, various risk management methodologies have been developed (Gautier, 1995):
some standards have indeed developed risk management methodologies, which are specific or
non-specific to project context (IEC, 1995), (AFITEP, 1999), (APM, 2004), (PMI, 2004), (IMPA,
2006), (BSI, 2008). Note that, when non-specific, these methodologies may have been introduced
in several fields, like project management, systems analysis, design, insurance, food industry,
information systems, chemical systems, industrial safety. A benchmark was done over various
risk management methodologies, notably thanks to the exhaustive works of Marle (Marle, 2009).
Of course, the question of relevance to project context has been discussed, and the benchmark was
only conducted on selected methods. Figure 36 displays the four steps that appear as globally
present in most of iterative risk management processes (Marle, 2001), (Pingaud and Gourc, 2003),
(PMBOK, 2004), (Ravalison, 2004).
Figure 36. The steps of the project risk management process (adapted from (PMI, 2004))
Risk Identification
Risk Analysis
Risk ResponsePlanning
Risk Monitoring and Control
Risk Management Planning
Lessonslearned
Risk Identification
Risk Analysis
Risk ResponsePlanning
Risk Monitoring and Control
Risk Management Planning
Lessonslearned

- 86 -
It must be noted that the steps of risk management planning and lessons learned were not
present in every methodology enlightened by the benchmark and were not selected as a
consequence.
Moreover, the names of the four steps were not always the same in every methodology and it
appeared that some of the steps were sometimes gathered, but the underlying principles and
goals remained similar.
This paragraph is therefore organized according to these four general steps of the risk
management process. The aim of this necessary preliminary state of the art is to identify the
lacks and issues of current project risk management methodologies regarding complexity
handling and to define potential research topics which may contribute to eliminate or reduce
some of these lacks. The final goal is to bring value to users in projects, project managers, project
risk managers, project members and project stakeholders.
IV.3.2.i Project risk identification
Risk identification is the process of determining events which could impact project objectives.
Risk identification methods are classified according to two different families: direct and indirect
identification of risks. The most classical tools and techniques for direct risk identification are
diagnosis and creativity-based methods, meaning that direct identification is mainly performed
thanks to expertise:
• The assessment of the present situation relies upon the analysis of its parameters in
order to identify areas of risk. An example is systems thinking, which is used to describe
exhaustively the studied area of the project, and then to identify potential problems.
• On the contrary, the assessment of the future situation can rely upon the ability that one
has to imagine the risks that can affect a project. An example is brainstorming.
Another way to identify risks is to collect data about problems that occurred during previous
projects (indirect risk identification, based on experience). Everyone should stay aware that
issues of the past are risks of the future. Examples of such methods are the “5 why?” method,
Ishikawa diagram, the Pareto diagramming technique or the use of check lists.
The reader should finally note that statistical studies can be conducted, as highlighted in
(Gautier, 2004) and that several studies or surveys were carried out to summarize and categorize
the most common problems in project management. One of them described the most relevant
causes of failure in IT projects (The Standish Group, 2000). Those main causes have been
categorized and sorted with a Pareto analysis. It appeared that less than 20% of the causes were
responsible for more than 80% of failures. In the end, after risk identification, due to the high
number of risks, they are grouped into smaller groups (or clusters) in order to permit practical
management (notably for the identification of risk ownership, risk provision, etc…).
Such classification can notably be obtained thanks to the traditional risk breakdown structure, as
shown on Figure 37.

- 87 -
Figure 37. The Risk Breakdown Structure (PMI, 2004)
IV.3.2.ii Project risk analysis
Risk analysis is the process of prioritizing risks, essentially according to their probability and
impact. There are two main types of risk analysis, which are discussed hereunder: quantitative
and qualitative analysis.
Quantitative risk analysis is notably based on the proper estimation of probability through
mathematical models, notably built on former experience. Qualitative risk analysis is the process
of assessing by qualitative means the probability (P) and impact (I) of each risk. It assists risk
comparison and prioritization. It is notably used when these parameters are difficult to calculate,
using scales, like in Figure 38.
Figure 38. Scales to assess project risk probability, impact and criticality

- 88 -
The main risk analysis’s output is the risk prioritization, function of their criticality. Criticality is
often defined by the product of P and I, but other formulation should be proposed. Indeed, as
underlined by Terry Williams (Williams, 1996) who carries out some calculations to prove his
vision, “multiplying impact and [probability] to ‘rank’ risks is misleading, since the correct
treatment of the risks requires both dimensions” and probably even some other.
Figure 39. Representations during the risk analysis process (Marle, 2009)
However, the use of criticality permits to define a useful index for risk analysis. Indeed, criticality
enables to classify risks into three categories: high risk (red or heavy grey), moderate risk (yellow
or middle grey) and low risk (green or light grey). The result has often the shape of a P-I matrix
or grid, which uses scales and points out each risk on this P-I graph. Note that other
representations (Farmer diagrams, Kiviat graphs,…) may be drawn at this stage, as shown before
in Figure 39.
IV.3.2.iii Project risk response planning
The process of risk response planning aims to choose actions in order to reduce global risk
exposure at least cost. It addresses project risks by priority, defining actions and resources,
associated with time and cost parameters. Almost every method mentions the same possible
treatment strategies, including the following:
• Avoidance
• Probability or impact reduction (mitigation), including contingency planning
• Transfer, including subcontracting and insurance buying
• Acceptance
The aim is the same that in project planning: how to define actions that will reach the assigned
targets under constraints? The only difference is that in risk management process, the targets are

- 89 -
to reduce threats and to enhance opportunities. The final goal is the same as project management
process: to reach project objectives with the maximum probability of success. So, estimation
techniques, like analogous, parametric and bottom-up techniques may be used, and the important
parameter is to measure action effectiveness, that is to say risk reduction induced by action
success.
IV.3.2.iv Project risk monitoring and control Risk monitoring and control is according to PMBOK the ongoing process of “identifying, analysing
and planning for newly arising risks, keeping track of the identified risks and those on the
watchlist, reanalyzing existing risks, monitoring trigger conditions for contingency plans,
monitoring residual risks, and reviewing the execution of risks responses while evaluating their
effectiveness” (PMI, 2004). It includes five classical tools:
- Risk reassessment: for new risks or for refinement of existing assessments,
- Risk audit: return on investment on the global risk management process,
- Variance and trend analysis : deviations from project plan may indicate potential threats
for the project,
- Technical performance measurement: deviations from planned scope may indicate
potential threats for future delivery and client acceptance,
- Reserve analysis: use of planned contingency reserves is tracked, in order to estimate the
adequation between remaining reserves and remaining risks.
IV.3.3. Critical analysis of these methods and tools IV.3.3.i Overall synthesis of the methods
When analysing the different methodologies and tools that presently exist within the context of
project management, one can wonder how they permit to handle complexity-driven issues.
Indeed, efficient project risk methodologies should permit the integration of complexity aspects
(and it is all the more true for modern projects, the complexity of which is ever-growing).
IV.3.3.ii Issues regarding project risk identification
When performing risk identification, issues related to project ambiguity do appear as complexity-
driven lack of awareness is to decrease the performance of risk identification.
First, exhaustiveness is definitely impossible to obtain. Ambiguity cannot permit exhaustiveness.
Furthermore, the project context is likely to change, and new risks can occur although they were
not identifiable when first identification took place. As a consequence, exhaustiveness is never
warranted by any method, even though the identification can be facilitated by previous lessons
learned.

- 90 -
Moreover, a first classification of risks is performed during the risk identification process.
Classifying risks by nature, by causes, or by consequences, or by time location are valuable
alternatives which are difficult to compare. The point is that project risks are in essence multi-
criteria (Gourc, 2006) since they are related to several factors, project values, etc… But
traditional methodologies fail in underlining these aspects and one tends to classify risks notably
according to traditional classifications (the ones just expressed before). Choosing between these
alternatives depends on the structure of the organization and of the project, on the risk
management policy in the organization and on the ownership of risks. The choice of one of them is
all the more difficult to do since ambiguity implies different visions within the project team.
But it is known that the classification method is likely to have an impact on the manner risks will
be addressed among the other phases of the risk management process. The point is that,
whatever the classification chosen, the traditional ways of grouping risks (even by criticality
values) does not permit to handle properly project complexity as shown by Figure 40 next page.
Risks are indeed mainly considered and identified as independent. But, for projects are complex,
the project risks set is also complex since projects risks are interrelated too. Chain reactions and
the butterfly effect are notably possible effects of complexity on project risks, due to propagation
phenomena. To the best of our knowledge, no traditional methodology has been widely
implemented and used to identify these phenomena.
Figure 40. Current visions versus reality regarding project complexity and risks

- 91 -
IV.3.3.iii Issues regarding project risk analysis This is also the point when trying to analyse risks and propagation phenomena. As far as we
know, no traditional method can permit a global analysis of the risk propagation phenomena. And
this, even though these phenomena may dramatically alter the rankings obtained since
traditional analysis processes “ignore potentially relevant information about the spread of
possible impacts” for instance (Ward, 1999). For all practical purposes, in the end, some risks that
are traditionally neglected by current methodologies (because for instance, they have a very low
impact) should not be neglected since they may be the root origin of more critical risks.
Some existing methods such as Bayesian networks (Ben-Gal, 2007) permit to underline to some
extent propagation phenomena when performing a risk analysis. However, they do not permit to
take into account feedback loops as one of the strong hypotheses of Bayesian networks is to work
on directed acyclic graphs. Other methodologies such as Markov chains can permit to handle part
of propagation phenomena. But such methods may appear as non-intuitive and non-user-friendly
for industrial practitioners. Moreover, they do not permit a practical implementation of
management modes which would handle risks in terms of their interactions. Finally, such
methods are to be taken with caution, due to difficulty to manipulate the theoretical concept of
probability when dealing with project risks, since references to the past are harder to do (Gourc,
2006) and conceptual limitations do exist, as underlined in (Pender, 2001).
Furthermore, ambiguity is also present in this step since the classical evaluation based on gravity
or probability can generally be discussed regarding ambiguity. Indeed, gravity and probability
appear to be subjective concepts, as the one of project risk: cultural phenomena, number of former
experiences, the individual or group realisation of the analysis for instance influence the results
of the risk analysis process (Gourc, 2006). To the best of our knowledge, apart the fact of dealing
with confidence intervals or fuzzy numbers, no traditional risk analysis tool includes this
ambiguity aspect.
IV.3.3.iv Issues regarding project risk response planning, monitoring and control
The two last steps of the risk management process also have lacks in terms of complexity
integration. Indeed, uncertainty is not always considered in risk response planning
methodologies. Uncertainty implies difficulty in the preparation of the preventive and curative
plans. Uncertainty implies actions, which are themselves uncertain, and as a whole, “uncertainty
will not necessarily diminish over time” (Jaafari, 2001). Moreover, some actions may affect
several risks, and some risks may require several actions, which makes it even more difficult to
estimate the relative contribution of each action for each risk.
Furthermore, chaos is to have influence on the efficiency of the response plan. Indeed, for
instance, if some errors are made in the analysis and planning processes, it may have dramatic
consequences during the decision process. The sensitive dependence on initial conditions implies

- 92 -
that the even little differences in the decisions made during the risk response planning step may
imply important difficulties.
Moreover, ambiguity implies difficulty when carrying out the project risk monitoring and control
step (for the same reasons as in the risk identification step), making the process also subjective.
In the end, project systems try to reduce subjectivity by expressing, monitoring and controlling
the impact of risks on few limited scales (and especially the financial one), which does not permit
to encompass the multicriteria nature of project risks (Gourc, 2006).
Finally, even though people and organizations tend to be more and more risk averse, risk
management methodologies are still not so efficiently and effectively implemented, notably
because of ambiguity and the lack of implication of management teams. Risk management is still
too often considered as a waste of time and money, since working on potential events dose not
permit to see directly the practical effects of such a work. And as a whole, even though “the need
for project risk management has been widely recognized” (Williams, 1995), there is still some
difficulty when trying to implement it properly in fieldwork.
IV.4. Conclusion : proposing research issues to integrate
complexity aspects into project risk management processes
As a whole, project risk management methodologies have shown some limits and can not
completely face the actual stakes any more, including the increase of project complexity:
• More and more parameters are to be taken into account, including safety, environment,
health, ethics, ...
• More and more stakeholders are involved, which increases project complexity.
Even though traditional methods and tools are undoubtedly useful, there is therefore a need to
find something else than rigid "plan and control" principles, in order to integrate the non-
predictability of future and the non-rationality inherent to every human activity, especially
decision-making and teamwork.
It is therefore needed to give a complementary point of view to the belief that managers face an
objective reality that they can control by being rational technicians, dealing with issues that are
resolvable through the application of planning and control techniques. This positivist statement
of what project management is does not tell much about day-to-day reality, which is often messy,
ambiguous, fragmented and political (Alvesson and Deetz, 2000).
Risk management methodologies have indeed been built on this overall principle of “plan and
control” applied to risks. But it involves that new complementary approaches (notably based on
systems thinking principles) should be considered as some theoretical problems are not yet
solved, notably due to difficulties in the identification and analysis processes, as shown in IV.3.3.
We thus propose research issues regarding two lacks of risk management identification and
analysis processes due to complexity-driven phenomena.

- 93 -
IV.4.1 Project ambiguity : increasing one’s awareness One of the main limitations which is highlighted is that traditional project risk management
methodologies do not permit to handle complexity-driven ambiguity. However, as shown by
IV.4.3., this is all the more important since ambiguity has consequences in every step of the risk
management process. Basically, complexity-driven ambiguity generates a lack of awareness and a
lack of common and shared vision of what the project system and the project risks are.
In order to reduce this ambiguity, Chapter V proposes a systemic approach to integrate
complexity aspects into the project risk management process. Based on the principle of systems
thinking and the existence of values creations processes within a project, this chapter introduces
the concept of project vulnerability.
This concept and the associated model first permits to consider the multiple impacts of events,
thanks to the correct consideration of project values. Moreover, it permits to focus on the project
system constituting elements instead of focusing on risks, which are sometimes difficult to
communicate on. As a whole, we hope that it permits to draw the analysis by the final objectives
(values creation), making vulnerability identification and analysis a more tangible process for
project team members, instead of working on potential events. We claim that this systemic
approach permits to reduce ambiguity by increasing both the awareness of the project system
components and risks (including the multiple impacts of them), and the sharing of a common
vision of these aspects.
IV.4.2 Project propagation phenomena: understanding them better As noticed before, very few project risk management day-to-day methodologies permit to take into
account propagation phenomena. Particularly, no traditional classification methodology permits
to integrate this risk interaction aspect. As a consequence, when project risks are gathered in
groups (in terms of nature or criticality value for instance), no focus on possible risk interactions
and thus interactions between groups is proposed. In other terms, once an exhaustive project risk
list is made, there would still be some work to be done to identify and assess the risk of a
propagation of one of this identified risk within the project system (as well as the underlying risk
of positive feedback and amplification through the system).
Even though not performed traditionally, this would be all the more relevant since the initial
classification influences decisions (such as risk ownership) and implies how risks may be
analysed, cured and controlled. Without including this interaction aspect, two connected risks
may belong to different groups (for instance a technical risk which implies a financial one, or a
low-criticality risk which generates a high-criticality one). Neglecting these interactions may have
dramatic consequences in terms of project risk management and coordination.
Chapter 6 is then to propose an innovative analytic approach to integrate complexity aspects into
the project risk management process. The first objective of this chapter will be to identify
properly project risk interactions and possible propagation phenomena within the project risk

- 94 -
network. The second objective of this chapter will be to cluster project risks into groups which
have a maximum amount of possible risk interactions inside of them in order to facilitate project
coordination in the end.
- 95 -
Chapter V. A systems thinking-based approach – From project risk management to project vulnerability management
Abstract
The overall ambition of this chapter is to try to reduce ambiguity by proposing a
paradigm shift from project risk management to project vulnerability management. By focusing
on project vulnerabilities, i.e. weaknesses, this research work proposes to follow a systems
thinking approach in order to describe the possible damage creation processes.
After reviewing the existing literature on the concept of vulnerability, this chapter aims
at proposing a definition for project vulnerability. It claims for the use of a systems thinking
approach to identify and understand project vulnerabilities, since it stresses that vulnerabilities
are to be linked with project values. Indeed, values which can be at stake are necessary for
vulnerabilities to exist.
This chapter then proposes a description of the project vulnerability management process
and compares it with the traditional project risk management process in order to highlight the
potential benefits of such a new approach. It also proposes a model/methodology to analyse project
vulnerabilities by decomposing project vulnerabilities into three levels: values, processes and
project elements. A stressor/receptor analogy-based model is then the basis to identify and
evaluate project vulnerabilities. A simple cruciality index then aggregates the concepts of
resistance, resilience and contribution to values creation in order to rank project vulnerabilities to
assist decision-making.Finally, an industrial application is proposed by addressing the case of a
software development project in the context of the pharmaceutical industry.
Chapter Keywords
Project, Risk, System, Values, Damage, Event, Vulnerability.

- 96 -
V.1. Introduction – Using a systemic approach to assist
project risk management
Following a systemic approach when coping with project risk management in order to address the
question of potential damages during a project permits to reduce ambiguity by increasing the
awareness of the project system. By increasing awareness, we aim at:
• Concentrating on a systems-thinking based view in order to highlight the damageable
values of the project and identify the potentially endangered processes and elements of
the project system.
• Focusing therefore on the systems elements in order facilitate the identification and
analysis of potential negative events and damages on the system.
As recent works or communications state it (Zhang, 2007), (EPM, 2007) the concept of
vulnerability therefore appears to be an innovative and promising concept for efficient risk
management, notably within the context of project management. Indeed, it enables to have a
more systems-oriented vision than the traditional cindynics approach which focuses on the
evaluation of risks (notably their probability), instead of focusing on the tangible weaknesses of a
system. However, little work has been done on this concept, particularly in the contexts of
industrial engineering and project management, even though exploring vulnerabilities may
permit to underline and heal the existing weaknesses of a given project.
PROBLEM SETTING OF THIS CHAPTER
That is why this chapter aims at addressing the concept of project vulnerability by
• Carrying out a broad state of the art, in many scientific domains, to understand what the
concept of vulnerability is in order to implement it in the context of project management.
• Defining project vulnerability and its characteristics in order to understand better the
potential process of damage creation during a project.
• Permitting the identification of project vulnerabilities thanks to a systems thinking
approach focusing on the potential degradation of the project values creation processes.
• Describing the steps of a project vulnerability management process in order to permit the
industrial application of the concept of vulnerability in projects.
• Testing the whole approach on a case study.
V.2. The concept of project vulnerability
V.2.1. State of the art on the concept of vulnerability Etymologically, the word vulnerable comes from the Late Latin vulnerare, which means “to
wound”. As for the Collins English Dictionary and Thesaurus, being vulnerable means either
being “capable of being physically or emotionally injured, wounded or hurt”, either being “open to
temptation, persuasion, censure, etc.”, or being “liable or exposed to disease, disaster, etc.”. A

- 97 -
reference to the military vocabulary is also made as being vulnerable is also defined in this
context as being “liable or exposed to attack”. Synonyms of vulnerable are for instance accessible,
assailable, defenceless, exposed, open to attack, sensitive, susceptible, tender, thin-skinned,
unprotected, weak, wide open, etc… Even though the words vulnerable or invulnerable are thus
commonly used in everyday life, little insight has been given to the concept of vulnerability within
the field of industrial engineering, project (risk) management, and management science. This
paragraph aims at drawing a state of the art on the concept of vulnerability before extending it to
project management.
Topic Total Global matter of interest Number of articlesHealth 269 Psychology and psychiatry (and behaviour factors) 91
Disease factors 85Genetics 27Response to treatment 21Disease transmission 14Diagnosis fiability 12Global organs fragility 10Healthcare management 9Morbidity factors and evaluation 4
Climatology and sustainable development 193 Reaction of biological entities to environmental stresses and biodiversity 38Ethics and social development 36Groundwaters , soils and source waters pollution 35Environmental management 26Warming and climate change 25Earthquakes and landslides 15Floods and tsunamis 11Storms, cyclones and rainfalls 5Volcano eruptions and fires 2Wind 1
Information technology 24 Communication and information networks security 11Software failure 7Information systems management 6
Military strategy and defence 13 Response to attacks (terrorism,…) 8Geopolotics and geostrategy 3Military strategy 2
Industrial engineering 11 Industrial systems security 4Knowledge management 3Production management 2Innovation management 1Logistics 1Project management 0
Construction and urbanism 11 Urban networks security 7Structure resistance 4
Economics 4 Macroeconomics 3Microeconomics 1
Physics 4 Nuclear science 1Chaos 1Electromagnetism 1Materials resistance 1
Applied mathematics 4 Networks and graphs 2Insurance modelling 2
Chemistry 1 Chemical reaction 1
Total 534 534 Figure 41. Occurrences of the word vulnerability in the Web of Science publications in 2007

- 98 -
0
100
200
300
400
500
600
700
1987
1988
1989
1990
1991
1992
1993
1994
1995
1996
1997
1998
1999
2000
2001
2002
2003
2004
2005
2006
2007
Figure 42. Web of Science publications the title of which contains the word vulnerability (1987-2007)
As an illustration of the interest of the present research community for the notion of vulnerability
in different scientific fields, we carried out a review and classification of the 2007 Web of Science
publications which mentioned the world vulnerability in their title (see Figure 41). 534 such
publications were identified, which underlines the global interest of the scientific community for
this concept. It must be noted that vulnerability seems to meet a growing interest in the scientific
community as shown on Figure 42.
Some conclusions appear to be interesting, even at a first reading of this short survey of the Web
of Science. First, two scientific topics (health, climatology and sustainable development) tend to
appear as major contributors to research works using or developing the concept of vulnerability,
since a Pareto law can approximately be observed (those two fields represent 20% of the identified
fields and correspond to 86% of the identified publications). Figure 43 shows the ten most
important matters of interest and research in terms of contribution to the vulnerability concept:
they do all belong to the hereinbefore cited topics.
Moreover, this survey also enlightens the lack of use and study of the concept of vulnerability in
the field of industrial engineering (only 11 publications out of 534; i.e. 2%), and particularly
regarding project management (0 identified publications in the Web of Science), which motivates
even more to work on this concept in accordance with project management principles.
The state of the art which was carried out on the concept vulnerability is obviously not using the
Web of Science publications solely. But following the general trends of this short survey, the
following state of the art is firstly carried out separately on the two most contributing topics:
health, climatology and sustainable development. Finally, it focuses on some works about
vulnerability in the fields of industrial engineering and project management.

- 99 -
Psychology and psychiatry (and behaviour factors) 91Disease factors 85Reaction of biological entities to environmental stresses and biodiversity 38Ethics and social development 36Groundwaters , soils and source waters pollution 35Genetics 27Environmental management 26Warming and climate change 25Response to treatment 21Earthquakes and landslides 15
HealthClimatology and sustainable development
Figure 43. The 10 most important matters of interest for research around the concept of vulnerability in 2007 Web of Science publications.
V.2.1.i Health As underlined by the short survey previously presented, research works within the field of health
are major contributors to works and breakthroughs around the notion of vulnerability. “From a
health perspective, vulnerability refers to the likelihood of experiencing poor health and is
determined by a convergence of predisposing, enabling, and need characteristics at both
individual and ecological levels” (Shi, 2001). Its study can be assisted by the determination for
vulnerable groups or populations. The specific field of psychiatry is notably dealing with this
notion, notably when considering post-traumatic effects. Considering psychiatry, the particular
example of schizophrenia has been widely studied, notably by Strauss (Strauss, 1997), who
followed a phenomenological approach to study it by proposing an analysis of one’s daily life to
highlight the complex relations between the various factors and interactions which exist between
the patient and its disorder. These works permit to underline the context-dependence of the
concept of vulnerability, underlining notably that it evolves over time and that vulnerability
perception differs from one to another.
On her side, Ezard (Ezard, 2001) calls for vulnerability reduction instead of risk reduction in the
case of drug use and addiction vulnerability of individuals and groups. She explores vulnerability
as a characteristic which ‘”incorporates the complex of underlying factors that promotes harmful
outcomes as a result of drug use, and limits attempts to modify drug use to make harmful
outcomes less likely”. She stresses that “vulnerability factors arise out of and are reinforced by
past and present social context and experience”, insisting also on the influence of context and
historicity. She explains (thanks to an analogy, which is that vulnerability is to risk what
acceleration is to velocity) that “changes in vulnerability will determine changes in risk” as
vulnerability determines risk. Her claim for a shift of management towards vulnerability
reduction is explained thanks to a better depiction of the complex phenomena that cause
vulnerability, and risk in the end. Complexity notably appears when considering exposure and
responses as different stressors can interact and influence the global exposure of an individual or
a group (Burkart and al., 1998). Some works focus on vulnerability in terms of patients’ responses
in terms of resistance and resilience, that is to say how individuals or groups can resist to

- 100 -
vulnerability (instantly or when recovering), notably thanks to healthcare. For instance, more
illness resistance and faster recovering can be observed if the healthcare system resources are
properly managed in terms of availability at any time (Perry and al., 2006).
V.2.1.ii Climatology and sustainable development A close look at some research works around the notion of vulnerability within the field of
climatology and sustainable development is now given. It must be noted that one of the most
widely used definitions of vulnerability we found during our broad state of the art comes from a
this field. This one is the definition proposed in the early 1980s by Chambers (Chambers, 1983):
vulnerability is “the exposure to contingencies and stress, and difficulty coping with them.
Vulnerability has thus two sides: an external side of risk, shocks and stress to which an
individual or household is subject; and an internal side which is defencelessness, meaning a lack
of means to cope without damaging loss”.
Many definitions, such as the one in (Luers and al., 2003), only consider the aspect of incapacity
to cope with the shocks and stresses: in this work, vulnerability is for instance defined as “the
degree to which human and environmental systems are likely to experience harm due to a
perturbation or stress”. In their works, Waits and Bohle (Waits and al. 1993) add another side to
vulnerability as they consider three aspects of this notion: exposure to crisis situations, incapacity
to cope with these situations (and the reach objectives of life standards for instance) because of a
lack of resources, potentiality of serious consequences to occur as a result of the crises (which can
notably be characterized in terms of slow recovery).
Blaikie and al. (Blaikie and al., 1994) also define vulnerability, in respect of natural hazards, as
“a measure of a person or group’s exposure to the effects of a natural hazard, including the degree
to which they can recover from the impact of that event”. But as noticed in (Dibben and Chester,
1999), “there is a problem in defining vulnerability in terms of recovery per se. This is because it
can be argued that a group who are poor before [a natural hazard], and whose recovery is likely to
be back to the same level of poverty, are not vulnerable and a wealthy individual, who will lose
much, but will still be better off than his or her neighbours, is vulnerable”. The vulnerability of an
element should then include more the core characteristics that can describe it.
Figure 44. Vulnerability based on assets, activities and outcomes given a specific context (Ellis, 2003)

- 101 -
Another characterisation, based on the works of Scoones (Scoones, 1998) and Ellis (Ellis, 2000) is
proposed in (Ellis, 2003), regarding the issue of human vulnerability and food insecurity in
southern Africa. This one is exposed before in Figure 44. The assets, activities and outcomes that
are associated when constructing robust, viable and sustainable livelihoods are to be studied in
accordance with both the vulnerability and the institutional context. All those notions appear to
be interrelated and, similarly, the vulnerability context should be considered regarding the
assets, activities and outcomes that do exist in a specific policy and institutional context. This
gives another grid to have a look at the concept of vulnerability and is to be kept in mind as the
description in terms of assets, activities and outcomes may have similarities with the description
of a project through systems thinking.
For his part, Maskrey (Maskrey, 1989) notices that “natural disasters are generally considered a
coincidence between natural hazards (such as floods, cyclones, earthquakes and drought) and
conditions of vulnerability. There is a high risk of disaster when one or more natural hazards
occur in a vulnerable situation”. This expresses that damages (turned out consequences of risks)
can be understood as the coincidence between a dangerous event and a vulnerable ground. This
vulnerable ground is in essence context-dependent, as stressed in many research works in this
field: the balance of political power, the specific culture/context of societies and ethnic groups,
economic constraints, spatial or political constraints, etc. are notably context factors that do have
a clear influence on vulnerability regarding climate and sustainable development issues.
Figure 45. Vulnerability study thanks to a stressor/receptor model (de Fur and al., 2007)

- 102 -
Vulnerability is then highlighted thanks to the possible interaction between these stressors and
these receptors (which corresponds to some extent to exposure), but also thanks to the possible
reaction and adaptation of the receptors regarding the outcomes (basic needs, etc.) the population
aims at achieving. However, Luers ans al. (Luers and al., 2003) explain tat “developing measures
of vulnerability is complicated by the lack of consensus on the exact meaning of the term, the
complexity of the systems analyzed, and the fact that vulnerability is not a directly observable
phenomenon”. For instance, approaches to the assessment of vulnerability to climate variability
and change are studied by Kelly and Adger (Kelly and Adger, 2005). The approaches are
compared according to their own definition of vulnerability which is “the capacity of individuals
and social groups to respond to, that is, to cope with, recover from or adapt to any external stress
placed on their livelihoods and well-beings”. Assessing vulnerability is thus assessing a capacity
to respond to occurring stresses which are likely to degrade some objective functions, which are in
this case livelihoods and well-beings. Following the process of assessment, intervention should be
done by encouraging a process of adaptation mixing both the characteristics of the vulnerable
ground and the objective functions, notably by reinforcing, modifying or offsetting “trends in the
factors that limit or enhance vulnerability as they emerge” and assessing them particularly in
terms of resources availability. Vulnerability permits to identify tangible weaknesses of a
population, a geographical zone, a natural system, etc… but is perhaps more difficult than risk to
assess as it implies the consideration of numerous interrelated factors.
V.2.1.iii Industrial engineering and project management
Even though few works around the concept of vulnerability seem to be in the field of industrial
engineering, some of them can highlight us for our works to develop the concept of project
vulnerability. Charles Perrow (Perrow, 1984) states that the concept of zero risk in industrial
systems is a chimera. Indeed, as he notices, since complex systems are in essence unpredictable
and are operating thanks to a large number of interrelated objects, accidents appear to be
inevitable structural elements of them. This issue is also stressed by Theys (Theys, 1987) since
“the conjunction of uncertainty and vulnerability (and their destabilizing consequences) puts one
in front of unacceptable dilemmas”. As a consequence, the notion of risks and vulnerability
should be unavoidable points to focus on when managing projects. Yet, Theys (Theys 1987)
underlines that “there are still too few languages and tools for analysing vulnerability”, which
motivates to develop such languages and tools.
Some attempts were already done in the past. For instance, David and Marija Bogataj (Bogataj
and Bogataj, 2007) try to measure the supply chain risk and vulnerability. They consider the risk
in a supply chain as “the potential variation of outcomes that influence the decrease of value
added at any activity cell in a chain, where the outcome is described by the volume and quality of
goods in any location and time in a supply chain flow”, explaining that “due to their complexity,
the total added value of all activities is […] the result of exposure to different kinds of risk”. As a

- 103 -
consequence, they do place the notion of vulnerability at the centre of value creation, since value
can be degraded because of exposure to risks and incapacity to cope with them. They then explore
the notion of supply chain vulnerability by defining a typology of risks that a supply chain can
encounter. This typology is then the basis for a vulnerability and risk model which can assist
supply chain management.
As for him, Tomas Hellström (Hellström, 2007) considers the issue of critical infrastructure and
systemic vulnerability. The article explores an analytical planning framework for identifying,
formulating and mitigating vulnerability in critical infrastructures. As he notices, “because
vulnerability has often been regarded as a property, and not as an outcome of social relations and
technological systems, the concept is easier to deal with than that of risk, as it does not
exclusively emphasize a future, or counterfactual state of affairs, but also, and perhaps most
obviously, certain qualities of a system in the here and now”. Dealing with vulnerability means
thus dealing with a system in its systemic whole, that is to say with its complexity. Hellström
then proposes a model adapted form the PAR (pressure-and-release) model of Blaikie and al.
(Blaikie and al., 2001), which tries to express the complex dynamics of a system’s vulnerability.
Within the same matter of reliability engineering and system safety, Aven (Aven, 2007) tries to
elaborate a framework for risk and vulnerability analysis which could cover both security and
safety. Some management pieces of advice are then given, knowing that risk should be viewed as
the combination of sources of uncertainties and vulnerability (and its possible consequences
related to the sources of uncertainties).
Moreover, the works of Durand (Durand, 2007) around the notions of organisational risks and
vulnerabilities appear to be interesting. Through a systems approach based of the well-known
works of Michael Porter, he defines vulnerability as the “extent to which an organisation is able
or not to cope with the dangers it is exposed to”, explaining that the notion of vulnerability
permits to focus on an organisation’s ability to resist to hazards and on the mechanisms that can
weaken its overall functioning, behaviour and evolution. A model is then developed to assist
vulnerabilities identification and is notably based on three dimensions of systems thinking:
functional pole, ontological pole and genetic pole, which enables him to elaborate a typology of
organisational and managerial vulnerabilities. The whole approach stresses how things should be
drawn by the values creation processes of the project, which is in accordance with (Simon, 1981)
or (Schneider, 2008), which underline the fact that possibly damaging events should be handled
in accordance with their possible impact on the core values of a project (or a system).
V.2.2. Synthesis of the characteristics of vulnerability As a synthesis of the former paragraph, before going on, we propose to list down the principal
characteristics of vulnerability which can be synthesised after our state of the art.
• Vulnerability is in essence relative to a system which has weaknesses (regarding its
objective values) which can alter its trajectory to reach its objectives.

- 104 -
• Vulnerability corresponds to coexistence of a level of exposure (or a susceptibility to
be exposed) to stressors and a non-capacity level to cope with these stressors.
• Two aspects of the system’s non-capacity are to be underlined
o Static vision: Resistance of the system regarding the apparition of the
stressor.
o Dynamic vision: Resilience of the stressor corresponding to the recovering of
the system.
• A system’s vulnerability is in essence context-dependent and evolves over time,
notably because of the changes over time in the systems’ characteristics due to the
natural evolution of the project system, notably in terms of its objective values.
Each of this aspect is therefore to be present in the definition of project vulnerability or/and its
associated models and tools.
V.2.3. Defining the concept of project vulnerability Before, defining properly the concept of project vulnerability, other concepts are to be properly
defined (even though they might have been used before for practical purposes throughout this
Ph.D. thesis).
First, let us define the concept of event regarding a project system. As an illustration to explain
this concept, we might consider the daily life of anyone. A rainy weather is an event for any
worker who goes back to home after work: it can appear to be a danger a the worker who goes to
home by foot as he may get wet, but it can appear to be an opportunity for another one who plans
to go fishing after work and who knows that fish catches tend to be better when it is rainy. This
means that events can be considered as negative (dangers, threats, attacks, etc.) or positive
(opportunities,…), depending on the points of view of what this event influences. As a
consequence, that is why in this thesis, we generally speak of events, without expressing any
opinion on their positive or negative influence, unless it is clearly mentioned.
Definition : An event regarding a project system is something occurring in a project or in its
environment and that is likely to have an influence on them.
Events regarding a project system can be classified thanks to another typology due to the
following property. As a whole, we can deal with:
• Negative events: Events which are likely to degrade at least one of the project
system’s created values.
• Positive events: Events which are likely to upgrade at least one of the project system’s
created values.
It must be noted that an event can be both positive and negative, as it can degrade some value
creation of the project, but upgrade some other. This notion can now be linked with the concept of
project risk. Indeed, given a risk, the triggering event corresponding to it finds (within the project

- 105 -
system) a ground that is susceptible to let the influence of the event express itself. In other terms,
a risk is the coexistence possibility of a triggering event and a susceptible ground which is
sensitive to it (see Figure 46). This coexistence has notably been enlightened by the works of
Durand (Durand, 2007), as mentioned before. Coexistence implies in essence an aspect of
temporality. If an event occurs when the project is not sensitive to it, then it will not turn into a
risk (positive or negative). Risk needs vulnerability to exist for all practical purposes.
Property : A project risk is the expression of an impact regarding the project system due to the
coexistence possibility of a triggering event regarding the project system and a state of the project
system that is sensitive to this event (susceptible to let it express).
Figure 46. Project risk as an impact due to coexistence
These concepts being explained, we can wonder why a state of the project is likely to be sensitive
to an event. From now on, we will focus in this thesis on negative events. That is where we
introduce the notion of project vulnerability. It should be stressed that similar studies are likely
to be done on positive events, exploring thus the issue of opportunity seizing in projects.
We now propose a definition of the concept of project vulnerability and discuss it, notably thanks
to the state of the art we presented above. Our state of the art presented notably two important
aspects we rely on to elaborate our definition and build our frameworks and tools: exposure and
incapacity.
Definition : Project vulnerability is the characteristic of a project which makes it susceptible to be
subject to negative events and, if occurring, which makes it non capable to cope with them, which
may in the end allow them to degrade the project performances.

- 106 -
This definition includes three important aspects:
• Project susceptibility to be subject to negative events
• Project non capability to cope with negative events when occurring, which includes
non-resistance (instantaneous damages) and resilience (recovery over time)
• Relationships with project values creation degradation.
This definition is instantly followed by a property which is to be noticed.
Property : Project vulnerability exists if and only if project susceptibility to be subject to negative
events and project non capability to cope with them if occurring coexist, i.e. if and only if they
simultaneously exist at a given time.
To illustrate this property, we can consider an analogy with health. Let us consider a patient
which has no more or a very weak immune system (non capability of coping with viruses,
bacteria, etc. if he is in contact with them): he cannot be considered as vulnerable if the medical
team decides to confine him in a sterile room (as he is no more subject to, i.e. in contact with,
viruses, bacteria, etc.). Let us now consider a human being whose immune system is strong and
who received protection against influenza thanks to vaccination: as this human being has an even
more strengthened immune system which is very resistant to the influenza virus (very good
capability to cope with it), this person will not be vulnerable even if it is directly exposed to the
virus (subject to it). These very simple examples explain how the coexistence of two parameters is
necessary to consider the existence of vulnerability.
As a whole, project performance degradation is the consequence of two coexistences. The first one
conditions the apparition of vulnerability: coexistence of susceptibility to be subject to negative
events and incapacity to cope with them if occurring. The second one is the temporal coincidence
of a triggering event and a vulnerable ground for a risk to occur and to degrade the processes of
values creation during the project.
Now that the necessity of these coexistences is cleared, the aim of this work is to propose a
systems thinking-based model of vulnerability to assist complex project risk management. The
aspect of susceptibility is neglected in the following section since susceptibility is closely linked to
probabilistic aspects of possible negative triggering events, which we do not aim at addressing
here.
The aim of the next section is to focus on the project system weaknesses and thus on the
identification, evaluation and management of non-capabilities in terms of resistance and
resilience. As a whole, this section thus proposes a paradigm shift since it focuses on the project
system existing elements instead of focusing on possible events.

- 107 -
V.3. Proposal of a project vulnerability management process
V.3.1. Challenging the definition of a project risk Before questioning how one can manage project vulnerability, this paragraph aims at linking it
clearly the concepts of project risk and project vulnerability. As mentioned in Chapter IV, a
project risk is defined as an event that, if it occurs, causes either a positive or a negative impact
on a project. This definition underlines two aspects: the existence of a probabilistic triggering
event, and its impact on the project. But as noticed in V.2., when focusing on negative events, this
triggering event is to have an impact if and only if occurs on a vulnerable state of the system. As a
whole, we propose here to focus not only on the probabilistic event and the possible damages, but
also on project vulnerability when performing a project risk analysis. When not doing so, a crucial
aspect of the possible damage creation processes is to be neglected. We thus propose to refine the
definition of a project negative risk, stating that
Definition : A project negative risk is an event that, if it occurs, causes a negative impact on a
project (as a whole or some of its aspects) due to existence of project vulnerable states. A project
risk can thus be expressed as a conjunction of a probabilistic aspect depending on the triggering
event and its impact depending on the project vulnerability. In other terms,
).().(. ITYVULNERABILPROJECTIMPACTEVENTTRIGGERINGYPROBABILITRiskP ⊗=
In this formulation, impact is to be decomposed into three aspects:
• Intensity of the triggering event
• Resistance and resilience of the vulnerable elements of the project
• Final impact on the project values creation processes.
The concept of vulnerability implicitly implies the existence of stakes and values in the project
system which can be damaged and/or altered. Indeed, without such stakes, no one would care
about potential damages. What makes damages important is that damages can affect the values
creation processes of the project, thus putting in danger the objectives and raison d’être of the
project. Vulnerability is to be understood as the function which permits a transmission from
negative events to damages in the project values creation processes. As a consequence, project
vulnerability makes sense if and only if it is related to the values the project. That is why it is
necessary to come back to the notion of project created values.
V.3.2. A methodology to model and manage project vulnerability In order to do so and to properly identify the complex project values creation processes, we claim
for the use of systems thinking, which permits to have an overall vision of these aspects. Our
methodology to model project vulnerability is therefore the following:

- 108 -
• Identifying the objectives of the project in terms of values creation thanks to the
study of the teleological pole of the project system in all of its phases, particularly
its execution phase. These values appear to be the vulnerable stakes of the project.
• Identifying elementary vulnerable process and elements of the project systems
(vulnerable tasks, actors, resources, etc…) thanks to the proper identification of
the functional and ontological poles of the project system. These two first steps
permit to perform project vulnerability identification.
• Then, by assigning a contribution rate of any of these elements to each value
creation process, one is to perform the first step project vulnerability analysis.
• The second step of project vulnerability analysis is to concentrate on a particular
value and vulnerable element in the system regarding this given value creation
process. By identifying possible triggering events which can damage this project
vulnerable element and analysing its resistance and resilience through a
stressor/receptor model, one is to perform the second step of project vulnerability
analysis.
• Then, after performing project vulnerability identification and analysis, a project
vulnerability response plan can be built up to cure the weaknesses of the project
system and prevent it from possible damages.
• Finally, a project vulnerability monitoring and control activity is to be performed
during the whole project in order to watch over the project evolution.
As a whole, four steps (which are similar to the ones of the project risk management process) can
be built for the project vulnerable management process. They are synthesised in Figure 47. Each
of them is developed in the following paragraphs in order to introduce the reader with the whole
process of project vulnerability management.
Figure 47. The project vulnerability management process

- 109 -
V.3.3. The project vulnerability identification step As mentioned in V.3.2., in order to identify properly project vulnerabilities, the use of systems
thinking is proposed. It must be underlined that vulnerability permits to focus on the project
system (its processes, elements, structure,…) which make project vulnerability a more tangible
concept than project risk. For all practical purposes, identifying project vulnerabilities means
identifying the weaknesses of a project system which make its values creation vulnerable.
In order to do so, a four step processes bases on the system thinking approach is proposed. The
use of this methodology permits to identify vulnerabilities systemically through the logical
linkages which exist in the processes of values creation. Vulnerability is therefore identified at
three levels:
• The teleological pole of the project system, which permits to identify the vulnerable stakes
of the project (negative impact on its objective performances, i.e. degradation of its
objective targeted created values) thanks to the prerequisite which is the proper
identification of the project stakeholders.
• The functional pole of the project system, which permits to identify the vulnerable
processes / tasks of the project system.
• The ontological pole of the project system, which permits to identify the vulnerable
elements (actors, resources, inputs of processes, …) of the project system.
The reflexion on a stressor / receptor model to identify project process vulnerabilities is thus to be
based on triplets (project value, project process, event), which implies that project elementary
vulnerabilities are to be defined as triplets (project value, project element, event).
Since project vulnerability identification is closely linked to systems thinking, the genetic aspect
(evolution of the project system) is also to be considered. Indeed, whenever the project phase
changes, or whenever considerable changes in the project system (notably its context through the
necessary identification of project stakeholders) occur during a project phase, the vulnerability
identification process is to be performed again, or at least refined / updated.
Furthermore, contrary to identification step in the project risk management process, project
vulnerability identification (as we propose it) is to be based solely on the (expert) analysis of the
project system for the first three steps. Finally, a natural classification of project vulnerabilities is
to appear thanks to the identification of project values. This classification helps to reduce
ambiguity and doubts on usefulness since everything is drawn by the final objectives of the
project, that is to say values creation.
V.3.3.i. Identification of vulnerable values, processes and elements
As a whole, thanks to systems thinking (as exposed in Chapter 1), a list of project values can be
identified thanks to the proper identification of the project stakeholders.

- 110 -
A project is vulnerable if and only if one of its objective values may not reach its target. That is
why we argue that project vulnerability should be addressed regarding each value of a given
project, in order to underline the different possible kinds of damages within the project.
In the end, this research work proposes that the first deliverable of the project vulnerability
identification step is a three-level hierarchical structure composed of (see Figure 48):
• The project values which are likely to be damaged and make thus the project vulnerable
regarding them.
• For each value Vi, the project processes/tasks which contribute to Vi creation. These
processes are likely to be altered (and thus to be vulnerable) by negative events, which
makes as a consequence the project vulnerable regarding Vi.
• For each process Pij, the project elements which permit to perform Pij (actors, resources,
other inputs). These elements are likely to be altered (and thus to be vulnerable) by
negative events, which alters Pij, which makes as a consequence the project vulnerable
regarding Vi.
An arborescence is thus to be built in order to classify project vulnerable values, processes and
elements as shown hereunder on Figure 48. The reader should note that this decomposition is
analogous to the one mentioned in V.2.1.II. and proposed in (Ellis, 2003) in terms of outcomes
(values), activities (processes) and assets (project elements).
Figure 48. Levels in the project vulnerability identification step

- 111 -
V.3.3.ii. Identification of process and elementary vulnerabilities
Let (V1, V2, …, Vn) be the set of values created by the project. For each Vi, we have identified the
corresponding vulnerable project processes and elements. Each value Vi can be weighted by a
coefficient αi which permits to set priorities in the values creation processes (the sum of all these
coefficients is equal to 1). If αi > αj, then project vulnerability regarding value Vi is all the more
important to control than project vulnerability regarding value Vj since the creation of Vi is
preferred to the one of Vj. Such weights are notably to be set by project stakeholders, by the
project management office or by the firm, notably thanks to the consideration of strategic or
tactical aspects.
Given a value Vi, as mentioned before, there are several project processes/tasks (Pi1, Pi2, …, Pip)
which contribute to Vi creation. In the same manner, the project manager, the project team or
external experts can permit to determine weights βij which permit to determine the importance of
each task regarding Vi creation (for each i, the sum of all βij is equal to 1). At this stage, one
should particularly notice that tasks can contribute to several values creation processes.
The same work can be done on every category of project elements. In the end, determining all the
weights in the hierarchical structure (by expertise or experience) permits to determine the
maximum possible degradation linked to a project element/process if it is altered. This first
analysis thus permits to identify aspects which can be neglected due to their low implications in
possible damages regarding values creation, which permits to diminish the number of vulnerable
processes or elements to deal with. This is all the more important to perform since the
combinatorial aspects of project vulnerability identification are likely to be very important.
Once refined, as underlined by the literature, we claim for the use of a stressor / receptor model to
identify key project vulnerabilities, that is to say key project process vulnerabilities which are
triplets (value, process, event) and key project elementary vulnerabilities which are triplets
(value, element, event). The first steps of the identification process permitted to identify project
values, processes and elements and to refine their lists thanks to issues about contribution rates
to values creation. This work now proposes that, given a process or element the vulnerability of
which is to be studied, one focuses on this process / element as a receptor and tries to list down as
exhaustively as possible the possible negative events it may be exposed to (that is to say its
potential stressors). This aspect is to be performed thanks to the conjoint use of expertise and
experience. We may recommend here the use of some creativity methods such as brainstorming,
dissociation or inversion.
As a whole, an initial list of project process and elementary vulnerabilities is done. Identifying
project vulnerabilities is in itself a first result. However, one should be able to evaluate/analyse
them in order to manage them better.

- 112 -
V.3.4. The project vulnerability analysis step One should note that the tools which are proposed here are first analysis tools and that, as in
project risk analysis, many other qualitative/quantitative tools are likely to be developed to
perform further project vulnerability analysis. Once the set of project process or elementary
vulnerabilities is identified, theses ones are to be analysed regarding the two principal aspects of
vulnerability in terms of non-capability, that is to say non-resistance and resilience (as stated
p.106). As mentioned before, we focus on these two aspects and neglect the one of susceptibility
(which is closely related to the events apparition) to focus directly on the weaknesses of a project
system. In order to do so, objective scales which permit to assess the non-resistance and resilience
of project elements/processes regarding possible negative events should be built up.
One is then to evaluate the corresponding resistance and resilience of a given project process or
elementary vulnerability. In order to do so, a first tool is proposed: objective 1 to 10 evaluation
scales should be built by experts, like in the risk analysis process when performing the evaluation
of probability and impact. Such examples of scales can be found hereunder in Figure 49. This
choice of expert evaluation corresponds to a first approach in order to build up the whole process
of project vulnerability management: some more precise analysis methodologies are likely to be
elaborated in the future.
Figure 49 also shows how synthetic diagrams (non-resistance and resilience on axes, contribution
rate to the project value V as the diameter of the circle) can be built to highlight principal project
vulnerabilities. We recommend that in a diagram, there should be only the project vulnerabilities
which correspond to a same value possible degradation, so that the analysis of this diagram is of
interest for management use.
Figure 49. Project vulnerability analysis

- 113 -
In the end, a global cruciality index can be calculated in order to give a simple indicator to rank
project vulnerabilities regarding a project value V.
Let CR(V) be the contribution rate (to the project value) of the vulnerable element/process which
is addressed (CR(V) is a percentage). Let NR be the evaluation of its non resistance. Let R be the
evaluation of its resilience. Then, a synthetic aggregated measure (which can help to underline
higher priority vulnerabilities), which we name the Crucial Index Γ(V) is to be given by the
following equation (the reader should note that Γ(V) is an index varying between 0 and 100).
)()( VCRRNRV ××=Γ
As during any aggregation operation, part of information is lost. Indeed, several different triplets
can have the same value when multiplying the values of its elements. As a consequence, when
ranking according to the Γ(V) index, one may rank at the same level several triplets which could
not be handled the same way (for example high non-resistance and low resilience versus low
resilience and high non-resistance with the same value of Γ(V)). In the end, this classification
according to Γ(V) should always be considered with the initial evaluation of NR, R and CR(V) in
order to make more relevant decisions during the project vulnerability response plan step.
V.3.5. The project vulnerability response plan step The project vulnerability response plan step permits to decide on the actions which are needed to
reduce the threat of the existence of project process or elementary vulnerabilities. This step is to
be performed after vulnerability identification and analysis, which permits to focus on high
priority vulnerabilities within the project system. The project vulnerability response is to
determine the overall strategy for strengthening a project. In the end, possible project contractual
agreements can thus be written in order to take into account project vulnerabilities. These
agreements depend on the strategies which are chosen to cope with the project vulnerabilities. As
in the risk management process (PMI,2004), even though slightly different, there are five basic
strategies to cope with project vulnerabilities.
• Mitigation
Mitigation is the strategy which consists in making decisions in order to improve
the resistance of the project processes / elements and / or to lessen their resilience
regarding negative triggering events. Another strategy would be to diminish the
contribution rate of the process / element to the value creation but this strategy is
not always possible, and whenever possible, it is to be classified under the name of
transfer since contributions are transferred to other entities.
• Avoidance
Avoidance is the strategy which consists in making decisions in order to eliminate
project vulnerabilities by improving to 100% the resistance of the project
processes/elements. The reader should note that for project risk management, there

- 114 -
are two ways to avoid risks (reducing to 0 probability or impact). But there is only
one way to avoid vulnerability (reducing to 0 non-resistance). Indeed, resilience has
no direct impact on avoidance since resilience underlines a dynamical aspect of
vulnerability (evolution over time). Avoiding a project vulnerability means that it
never exists, which means that resistance must be total. The reader should also
note that another possible avoidance strategy is to reduce to 0 the contribution rate
of the project process / element to the corresponding value creation but first, it isn’t
always possible, and second, once again, these strategies are to be classified under
the name of transfer since contributions are transferred to other project entities.
• Transfer
Transfer is a strategy which consists in making decisions in order to transfer project
vulnerabilities to other project processes/elements which have less influence in the
values creation processes. This strategy is really different than the transfer strategy
in the project risk management process which consists in the transfer of the risk
responsibility to a third party.
Here, vulnerabilities exist within the project system and there is no reason to
transfer them to third parties which would be external to the system (however, one
should note that decisions can still be made to transfer the final risk responsibility
to any of the project stakeholders). However, transfer strategies can be defined in
the following manner. For instance, if an actor appears to be vulnerable and thus to
be the source of a project process degradation, then one can choose, whenever
possible, to transfer this actor to other processes which have less impact on the
creation of project values.
The transfer strategy is thus the strategy which proposes to handle contribution
rates (to the corresponding value creation) as potential levers for vulnerability
reduction.
• Acceptance
Acceptance is a strategy which is notably designated for low resilience and high
resistance project vulnerabilities. It consists in saying that little or nothing can be
done expect letting things run their course, knowing that these low Crucial Index
vulnerabilities however exist.
• Contingence
Contingence response is an intermediary manner to cope with vulnerabilities. It is
associated with the one of the other strategies (especially mitigation) and
determines the actions which should be done if the chosen vulnerability response
should fail.
Any of these possible solutions should be explored when trying to cope with a project
vulnerability. The choice of the suitable strategy is to be performed notably thanks to the project
manager / team experience.

- 115 -
V.3.6. The project vulnerability monitoring and control step In essence, a project system is evolving, which means that project vulnerabilities do not remain
static. New vulnerabilities may pop up, the characteristics of project vulnerabilities may change
or vulnerability responses may not have the effects which were planned.
Watching for such changes in the project system is therefore necessary to manage project
vulnerability in the end. Particularly, vulnerabilities are to be re-identified and re-assessed
during the project, since they refer to a project system which is in essence in constant evolution.
This step is very similar to the project risk monitoring and control step in the risk management
process (PMI, 2004).
V.3.7. Synthesis : comparison with the project risk management process Figure 50 proposes a critical comparison of the project risk management process and the project
vulnerability management process. One should notice in the end that project vulnerability
management as proposed in this thesis is a systems thinking oriented approach, which implies a
better integration of project complexity thanks to a systemic vision of the weaknesses of the
project system. Moreover, the fact that one is to focus on the elements and processes of the project
system permits to reduce ambiguity as a more formalized and precise description of the possible
damage creation process is enhanced by this approach. Project risk management process Project vulnerability management process
Identification step
One step process as it Identifies possible triggering events, and often their effects and their causes. Notice these events can be either positive or negative. Performed through expertise / experience / creativity.
Two main step process as it first identifies existing tangible aspects of the project system which appear to be vulnerable regarding the project values creation processes. Then it identifies project process or elementary vulnerabilities. First step performed through expertise, seconde one through expertise / experience / creativity.
Analysis step
Evaluates risk probability and impact. Numerous methods to perform such quantitative or qualitative analysis. Classification is proposed to focus on high priority risks, notably thanks to the definition of a criticality index. One of the main difficulties is to assess possible events.
Evaluates the resistance and resilience of project vulnerabilities. First proposal is a qualitative analysis. Classification is proposed to focus on high priority vulnerabilities thanks to the definition of a 0 to 100 cruciality index. One of the main difficulties is to assess resistance and resilience regarding possible events.
Response plan step
Proposes strategies for risk responses. Leavespossibilities for risk mitigation, avoidance on two factors (probability/impact), acceptance, contingence or transfer to a third party.
Proposes strategies for vulnerability responses. Leavespossibilities for vulnerability mitigation, avoidance on a single factor (resistance), acceptance, contingence and transfer within the project system.
Monitoring and control step Very similar to one another Very similar to one another Figure 50. Comparison between project risk and vulnerability management processes
As a whole, this approach may diminish the observed (in fieldwork) reluctance to risk
management processes as vulnerability management processes focus on existing tangible aspects
of the project. It permits to cope with the existing weaknesses of a project system which need to
be strengthened. When possible risks were underlined before, existing weaknesses of the project
are stressed thanks to this approach. In the end, the vulnerability response plan may thus appear
more relevant as the responses directly focus on the project system instead of dealing with

- 116 -
probabilistic events: the required efforts (notably in terms of time and money) for these responses
may thus appear more necessary as real project weaknesses are underlined.
V.4. Case study: the FabACT project
V.4.1. Introduction
A case study is performed during the FabACT project (Vidal and al., 2009a), a software
development project within the context of the pharmaceutical industry. This project was executed
in collaboration with the UPIO (Unité Pharmaceutique en Isotechnie et Oncologie –
Chemotherapy Compounding Unit) at the Georges Pompidou European Hospital. This paragraph
is an introduction to describe the FabACT project and its context. The French health system faces
ever growing demands under very pressuring conditions as it is much constrained in a complex
environment. The most recent statistics published by the French government indicate that in
2005, the number of new cancer cases has increased by 89% since 1980, reaching the number of
320 000 new cases for the first time (Jemaa and al., 2005). As a consequence, oncology-related
services (such a radiology, surgery and chemotherapy) have to face an ever-growing level of
activity. In order to contain cost, most of French hospitals are gradually centralizing the
compounding of sterile products such as anti cancer drugs. At the Georges Pompidou European
Hospital (HEGP, AP-HP, Paris), these drugs are produced within the chemotherapy compounding
unit called UPIO which performs about 20 000 preparations per year (Bonan and al., 2009). The
production of anticancer drugs must satisfy subsequent production volumes, while guaranteeing a
high quality product preparation level in the name of good practice guidelines (Maestroni and al.,
2007). Furthermore, with the new work regulations adopted in France (notably the 35-hours
working week) and without the possibility to expand the pharmaceutical staff, the pharmacists of
this hospital are facing new challenges. Discussions we had with the pharmacists of the UPIO led
to the idea that the anticipation of anti-cancer drug preparations could be a potential solution to
support this increased workload. Hence, by anticipating the production, one part of the
preparations can be done on a MTS (Make to Stock) basis, which may improve significantly
several aspects: first, the service provided to patients can be improved since waiting times are
reduced; secondly, this may contribute to the reduction of errors that pharmacy technicians may
do while preparing drugs in short time schedules; thirdly, this constitutes a framework for
optimising the production planning process.
There are 2 categories of drugs that are prepared at UPIO, depending on information available:
• Some of preparations are prepared on a MTO (Make–to–Order) basis: in this case,
pharmacists do not have any visibility on the amount of preparations needed for each
patient. The time that elapses between the prescription of the medicine and its production
is no longer than 1.5 hours. Such urgent production may stem from a patient that needs a
non planned urgent administration in a very short time frame or from organisational

- 117 -
failures such as prescription keypunching errors, production orders that are forgotten to
be integrated to the daily production, etc.
• The other part of preparations is produced on a MTS (Make-to-stock) basis. In this case,
pharmacists have a greater visibility on demand. In fact, the prescription for drug already
exists on the computerized physician order entry software used at UPIO (Chimio®) and
the production starts when this prescription is confirmed by the doctor. This validation of
the prescription confirms that the patient, waiting for the administration of the drug, can
receive the chemotherapy in the hospital. Such drugs can be produced by anticipation due
to the information available on the Chimio® software. The proportion of such products
was very small at UPIO at the beginning of the study. In fact, the production of only two
molecules was anticipated based on a subjective and empiric approach due to the lack of a
pertinent decision support tool.
The chemotherapy compounding process can be separated into several steps. According to the
compounding sheet, the technician prepares all the material needed including gowns, syringe,
needle, drug vial, infusion bag, gloves, etc… These are manipulated within a sterile workstation
(isolator or laminar hood). A 1ml sample is withdrawn from the infusion bag in order to be
controlled before dispensing the preparation into the medical unit where the patient is treated.
One complex aspect of this process is that the preparations differ in terms of dose, final volume,
stability, cost and lifetime (as they are in essence perishable products). In addition, these drugs
are sterile and each drug belongs to a single patient. The dose prepared and then administered to
the patient is determined solely according to the patient’s weight, size and background (generally
obtained from a blood check-up including creatinine blood level). Those parameters are moreover
updated very regularly. According to the evolution of the patient’s status, a significant change in
any of them can make the drug useless and the preparation should be re-performed according the
new dose calculated (Hassan et al., 2004). Concerning production volumes, in 2005, 17 690
preparations were made up, while in 2007, the number of preparations reached 18 492
preparations, which is an increase of 802 preparations (4.5 %) in a two years time. To support this
increasing workload, pharmacists wanted to evaluate how anticipating the production of certain
drugs may help them in improving the organisation of the production process.
Figure 51. Anti-cancer drugs production and distribution process
Anti cancer drugs selected to be produced by
Anti cancer drugs that that can not be produced by
Identification of MTS and MTO anti cancer drugs
Anti cancer drug distribution and administration
Production Planning
Resssource constraints

- 118 -
Within this context, the FabACT project has been launched at HEGP Pharmacy department in
2006. The aim was to achieve a better balance between the workload and the ability to hold the
admixture compounding burden while respecting constraints such as drug stability and quality of
service. As shown on Figure 52, the first step of this project was the identification of drugs that
can be prepared on a MTS basis.
Once these drugs are determined, the second step would be to organise the production planning
process by smoothing the quantities to be produced over a time horizon, by mixing MTO and MTS
type preparations. This second step aims at smoothing the workload over time thereby reducing
the stress of the pharmacy technicians and increasing preparation quality. Finally, mixing MTO
and MTS type preparations is also expected to allow urgent demands to be handled more easily
due to the fact that MTS type preparations can be temporally postponed.
The aim of the FabACT project was therefore to develop a decision support tool in order to assist
pharmacists while choosing the anti-cancer drugs that can be produced in advance. Anticipated
manufacturing generates a risk in terms of cost and preparation time. Indeed, products can
sometimes be produced and finally not used because of many reasons, generally related to the
patient clinical status. Drugs are then recoverable if and only if the treatment can be delayed
within the drug lifetime.
Figure 52. Work Breakdown Structure of the FabACT project

- 119 -
However, anticipated drug production tends to become a crucial need for anti-cancer production
units since demand is ever growing without extra staff being hired. The decision support tool
which was developed was to be multi-criteria and implemented as a software which could be used
in any hospital pharmacy in France. Initially, the Work Breakdown Structure of the FabACT
project was defined as the following one (Figure 53). Four researchers from an academic
institution (Ecole Centrale Paris), three researchers/pharmacists from the UPIO, 2 consultants
specialized in the communication within medical and healthcare contexts constituted the core
team of the project. Graphical design of the software is subcontracted to a person working in a
specialized firm. The whole project was to last around a year. Budget is not mentioned here. A
pharmaceutical industrial group (drug combination producer) finances the major part of the
project as its client. Final software products are going to be distributed by this industrial group to
hospital pharmacies with the logos of some stakeholders (UPIO / ECP / Industrial Partner) but
not commercialised.
Due to the importance of this project, a study was to be launched in order to identify the possible
cases of failure for the project. This project therefore constituted the fieldwork to test the project
vulnerability approach we propose in order to identify its weaknesses. Simultaneously, a
traditional project risk identification and analysis process was performed to compare the two
approaches.
V.4.2. Results and discussion
V.4.2.i Identification of project vulnerabilities
In order to perform the step of project vulnerability identification, as proposed in this Ph.D. work,
one should use a systems thinking approach, which starts with the identification of project
stakeholders Considering the execution phase of the project, the teleological pole of the project
system (entities of this pole, the requirements they have, the constraints they exert) can be
identified as the following one.
• UPIO team of the Georges Pompidou Hospital (APHP)
WANTS TO
Create scientific, industrial and societal values.
Promote its image thanks to the success of one of its member’s initiative.
Have priority access to the beta versions of the software to test it in their unit..
Improve its relationships with the industrial partner
Earn some money
EXERTS CONSTRAINTS SINCE IT
Delivers some inputs for the software and website development (pharmacists’
needs, drug selection criteria, test data, visual specifications,…).
• Ecole Centrale Paris (ECP) – Industrial Engineering Department
WANTS TO

- 120 -
Create scientific, industrial and societal values.
Improve its corporate image and valuate its research teams and students
Manage the project properly to improve its image.
Earn some money
EXERTS CONSTRAINTS SINCE IT
Delivers some inputs for the software and website development (problem
modelling, first versions of the software,…)
• Healthcare consulting group
WANTS TO
Improve its corporate image and/or create relationships with healthcare industries
Earn some money
EXERTS CONSTRAINTS SINCE IT
Delivers some inputs for the software and website development (first versions of
the website and user guide,…)
• Industrial partner (drug combination producer)
WANTS TO
Improve relationships with hospital drug production units.
Improve its corporate image.
EXERTS CONSTRAINTS SINCE IT
Wants a certain number of software products at a given time T.
Wants a reliable decision support tool to satisfy the final users.
• Indeed, the final users (anti-cancer drug production units in french hospitals)
WANT TO
Find an assistance to decision-making to anticipate anti-cancer drug production
Have a user-friendly interface, that is to say a quick and easy to handle software
Have a software which is compatible with the existing computer equipment
As a whole, the project created values must meet all the requirements and respect all the
constraints cited before. These values must be found through the elaboration of the project final
deliverables (decision-making software, associated products (website, users guide, commercial
brochure,…), scientific publications, participation to industrial congresses). The project values
were thus listed as the following ones (since they were the most meaningful ones after the
identification of project stakeholders):
• Completion of the project on time
• Profit due to the project
• Quality of project processes
• Industrial, scientific and societal quality of project deliverables, which are mainly
influenced by
Rigor of the scientific approach. (Sc)
Reliability of the result. (In) (Sc) (So)

- 121 -
Figure 53. Identifying project tasks contribution to project values creation

- 122 -
Adjustement of the software to the hospital and drug production context. (In) (So)
Friendliness and easiness of understanding and use of the software. (In)
Compatibility with existing computer equipments in hospital pharmacies. (In)
Number and quality of scientific publications, congresses and conferences. (Sc)
(So)
Number of conference and congresses organised for industrials. (In) (So)
By going back to processes and tasks, (some of them were slightly redefined), it is possible to
build up a table which synthesises the contribution of any task to any of theses values creation.
This table can be seen before on Figure 54. This table permits, as suggested, to refine the analysis
of fewer tasks / processes and project elements (corresponding to theses tasks and processes)
when performing the project vulnerability analysis thanks to expert judgement (once again,
future work is to be done in order to develop finer and deeper methodologies to perform these
evaluations).
Indeed, for instance, when studying the vulnerability of the FabACT project regarding the
creation of deliverables of high scientific quality, one is to have a closer look at this table, identify
the tasks which have significant contribution rates regarding the creation of this value (over 10%
in orange, over 5% in yellow). Only the vulnerability of these tasks is then to be analysed further
as a first result since if other tasks are altered because of their vulnerability, they can in the
worst case alter less than 5% of the scientific quality of the project deliverables. This step is
absolutely necessary in order to lessen the combinatorial aspects of a project vulnerability study.
All the results of this study regarding the FabACT project cannot be presented here directly. The
following parts of this paragraph focus on the project vulnerability regarding the creation of high
scientific quality deliverables.
Figure 54. Identifying the actors which contribute more to the tasks which make the project
vulnerable regarding scientific quality creation

- 123 -
In order to close the vulnerability identification steps, one is to identify the projects elements
which contribute to the tasks which were identified before. In the same manner, contribution
rates tables can be built. The reader will find an example of such a table in Figure 55.
(corresponding tasks and project actors). Refining can also be performed. In the end, a list of
vulnerable tasks and associated project elements is built.
As a whole these first identification steps are the basis to identify project processes or elementary
vulnerabilities. By focusing on process or elements as potential vulnerable receptors of events,
one is able to set the list of project process and elementary vulnerabilities.
Figure 55 proposes here the corresponding list of project elementary vulnerabilities in terms of
project actors. This list is to be analysed in the following step as an illustration on how to perform
project vulnerability analysis.
V.4.2.ii Analysis of project vulnerabilities
After refining the vulnerability (regarding a project value creation process) studies to a precise set
of project tasks and elements (the ones which can be the source of potential damages which are
over a certain threshold), one is to study their resilience and resistance in order to quantify their
weakness regarding possible negative events. For instance, one can perform it here on the
identified project actors which make the project potentially vulnerable regarding the creation of
high scientific quality deliverables (due to their contribution to the tasks which make the project
vulnerable regarding this same value creation process). We obtained a list of five actors which
contribute to this value creation: ACTOR 1, ACTOR 2, ACTOR 3, ACTOR 6, ACTOR 7. These
actors are the ones to be watched over because of their potential impact on the targeted value
creation if their usual behaviour during the project is altered. One is to find hereunder an excerpt
of the FabACT project actor vulnerability analysis. The project actor vulnerabilities are ranked
according to their Crucial Index Γ(V).
Value Element CR(V) Event NR R Γ(V)Scientific Quality Actor 1 0,41 Unclear software requirements and specifications 8 8 26,24Scientific Quality Actor 1 0,41 Error when encoding the software 6 8 19,68Scientific Quality Actor 1 0,41 New requirements appearing 8 6 19,68Scientific Quality Actor 1 0,41 Bad communication within the project team 6 6 14,76Scientific Quality Actor 1 0,41 Misunderstanding of previously carried out studies 6 6 14,76Scientific Quality Actor 1 0,41 Lack of information 8 4 13,12Scientific Quality Actor 1 0,41 Uncorrect information 7 4 11,48Scientific Quality Actor 2 0,12 Unclear software requirements and specifications 8 8 7,68Scientific Quality Actor 3 0,11 Unclear software requirements and specifications 7 8 6,16Scientific Quality Actor 2 0,12 Illness 7 7 5,88Scientific Quality Actor 2 0,12 New requirements appearing 8 6 5,76Scientific Quality Actor 7 0,07 Misunderstanding of the publication target requirements 9 9 5,67Scientific Quality Actor 7 0,07 Unclear software requirements and specifications 9 8 5,04Scientific Quality Actor 1 0,41 Too short test phase 6 2 4,92Scientific Quality Actor 6 0,06 Misunderstanding of the publication target requirements 9 9 4,86Scientific Quality Actor 3 0,11 New requirements appearing 7 6 4,62Scientific Quality Actor 7 0,07 Misunderstanding of previously carried out studies 9 7 4,41Scientific Quality Actor 2 0,12 Misunderstanding of the publication target requirements 4 9 4,32Scientific Quality Actor 6 0,06 Unclear software requirements and specifications 9 8 4,32
Figure 55. Excerpt of the FabACT project actor vulnerability analysis

- 124 -
V.4.2.iii Vulnerability response plan
This analysis underlines here that ACTOR 1 is the most vulnerable one regarding scientific
quality creation during the project. The vulnerability response plan should therefore focus on the
accompaniment of this actor in order to guarantee its performance regarding value creation or it
should propose transfer strategies which transfer some tasks to less vulnerable actors.
This analysis particularly permits to underline that ACTOR 1 is particularly vulnerable to
problems regarding the requirements of the software (whether they are unclear, changing or
potentially misunderstood). As a consequence, this underlines that specific attention should be
given to the definition of requirements and specifications as they are likely to condition. This is
all the more true than the event “unclear software requirements and specifications” appears to
participate to 5 of these 19 most important project actor vulnerabilities, causing the potential
vulnerability of any actor within the project.
Other specific attention should be paid to the event “misunderstanding of the publication target
requirements” since it directly impacts several actors in the FabACT project regarding scientific
quality creation. This can be understood since the FabACT project is at the meeting point of
industrial engineering and pharmacy and that publication targets requirements may not always
be clear in the possible integration of articles dealing about this issue in the corresponding
journal or revue.
V.4.2.iv Comparison with a traditional risk management process
Once can find hereunder an excerpt of a traditional risk management process performed for the
FabACT project to be a point of comparison in order to underline the potential benefits of a
project vulnerability analysis.
Figure 56. Excerpt of the FMECA of the FabACT project

- 125 -
First, one should notice that the lack of integration of project values does not permit to
understand properly the consequences of the potential failure modes, even though there effects
are likely to be mentioned. Vulnerability analysis permits to understand better the possible
damage chains which exist within a project. It must be notices that for instance, no aspect about
publication target requirements had been mentioned in the FMECA although it appeared to be a
high potential source of vulnerability regarding scientific quality creation during the project.
Second, by analysing the project system’s weaknesses, one is to make better and more specific
decisions when establishing a response plan. Indeed, the FMECA mentions “unclear software
requirements and specifications” or “misunderstanding of software specifications” as potential
causes of important failure modes. This is consistent with the project vulnerability analysis which
was performed. However, the project vulnerability analysis permits to focus on the project
elements or processes which are impacted the most by this potential cause / stressor event. For
instance, actors did not appear equally vulnerable to these events and the fact that project
vulnerability analysis underlines the vulnerability of ACTOR 1 regarding these events permits to
concentrate on weakest, and thus most dangerous regarding value creation, parts of a project.
V.5. Conclusions and perspectives
As a whole, this chapter presents an innovative way to assist project risk management through
the integration of the concept of project vulnerability. This concept permits to analyse a project
system and focus on its existing weaknesses thanks to a systems thinking-based approach. After
proposing a definition and a description of project vulnerability, a proposition to describe the
project vulnerability management process into four successive steps is done. The reader should
remind them as a first proposal to perform project vulnerability analysis:
• Project vulnerability identification consists in identifying project process or elementary
vulnerabilities thanks to a systems thinking-based approach which permits to focus on
the existing weaknesses of a project system.
• Project vulnerability analysis permits to rank project vulnerabilities according to a
Crucial Index Γ(V) based on the evaluation of non-resistance and resilience, allied to the
initial evaluation of contribution rates of processes and elements to value creation.
• Project vulnerability response plan permits to address the issue of vulnerability
management thanks to the use of different possible strategies: mitigation, avoidance,
transfer, acceptance and contingence.
• Finally, the project monitoring and control process suggests that the former processes
were to be performed several times during the project in order to keep an up-to-date
version as vulnerability management directly focuses on the project system, which evolves
over time (genetic aspect of the system).
This project vulnerability management process permits to concentrate directly on the existing
weaknesses of a project system which may create potential damages regarding the project values

- 126 -
creation. By focusing on this system, response plans may be more adapted to the existing lacks of
the project, as shown by the case study with the FabACT project. Such focus on the system is to
be of great interest for project managers and project teams. When before there was ambiguity or
lack of confidence in dealing with potential events and potential impacts, vulnerability
management permits to point out the weak aspects of a project. Attention should however be paid
on vulnerability communication so that it is not seen as a way to underline low performance
elements or actors in a project. Vulnerability management must therefore be highlighted as a
promising tool for complex project performance management as it permits a more effective and
efficient accompaniment of project teams thanks to a better understanding of possible damage
creation within complex project systems.
Some aspects of this work may however be discussed. We thus identify several research
perspectives to consolidate the proposals of this chapter.
• First, as already noted, new evaluation methods should be elaborated to assess more
efficiently non-resistance and resilience during the project vulnerability analysis step.
Moreover, the susceptibility aspect of vulnerability is neglected in this first approach of
project vulnerability management. Future research work may explore the following
issues. What are the relationships between a project process or elementary vulnerability
susceptibility and the related event apparition probability? In particular, is it only related
to the event, meaning that (value1, actor1, event1) and (value2, actor2, event1) have the
same probability or does it depend on other factors? Whatever the answer, further work is
also to address the issue of the integration of the susceptibility aspect into the
vulnerability analysis step, maybe in order to study project vulnerabilities regarding their
pair (Susceptibility, Γ(V)).
• Moreover, the calculation of the Crucial Index Γ(V) is to be improved thanks to the
integration of the connectivity of the vulnerable processes and elements with the other
processes and elements of the project system. Indeed, as highlighted in works such as the
ones of Latora and Marchiori (Latora and Marchiori, 2005), some indexes can be used to
underline how the dysfunction of a given system element can damage the whole execution
of the system. Such approaches are notably to use graph theory and may be developed in
future research work (they will be all the more developed than the results of Chapter 6
are based on graph theory, which could make a link between the systems oriented vision
of this chapter and the more analytical one of Chapter 6).
• Another interesting work on several project case studies may be to build up in the end a
typology of mostly encountered project vulnerabilities. Such a typology could be a basis for
vulnerability identification (even though this step remains very specific to the project
system) for two reasons. First, it could permit to propose a standard classification of
project vulnerabilities when identified and not analysed. Second, it could be helpful when
performing the identification step as it may offer a framework for a check-list when
identifying project vulnerabilities.

- 127 -
• Other promising works may focus on the evaluation of the non-resistance and resilience of
project vulnerabilities. Indeed, this work proposes a first qualitative evaluation of these
characteristics which is notably based on an analogy with existing qualitative evaluation
of project risks. Some methodologies may be developed to propose quantitative evaluation
of these aspects or to refine the qualitative evaluation which is proposed in this work.
• Finally, new case studies are to be performed in order to validate even more this approach
and study both the practical applications (and improvements) of these results and their
future implications on project management processes and organisation.

- 128 -

- 129 -
Chapter Chapter Chapter Chapter VVVVI. I. I. I.
AAAAn an an an analytical approach nalytical approach nalytical approach nalytical approach –––– InteractionsInteractionsInteractionsInteractions----based clustering and based clustering and based clustering and based clustering and other tools other tools other tools other tools to assist complex to assist complex to assist complex to assist complex project risk managementproject risk managementproject risk managementproject risk management
AbstractAbstractAbstractAbstract
The overall ambition of this chapter is to propose an innovative way to cluster risks in
order to facilitate coordination in the process of complex project risk management. As shown in
Chapter 4, traditional project risk management methodologies do not permit to catch project risk
interactions when clustering them into manageable and analysable entities. Moreover,
propagation phenomena within the project risk network are often neglected and there is crucial
need for the use of some tools to understand them better.
We first identify the requirements of the tools which should be proposed to improve these
current lacks in project risk management. Two issues are to be addressed: risk propagation and
interactions-based risk clustering. In order to address them, a brief state of the art on graph
theory and the Design Structure Matrix (DSM) approach is carried out.
Two risk matrices are built up to model the complex project risk network. A binary
matrix, the Risk Structure Matrix (RSM) corresponds to the adjacency of the project risk finite
directed weighted graph. A numerical version of this matrix, the Risk Numerical Matrix (RNM) is
then proposed thanks to an assessment of risk interactions through the achievement of pairwise
comparisons. These matrix representations are then used directly to propose some tools to
analyse better propagation phenomena within the project risk network.
Then, a state of the art on graph clustering and partitioning issues permits to formulate
our goal thanks to the values of the RNM. The objective is to cluster risks according to the
strength of their interactions (thanks to the minimisation of the cutsize in the problem of graph
K-partitioning), in order to reduce interfaces for all practical purposes. A linear programming
formulation of the problem is proposed and some conditions of invariance of the results are

- 130 -
studied. Since this problem is NP-hard, two elementary approximate iterative algorithms are
proposed. Performance measures are then identified to compare possible clustering solutions.
The whole is tested on two case studies. The first one takes place in a firm within the
stage musicals production industry. The second one studies the case of the Jerasulem tramway
construction and future exploitation project. After concluding on the validity and practical
interests of this approach thanks to this case study, some conclusions are drawn on its
implications on project risk management. Final conclusions and research perspectives are then
given.
Chapter KeywordsChapter KeywordsChapter KeywordsChapter Keywords
Project, Risk, Interactions, Graph theory, Design Structure Matrix (DSM), Clustering, Partitioning, Linear Programming.

- 131 -
VI.1.VI.1.VI.1.VI.1. Introduction Introduction Introduction Introduction
As an introduction to this chapter, a study was carried out to identify which conventional project
risk methodologies were able to address the issue of risk propagation and risk possible
interactions due to the complexity of project systems.
This study proved us that vey few methods permitted to manipulate this concept, and well-
established ones do not permit to handle possible risk interactions at all. And even when doing so
or part of so, existing methodologies have their limits. As highlighted in Chapter 4, the direct use
of the concept of probability has also some limitations, which calls for the evaluation of the
strength of possible precedence relationships in order to understand better possible propagation
phenomena.
As a consequence, new methodologies and tools, even easy or intuitive, must be designed to
facilitate the integration of complexity-related propagation effects into project risk management
activities. And, as underlined in Chapter 4, project risks are more and more numerous and
critical due to ever growing project complexity.
PROBLEM SETTING OF THIS CHAPTEPROBLEM SETTING OF THIS CHAPTEPROBLEM SETTING OF THIS CHAPTEPROBLEM SETTING OF THIS CHAPTERRRR
As a whole, risks are managed thanks to the elaboration of smaller clusters. As a consequence, a
classification issueclassification issueclassification issueclassification issue arises. Since decisions may be blocked, slowed down or ineffective if
interactions are poorly taken into account, our research problematic in this chapter is thus to
propose a new additional clustering methodologya new additional clustering methodologya new additional clustering methodologya new additional clustering methodology, which could take into account interactions interactions interactions interactions
between risksbetween risksbetween risksbetween risks (possible propagation)(possible propagation)(possible propagation)(possible propagation), in terms of existence and strength.
In order to do so, the following points must be addressed:
• Proposing a definitiondefinitiondefinitiondefinition of project risk interactions.
• Developing a methodology (and its associated tools) to identify and assessidentify and assessidentify and assessidentify and assess project risk
interactions.
• Proposing intermediary elementaelementaelementaelementary toolsry toolsry toolsry tools (which are directly based on the former point) to
assist complex project risk management.
• Developing a methodology (and its associated tools) to cluster riskscluster riskscluster riskscluster risks according to their
interactions.
• Proposing possible refinementsrefinementsrefinementsrefinements of obtained clustering solutions.
• Define performance measuresperformance measuresperformance measuresperformance measures to compare different clustering possibilities of a set or
project risks.
• Express the practical implicationspractical implicationspractical implicationspractical implications and use of these methodologies and tools on complex
project risk management.
As a whole, this chapter proposes to follow a several step approach which can be found
hereinafter in Figure 58.

- 132 -
Figure Figure Figure Figure 57575757. . . . ContentContentContentContent of chapter 6of chapter 6of chapter 6of chapter 6
The next section focuses specifically on the identification and possible evaluations of risk
interactions and it also addresses how they can directly be used to assist complex project risk
management by identifying possible intricate situations within project risk networks. Then
section VI.3. addresses the issue of interactions-based clustering in order to facilitate the
coordination and management of project risks. Case studies are finally carried out in VI.4.
VI.2.VI.2.VI.2.VI.2. Identifying and measuring project risk interactionsIdentifying and measuring project risk interactionsIdentifying and measuring project risk interactionsIdentifying and measuring project risk interactions
VI.2.1.VI.2.1.VI.2.1.VI.2.1. Defining project risk interactionsDefining project risk interactionsDefining project risk interactionsDefining project risk interactions
Before carrying out this study, the concept of project risk interaction is to be defined. In this
work, the following definition is to be used.
DefinitDefinitDefinitDefinitiiiionononon
A project risk interaction exists between two project risks Ri and Rj if a possible precedence
relationship can be identified from Ri to Rj, i.e. if the occurrence of Ri might trigger the occurrence
of Rj.
This means that:
• A project risk interaction is oriented from one risk to another.
• Project risk interactions can be assessed numerically thanks to the assessment of
precedence possibilities.
• Mutually interdependent risks in terms of possible precedence generate two
differentiated project risk interactions (from Ri to Rj and from Rj to Ri).
The reader should note that no relation between risks in terms of impact is considered in this
work. The introduction of impact in the concept of risk interactions makes the point of future
research works.

- 133 -
VI.2.2.VI.2.2.VI.2.2.VI.2.2. Claiming for the conjoint use of graph theory and the Design Claiming for the conjoint use of graph theory and the Design Claiming for the conjoint use of graph theory and the Design Claiming for the conjoint use of graph theory and the Design
Structure Matrix (DSM) approach Structure Matrix (DSM) approach Structure Matrix (DSM) approach Structure Matrix (DSM) approach
VI.2.2.i.VI.2.2.i.VI.2.2.i.VI.2.2.i. Graph theory elementary tools and definitionsGraph theory elementary tools and definitionsGraph theory elementary tools and definitionsGraph theory elementary tools and definitions
Graph theory (Bondy and Murty, 1976), (Biggs and al. 1986), (Diestel, 2005), (Bang-Jensen and
Gutin, 2007), (Schaeffer, 2007) is based on the following concepts and semantics, which are to be
used in the following paragraphs.
• A graph is a structure formed by a set of vertices V (also called nodes) and a set of
edges E, each edge being a connection between a pair of vertices (they are called the
endpoints of the edge). A graph is mathematically this pair of sets (V,E).
• The edge count accounts for the size S of the graph. The number of vertices n is called
the order of the graph. A graph is finite if its size and order are finite. The
neighbourhood Γ(V) of a vertex V is the set of vertices which are connected to V.
• A path from V1 to V2 is a sequence of edges starting from V1 and ending at V2. The
length of the path corresponds to the number of edges in the corresponding sequence.
• In an undirected graph, each pair of connected vertices (V1,V2) is unordered. In a
directed graph, each pair of connected vertices is ordered.
• A graph is weighted if a weight function assigns a weight on each edge.
According to the definition of risk interaction which is used in this work, project risk networks
can be considered (see Figure 59) as finite directed weighted graphs (also called weighted
digraphs). As a consequence, a brief state of the art on graph theory must be performed, be it only
to note down elementary concepts and identify elementary tools.
Figure Figure Figure Figure 58585858. Project risk networks as finite directed weighted graphs. Project risk networks as finite directed weighted graphs. Project risk networks as finite directed weighted graphs. Project risk networks as finite directed weighted graphs
Some elementary tools and indicators can indeed be defined to analyse graphs:
• The density δ of a graph is the ratio of the number of edges over the maximum possible
number of edges knowing the number of existing vertices n, which means that
=
2
n
Sδ
When δ = 1, a graph is said complete.
I 15
I 16
I 41
I 42
I 74
I 36
I 27
I 65
I 54
I 46
I 43 I 24
I 47

- 134 -
• The adjacency matrix ADJG of a given graph G = (V,E) of order n is given by
1),( 21 =vvADJG if Evv ∈),( 21
0),( 21 =vvADJG otherwise
These values can be replaced by weights in the case of weighted graphs. Note that the
adjacency matrix is symmetric in the case of undirected graphs.
• A cut of a graph is a partition of the set of vertices into two non-empty sets C and V\C.
The cut size corresponds to the number of edges which connect vertices in C to vertices in
V\C. In the presence of weighted graphs (and thus weighted edges), the cut size is mainly
defined as the sum of the weights of the edges which cross the cut (instead of the number
of such edges).
• An induced sub-graph is the graph corresponding to the vertex subset W (included in V)
and the corresponding edge set E(W) which exactly corresponds to all the edges of E that
connect a pair of vertices V1 and V2 which belong to W. A complete induced subgraph is
called a clique. The density of an induced sub-graph is given by
=
2
)(
W
WEWδ .
VI.2.2.ii.VI.2.2.ii.VI.2.2.ii.VI.2.2.ii. The DSM approachThe DSM approachThe DSM approachThe DSM approach
The Design Structure Matrix (DSM), which also referred to Dependency Structure Matrix or
Design Precedence Matrix is a compact matrix representation of a design system or a design
engineering project. This approach is widely used to model complex systems in systems
engineering or systems analysis (Steward, 1981), (Eppinger, 1991), (Eppinger, 1997), (Browning,
2001), (Eppinger and Salminen, 2001), (Sosa and al., 2005), particularly in the contexts of project
planning and project management (Eppinger and al., 1992), (Carrascosa and al., 1998), (Eckert
and al., 2004), (Sosa and al., 2004).
This tool is undoubtedly one of the most established one for interactions management in the
academic fields of industrial engineering, design engineering and project management. In its
initial form, a DSM lists all constituent subsystems or activities, as well as the corresponding
dependency patterns and information exchange.
A DSM consists is a square matrix. The cells along the diagonal represent the system elements.
The off-diagonal cells are used to mention the presence of relationships between the elements.
Reading across a row reveals what other elements the element in that row receives inputs from,
and scanning a column reveals what other elements the element in that column provides outputs
to. Alternatively, a transposed version of the DSM is sometimes used.
One should note that this matrix is very similar to the adjacency matrix in graph theory,
assuming that a directed graph can be drawn to model the corresponding system, with edges
representing information flows. The difference between these matrices lies in the diagonal
elements which are null in the adjacency matrix.

- 135 -
The DSM aims at describing in detail what pieces of information are needed to start a particular
activity and where the pieces of information which are generated by that particular activity lead.
In this way, one can quickly recognise which other activities rely on a given activity’s information
outputs. The main advantage of the DSM is that it can represent a large number of elements and
their relationships in a very compact way, compared to traditional representations such as PERT
graphs or SADT documents, as argued in (Eppinger and Gebala, 1991).
Moreover, a DSM, whether it is binary or numerical (as for weighted or unweighted graph
adjacency matrix) can easily highlight the presence of interfaces-related issues (for instance, the
existence of feedback loops).
Finally, the matrix format of this tool induces matrix-based analysis techniques and matrix-based
fast calculations which can be used to analyse the structure of the studied system and assist its
management in the end (Eppinger and al., 1994). The use of DSMs in both research and
industrial practice increased greatly in the 1990s. DSMs have as a whole been applied for various
issues (change management, project planning, project success estimation, etc…) in various fields
(building construction, chemical, automotive, aerospace, telecommunication industries to name a
few), which make it a very generic and established tool.
In order to propose our analytical approach of complexity integration in project risk management,
we claim for the use of such a matrix representation to model complex project risk networks. This
makes the point of the following paragraphs.
VI.2.3.VI.2.3.VI.2.3.VI.2.3. Building up the Risk Structure Matrix (RSM)Building up the Risk Structure Matrix (RSM)Building up the Risk Structure Matrix (RSM)Building up the Risk Structure Matrix (RSM)
The construction of the Risk Structure Matrix (RSM) which is proposed is very similar to the one
of the DSM. Indeed, the theoretical concepts of the DSM are used, but for other objects than
components or tasks. These objects are project risks and the aim is to build the adjacency matrix
of the project risk directed weighted graph, the vertices of which are project risks, and the edges
of which are project risk interactions (as defined in this work). The reader should note that
project risks are (or can at least be supposed as):
• in a finite number (since a project is in essence temporary, with finite resources,
objectives, means, etc., i.e. a finite number of elements),
• managed during the project management process,
• interrelated, (notably because of project complexity factors (Vidal and Marle, 2007)) which
justifies the use of a methodology for complex interactions management.
Given an existing project risk network, it can be expressed in the form of a binary matrix, where
Rij = 1 if a risk interaction exists from Rj to Ri. This binary matrix permits to express in a
synthetic manner the interactions which exist between risks.

- 136 -
In order to build up the RSM, risk interactions must be properly identified. This identification
process is performed thanks to an iterative procedure. Classical risk identification enables to get
a risk list, called L0. L0 has a dimension of N0, which means that N0 risks were identified. The aim
of our procedure is to get a stable list of risks, which means that interactions between risks are
inside this list. The aim is to obtain a closed system. The procedure for construction of the RSM
matrix is the following one:
For each Ri in L0, i {1..N0}, we identify direct potential causes and consequences {DPCk(i)}.
• Then, for each k, if DPCk(i) L0, then j {1..N0} so that DPCk(i) = Rj
And we have else RSMi,j=1 (if Ri is a potential consequence of Rj), else RSMj,i=1 (if Rj is a potential
cause of Ri), else the two of them.
• If DPCk(i) L0, then we define DPCk(i) = RN0+1
L1 = {L0 + { RN0+1}}, L1 is a N0+1 long list.
RSMi,N0+1=1 or/and RSMN0+1,i=1 (depending whether RN0+1 is a cause or a consequence for Ri).
This operation is repeated until Lk+1 = Lk, which means that no new risk is identified thanks to
interaction with an existing risk of Lk. At the end, we obtain a matrix RSM which is NxN, by
initiating a N0xN0 matrix and enriching it with new identified interactions (N=N0+k). The process
is a binary identification of interactions between risks.
This process enables to address partially a classical issue in risk identification which is
exhaustiveness. Namely, projects may often stop to identification of L0, and then miss a
potentially important number of other risks. Finally and more important in this case, this process
enables to get exhaustive and consistent information about interactions between risks, as a sanity
check is put between Ri and Rj. If Ri declared Rj as a cause, but Rj did not declare Ri as a
consequence, then there is a mismatch. Each mismatch is studied and solved, like analogous
works by Sosa about interactions between actors (Sosa and al., 2004).
FigurFigurFigurFigure e e e 59595959. Transforming . Transforming . Transforming . Transforming a project risk networka project risk networka project risk networka project risk network into into into into a a a a RSMRSMRSMRSM

- 137 -
Classically, the DSM is re-ordered in a way which permits to show first-level blocks, thanks to the
well-established partitioning process (Gebala and Eppinger, 1991). This one applied to the RSM
gives three types of information:
• the dependent risks: they are engaged in a potential precedence relationship,
• the interdependent risks: they are engaged in mutually dependent relation, directly or
with a bigger loop,
• the independent risks: the risks are basically non-related.
The aim of this process is basically to obtain a matrix which is block-lower triangular matrix.
Partitioning enables to isolate interdependent risks, but the final purpose of this work is
different, since it aims at grouping risks in clusters with maximal internal interactions and
minimal inter-clusters interactions. To do so, the RSM needs to be transformed into a numerical
matrix which can to some extent catch the strength of local interactions (Marle and Vidal, 2008).
VI.2.4.VI.2.4.VI.2.4.VI.2.4. Building up the Risk Numerical Matrix (RNM)Building up the Risk Numerical Matrix (RNM)Building up the Risk Numerical Matrix (RNM)Building up the Risk Numerical Matrix (RNM)
For this particular issue of transforming the RSM into the RNM, direct expert evaluation can be
performed by judging on a several level (for instance 10) Likert-scale the strength of interactions.
But, for all practical purposes, direct evaluation is sometimes difficult. We thus propose an
assessment which is based on the AHP pair-wise comparisons as in (Chen and Lin, 2003). steps
are necessary to carry out this work (see Figure 61):
• Step 1: For each Ri, isolating (from the RSM) the risks which are related with Ri in
column (possible effects of Ri) and in row (possible causes of Ri). They are called the
Binary Cause or Effect Vectors and are relative to one risk Ri (BCV|Ri and BEV|Ri). An
example is given for risk R4.
• Step 2: Buiding up pairwise comparison matrices regarding the risk Ri based on the two
previously isolated sets of risks (in rows and in columns), which are to be the set of
alternatives on which the calculations are done. They are called Cause or Effect
Comparison Matrices and are also relative to one risk Ri (CCM|Ri and ECM|Ri).
• Step 3: Consolidating the results thanks to a proper consistency index and finding the
eigenvectors of the previously built pairwise comparison matrices: the Numerical Cause
or Effect Vectors and are relative to one risk Ri.(NCVi and NEVi).
• Step 4: Aggregating the results obtained for each risk Ri into global Numerical Cause or
Effect Matrices (NCM and NEM).
• Step 5: Compiling the Numerical Matrices into a Risk Numerical Matrix (RNM).

- 138 -
Figure Figure Figure Figure 60606060. Transforming the RSM into the RNM. Transforming the RSM into the RNM. Transforming the RSM into the RNM. Transforming the RSM into the RNM
The presence of a 1 in the binary RSM expresses the existence of a possible precedence
relationship between risks Ri and Rj. RSMij=1 implies two different possible ways to address the
situation: this can be seen either as a possible risk input of Ri coming from Rj, either as a possible
risk output from Rj reaching Ri. Similarly as in (Chen and Lin, 2003) for design tasks, these two
visions are combined in this work. That is why a two-way comparison methodology is needed to
achieve the project risks pairwise comparisons.
Two stages must indeed be performed successively. The first one consists in the ranking in rows
for each project risk. Given the risk Rk, the set of alternatives are all the non-zero elements of
risks other than the diagonal element in row k. The criterion on which the alternatives are
evaluated is the contribution to Rk in terms of risk input: in other terms, for every pair of risks
which are compared, Ri and Rj (thus following RSMki=RSMkj=1), the user should assess which one
is more important to risk Rk in terms of probability to be a risk input (i.e., a cause) for risk Rk.
Numerical values can express these assessments thanks to the use of the traditional elementary
Saaty scales. Eigenvectors of each matrix ECM|Rk and CCM|Rk should then be calculated. By
combining the n eigenvectors NEVk and NCVk, we obtain two square matrices called NEM and
NCM.
The ith row of NEM corresponds to the eigenvector of CCM|Ri, which is associated to its
maximum eigenvalue. The jth column of NCM corresponds to the eigenvector of ECM|Rj, which is
associated to its maximum eigenvalue. The traditional consistency index of the AHP is calculated
to ensure the overall coherence of the judgments.
A geometrical weighting operation permits in the end to calculate the elements of the RNM (this
permits a consideration of both evaluations at a same level).

- 139 -
),(),(),( jiNEMjiNCMjiRNM ×=
1),(0),,( ≤≤∀ jiRNMji
This calculation permits an overall estimation of the i-jth term since it permits to aggregate (at
the same level of influence) the two approaches which were discussed before.
VI.2.5.VI.2.5.VI.2.5.VI.2.5. Direct uses of these matrices as an assistance to project risk Direct uses of these matrices as an assistance to project risk Direct uses of these matrices as an assistance to project risk Direct uses of these matrices as an assistance to project risk
managementmanagementmanagementmanagement
Before carrying out the works on an innovative interactions-based risk clustering methodology
which is pursued here, some direct elementary applications of the RSM and RNM are mentioned
in this paragraph. It aims at describing how the corresponding tools can directly assist complex
project risk management.
VI.2.5.i.VI.2.5.i.VI.2.5.i.VI.2.5.i. Identifying potential risk loopsIdentifying potential risk loopsIdentifying potential risk loopsIdentifying potential risk loops
Potential risk loops within the complex project risk network can be identified thanks to a method
which uses the powers of the RSM (adjacency binary matrix) in order to identify successively
higher order loops (Ledet and Himmelblau, 1970). Raising this matrix to the nth power permits to
obtain two results:
•••• When calculating the nth power of the RSM thanks to Boolean arithmetic, the
result is a higher-order binary matrix, where a non-null element aij corresponds to
the fact that Risk i can be reached from Risk j in n steps.
•••• When calculating the nth power of the RSM thanks to traditional arithmetic, the
result is a numerical matrix (integer values), where a non-null element aij
corresponds to the number of possible paths from Rj to Ri, the length of which is
exactly n.
Potential risk loops can then be identified thanks to the diagonal elements of these matrices.
Risks which are potentially involved in loops should be highlighted in a risk analysis process, so
that greater attention is paid to them if occurring during the execution of the project.
VI.2.5.ii.VI.2.5.ii.VI.2.5.ii.VI.2.5.ii. StudyingStudyingStudyingStudying the the the the possible possible possible possible propagation of a given project riskpropagation of a given project riskpropagation of a given project riskpropagation of a given project risk
In order to study the propagation of a specific risk within the project risk network, may it occur,
powers of the RSM can be calculated as before. Reading the jth columns of the nth power of the
RSM permits to identify all the risks which can be reached from Rj thanks to a path of length n.
Let N be the order of the corresponding project risk graph (i.e. the number of identified project
risks). If two risks are connected along a path, then the maximum value of the shortest path
which connects them is in essence (N-1). In other words, there is no use performing more than the
(N-1)th first powers of the RSM to identify all the risks which can be reached along a path from an

- 140 -
initial risk Rj. Distribution-like curves can then be built thanks to these matrices in order to
study more precisely the possible propagation of a given project risk. An example of such curves
can be found hereunder in Figure 62.
Figure Figure Figure Figure 61616161. Analysing the possible propagation of a risk within the project risk network. Analysing the possible propagation of a risk within the project risk network. Analysing the possible propagation of a risk within the project risk network. Analysing the possible propagation of a risk within the project risk network
As shown on this Figure, some indicators can be calculated in the end to analyse and compare
risks in terms of their possible propagation within the project risk network in columns (ORCo –
Other risks as consequences):
• α, which is the proportion of risks which are possible consequence of Rj along a path.
This proportion thus gives the proportion of risks which can be reached according to
propagation phenomena starting from Rj.
• Mean shortest path value (MSPj) can be evaluated. This value is when the cumulative
proportion of reached project risks curve crosses the (α/2) value (between m and m+1
in Figure XXXX). Average shortest path value (ASPj) can be calculated too.
• Finally, the ratio FLR of first level risks (one edge) and the ratio SLR of second level
risks (two edges) can be evaluated to highlight short path consequences.
Similarly, when analysing the powers of the RSM in rows (ORCa – Other risks as causes), one
can calculate β, which is the proportion of risks which are non possible causes for a given risk Ri
along a path (whatever its length). This proportion thus gives the proportion of risks which can
reach Ri according to propagation phenomena within the project risk network. Similarly MSPi
and ASPi can be evaluated to estimate the corresponding mean and average shortest paths.
For all practical purposes, all these indicators are likely to permit a finer process of risk analysis
thanks to a better integration of propagation phenomena within the project risk network. For
instance, risk managers can identify risks which are likely to have many children in the risk
network and may decide to pay greater attention to them in the risk mitigation plan or in the risk
monitoring and controlling processes.
Length of shortest path
Cumulative proportion of project risks
100%
0%
a%
(a/2)%
0 1 2 m N-1m+1
Proportion of riskswhich are not possible
consequences of R jalong a path.

- 141 -
VI.3.VI.3.VI.3.VI.3. InteractionsInteractionsInteractionsInteractions----based clbased clbased clbased clustering of project risksustering of project risksustering of project risksustering of project risks
VI.3.1VI.3.1VI.3.1VI.3.1 Problem definitionProblem definitionProblem definitionProblem definition
As mentioned before, risks become higher in number, criticality and interdependence within
projects, notably due to their increasing complexity. Clustering risks into relevant clusters for an
assistance to project risk management is thus all the more important. The point is that
traditional clusters (according to criticality, risk nature, etc…) do not take into account risk
interactions. In the end, interactions between the obtained clusters do appear, and the
corresponding interfaces are likely to be sources of difficulties for project risk management.
Efficient risk clustering which can take risk interactions into account is thus needed for modern
and complex project risk management.
This section thus addresses the following sub-questions:
• What clustering criterion should be used? Which clustering methodologies do
exist? Since project risks form a graph as mentioned in VI.2.1, in order to answer
these questions, a state of the art on the graph partitioning and clustering
problems is performed in VI.3.2.
• How can the chosen clustering operation can be formulated mathematically?
Knowing that the clustering operation is to be performed thanks to the data of the
RNM (which are in essence approximation of real transition probabilities), the
robustness and invariance of the clustering solution is also to be addressed. These
points are addressed in VI.3.3 and VI.3.4.
• Since the clustering operation is to be complex in terms of algorithm performance,
can some approximate algorithms / heuristics be defined in order to approach the
solution? Can the solution be refined thanks to other conditions for the clustering
solution to be an efficient tool as an assistance to complex project risk
management? These points are addressed from VI.3.5 to VI.3.7.
• Finally performance indicators are proposed in VI.3.8 to evaluate and compare
possible clustering solutions.
VI.3.2VI.3.2VI.3.2VI.3.2 State of the art on graph partitioning and clusteringState of the art on graph partitioning and clusteringState of the art on graph partitioning and clusteringState of the art on graph partitioning and clustering
A state of the art on graph clustering and graph partitioning problems was carried out in order to
define our problem more precisely, to identify possible clustering criteria and methodologies, and
to formulate the problem mathematically in the end.
Two families of criteria (and the corresponding methodologies) do exist when dealing with the
issues of project clustering and partitioning. The first one corresponds to criteria and
methodologies which are based on the concept of vertex similarity and the second one corresponds
to criteria and methodologies which are based on some cluster fitness measures, as underlined in
(Schaeffer, 2007).

- 142 -
VI.3.2.i.VI.3.2.i.VI.3.2.i.VI.3.2.i. Vertex similarityVertex similarityVertex similarityVertex similarity----based criteria and methodologiesbased criteria and methodologiesbased criteria and methodologiesbased criteria and methodologies
There are several clustering algorithms which are based on similarities between the vertices.
These methods are based on the assumption that the higher the vertex similarity, the stronger
the need to cluster the vertices together. These measures are mainly based on additional
properties of vertices which permit to compute a similarity matrix (see VI.3.6 for more detail).
Rather than defining similarity measures, dissimilarity measures such distance measures are
usually defined, for instance the traditional Euclidean and Manhattan distances (Hennig and
Hausdorf, 2006). More advanced distance such as Jaccard distance (Dong and al., 2006) or the
Levenshtein distance (Gusfield, 1997) can be used to answer this issue. Rather than distances,
some other coefficients can be calculated to evaluated vertex similarity and perform the
corresponding clustering process: for instance there exists angle measures such as the cosine
similarity (Lakroum and al., 2005) or numerical measures such as the Tanimoto coefficient
(Tanimoto, 1957).
As noticed by (Schaeffer, 2007), “in some applications, the vertices lack additional properties and
there is nothing in the vertices themselves that would allow the computation of a similarity
matrix”. In this case, vertex similarity measures are often defined thanks to the structural
characteristics of the graph. Some measures based on the correlation of the adjacency matrix such
as the Pearson correlation (Rodgers and Nicewander, 1988) or the Mahalanobis distance
(Mahalanobis, 1936).
Finally vertex similarity measures can be related to the concept of vertex connectivity. In other
terms, some measures are based on the number of possible paths which exist between each pair
of vertices (Hartuv and Shamir, 2000). These measures are very close to the coefficients α and β,
which were proposed earlier in this work as direct tools to analyse the possible propagation
phenomena within the project risk network.
VI.3.2.ii.VI.3.2.ii.VI.3.2.ii.VI.3.2.ii. Cluster fitness measuresCluster fitness measuresCluster fitness measuresCluster fitness measures----based criteria and based criteria and based criteria and based criteria and
methodologiesmethodologiesmethodologiesmethodologies
Some clustering processes are based on cluster fitness measures, that is to say functions which
assess the overall quality and relevance of a given cluster or of a given global clustering solution.
The global objective of these methodologies is to identify clustering solutions which directly fulfil
a certain property. For instance, methodologies based on graph density measures have been
developed in order to partition the initial graph into subgraphs, the density of which should be
inferior and/or superior to chosen values (Karp, 1977), (Kim, 2003). But other cluster fitness
measures are used as a criterion for graph partitioning.
Indeed, as noticed by (Schaeffer, 2007), “one measure that helps to evaluate the sparsity of
connections from the cluster to the rest of the graph is the cut size. The smaller the cut size, the
better isolated the cluster”. Indeed, cutsize-based measures undoubtedly permit to quantify the
relative independence of a subgraph to the rest of the graph and have been used in many
clustering processes (Shi and Malik, 2000), (Kannan and al., 2004). Finding the partition which

- 143 -
minimises cut-sizes (with restriction conditions on the orders of the subgraphs) permits to
maximise the sum of the edges weights which are internal to the clusters. This cut-based measure
seems very interesting in our case. In order to facilitate complex project risk management, one is
likely to want to reduce interfaces in terms of number, and above all strength. Reducing
interfaces is thus very similar to this problem of graph partitioning which aims at minimising the
global cut size (since risk interactions are modelled and assessed thanks to edges and their
weights).
VI.3.3VI.3.3VI.3.3VI.3.3 Problem Problem Problem Problem formulatiformulatiformulatiformulation as a linear programming modelon as a linear programming modelon as a linear programming modelon as a linear programming model
As a consequence, in order to facilitate project risk management and coordination, we propose to
cluster risks in order to maximize intra-cluster interactions thanks to the use of the RNM. Let us
consider a set of project risks (R1, R2, …,RN). As seen before, due to project complexity, this set of
risks is in essence a complex one, since interactions do exist between risks.
Let us suppose that the RNM of this set of risks is known (the former steps to build the RNM
should have been followed by the user). Let K be the number of clusters of the optimal clustering
solution, which maximises intra-cluster global interactions value. This INTRA value is defined by
the sum of the values of all interactions between risks which belong to a same cluster. The
INTER (Inter-cluster global interactions) value is defined by the sum of the values of all
interactions between risks which are not paired inside a same cluster. The sum of INTRA and
INTER values corresponds to the sum of all risk interactions values, which is constant. As a
consequence, maximizing INTRA is equivalent to minimizing INTER.
The point is that K is not known in advance. However, some constraints may be elaborated for K.
Namely, the goal is to assign project members to each cluster in order to manage the risks inside
the cluster. People have a limited capacity to manage simultaneously numerous objects. We
follow the hypothesis that in the end, the maximum size of a cluster should be 9, as some margin
is left compared to the classical empirical rule of 7 objects to be managed simultaneously. This
consideration permits to know a lower bound of K, which is 1)9
1(min +−= N
INTK , where INT is
the integer part of a real number. Upper bound is obviously N, the number of risks.
Here is the corresponding integer programming problem formulation. This problem is to be solved
for each value of K which is superior to Kmin and inferior to N. This problem belongs to the family
of the graph K-partitioning problems (Schaeffer, 2007).
The decision variables of the problem are the following ones:
(1) 1,1,,1, =≤≤∀≤≤∀ ikxKkkNii if risk Ri belongs to cluster Ck.
The objective function, which is to be maximized, is given in equation 2
(2) ∑∑∑= = =
=K
k
N
i
N
jjkik jiRNMxxINTRA
1 1 1
),(

- 144 -
The reader should first pay attention to the fact that the values of the RNM are local judgements,
which implies that risk interactions assessments are in essence relative. However, we do argue
that a first clustering thanks to these values is useful, since it permits the user to focus on the
most significant local risk interactions and since proportions between these relative judgements
and proportions between real transition probabilities may be very similar (Vidal and al., 2009b).
Problem constraints are the following (equations 3 and 4).
(3) ∑=
=≤≤∀K
kikxNii
1
1,1, as we argue for clusters disjunction in order to permit easier
management in practice.
(4) ∑=
≤≤≤∀N
iikxKkk
1
9,1, since we want the maximum size of clusters to be 9 risks.
The reader should note at this stage that other conditions than Eq. 4 can be used to put a
restriction on the size of clusters. Some conditions might be that the sizes of the obtained clusters
may be equivalent or that the internal weights of each cluster may not be over a certain fixed
size.
The condition given in Eq. 4 was chosen here because of the direct need for a restriction on the
number of risks within any cluster, in order to facilitate for future management. Future research
works may include the study of other constraints for the problem.
This problem is not linear but we can make it easily linear thanks to the introduction of new
decision variables (equation 5) and new constraints (equation 6).
(5) ijkyKkkNijNii ,1,,1,,1, ≤≤∀≤≤∀≤≤∀ is a binary variable
We define yijk by adding the constraints:
(6) 1,1,,1,,1, −+≤≤≤∀≤≤∀≤≤∀ jkikijk xxyKkkNijNii
This forces yijk to be equal to 0 if xik and xjk are not both equal to 1, i.e. if Ri and Rj do not belong to
the same cluster. All other constraints are kept for problem formulation. Note that the objective
function can then be re-written thanks to these new decision variables, in equation 7.
(7) ∑∑∑= = =
=K
k
N
i
N
jijk jiRNMyINTRA
1 1 1
),(
In the end, OPL (Optimization Programming Language) can be used in order to solve this
problem. However, the complexity of it is high. The graph K-partitioning problems were proved to
be NP-hard (Garey and al., 1976), (Falkner and al., 1994), (Sima and Schaeffer, 2006), which
means that it is at least as hard as the hardest problems in NP. For all practical purposes, this
means there are currently no known polynomial-time algorithms which can give the exact
solutions of these problems. This remains true even if edge weights are one and the number of
partitions (or clusters) K is 2. This was notably underlined in this work since problems over 20-21

- 145 -
risks appeared to be critical (impossibility to give solution because of resolution time) when
testing them first.
The reader should note that if the number of partitions K is fixed and there is no restriction on
the size of the partitions, then the problem is solvable in polynomial time )(2KNO , where N is
the number of vertices in the graph (Goldschmidt and Hochbaum, 1994). However, this is not
interesting in the case of this work since clusters are built up for future management and
restriction on their size is thus needed.
But the objective of this study is to give a tool which can assist project risk management through
interactions-based risk clustering. It may not be worth the effort to find the best possible solution,
but a not-too-bad solution is very likely to suffice. That is why some less consuming iterative
algorithms can be written in order to approximate the optimal solution of the problem (see
VI.3.5).
VI.3.4VI.3.4VI.3.4VI.3.4 Discussing the invariance of the resultsDiscussing the invariance of the resultsDiscussing the invariance of the resultsDiscussing the invariance of the results
The reader should notice that the AHP-based evaluation of the risk interactions in terms of
possible precedence is an approximation. Indeed, the evaluation obtained is to some extent an
approximation of transition probabilities, which is obtained through local expert judgment (as
argued in (Chen and Lin, 2003). The clustering solution which is obtained is relevant since it is
based on the relative evaluation of transition probabilities. However, the issue of the robustness
and invariance of the clustering obtained is thus to be addressed. The problem which is studied
answers the following question.
Let P(i,j) be the real transition probability from Ri to Rj. Assuming that a transformation function
f exists and verifies P(i,j) = f (RNM(i,j)) as a first approximation, then one could wonder if the
clustering solution which is obtained varies when the coefficient vary from RNM(i,j) to P(i,j). Two
propositions are proved hereunder to give sufficient conditions on f so that the clustering solution
is invariant regarding this transformation of the coefficients.
Proposition a.Proposition a.Proposition a.Proposition a. The solution obtained does not vary when the RNM varies according to an
increasing linear function, which means that
• f is increasing
• )()()(,),(,),( 22 yfxfyxfyx µλµλµλ +=+ℜ∈∀ℜ∈∀
Proposition b.Proposition b.Proposition b.Proposition b. The solution obtained does not vary when the RNM varies according to a
function which respects the following conditions
• f is increasing
• 0)0( ≥f
• )()()(,),(,),( 22 yfxfyxfyx µλµλµλ +≥+ℜ∈∀Ζ∈∀

- 146 -
PROOF
Proposition a.Proposition a.Proposition a.Proposition a.
Let us suppose that the RNM varies according to an increasing linear function f and that the
optimal clustering solution of the initial problem is named S1. The new objective function when
performing the algorithm is
∑∑∑= = =
=K
k
N
i
N
jjkik jiRNMfxxNEWINTRA
1 1 1
)),((
Then, the following calculations can be performed
)()),((
)),((
)),((
1 1 1
1 1 1
1 1 1
INTRAfjiRNMxxf
jiRNMxxf
jiRNMfxxNEWINTRA
K
k
N
i
N
jjkik
K
k
N
i
N
jjkik
K
k
N
i
N
jjkik
==
=
=
∑∑∑
∑∑∑
∑∑∑
= = =
= = =
= = =
where INTRA is the objective function of the initial problem.
Knowing that S1 permits to reach the optimum of INTRA, knowing that f is increasing, this
proves that the clustering obtained in S1 is still the best solution which can be obtained despite
the variations of the RNM.
Proposition b.Proposition b.Proposition b.Proposition b.
Let us suppose that the RNM varies according to a function f which respects the conditions of
Proposition b and that the optimal clustering solution of the initial problem is named S1. The new
objective function when performing the algorithm is still
∑∑∑= = =
=K
k
N
i
N
jjkik jiRNMfxxNEWINTRA
1 1 1
)),((
Let S2 be another clustering solution for the initial problem. Let INTRA(S) be the value of the
objective function of the initial problem for a clustering solution S. We know that
)()( 12 SINTRASINTRA ≤
Let us now compare the two solutions S1 and S2 for the new problem.
0
)0(
)),(),((
)),()(((
)),(()()()(
1 11 1
1 1
1 121
21
21
21
≥≥
−=
−≥
−=−
∑∑∑∑∑∑
∑∑∑ ∑
∑∑∑ ∑
= == =
= =
= =
f
jiRNMxxjiRNMxxf
jiRNMxxxxf
jiRNMfxxxxSNEWINTRASNEWINTRA
N
i
N
j Sjkik
N
i
N
j Sjkik
Sjkik
N
i
N
j Sjkik
Sjkik
N
i
N
j Sjkik
which proves that the solution obtained in S1 remains the best solution here. End of proof.

- 147 -
The invariance of the results regarding these two transformations makes the results obtained
more robust, notably because of the interests of these conditions. For instance, the real transition
probabilities may notably be considered as a first approximation as a linear function f(x) = ax
with a>0, which means that f is increasing. Indeed, let RNM(io,jo) be the maximum value of the
RNM. Then, if one is able to assess P(io,jo), P(i,j) can be evaluated thanks to the transformation
),(),(
),(),(
00
00 jiRNMjiRNM
jiPjiP ×=
since the proportions between relative local judgements may be considered as approximations of
the proportions between real transition probabilities as a first approximation.
This transformation verifies the conditions of Proposition a, which means that the clustering
solution does not vary when performing it. In other terms, results of the clustering algorithms are
invariant if the values in the RNM vary according to relative uncertainties, and not according to
absolute uncertainties. This seems to some extent relevant since the construction of the RNM
values is partly based on relative evaluation of the values: proportional variations are thus more
likely to appear than different absolute variations. Other transformations and invariance
conditions might be studied in the future.
VI.3.5VI.3.5VI.3.5VI.3.5 Proposals of approximate iterative algorithmsProposals of approximate iterative algorithmsProposals of approximate iterative algorithmsProposals of approximate iterative algorithms
Two approximate iterative algorithms are proposed for study. Both of these algorithms are
iterative, but they use two different values for clustering conditions, as described in equations 8
and 9. The first iterative algorithm IA1 is based on the maximum value between separate
clusters. The second one IA2 is based on global interactions value between clusters. In the two
cases, these values are to be maximized at each step.
(8) ),(),( max,
1 jiRNMCCValueCjCi βα
βα∈∈
=
(9) ∑∈∈
+=βα
βαCjCi
ijRNMjiRNMCCValue,
2 ),(),(),(
At the initial step, all risks are isolated, i.e. every initial cluster is a singleton. The maximum
value is thus obtained for two isolated risks Ri0 and Rj0, which are grouped into a first cluster C1.
At each following step, the previous value (Value1 or Value2) is maximized. This procedure is
repeated iteratively until reaching a solution which respects all the constraints. In the case the
maximum size of a cluster is reached before the end of this procedure, the second maximum value
in the RNM is identified and the clustering operation is done on the corresponding interaction. It
can be proved easily that the possible conditions which are proposed in to assure the invariance of
the results when perturbing the RNM. These algorithms belong to the family of agglomerative
clustering algorithms (Schaeffer, 2007). They correspond to the pair-wise nearest neighbours
(PNN) method, and the merging criterion is based on the clustering measures which are given in

- 148 -
Eq. 8 and 9. The complexity of these algorithms is less high since it is )(NO and can even be
reduced, as shown by Fränti and al. (Fränti and al., 2006).
VI.3.6VI.3.6VI.3.6VI.3.6 Refining solutions through similarityRefining solutions through similarityRefining solutions through similarityRefining solutions through similarity----based clustbased clustbased clustbased clusteringeringeringering
Our goal here is to refine our results by identifying within clusters similar situations in terms of
causes and effects, i.e. the less distant risks. Many distances (i.e. similarity functions) can be
proposed in order to assess the proximity of two risks. To define them, we build up a symmetrical
matrix thanks to the initial RNM (weighted adjacency matrix), the Risk Interaction Matrix
(RIM), the i-jth term of which is given by
(10) 2
),(),(),(
ijRNMjiRNMjiRIM
+=
At this stage, note that any metric can be used in order to define this distance and indeed, many
have been used (Johnson, 1967), (Morrison, 1967), (Hartigan, 1975), (Fowlkes and Mallows,
1983). One could firstly think of using the traditional Euclidian distance (note that as the RIM is
symmetric, the Euclidian row distance is equal to the Euclidian column distance), defining
(11)
2
1
22 )),(),((∑=
−=∆=∆n
kjiij kjRIMkiRIM
However, as noted in (Hartigan, 1975), this distance has very poor properties. As for us, we claim
for the use of the Mahalanobis distance (Mahalanobis, 1936) given by the formula
(12) ijt
ijjiij SDD ℜℜ== − .. 122
where ijℜ is the 1×n vector, the k-th term of which is equal to [RIM(i,k)-RIM(j,k)], where ijt ℜ is
the transpose of ijℜ and where S-1 is the inverse of the variance-covariance matrix of the RIM.
The Mahalanobis distance corresponds to a weighted Euclidian distance (the weights being
determined by the covariance matrix). The use of this scale-invariant distance permits to penalise
the low cause and low effect project risks (which generate high values in the RIM), since their
corresponding columns and rows in the RIM are likely to be sources of high values in the
variance-covariance matrix S. The calculation of the Mahalanobis distance for each pair (i,j) gives
a distance matrix. We then use a classical average-linkage clustering algorithm (Murtagh, 1983)
to identify similar situations inside clusters. Such identifications of similar risks (in terms of
interactions) within the obtained clusters permit to give relevant information to the person in
charge of the management of the cluster. Indeed, two similar risks may be approached and
handled with similar managing techniques and/or even the same preventive/curative actions.
That is notably why this possible refinement thanks to the concept of project risk similarity
permits to generate finer approaches when managing project risks thanks to the set of obtained
interactions-based clusters.

- 149 -
VI.3.7VI.3.7VI.3.7VI.3.7 Looking at this issue through the eyes of the connectivity conceptLooking at this issue through the eyes of the connectivity conceptLooking at this issue through the eyes of the connectivity conceptLooking at this issue through the eyes of the connectivity concept
It was noted before that the linear programming problem was NP-hard. Therefore restrictions
appear on the sizes of the problem if one wants to obtain the optimal solution. In order to permit
the analysis of larger problems and obtain still the exact solution of the problem, we suggest to
use the concept of graph connectivity and connected components (Biggs and al. 1986), (Bang-
Jensen and Gutin, 2007). This concept permits to isolate unconnected sub-graphs (which means
no existing path can connect them), as shown on Figure 63.
Figure 62. Digraph with two connected components
The following lemma can be proven.
LemmaLemmaLemmaLemma
Looking for the optimal solution of the problem of the entire digraph is equivalent to looking for
the optimal solutions of the problem for the subgraphs which are its connected components.
PROOF
This lemma can be proven by recurrence on C the number of connected components of the graph.
Initialisation
C = 1 is trivial. Let us explore the C=2 case.
Let C1 = (V1,E1) and C2 = (V2,E2) the two connected components of the graph G = (V,E). We have in
essence 21 EEE ∪= , 21 VVV ∪= , ∅=∩ 21 EE and ∅=∩ 21 VV .
The objective function which is to be maximized is
)),(),(),((
)),((
212
22
1 ),(),(1 ),(
1 1 1
∑∑∑ ∑
∑∑∑
×∈∈= ∈
= = =
++=
=
VVjijkik
Vjijkik
K
k Vjijkik
K
k
N
i
N
jjkik
jiRNMxxjiRNMxxjiRNMxx
jiRNMxxINTRA
But when Ri and Rj do not belong to the same connected component, they are not connected,
which means that RNM(i,j) = 0. As a consequence,

- 150 -
∑∑ ∑∈= ∈
+=2
22
1 ),(1 ),(
)),(),((Vji
jkik
K
k Vjijkik jiRNMxxjiRNMxxINTRA
The two parts of this sum are mutually independent, which means that maximizing the whole
function means maximizing the two parts of this sum. This exactly corresponds to the initial
problem applied to the two connected components of the initial graph.
Iterations
Let us suppose the lemma is proven for C. Proving it for C+1 based on the same calculations as
for the case C=2, with two subgraphs, one with C connected components, and one with 1.
The lemma is thus finally proved by recurrence. End of proof.
For all practical purposes, this permits to try to address larger problems since the size limitation
becomes the maximum connected component size.
VI.3.8VI.3.8VI.3.8VI.3.8 Proposing performance measures for these algorithmsProposing performance measures for these algorithmsProposing performance measures for these algorithmsProposing performance measures for these algorithms
In order to compare different possible clustering alternatives, some performance indicators are
needed. Given a problem with N risks and different possible clustering solutions, the first two
indicators proposed in this work are:
• MPT = Mean Processing Time, which is the mean time to obtain the solution of the
problem, functions of the methodology which is used. Note that drawing profiles MPT(N)
for each methodology gives precious information in order to choose the methodology which
is to be used for a given problem and situation.
• )(
)()(),(
AINTRA
BINTRAAINTRABAINTRA
−=∇ , where A and B are two possible clustering
solutions and INTRA is the value of the intra-cluster global interactions value which is
obtained. 0),( ≥∇ BAINTRA if the clustering solution obtained thanks to the A method
is better than the one obtained with the B method. ),( BAINTRA∇ thus gives the user an
idea of the relative improvement or degradation between two possible solutions.
Moreover, given a possible solution thanks to a method, a K × N matrix (Mki), so that Mki=1 if risk
Ri belongs to cluster Ck in the final solution can be built. If T(Mki) is the transpose of this matrix,
then:
• H=(Mki).T(Mki) is a K × K matrix, the diagonal terms of which correspond to the number of
risks which are clustered in cluster K. MCS = Mean Cluster Size is then the average of
the diagonal values of this matrix. This value can be taken into account in order to judge
of the efficiency of the method used.
• L=T(Mki).(Mki) is a N × N matrix, the i-jth term of which is equal to 1 if Ri and Rj belong to
a same cluster. As a consequence, the calculation of ),( BAM∇ which is the difference of

- 151 -
the two matrices L(A) and L(B), obtained thanks to methods A and B, permits to identify
the similarity between two clustering solutions. Indeed, ),( BAM∇ is a N × N matrix, the
elements of which are equal to 0 if and only if they face a same situation in the two
clustering solutions (i.e., if and only if, they belong to a same cluster in A and B, or are not
paired on the contrary). Let N0 be the number of non-zero values in the ),( BAM∇
matrix. We propose the following indicator (equation 10) as a dissimilarity measure when
comparing two clustering solutions. Note that mean cluster size is to be taken into
account, since, if given a clustering solution, if one risk Ri is taken out of the cluster it
belongs to, then MCS non-zero values are likely to appear (mean value) in the
dissimilarity matrix for this risk Ri.
(13)
)2
)()((
),(2
0
BMCSAMCSN
NBA +×
=∇
VI.4.VI.4.VI.4.VI.4. Case studCase studCase studCase studiesiesiesies
VI.4.1.VI.4.1.VI.4.1.VI.4.1. AAAA stage musicalstage musicalstage musicalstage musical production projectproduction projectproduction projectproduction project
VI.4.1.iVI.4.1.iVI.4.1.iVI.4.1.i IntroductionIntroductionIntroductionIntroduction
A first case study in the entertainment industry is carried out to test the validity of our approach
and the confidence of the users in the result.
The chosen project is the production of a family stage musical in Paris. The project notably
encompasses stage, costume, set, lightning and sound design, casting management, rehearsal
management, fund raising and overall project management support activities, etc…
Staging duration target is 9 months at least. Target audience is family members aged 5 years old
and more. Project duration is 6 months before staging. Project team is made of 6 permanent
employees. Creative team is made of 7 people (lyricist/librettist, composer, director and
choreographer, stage designer, light designer, costume designer, sound engineer).
The show is performed by a cast of 18 people, on the principle of alternating roles (9 on stage
simultaneously). Overall budget is around 60000 € with salaries on a profit-share basis for cast
and creatives, including an evaluation of the payment of the theatre for the whole staging period.
Two financial investors and one media partner assist the project. The case study we present here
is based on fieldwork and discussions which were conducted with 1 cast member, 2 creatives, and
1 production team member.
A list of 20 macroscopic risks was identified to perform the study. Traditional project risk
management methodologies were applied for the identification and analysis process. This
permitted to obtain a classification by nature and by value of the risks. An excerpt of this risk list
is given in Figure 64.

- 152 -
Number Risk name Nature Criticality Potential consequences Probability Impact P*I
1 Low budget Cost & time Unacceptable2, 3, 4, 8, 10, 11, 12, 13, 14,
16, 178 7 56
2 Law and regulations infractions Contracts Unacceptable 4, 8, 10, 17 7 5 35
3Low communication and advertising for the show
User / Customer Unacceptable 7, 10, 15, 17 8 9 72
4 Unsuitable cast Organization Unacceptable 8, 10, 13, 15, 17 5 9 45
5 Unsuitable ticket price setting Strategy Unacceptable 1, 10, 15, 17 7 6 42
6 Unsuitable rehearsal management Controlling Acceptable 10, 17 3 8 24
7 Cancellation or delay of the first performance Cost & time Unacceptable 8, 10, 15, 17 5 8 40
8 Poor reputation User / Customer Acceptable 3, 7, 10, 17 3 7 21
9 Lack of production teams organisation Organization Acceptable 3, 7, 10, 15, 17 4 6 24
10 Low team communication Organization Acceptable 6, 8, 13, 17 3 6 18
11 Bad scenic, lightning and sound design Technical performance Neglectible 7, 8, 15, 17 2 7 14
12 Bad costume design Technical performance Acceptable 7, 8, 15, 17 3 8 24
Figure 63. Extract from the initial project risk li st
VI.4.1.iiVI.4.1.iiVI.4.1.iiVI.4.1.ii Results and discussionResults and discussionResults and discussionResults and discussionssss
The case study involves a list of 20 macro-risks. Initially, there were more risks but some were
finally gathered under a common denomination. The construction process of the RSM was
followed to identify project risk interactions. In the end, the risk graph was very connected, with a
density of nearly 55%. In order to perform the case study, it was chosen to keep the values which
represented 80% of the total values of interactions in the RNM (these ones represented about 35%
to 40% of the values of the graph). The RNM of this problem is given hereunder in Figure 65.
1 2 3 4 5 6 7 8 9 10 11 12 13 14 15 16 17 18 19 201 0,000 0,000 0,000 0,000 0,770 0,000 0,000 0,000 0,000 0,000 0,000 0,000 0,000 0,000 0,159 0,000 0,000 0,000 0,000 0,0002 0,410 0,000 0,000 0,000 0,000 0,000 0,000 0,000 0,000 0,000 0,000 0,000 0,000 0,000 0,000 0,000 0,000 0,000 0,000 0,0003 0,243 0,000 0,000 0,000 0,000 0,000 0,000 0,137 0,391 0,000 0,000 0,000 0,000 0,000 0,000 0,000 0,000 0,000 0,000 0,0004 0,164 0,337 0,000 0,000 0,000 0,000 0,000 0,000 0,000 0,000 0,000 0,000 0,000 0,000 0,000 0,000 0,000 0,000 0,000 0,0005 0,000 0,000 0,000 0,000 0,000 0,000 0,000 0,000 0,000 0,000 0,000 0,000 0,000 0,000 0,000 0,000 0,000 0,000 0,000 0,0006 0,000 0,000 0,000 0,000 0,000 0,000 0,000 0,000 0,000 0,471 0,000 0,000 0,000 0,000 0,000 0,000 0,000 0,000 0,372 0,1157 0,000 0,000 0,000 0,000 0,000 0,000 0,000 0,000 0,197 0,000 0,327 0,346 0,000 0,000 0,000 0,139 0,000 0,000 0,000 0,0008 0,000 0,311 0,000 0,000 0,000 0,000 0,287 0,000 0,000 0,000 0,000 0,000 0,000 0,000 0,193 0,000 0,000 0,000 0,000 0,0009 0,000 0,000 0,000 0,000 0,000 0,000 0,000 0,000 0,000 0,000 0,000 0,000 0,000 0,000 0,000 0,000 0,000 0,000 0,000 0,000
10 0,000 0,153 0,118 0,217 0,106 0,301 0,183 0,000 0,129 0,000 0,000 0,000 0,000 0,000 0,000 0,000 0,108 0,000 0,000 0,00011 0,415 0,000 0,000 0,000 0,000 0,000 0,000 0,000 0,000 0,000 0,000 0,000 0,000 0,129 0,000 0,000 0,000 0,000 0,000 0,00012 0,415 0,000 0,000 0,000 0,000 0,000 0,000 0,000 0,000 0,000 0,000 0,000 0,000 0,129 0,000 0,000 0,000 0,000 0,000 0,00013 0,000 0,000 0,000 0,173 0,000 0,000 0,000 0,000 0,000 0,394 0,000 0,000 0,000 0,000 0,000 0,000 0,175 0,000 0,154 0,00014 0,106 0,000 0,000 0,000 0,000 0,000 0,000 0,000 0,000 0,000 0,000 0,000 0,000 0,000 0,000 0,000 0,000 0,000 0,000 0,20315 0,000 0,000 0,000 0,000 0,082 0,000 0,102 0,000 0,000 0,000 0,000 0,000 0,311 0,157 0,000 0,000 0,000 0,184 0,000 0,00016 0,164 0,000 0,000 0,000 0,000 0,000 0,000 0,000 0,000 0,000 0,000 0,000 0,000 0,000 0,000 0,000 0,000 0,000 0,000 0,00017 0,000 0,186 0,116 0,000 0,000 0,000 0,159 0,000 0,170 0,146 0,000 0,000 0,252 0,000 0,000 0,000 0,000 0,000 0,000 0,00018 0,000 0,000 0,000 0,000 0,000 0,000 0,000 0,000 0,000 0,000 0,000 0,000 0,000 0,000 0,000 0,000 0,000 0,000 0,000 0,35219 0,000 0,000 0,000 0,000 0,000 0,000 0,000 0,000 0,000 0,000 0,000 0,000 0,000 0,000 0,000 0,000 0,000 0,000 0,000 0,00020 0,000 0,000 0,000 0,000 0,000 0,000 0,000 0,000 0,000 0,000 0,000 0,000 0,000 0,000 0,000 0,000 0,000 0,000 0,000 0,000
Figure 64. RNM of the problem

- 153 -
Propagation phenomena were then analysed thanks to the identification of existing loops and a
clearer analysis of propagation phenomena within the risk network thanks to the RSM and RNM.
Indeed, some propagation curves are first to be drawn in order to understand the possible
implications of the occurrence of a given risk. An example is given on Figure 66 for Risk 6, which
is the macroscopic risk “bad rehearsal management”.
Figure Figure Figure Figure 65656565. Possible propagation of risk R6 within the project risk network. Possible propagation of risk R6 within the project risk network. Possible propagation of risk R6 within the project risk network. Possible propagation of risk R6 within the project risk network
Thanks to the powers of the RSM, this figure can be drawn. ASP and MSP can be calculated. In
this case, MSP is 4.071 and ASP is 3.933. The proportion α of risks which cannot be reached by a
path (of any length) from R6 is 25%. This percentage expresses that a great majority of risks are
possible consequences of R6 over time, but the first level consequences (5%) and second level
consequences (15%) appear to be very limited. Such indicators (α, β, MSP, ASP, first level
consequences ratio, second level consequences ratio,…) are thus to be calculated in order to
permit the effective comparison of project risks in terms of propagation possibilities.
Therefore, it is suggested to build up a global table which permits to address the issue of risk
comparison regarding propagation given these indicators. In that case, here are the results of the
risk propagation analysis (see Figure 67).
Such a table permits to give some insights on propagation phenomena. For instance, risk R5 can
be stressed as a risk which may have many consequences in the project risk network (70% of first
level and second level consequences). Risks R5 and R9 appear as origin risks since no path can
lead to them. Risk R10 appears to be a node which may be at the confluent of many propagation

- 154 -
chains. Indeed, 25% of the existing risks appear as first or second level consequences and 85% of
the existing risks appear as possible origins for the occurrence of R10. Finally risks R6 and R10
appear to be involved in second order loops (minimal ones in), which means particular attention
should be paid to a possible self-aggravation of the effects of these risks if occurring.
Figure 66. Propagation comparative analysis of project risks
After this direct use of the RSM and RNM, the three interactions-based presented algorithms
were processed. Their results can be seen next page in Figure 68. They only represent two graphs,
since the second iterative algorithm (IA2) gave the same result as the linear programming (LP)
algorithm. In this figure, they are compared to the two classical clustering results (by nature and
value). The reader can also notably note that these results were refined. Indeed, the two risks R11
and R12 were analysed as very similar thanks to the Mahalanobis distance-based clustering
method we use. The person in charge of the corresponding cluster should then think of handling
these two risks with similar approaches (or at least be aware of the similarity of these risks inside
the cluster).
In the end, interesting similarities and differences must be noted between the results which are
obtained. As shown after in Figure 69 (synthetic indicators), it must be noted that interactions-
based clustering give here much more efficient results in terms of interactions values within
clusters, as expressed by the values of INTRA∇ . The linear programming solving by OPL and
the iterative algorithms which are used indeed give very interesting results and perspectives for
project risk management since in all cases, more than 70% of the interactions values are kept
inside the obtained risk clusters (nearly 5 times best than by nature, and 2 times best than by
values). This appears all the more interesting than each cluster can then be dispatched to one
project team member. In the end, coordination is facilitated in the project management risk
process since interfaces are considerably reduced.
Moreover, in that case, the second iterative algorithm (IA2) and the linear programming solving
give the same result, which underlines the possible efficiency of IA2. The first iterative algorithm
gives us a slightly different result in terms of risks regrouping and intra-cluster interactions
value.

- 155 -
Figure Figure Figure Figure 67676767. Results of the clustering algorithms. Results of the clustering algorithms. Results of the clustering algorithms. Results of the clustering algorithms

- 156 -
Intra MPT MCS Intra %
Clustering by nature 1,586 0 min 2,5 14,0%
Clustering by value 4,361 0 min 6,67 38,4%
Clustering by interactions PL 8,376 40 min 5 73,7%
Clustering by interactions AI 1 8,247 15 min 6,67 72,6%
Clustering by interactions AI 2 8,376 18 min 5 73,7%
CPN CPV CPIPL CPIAI1 CPIAI2
Clustering by nature 0,0% -175,0% -428,1% -420,0% -428,1%
Clustering by value 63,6% 0,0% -47,9% -89,1% -92,1%
Clustering by interactions PL 81,1% 47,9% 0,0% 1,5% 0,0%
Clustering by interactions AI 1 80,8% 47,1% -1,6% 0,0% -1,6%
Clustering by interactions AI 2 81,1% 47,9% 0,0% 1,5% 0,0%
CPN CPV CPIPL CPIAI1 CPIAI2
Clustering by nature 0,000 0,355 0,087 0,345 0,087
Clustering by value 0,355 0,000 0,072 0,400 0,072
Clustering by interactions PL 0,087 0,072 0,000 0,039 0,000
Clustering by interactions AI 1 0,345 0,400 0,039 0,000 0,039
Clustering by interactions AI 2 0,087 0,072 0,000 0,039 0,000
),( BAINTRA∇
),( BAM∇
Figure 68. Performance of the clustering methods – First case study
The issue of the clustering methodology performance compared in terms of resolution time is thus
to be addressed, since results do not differ much, whereas MPT can vary of around 275%. In order
to address this specific point and to validate even more this overall approach, new tests are to be
carried out on several projects. Another case study was notably carried out on a large
infrastructure project.

- 157 -
VI.4.2.VI.4.2.VI.4.2.VI.4.2. The The The The case ofcase ofcase ofcase of a large infrastructure projecta large infrastructure projecta large infrastructure projecta large infrastructure project
VI.4.2.iVI.4.2.iVI.4.2.iVI.4.2.i IntroductionIntroductionIntroductionIntroduction
The following case is the case of a large infrastructure project, which consists in the building of all
the infrastructure and system which is dedicated to the future tramway of a 750 000 inhabitants
city in a country C in the world by a French company.
This notably comprises:
• The construction of a depot to stock trains and execute their control and maintenance
• The installation of tracks throughout the city (the survey of which includes many
changes in altitude)
• The construction of the corresponding trains.
• The establishment of a traffic signalling system, which gives priority to the tramway
in order to assure a performance level in terms of future travel time. This point
implies a particularly high level of complexity from the interconnected traffic
signalling systems in the city.
An industrial partner realises the civil work which is to permit the installation of the tramway.
The project was initialized by the government of country C in 1995. The first selections of the
firms which would execute the project occurred in 1999. The project contract was signed in 2002.
After negotiations with banks, the government and the future operator (in which the French firm
which executes the project holds shares), the final concession contract was signed in 2004. The
project started in February 2005, with a practical start of the execution in 2006.Until now, a
project risk management process has been carried out and led to the existence of 8 lists of risks
which nurtured the successive risk reviews. We focus here on the System product line, which
considers the integration of all the aspects of the project, and is thus to be one of the most
complex ones, which motivated us to work on it with the firm. The corresponding risk list (42
risks) we have been working on can be seen afterwards on Figure 70. The 42 risks which are
present in the list are very diverse and are classified according to six risk classes (risk nature).
Risk ownership in terms of responsibility is dispatched to 12 actors in the project.
Actually, risk management presently receives moderate attention within the firm and the
following issues are to be underlined:
• Risk lists are elaborated since they are to be done, but no real attention is paid to
them and they are not used as much as they could be. Risk management is still too
often considered as an academic work which in not necessary for day-to-day project
management.
• Risk owners (in terms of responsibility) may sometimes be defined too quickly, since
the examination of this list underlines that some ownerships should be rearranged.
Indeed, risk owners belong to very varied hierarchical levels in the firm structure, and
some risk owners are responsible for one risk while other ones are responsible for
more than ten.

- 158 -
We hoped that our works though the consideration of risk interactions would create more
inclination and confidence with the use of risk management approaches in the case of this project
thanks to the underlining of neglected risks and risk interactions. The first remark is that when
performing the study thanks to the iterative process of risk interaction identification, new risks
appeared (since they were consequences / causes of some which were present in the initial list, or
since they were seen as compulsory intermediary risks to explain the link between two risks
which were present in the initial list). As a whole, 13 risks were newly identified for a lack of
their presence in the list appeared (see Figure 71), which represents an increase of nearly 31% in
the number of identified risk. Finally, 6 of the risks which were present in the initial list (R1, R8,
R11, R15, R23, R34) were considered as poorly defined or possibly negligible.
Review Session RS8
RISK IDENTIFICATIONPRODUCT
LINERISK OWNER
QU
ALI
TY
- S
CO
PE
DE
LIV
ER
Y (
in m
onth
s)
CLASS
IND
IVID
UA
L
CO
MM
ON
1 Safety studies SYS Actor A 0 Technical2 Liquidated damages on intermadiate milestone and delay of Progress Payment Threshold SYS Actor B 0 Contractual3 vehicle storage due to depot delay SYS Actor A 0 0 Contractual4 Vandalism on site SYS Actor C 0 0 Contractual5 Traction/braking function : behaviour in degraded mode on slope SYS Actor A 0 Technical6 Local laws and regulations SYS Actor A 0 Contractual7 Traffic signalling, priority at intersections SYS Actor D 0 0 Contractual8 Unclear Interface with the Client, for Infra eqt SYS Actor E 0 Contractual9 Delays due to client late decisions SYS Actor E 0 Contractual10 Travel Time performance SYS Actor D 0 0 Technical11 Limited Force majeure definition SYS Actor B 0 Contractual12 Operating certificate SYS Actor B 0 0 Contractual13 Reliability & availability targets SYS Actor D 0 0 Technical14 Permits & authorisations SYS Actor B 0 Contractual15 Insurance deductibles SYS Actor F 0 0 Financial16 Archeological findings SYS Actor B 0 Contractual17 Discrepancies Client / Operator / Concessionaire SYS Actor G 0 0 Contractual18 CW delay & continuity SYS Actor H 0 Contractual19 Responsibility of client on CW delay SYS Actor B 0 Contractual20 On board CCTV scope SYS Actor I 0 Technical21 Noise & vibration attenuation SYS Actor D 0 0 Technical22 Potential risks of claim from CW partner SYS Actor B 0 0 Contractual23 Harmonics level SYS Actor D 0 Technical24 Non compliance contractual Rolling Stock SYS Actor A 0 Technical25 Non compliance technical specs Rolling Stock SYS Actor A 0 Contractual26 Exchange risk on suppliers SYS Actor F 0 Financial27 Track installation equipment performance SYS Actor J 0 Client/Partner/Sub-contractor28 Tax risk on onshore SYS Actor F 0 0 Financial29 more poles SYS Actor D 0 0 Contractual30 Security requirements SYS Actor E 0 0 Technical31 Track insulation SYS Actor K 0 Technical32 Delay for energising SYS Actor D 0 0 Project Management, Construction site
33 Fare collection requirements SYS Actor G 0 0 Contractual34 Construction safety interfaces SYS Actor C 0 Technical35 Electromagnetic interferences SYS Actor E 0 0 Technical36 Exchange risk SYS Actor F 0 Financial37 Risk of partial rejection of our request for EOT SYS Actor B 0 0 Contractual38 Interface rail / wheel SYS Actor E 0 Technical39 Risk on Certification of our equipement SYS Actor L 0 0 Country40 OCS installation SYS Actor C 0 0 Project Management, Construction site
41 Banks stop financing the project SYS Actor B 0 0 Contractual42 Costs of modifications not covered by EOT agreement SYS 0 0 Contractual
IMPACTED
CommonCommonCommonCommonCommonCommonCommonCommonCommonCommonCommonCommonCommonCommonCommonCommonCommonCommonCommonCommonCommonCommonCommonCommonCommonCommonCommonCommonCommonCommonCommonCommonCommonCommonCommon
IndividualIndividualIndividual
CommonCommonCommonIndividual
Figure Figure Figure Figure 69696969. Initial risk list of. Initial risk list of. Initial risk list of. Initial risk list of the the the the System product line of the System product line of the System product line of the System product line of the projectprojectprojectproject

- 159 -
NEW RISKS N°Return profit 43Extra trains 44Pedestrian zones 45Tra in performance 46Waiting time at stations 47Depot delay 48Survey 49Ticketing design delays 50Track installation 51Reengineering / Redesign 52Slabs pouring 53Ini tia l specifications of CW 54Available cash flow 55
Figure 70Figure 70Figure 70Figure 70. Newly identified risk thanks to the risk interaction identification process. Newly identified risk thanks to the risk interaction identification process. Newly identified risk thanks to the risk interaction identification process. Newly identified risk thanks to the risk interaction identification process
The identification of the existing risk interactions was thus performed and a direct evaluation on
a 10 level Likert scale of the strength of interactions was executed. The feedback is that there
were some difficulties while performing this step since:
• This step is to require the participation of several experts of the project for it implies a
very wide view of the project elements and stakes.
• Some bias may be included in the evaluation of interactions since, even when trying not to
do so, it appears that interactions are often thought at a first sight in terms of impact and
not in terms of precedence. Great attention should thus be paid to that point in order to
analyse the results.
In the end, a global Risk Numerical Matrix for the studied risk network was obtained. Compared
to the musical staging project, this one’s density was much lower and no feedback loops were
present in it after the project risk interactions identification and evaluation steps. The
corresponding RNM (on a 0 to 10 Likert scale) can be seen next page on Figure 72.
Even when separating in its connected components, the LP-problem was too large to be solved by
OPL. The use of heuristics was thus necessary. The clustering iterative algorithm IA2 (which, on
several tests, seems always better than IA1) was performed to obtain a first good approximate
result for the clustering operation.
Before discussing the results, we must insist on a practical point when performing this iterative
algorithm. Here, the values in the RNM are integer values, contrary to the ones of the former case
study which had been obtained thanks to the AHP-based pair-wise comparisons. At some stage of
the algorithm, some problems arise since equalities can be obtained and choices must be done
between these equal maximum values inside the RNM. Operational tests seem to show that the
final result is likely to depend on the order one decides to perform the clustering of these equal
situations. In our case, the choice was performed thanks to a second criteria, which was that, in
case of equality, then the clustering which was performed was the one which had the minimum
interactions with the other risks or existing clusters.

- 160 -
1 2 3 4 5 6 7 8 9 10 11 12 13 14 15 16 17 18 19 20 21 22 23 24 25 26 27 28 29 30 31 32 33 34 35 36 37 38 39 40 41 42 43 44 45 46 47 48 49 50 51 52 53 54 551 12 2 3 5 8 6 8 3 10 10 5 10 3 5 3 5 3 33 3 14 45 5 56 67 8 78 89 9 10
10 8 10 5 1 1011 1112 8 6 12 8 1 3 1 1 313 8 13 114 3 1415 1516 1617 17 1018 7 18 1019 1920 2021 2122 22 1 1023 2324 2425 25 326 2627 2728 2829 29 130 7 3031 3132 1 3233 3334 3435 3 3536 3637 3 10 3738 1 3839 1 3 3940 3 4041 1 4142 3 4243 8 3 10 7 3 5 5 3 8 7 43 6 6 344 10 4445 4546 5 4647 4748 3 4849 4950 1 1 5051 1 3 1 5152 5 3 7 5 1 52 353 3 1 5354 5455 8 3 1 3 1 10 1 3 55
Figure 71Figure 71Figure 71Figure 71. The RNM of the project. The RNM of the project. The RNM of the project. The RNM of the project
VI.4.2.iiVI.4.2.iiVI.4.2.iiVI.4.2.ii Results and discussionsResults and discussionsResults and discussionsResults and discussions
As a whole, the clustering algorithm IA2 was performed and the following clusters were obtained
(Figure 73 and Figure 74). Several commentaries are to be performed:
• Some risks appear to be high accumulation risks, notably the budget related ones in
terms of return profit (R43) or risk of rejection of extension of time EOT (R37) and
liquidates damages (R2) (which can be seen visually on Figure 74 with two horizontal
flows towards these risks). These ones are to be considerably watched over since many
paths in the risk network are likely to lead to them. Same observation can also be
made for travel time performance (R10).
• The obtained clusters seem to be quite consistent with the fieldwork as they form
groups of risks which seem to be relevant in order to assist project risk management.
Cluster C3 and C4 for instance permit to group possible chain reactions which could
imply delay (respectively for the permits and authorizations, and for the depot
construction and track installation). This appears to be all the more interesting than
such chain reactions were not highlighted and managed before during the project. For
instance, there were no discussions between Actor A and Actor E regarding the link
between R3 (Vehicle storage due to depot delay) and R32 (Delay for energising),
whereas this interface should have been particularly highlighted retrospectively.
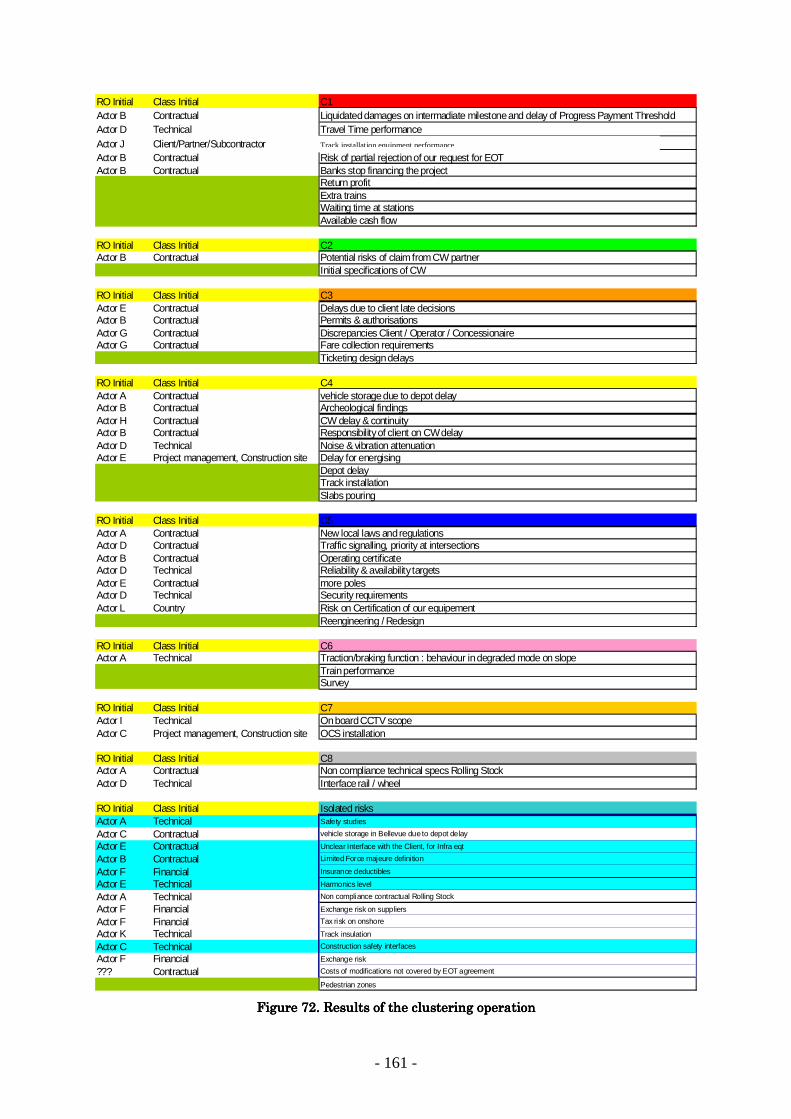
- 161 -
RO Initial Class Initial C1Actor B Contractual Liquidated damages on intermadiate milestone and delay of Progress Payment ThresholdActor D Technical Travel Time performanceActor J Client/Partner/Subcontractor Appitrack performanceActor B Contractual Risk of partial rejection of our request for EOTActor B Contractual Banks stop financing the project
Return profitExtra trainsWaiting time at stationsAvailable cash flow
RO Initial Class Initial C2Actor B Contractual Potential risks of claim from CW partner
Initial specifications of CW
RO Initial Class Initial C3Actor E Contractual Delays due to client late decisionsActor B Contractual Permits & authorisationsActor G Contractual Discrepancies Client / Operator / ConcessionaireActor G Contractual Fare collection requirements
Ticketing design delays
RO Initial Class Initial C4Actor A Contractual vehicle storage due to depot delayActor B Contractual Archeological findingsActor H Contractual CW delay & continuityActor B Contractual Responsibility of client on CW delayActor D Technical Noise & vibration attenuationActor E Project management, Construction site Delay for energising
Depot delayTrack installationSlabs pouring
RO Initial Class Initial C5Actor A Contractual New local laws and regulationsActor D Contractual Traffic signalling, priority at intersectionsActor B Contractual Operating certificateActor D Technical Reliability & availability targetsActor E Contractual more polesActor D Technical Security requirementsActor L Country Risk on Certification of our equipement
Reengineering / Redesign
RO Initial Class Initial C6Actor A Technical Traction/braking function : behaviour in degraded mode on slope
Train performanceSurvey
RO Initial Class Initial C7Actor I Technical On board CCTV scopeActor C Project management, Construction site OCS installation
RO Initial Class Initial C8Actor A Contractual Non compliance technical specs Rolling StockActor D Technical Interface rail / wheel
RO Initial Class Initial Isolated risksActor A Technical Safety studies
Actor C Contractual vehicle storage in Bellevue due to depot delay
Actor E Contractual Unclear Interface with the Client, for Infra eqt
Actor B Contractual Limited Force majeure definition
Actor F Financial Insurance deductibles
Actor E Technical Harmonics level
Actor A Technical Non compliance contractual Rolling Stock
Actor F Financial Exchange risk on suppliers
Actor F Financial Tax risk on onshore
Actor K Technical Track insulation
Actor C Technical Construction safety interfaces
Actor F Financial Exchange risk
??? Contractual Costs of modifications not covered by EOT agreement
Pedestrian zones
Figure 72Figure 72Figure 72Figure 72. Results of the clusterin. Results of the clusterin. Results of the clusterin. Results of the clustering operationg operationg operationg operation
Track installation equipment performance

- 162 -
Figure 73Figure 73Figure 73Figure 73. Clustered pr. Clustered pr. Clustered pr. Clustered project risk networkoject risk networkoject risk networkoject risk network

- 163 -
• One commentary is that cluster C1 should however perhaps be separated into two
parts by regrouping all financial risks in a sub-cluster. This appears all the more
relevant than these financial risks are also linked to many other risks which exist in
other clusters. Therefore, managing them as a complete cluster could for sure be very
interesting.
• Another issue which arises is the question of risk ownerships. Indeed, it appears that
within clusters, there are numerous risk owners, and often numerous risk classes.
One question which is to be addressed is how such highlighted interfaces can be
managed and how coordination can be facilitated since there seems to be some benefit
to discuss with all the impact actors (risk owners) of a same cluster. One thing which
was suggested is that a meeting with all the impacted risk owners of a cluster could
permit to nominate / vote for a responsible for the cluster who could facilitate the
coordination between the interrelated risks. One of the possible nominees for this
cluster responsibility could be the least common boss in the hierarchical structure of
the project.
• Moreover, new constraints might be added to perform more clustering solutions. For
instance, new tests are to be conducted by varying the maximum possible size of a
cluster. Another constraint which could be added would also be to add a maximum
number of different risk owners within a cluster.
• As a whole, the feedback with this case study is that in order to obtain helpful results
thanks to this methodology would be in the end to:
o Perform pertinent risk identification and risk interactions identification and
evaluation processes (in group) in order to obtain a good description of the
situation and to have a same hierarchical level in the risk structure to study
same level risks in the chain reactions.
o Identify carefully during the initial step the correct risk owners, i.e. the actors
which seems initially the most appropriate ones to hold the responsibility for
each risk.
o Perform the clustering operation thanks to the iterative algorithms or with
OPL on the LP problem if processing time can be improved thanks to some
operations.
o Analyse the obtained results and identify possible chain reactions, possible
accumulation risks and the actors which are to be responsible for each risk
cluster in order to facilitate the global coordination of the project risk
management process.

- 164 -
VI.5.VI.5.VI.5.VI.5. Conclusions and perspectivesConclusions and perspectivesConclusions and perspectivesConclusions and perspectives
As a whole, this chapter presents innovative tools based on the integration of risk interactions in
the processes of risk analysis and risk clustering for efficient project risk management. This is all
the more important since some works in the literature show that, in the context of decision-
making within some specific environments, project managers tend to deny, avoid, ignore and/or
delay dealing with risks (Kutsch and Hall, 2005). For all practical purposes, the gap between
expected and real risk management implementation is significant. As shown by the case studies,
the tools which are proposed here permit greater communication on project risks and better
confidence in risk management activities thanks to two aspects at least.
• First, the evaluation of risk interactions which is performed when building up the RNM
implies a two-step process (looking in terms of causes, and then of consequences).
Information can thus be checked and refined since one interaction should be listed twice
(from cause to effect, and from effect to cause): this checking process permits a better
confidence in risk identification and risk interaction identification. Even if theory is
sometimes difficult to implement in real projects, we argue that the theoretical
background of our models can easily be implemented and understood at a reasonable
level. The fact that it relies on expert judgements, mainly qualitative, makes it a user-
friendly and easily computable tool. The first case study indeed proved that, even in
project contexts which are not used to working with tools issued from design engineering
and industrial engineering theories, the whole approach is globally understood.
• Moreover, clustering risks in order to maximize intra-cluster global interactions value
permits to facilitate the coordination of risk monitoring and controlling activities, as it
underlines the need for cooperation and transversal communication within the project
team. It permits greater communication between people, since it does not seek the
identification ownership, responsibility and/or accountability, but the identification of risk
interdependencies. After the clustering process, coordination is made by the person who is
assigned to the cluster, but communication has been facilitated before, meaning we have
less defensive phenomena.
However, this implies that a shift should be operated in the skills of project risk managers (or at
least the team members who are in charge of the management of the obtained clusters). Such
project team members should indeed be able to facilitate communication and to show great
adaptability since they need to manage risks which are to be of different nature.
As a whole, this chapter permits to make a comparison between several possibilities for grouping
risks in a project. Our aim is not to criticize the use of classical approaches: on the contrary, we
refer to them as points of comparison and claim for the use of conjoint classifications which can
all give powerful insights on reality. Our initial objective in this chapter was the improvement of
coordination through the better recognition and handling of risks interactions. The research
works and case studies have shown possible significant improvements regarding this specific

- 165 -
objective. They also underline the need for a shift in the way project risk management should be
approached. In the end, complexity-related possible effects can be caught more easily and as a
consequence managed more effectively and efficiently. Project coordination is undoubtedly
facilitated with this approach since interface problems are considerably reduced (for inter-clusters
links global value is lowered). This new approach is thus a complementary one to traditional
project risk management techniques.
Lots of aspects of this work and its results may however be discussed. We thus identify several
research perspectives to consolidate this approach.
• Challenging the definition of risk interaction and trying to integrate other risk
characteristics (than probabilities and precedence relationship) into the definition of risk
interactions. For instance, one could say that a possible interaction between two risks Ri
and Rj is that if Ri occurs, then the impact of Rj on the project system is higher, even if its
occurrence probability remains the same. In other terms, when occurring, Ri is likely to
make the project system more vulnerable regarding the occurrence of the triggering
events related to Rj.
• Evaluating with more reliability the relative weights of risks. The sensitivity of this
evaluation should first be explored. Then, a proper use of fuzzy pairwise comparisons
could permit to reduce the subjectivity of the users’ judgements. This gives important
research perspectives and these points are to be addressed, notably thanks to the
literature on fuzzy graphs and fuzzy linear programming.
• Exploring other graph partitioning algorithms. Indeed, this research work suggests the
optimal solving of the linear programming model, which significantly constrains the size
of the problems which can be possibly addressed (even though the concept of graph
connectivity permits to address larger problems). When the problem is too large, this
research work argues for the use of basic and non-consuming iterative algorithms in order
to reach an approximate and acceptable clustering solution. However, some other graph
K-partitioning algorithms are to be addressed and tested in the future in the case of
complex project risk clustering. A particular look is to be given over the Kernighan-Lin
algorithm (Kernighan and Lin, 1970), the Fiduccia-Mattheyses algorithm (Fiduccia and
Mattheyses, 1982) and some spectral methods (Pothen and al. 1990), (Rendl and
Wolkowicz, 1990), (Simon, 1991). Discussions about the final choice of a particular
clustering algorithm in this context are to be held according to some criteria such as
computability, understandability, user-friendliness, resolution time.
• Exploring new constraints to perform other clustering operations. For instance, the
maximal size of the clusters may vary. One could think of asking for a density constraint
or asking that the obtained clusters may as a whole be of a similar size. Statistical tests
might in the end be performed in order to analyse how often some risks are clustered
together.

- 166 -
• A final improvement of the results and algorithms thanks to the concept of strongly
connected components of a graph (Pearce, 2005), (Bang-Jensen and Gutin, 2008) is also to
be addressed as it can notably identification some possible accumulation zones within the
project risk network.
• Finally, new case studies are to be performed in order to validate even more this approach
and study both the practical applications (and improvements) thanks to these results and
the future implications on project management processes and organisation.

- 167 -
EpilogueEpilogueEpilogueEpilogue
Overall conclusion of this workOverall conclusion of this workOverall conclusion of this workOverall conclusion of this work
As a whole, this Ph.D. thesis can be partly synthesised thanks to the following paragraphs. We
show how it permits to propose answers to the research questions which were raised in the
overall introduction of this work (Prologue).
� What is project complexity? What are its characteristics and sources? How can it be What is project complexity? What are its characteristics and sources? How can it be What is project complexity? What are its characteristics and sources? How can it be What is project complexity? What are its characteristics and sources? How can it be
described?described?described?described?
After describing what a project is (Chapter 1 – Prologue), Chapter 2 permits to explore the notion
of project complexity. This chapter highlighted that, in spite of the lack of consensus existing
about project complexity, a standard framework could be elaborated.
The project complexity framework proposed in this Ph.D. thesis claims for the description of
project complexity as compounded of factors of four kinds (size, variety, interdependency and
context-dependence), which can themselves be categorized thanks to Baccarini’s traditional
dichotomy into technological and organizational sides of project complexity.
Furthermore, an international Delphi study which was carried out over academic and industrial
experts permits to underline the preponderance of organisational interdependency-related factors
into complexity-driven phenomena. This study also permits to refine the framework into a
smaller one, as needed in Chapter 3.
� In order to manage, one needs to measure. The question is then how can project In order to manage, one needs to measure. The question is then how can project In order to manage, one needs to measure. The question is then how can project In order to manage, one needs to measure. The question is then how can project
complexity be measured to assist decisioncomplexity be measured to assist decisioncomplexity be measured to assist decisioncomplexity be measured to assist decision----making in complex project management?making in complex project management?making in complex project management?making in complex project management?
The ambition of Chapter 3 is to assess project complexity and propose as a consequence a project
complexity measure. In order to do so, the refined project complexity framework is used to build
up an Analytic Hierarchy Process hierarchical structure in order to integrate all the compounding
effects of project complexity in its evaluation. Such an evaluation is adapted to any kind of project
but must be done in accordance with the specific context of any project.
Carrying out such an evaluation permits to identify particularly complex projects within a
portfolio, or particularly complex project scenarios in the context of mono-project decision-making,
or particularly complex zones one should focus on during a project.

- 168 -
� What are the stakes of project complexity? What are its implications on project risk What are the stakes of project complexity? What are its implications on project risk What are the stakes of project complexity? What are its implications on project risk What are the stakes of project complexity? What are its implications on project risk
creation? What are thcreation? What are thcreation? What are thcreation? What are the lacks of traditional project risk management methodologies e lacks of traditional project risk management methodologies e lacks of traditional project risk management methodologies e lacks of traditional project risk management methodologies
regarding the integration of complexity?regarding the integration of complexity?regarding the integration of complexity?regarding the integration of complexity?
As Chapter 4 underlines it, such identification and understanding of complex projects or project
zones is all the more interesting that many complexity-driven phenomena (ambiguity,
uncertainty, propagation, chaos) are the causes of project risks.
Complexity is to be integrated in innovative ways to manage risks since traditional project risk
management methodologies do not efficiently and effectively take into account project complexity
(ambiguity, lack of confidence in the risk management activity, unsuitable for risk networks,…).
� Can innovative methodologies and tools be developed to integrate better complexity Can innovative methodologies and tools be developed to integrate better complexity Can innovative methodologies and tools be developed to integrate better complexity Can innovative methodologies and tools be developed to integrate better complexity
related aspects into project risk managemenrelated aspects into project risk managemenrelated aspects into project risk managemenrelated aspects into project risk management? Can these innovative approaches, whether t? Can these innovative approaches, whether t? Can these innovative approaches, whether t? Can these innovative approaches, whether
systemic or analytical, permit to assist complex project risk management?systemic or analytical, permit to assist complex project risk management?systemic or analytical, permit to assist complex project risk management?systemic or analytical, permit to assist complex project risk management?
That is why Chapters 5 and 6 permitted to study two different approaches.
Chapter 5 (systemic approach) suggested that, as a complement to traditional project
management methodologies, project vulnerability management methodologies should be
developed, notably to diminish the complexity-driven ambiguities. By focusing on project
weaknesses thanks to the concept of vulnerability, one avoids possible usual reluctance and non-
consensus regarding project risks (in terms of existence, management,...).
The identification of project tasks/elements the non-resistance and resilience of which (regarding
possible negative triggering events) are high then permits to propose a conjoint approach to
traditional risk management ones. Response plans to decrease the importance and the apparition
of possible project damages may be improves thanks to these complementary approaches.
Another possible improvement was proposed in Chapter 6 (analytical approach) thanks to the
integration of project risk interactions into the definition of project risk networks. One of the
practical implications of this integration is to study better the possible propagation phenomena
within a project (and thus identify origin risks, etc...).
Another one is the clustering of project risks functions of their interactions thanks to different
clustering algorithms which can be adapted from graph theory. We hope that this analytical
developments will permit in the end to propose innovative approaches which will complement the
existing ones.
All these results are also synthesized hereinafter in Figure 75.

- 169 -
Most notable academic results Most notable industrial results
Chapter II
Construction of a project complexity framework which identifies possible project complexity sources thanks to a large literature review.
Proposal of a definition of project complexity.
Analysis and refining of the project complexity framework thanks to an international Delphi study.
Generic grid to identify project complexity sources: retrospective application to two automotive projects.
Chapter III
Critical selection of a multicriteria approach (the AHP) to measure project complexity.
Proposal of a relative measure of project complexity to assist decision-making.
Generic formulation of gradient sensitivity analysis of the proposed
Assistance to decision-making when selecting projects in a portfolio thanks to a measure of project complexity:
prospective application to an entertainement industry start-up firm.
Chapter IVIdentification of the consequences of project complexity and their
implications on project risks thanks to a critical analysis of the literature. -
Chapter V
Proposal of a definition of project vulnerability.
Proposal of a systems thinking-based project vulnerability management process which includes the phases of identification, analysis, response
plan, monitoring and control.
A new way to identify the existing weaknesses of a project through the project vulnerability management process: present application to a software development project
within the pharmacy industry.
Chapter VI
Introduction of matrix representations to model project risk networks.
Proposal of a methodology to evaluate the strength of risk interactions.
Proposal of matrix-based indicators for a first analysis of possible propagation phenomena within the project risks network.
Proposal of an interactions-based clustering methodology to manage project risks and facilitate coordination.
Proposal of corresponding heuristics, performance measures, etc...
Innovative ways to analyse project risk networks thanks to matrix representations and clustering operations: present
application to a musical production project and a large infrastructure project.
Figure 74Figure 74Figure 74Figure 74. . . . Synthesis of the main results of this Ph.D. workSynthesis of the main results of this Ph.D. workSynthesis of the main results of this Ph.D. workSynthesis of the main results of this Ph.D. work
As a whole, the reader may have noted that several case studies have been used in this Ph.D.
thesis.
• A retrospective case study about two Renault Multi-Purpose Vehicle development projects
(Renault Espace and Renault Twingo) in Chapter 2.
• A prospective case study within a start-up firm the ambition of which is to produce stage
musicals in Chapter 3.
• A diagnosis case study for the FabACT project, a software development project taking
place in the health context in Chapter 5.
• Two diagnosis case studies in Chapter 6, one taking place in the stage musicals
production industry, one about a tramway development project.
These different case studies permit to underline the extensiveness of the possible applications
and implications of this work about project complexity identification, measure, management and
integration into innovative project risk management processes. That is notably why we aim at
extending our research works to other industrial cases and applications.

- 170 -
However, it must be noted that for the moment, no case study integrating the results of all the
chapters was carried out on a single project. One of our research application perspectives is
undoubtedly to work on a large complex project and:
• Use systems thinking as proposed in Chapter 1 to identify properly project values, project
tasks and processes, and project elements (actors, resources, inputs).
• Use chapter 2 to identify existing complexity factors within this project.
• Use chapter 3 to identify particularly complex zones within this project in order to focus
on them.
• Use chapter 5 to perform a project vulnerability analysis and compare it with traditional
project management methodologies.
• Use chapter 6 to study the complexity of the project risk network in terms of their possible
propagation. Practical implications in terms of propagation studies and clustering may be
underlined.
This case study will in the end validate even more the works of this Ph.D. and show how they can
be integrated in a global approach to study project complexity and improve complex project risk
management.
Other research perspectives after this work are to be the following ones:
• Further statistical analysis on project complexity factors (such as correlation tests for
instance, notably thanks to Kruskal-Wallis tests) may permit to explore more deeply
project complexity and its impact on project management.
• Further research is to be carried out on project complexity measure and its implications,
notably thanks to the three following issues:
o Exploring the possibility to define some direct measures of some complexity
factors.
o Exploring the use of the Analytic Network Process to refine the project complexity
index proposed in Chapter 3.
o Proposing a typology of projects regarding the multiple aspects of complexity.
• We will explore how graph theory (notably around the concept of connectivity) can be
integrated to the vulnerability approach in order to consider more efficiently how a project
network (and its evolution) can be affected by the possible damages of its vulnerable
processes or entities.
• Finally, some research is to be pursued around the clustering processes proposed in
Chapter 6:
o Exploring approaches to reduce processing time to solve the LP problem in order
to address larger problems.
o Testing the impact of the clustering constraints (maximum cluster size, gap with
target mean cluster density, maximum gap with target mean cluster size,
maximum number of risk owners,…). Defining different heuristics due to these

- 171 -
different constraints. Understanding the commonalities and differences between
the clustering solutions which are obtained through these different approaches.
As an overall conclusion, we want to underline that all the propositions of this Ph.D. thesis
around the notion of project complexity and its implications on project management are to
coexist with existing traditional project management methodologies. Indeed, we do not suggest
eliminating traditional approaches. On the contrary, we are undoubtedly building up new
methodologies and tools on it and thanks to it.
For instance, as established by the conventional approach, each project must have a Work
Breakdown Structure to define its work packages, a schedule, a budget, a traditional risk list,
etc… and all of them need to be reworked and redefined during the project evolution over time.
All these traditional methodologies and tools remain absolutely necessary steps to manage
successfully complex projects. As Shenhar stresses it, traditional project management methods
are “building blocks [which] will […] form the baseline to leading the project in a flexible way”
(Shenhar, 2007).
As a whole, modern projects include a greater and greater deal of complexity and a larger and
larger amount of complexity-driven risks, due to ever more demanding requirements under
ever more pressuring constraints. The conjoint use of innovative systems-oriented / complexity-
oriented methods and more analytical tools is to be a high potential evolution for project
management, opening new perspectives for future research in this discipline.
As each project is to remain complex, temporary and unique, it will have to be managed it its
own way thanks to the application and extension of these methods to the project’s own
characteristics. The managers’, organisations’ and teams’ flexibility and adaptability around
innovative and traditional project management methods and tools are thus to become some of
the greatest stakes of modern complex project management.

- 172 -

- 173 -
Publications
International journals with scientific committee review • Chapter II:
o VIDAL, L.A. and F. MARLE, Understanding project complexity: implications on
project management. Kybernetes, the International Journal of Systems, Cybernetics and Management Science, 2008. (Web of Science – ISI)
• Chapter V: o VIDAL, L.A., SAHIN E., MARTELLI N., BERHOUNE M. and B. BONAN. Using
the AHP to select anticancer drugs to produce by anticipation. Expert Systems With Applications. (Web of Science – ISI) TO BE PUBLISHED (Submission Nov.
2008) o BONAN, B.., MARTELLI, N., BERHOUNE, M., VIDAL, L.A., SAHIN, E. and P.
PROGNON. FabAct: a decision-making tool for the anticipation of the preparation
of anti-cancer drugs. Journal of Evaluation in Clinical Practice. (Web of Science –
ISI) TO BE PUBLISHED (Submission Apr. 2009)
International conferences with scientific committee review • Chapters I, II and IV:
o VIDAL, L.A., F. MARLE. and J.C. BOCQUET, Modelling project complexity.
International Conference on Engineering Design. 2007. Paris, France.
• Chapter II:
o VIDAL, L.A., F. MARLE, and J.C. BOCQUET, Project complexity understanding
and modeling to assist project management. PMI Research Conference, 2008.
Warsow, Poland. (Best student paper) • Chapter VI:
o VIDAL L.A., MARLE F. and J.C. BOCQUET, Interactions-based clustering to
assist project management. International Conference on Engineering Design.
2009. Stanford, United States of America. o VIDAL L.A., MARLE F. and J.C. BOCQUET, Interactions-based risk clustering
methodologies and algorithms for complex project management. 9ème Congrès International de Génie Industriel, 2009. Bagnères-de-Bigorre, France.

- 174 -
o MARLE F. and L.A. VIDAL, Potential applications of DSM principles in project
risk management. Proceedings of the 10th Design Structure Matrix Conference,
2008. Stockholm, Sweden.
National conferences without scientific committee review • Chapters II, IV and V:
o VIDAL, L.A., Management de projets complexes et vulnérabilité. Séminaire des doctorants de l’Ecole Centrale Paris et du Laboratoire Génie Industriel, 2007.
Châtenay-Malabry. France. • Chapters II, IV and VI:
o VIDAL, L.A., Vers une meilleure intégration de la complexité projet dans le
management des risques projets. Journée jeunes chercheurs et jeunes ingénieurs – Institut de Maîtrise des Risques, 2009. Cachan, France.
Working papers • Chapter II:
o VIDAL, L.A. and F. MARLE, Understanding project complexity : implications on
project management. Working Paper – Ecole Centrale Paris, 2007
o BOCQUET, J.C., A.F. CUTTING DECELLE, V. GINOUX-EZRATTY, J.L.
GIORDANO, F. MARLE, A. SCHINDLER, J. STAL LE CARDINAL and L.A.
VIDAL. La complexité dans les projets en entreprise Proposition d’une définition
de la complexité et de méthodes pour sa détection et sa maîtrise, Working Paper –
Ecole Centrale Paris, 2009.
Submissions to international journals ongoing the scientific committee review
process at the time of publication of this Ph.D. thesis • Chapters II and III:
o VIDAL, L.A., MARLE F. and J.C. BOCQUET, Using a Delphi process and the
AHP to evaluate project complexity. Expert Systems With Applications. (Web of
Science – ISI) (Submission July 2009)
o VIDAL, L.A., MARLE F. and J.C. BOCQUET, Measuring project complexity
thanks to the Analytic Hierarchy Process. International Journal of Project Management. (Web of Science – ISI) (Submission August 2009).
• Chapters IV and VI: o VIDAL, L.A., F. MARLE and J.C. BOCQUET Interactions-based risk clustering
methodologies and algorithms for complex project management International Journal of Production Economics. (Web of Science – ISI) (Submission September
2009)

- 175 -
Figure List Figure 1. Overall structure of this Ph.D. thesis 2
Figure 2. The increasing share of projects (Shenhar and Dvir, 2007) 6
Figure 3. A systems thinking-based approach to describe projects 8
Figure 4. The structural nature of systems: simplicity, complication and complexity. 19
Figure 5. Drivers of project complexity 27
Figure 6. First version of the project complexity framework 29
Figure 7. The Renault ESPACE VI 33
Figure 8. The Renault TWINGO 34
Figure 9. Synthesis of the retrospective project complexity analysis 36
Figure 10. Conduction of the Delphi study according to a two-round process. 38
Figure 11. Global Delphi results for each factor family 39
Figure 12. Synthesis of Delphi results for each criterion, sorted by decreasing average 41
Figure 13. Professional comparison of the Delphi study 42
Figure 14. Gender comparison of the Delphi study 43
Figure 15. Refined project complexity framework 44
Figure 16. Project complexity modelling through project structure or project issues 48
Figure 17 : Requirements for a multicriteria method to be used for project complexity evaluation 52
Figure 18: Critical analysis of multicriteria methods 56
Figure 19. Using the AHP under complex contexts (Fumey, 2001) adapted from (Saaty, 1981) 57
Figure 20. AHP pair-wise positive reciprocal comparison matrices 58
Figure 21 : AHP hierarchical structure to assess project complexity 59
Figure 22. Example of a basic Saaty scale (Team cooperation and communication criterion) 61
Figure 23. Sensitivity analysis of score S(i0) regarding the variations of any criteria weight Wj 65
Figure 24. Sensitivity analysis of any score S(i) regarding the variations of criteria weight Wj0 65
Figure 25 : Brief description of the seven projects 68
Figure 26. Advanced Saaty scale in the case study (Number of stakeholders criterion) 68
Figure 27. Overall criteria and sub-criteria weights: project complexity factors comparison 69
Figure 28. Relative weights of the seven projects 69
Figure 29. Relative project complexity index in the case study 70
Figure 30. Specific graphical comparison of projects 1 and 6. 71
Figure 31. Building up comparison subscales on sub-criteria 71

- 176 -
Figure 32. Synthesis of the Fj(i) scores 72
Figure 33. Variations of S(i) for the seven projects when W3 varies 73
Figure 34. Project complexity-driven phenomena 79
Figure 35. Project complexity and project risks 83
Figure 36. The steps of the project risk management process 85
Figure 37. The Risk Breakdown Structure (PMI, 2004) 87
Figure 38. Scales to assess project risk probability, impact and criticality 87
Figure 39. Representations during the risk analysis process (Marle, 2009) 88
Figure 40. Current visions versus reality regarding project complexity and risks 90
Figure 41. Occurrences of the word vulnerability in the Web of Science publications in 2007 97
Figure 42. Web of Science publications the title of which contains the word vulnerability (1987-2007) 98
Figure 43. The 10 most important matters of interest for research around the concept of vulnerability in 2007 Web of Science publications. 99
Figure 44 : Vulnerability based on assets, activities and outcomes given a specific context (Ellis, 2003) 100
Figure 45 : Vulnerability study thanks to a stressor/receptor model (de Fur and al., 2007) 101
Figure 46: Project risk as an impact due to coexistence 105
Figure 47. The project vulnerability management process 108
Figure 48. Levels in the project vulnerability identification step 110
Figure 49. Project vulnerability analysis 111
Figure 50. Comparison between project risk and vulnerability management processes 115
Figure 51. Anti-cancer drugs production and distribution process (Vidal and al., 2009) 117
Figure 52. Work Breakdown Structure of the FabACT project 118
Figure 53. Identifying project tasks contribution to project values creation 121
Figure 54. Identifying the actors which contribute more to the tasks which make the project vulnerable regarding scientific quality creation 122
Figure 55. Excerpt of the FabACT project actor vulnerability analysis 123
Figure 56. Excerpt of the FMECA of the FabACT project 124
Figure 57. Content of chapter 6 132
Figure 58. Project risk networks as finite directed weighted graphs 133
Figure 59. Transforming a project risk network into a RSM 136
Figure 60. Transforming the RSM into the RNM 138
Figure 61. Analysing the possible propagation of a risk within the project risk network 140
Figure 62. Digraph with two connected components 149
Figure 63. Extract from the initial project risk list 152
Figure 64. RNM of the problem 152
Figure 65. Possible propagation of risk R6 within the project risk network 153
Figure 66. Propagation comparative analysis of project risks 154

- 177 -
Figure 67. Results of the clustering algorithms 155
Figure 70. Performance of the clustering methods – First case study 156
Figure 71. Initial risk list of the System product line of the project 158
Figure 72. Newly identified risk thanks to the risk interaction identification process 159
Figure 73. The RNM of the project 160
Figure 74. Results of the clustering operation 161
Figure 75. Clustered project risk network 162
Figure 76. Synthesis of the main results of this Ph.D. work 169

- 178 -

- 179 -
Bibliography
A. (AFITEP, 1999) AFITEP Ouvrage Collectif (1999) - Le management de projet, principes et
pratique - Afnor gestion, 2ème édition.
(AFNOR, 2004) AFNOR (2004) - Management de projet, recueil de normes – AFNOR, édition
2004
(AFNOR, 2007) AFNOR (2007) - Management de projet - AFNOR
(Ahmand and Laplante, 2006) Ahmad N. and Laplante P.A. (2006) - Software Project
Management Tools: Making a Practical Decision Using AHP - SEW 2006, pp.76-84
(Aiyer and al., 2005) Aiyer, J., Rajkumar, T.M. and Havelka. D. (2005) - A staged framework for
the recovery and rehabilitation of troubled IS projects - Project Management Journal, 36(4), 32-
43.
(Akileswaran and al., 1983) Akileswaran V., Hazen G.B. and Morin T.L. (1983) - Complexity of
the project sequencing problem - Operations Research Vol. 31, No. 4, pp. 772-778
(Al-Harbi, 2001) Al-Harbi K.M.A.S. (2001) - Application of the AHP in project management -
International Journal of Project Management, Volume 19, Number 1, pp. 19-27(9)
(Alhazmi and McCaffer, 2000) Alhazmi, T. and McCaffer, R. (2000) - Project Procurement System
Selection Model - American Society of Civil Engineers Journal, Paper No.18768-CO
(Al-Shemmeri and al., 1997) Al-Shemmeri T., Al-Kloub B. and Pearman A. (1997) - Model choice
in multicriteria decision aid - European Journal of Operational Research, 97(3), pp.550-560
(Alvesson and Deetz, 2000) Alvesson, M. and Deetz, S. (2000) - Doing Critical Management
Research - Ed. Sage
(APM, 2004) Association for Project Managment APM (2004) - Project Risk Analysis and
Management Guide 2nd Edition - Ed. APM

- 180 -
(Ariyo and al., 2007) Ariyo O.O., Eckert C.M. and Clarkson P.J. (2007) - Prioritising enginnering
change propagation risk estimates - International Conference on Engineering Design, ICED'07,
Paris, France.
(Atkinson, 1999) Atkinson R.W. (1999) - Effective Organisations, Re-framing the Thinking for
Information Systems Projects Success, 13–16. Cassell, London.
(Austin and al., 2002) Austin, S., Newton, A., Steele J. and Waskett P. (2002) - Modelling and
managing project complexity - International Journal of Project Management Vol.20, pp.191-198
(Aven, 2007) Aven, T. (2007) - A unified framework for risk and vulnerability analysis covering
both safety and security - Reliability engineering & systems safety Vol. 92, No. 6, pp. 745-754
B. (Baccarini, 1996) Baccarini D. (1996) - The concept of project complexity, a review - International
Journal of Project Management, Vol.14, Issue 4, pp.201-204
(Baker and al., 2001) Baker, D., Bridges, D., Hunter, R., Johnson, G., Krupa, J., Murphy, J. and
Sorenson, K. (2001) - Guidebook to Decision-Making Methods - WSRC-IM-2002-00002,
Department of Energy, USA.
(Bang-Jensen and Gutin, 2000) Bang-Jensen J. and Gutin G. (2000) - Digraphs: Theory,
Algorithms and Applications - Springer Verlag, London
(Bayazit, 2005) Bayazit, O. (2005) - Use of AHP in decision-making for flexible manufacturing
systems - Journal of Manufacturing Technology Management, Volume 16, Number 7, pp. 808-
819(12)
(Bea and Lloveras, 2007) Bea J. and Lloveras J. (2007) - Multicriteria decision making applied to
project outsourcing - International Conference on Engineering Design, ICED-07, Paris, France.
(Bellut, 2002) Bellut S. (2002) - Maîtriser les coûts d’un projet . Le management par la valeur -
AFNOR
(Ben-Gal, 2007) Ben-Gal I. (2007) - Bayesian networks - F. Ruggeri, R. Kenett, and F. Faltin
(editors), Encyclopedia of Statistics in Quality and Reliability, John Wiley & Sons

- 181 -
(Bertelsen and Koskela, 2003) Bertelsen S. and Koskela L. (2003) - Avoiding and Managing Chaos
in Projects - 11th annual conference in the International Group for Lean Construction,
Blacksburg, VA.
(Besner and Hobbs, 2006) Besner C. and Hobbs B. (2006) - The Project Management Tools and
Techniques: the portrait of current professional practice - Project Management Journal, Vol.37,
Issue 3, Newton Square, PMI
(Biggiero, 2001) Biggiero, L. (2001) - Sources of Complexity in Human Systems - Nonlinear
Dynamics and Chaos in Life Sciences, 5, pp.3-19
(Biggs and al. 1986) Biggs, N., Lloyd, E. and Wilson, R. (1986) - Graph Theory - Oxford
University Press 1736-1936.
(Blaikie and al., 1994) Blaikie P., Cannon T., Davis I. and Wisner B. (1994) - At risk - Routledge
(Blaikie and al., 2001) Blaikie, P., Cameron, J. and Seddon, D. (2001) - Nepal in Crisis: Growth
and Stagnation at the Periphery - Adroit Publishers, New Delhi, India.
(Bocquet and al., 2007) Bocquet J-C., Patay E., Schindler A., Dudezert A. (2007) - How to build a
design product and its end- product system? An original approach called SCOS' - International
Conference on Engineering Design, ICED'07, Paris, France.
(Bogataj and Bogataj., 2007) Bogataj D. and Bogataj M. (2007) - Measuring the supply chain risk
and vulnerability in frequency space - International Journal of Production Economics, Vol.108,
Issue 1-2, pp.291-301
(Bonan and al., 2009) Bonan, B., Martelli, N., Berhoune, M., Vidal, L.A., Sahin, E. and Prognon,
P. (2009 - To be published) - FabAct: a decision-making tool for the anticipation of the
preparationof anti-cancer drugs. Journal of Evaluation in Clinical Practice.
(Bondy and Murty, 1976) Bondy J.A. and Murty U.S.R. (1976) - Graph theory with applications -
Elsevier North-Holland
(Boulding, 1956) Boulding K. (1956) - General Systems Theory, the Skeleton of Science -
Management Science, Vol.2, Issue 3, pp.197-208
(Brans and Vincke, 1985) Brans J.P. and Vincke P. (1985) - A preference ranking organization
method - Management Science, Vol.31, Issue 6, pp.647-656

- 182 -
(Browning, 2001) Browning T.R. (2001) - Applying the Design Structure Matrix to System
Decomposition and Integration Problems: A Review and New Directions - IEEE Transactions on
Engineering Management, Vol.48, Issue 3, pp.292-306
(Bryant and Abkowitz, 2007) Bryant, D.L. and Abkowitz M.D. (2007) - Estimation of Chemical
Spill Risk Factors Using a Modified Delphi Approach - Journal of Environmental Management.
Vol. 85. No. 1, pp.112-120
(BSI, 2008) BSI British Standards (2008) - Risk management: Code of practice - BS 31100
C. (Calinescu and al., 1998) Calinescu, A., Efstathiou, J., Schirn, J. and Bermejo, J. (1998) -
Applying and assessing two methods for measuring complexity in manufacturing - Journal of the
Operational Research Society 49 (1998), pp. 723–733
(Carrascosa and al., 1998) Carrascosa, M., Eppinger, S. D. and Whitney, D. E. (1998) - Using the
design structure matrix to estimate product development time - ASME Design Engineering
Technical Conferences. Atlanta, Georgia, USA.
(Chambers, 1983) Chambers, R. (1983) - Rural Development: Putting the Last First - Longman,
London.
(Charmes and Cooper, 1961) Charmes A. and Cooper W. (1961) - Management Models and
Industrial Applications of Linear Programming Vol 1 - John Wiley New-York
(Chen and Lin, 2003) Chen, S.-J., and Lin, L., (2003) - Decomposition of interdependent task
group for concurrent engineering - Computers and industrial engineering 44(4), pp.633-650
(Cheng and al., 2007) Cheng R.W., Che W.C., Hung L.L. (2007) - An organisational performance
measurement model based on AHP sensitivity analysis - International Journal of Business
Performance Management, Volume 9, Number 1, pp. 77 - 91
(Chiu and Chen, 2007) Chiu Y.J. and Chen Y.W. (2007) - Using AHP in patent valuation.
Mathematical and Computer Modelling, 46(7-8):1054 - 1062

- 183 -
(Chu and al., 2003) Chu, D., Strand, R. and Fjelland, R. (2003) - Theories of complexity –
Common denominators of complex systems - Essays & Commentaries, Complexity, Wiley
Periodicals Inc., Vol. 8, No. 3
(Clarkson and al., 2004) Clarkson, P.J., Simons, C., and Eckert, C.M. (2004) - Predicting Change
Propagation in Complex Design - ASME Journal of Mechanical Design 126(5): 765-797.
(Cohen and Hickey, 1979) Cohen, J. and Hickey, T. (1979) - Two Algorithms for Determining
Volumes of Convex Polyhedra - Journal of the ACM, 26(3), 401-414
(Cooper and Chapman, 1987) Cooper, D. and Chapman, C. (1987) - Risk analysis for large
projects, Models, Methods & Cases - Ed Wiley
(Corbett and al., 2002) Corbett, L.M., Brockelsby, J. and Campbell-Hunt, C. (2002) - Tackling
industrial complexity - In G. Friozelle and H. Richards (eds) Cambridge: Institute for
Manufacturing, pp.83-96
D. (de Fur and al., 2007) de Fur,P.L., Evans, G.W., Cohen Hubal, E.A., Kyle, A.D., Morello-Frosch,
R.A. and Williams, D.R. (2007) - Vulnerability as a Function of Individual and Group Resources
in Cumulative Risk Assessment - Environmental Health Perspectives Volume 115, Number 5
(Deason, 1984) Deason, J. (1984) - A multi-objective decision support system for water project
portfolio selection - In: Ph.D. Dissertation, University of Virginia.
(Dibben and Chester, 1999) Dibben C. and Chester D.K. (1999) - Human vulnerability in volcanic
environments: the case of Furnas, Sao Miguel, Azores - Journal of Volcanology and Geothermal
Research 92,133–150
(Diestel, 2005) Diestel, R. (2005) - Graph Theory - Springer Verlag, NewYork.
(Dong and al., 2006) Dong, Y., Zhuang, Y., Chen, K. and Tai, X. (2006) - A hierarchical clustering
algorithm based on fuzzy graph connectedness - Fuzzy Sets and Systems 157, pp. 1760–1774.
(Dörner, 1996) Dörner, D. (1996) - On the difficulties of decision-making in complex and uncertain
domains of reality - The Journal of the European Society for Opinion and Marketing Research,
Vol. 24 No.11, pp.51-60.

- 184 -
(Durand, 2007) Durand, J. (2007) - Management des risques dans les organisations industrielles
complexes: prépondérance de la dimension managériale dans la genèse des vulnérabilités.
Application et validation par une campagne de recherche-intervention - Thèse de Doctorat de
l'Ecole Centrale de Paris, Paris, France.
(Dvir and al., 1998) Dvir, D., Lipovetsky, S., Shenhar, A, and Tishler, A. (1998) - In search of
project classification: a non-universal approach to project success factors - Research Policy,
Volume 27, Number 9, pp. 915-935(21)
E. (Eckert and al., 2004) Eckert, C.M., Clarkson, P.J. and Zanker, W. (2004) - Change and
customisation in complex engineering domains. - Research in Engineering Design 15(1): 1-21.
(Edmonds, 1999) Edmonds, B. (1999) - Syntactic measures of complexity - Thesis of the
University of Manchester for the degree of doctor of philosophy in the faculty of arts.
(Edwards, 1971) Edwards, W. (1971) - Social utilities - Engineering Economist, Summer
Symposium Series 6
(Ellis, 2000) Ellis, F. (2000) - Rural Livelihoods and Diversity in Developing Countries - Oxford
University Press : Oxford, UK
(Ellis, 2003) Ellis, F. (2003) - Human Vulnerability and Food Insecurity:Policy Implications -
Forum for Food Security in Southern Africa
(Eppinger and al., 1992) Eppinger, S.D., Whitney, D.E. and Gebala, D.A. (1992) -Organizing
Tasks in Complex Design Projects: Development of Tools to Represent Design Procedures - NSF
Design and Manufacturing Systems Conference,Atlanta, GA
(Eppinger and al., 1994) Eppinger, S.D., Whitney, D.E., Smith, R.P. and Gebala, D.A. (1994) - A
Model-Based Method for Organizing Tasks in Product Development - Research in Engineering
Design , vol. 6, no. 1, pp.1-13
(Eppinger and Gebala, 1991) Eppinger, S.D. and Gebala, D.A. (1991) - Methods for Analyzing
Design Procedures - ASME Conference on Design Theory and Methodology,Miami, FL, pp. 227-
233

- 185 -
(Eppinger and Salminen, 2001) Eppinger, S.D. and Salminen, V.K. (2001) - Patterns of Product
Development Interactions - International Conference on Engineering Design, Glasgow, Scotland
(Eppinger, 1991) Eppinger, S.D. (1991) - Model-Based Approaches to Managing Concurrent
Engineering - Journal of Engineering Design, vol. 2, no. 4, pp. 283-290
(Eppinger, 1997) Eppinger, S.D. (1997) - A Planning Method for Integration of Large-Scale
Engineering Systems - International Conference on Engineering Design, Tampere, Finland,
pp.199-204
(Erkut and Tarimcilar, 1991) Erkut, E. and Tarimcilar, M. (1991) - On Sensitivity Analysis in the
Analytic Hierarchy Process - IMA Journal of Management Mathematics 3(1):61-83
(Ezard, 2001) Ezard, N. (2001) - Public health, human rights and the harm reduction paradigm:
From risk reduction to vulnerability reduction - International Journal of Drug Policy 12, pp.207–
219.
F. (Falkner and al., 1994) Falkner, J., Rendl, F. and Wolkowicz, H. (1994) - A Computational Study
of Graph Partitioning - Mathematical Programming Volume 66, Numbers 1-3
(Farquhar, 1984) .Farquhar P. (1984) - Utility Assessment Methods - Management Science,Vol.
30, N°11, pp 1283-1300
(Fiduccia and Mattheyses, 1982) Fiduccia , C.M. and Mattheyses, R.M. (1982) - A linear-time
heuristic for improving network partitions - Proceedings of the 19th conference on Design
automation, p.175-181
(Fowlkes and Mallows, 1983) Fawlkes, E.B. and Mallows, C.L. (1983) - A Method for Comparing
two Hierarchical Clusterings - Journal of Americal Statistics Association, Vol.78, 553-584
(Fumey, 2001) Fumey, M. (2001) - Méthode d'Evaluation des Risques Agrégés: application au
choix des investissementsde renouvellement d'installations - Thèse de l'institut national
polytechnique de Toulouse.

- 186 -
G. (Gareis, 2000) Gareis, R.(2000) - Managing the project start - in: The Gower Handbook of Project
Management, JR Turner and SJ Simister (ed), Gower, Aldershot
(Garey and al., 1976) Garey, M.R.., Johnson, D.S. and Stockmeyer, L. (1976) - Some simplified
NP-complete graph problems - TheoreticalComputer Science, 1, 237–267
(Gautier and al., 1997) Gautier, R., Truchot, P. and Gidel, T. (1997) - Method of reliability
analysis in the project information management process - Managing Risks in Projects,
Proceedings of IPMA International Symposium on Project Management PRM'97, Risks In
Projects And Project Oriented Business, Helsinki, Finland.
(Gautier, 1991) Gautier, R. (1991) - L'analyse des risques dans les projets industriels pour une
mise en synergie des démarches Qualité et Innovation - Actes Colloque International sur
Université Paris 1 Panthéon-Sorbonne
(Gautier, 1995) Gautier, R. (1995) - Qualité en conception de produits nouveaux, Proposition
d'une méthode de fiabilisation du processus de management de l'information - Thèse de doctorat
de l'Ecole Nationale Supérieure des Arts et Métiers de Paris.
(Genelot, 2001) Genelot, D. (2001) - Manager Dans La Complexité. Réflexions À L'usage Des
Dirigeants - Insep Consulting
(Gerdsri and Kocaoglu, 2007) Gerdsri, N. and Kocaoglu, D.F. (2007) - Applying the Analytic
Hierarchy Process (AHP) to build a strategic framework for technology roadmapping -
Mathematical and Computer Modelling, 46(7-8):1071 - 1080,
(Gershon, 1981) Gershon, M. (1981) - Model choice in multi-objective decision making in natural
resource systems - In: Ph.D. Dissertation, University of Arizona
(Giard, 1991) Giard V. (1991) - Gestion de Projet - Economica, Paris
(Goldschmidt and Hochbaum, 1994) Goldschmidt, O. and Hochbaum, D.S. (1994) - A Polynomial
Algorithm for the K-Cut Problem - Mathematics of Operations Research Vol 19. No.1, 24-37
(Gourc, 1997) Gourc, D. (1997) - Contribution à la réingiénerie des systèmes de production - Thèse
de doctorat de l'Université de Tours.

- 187 -
(Gourc, 1999) Gourc, D. (1999) - Le management des risques en contexte projet : Quelles
problématiques ? - Ecole d'été Gestion Scientifique du Risque, organisée par le groupe Analyse du
Risque Industriel, Ecole des Mines d'Albi-Carmaux, avec actes.
(Gourc, 2006) Gourc, D. (2006) - Vers un modèle conceptuel du risque pour le pilotage et la
conduite des activités de biens et de services. Propositions pour une conduite des projets et une
gestion des risques intégrées. - Dossier d'habilitation à diriger des recherches présenté à l'institut
national polytechnique de Toulouse.
(Gusfield, 1997) Gusfield, D. (1997) - Algorithms on strings, trees and sequences - Cambridge
University Press.
H. (Haas, 2008) Haas, K. (2008) - Introducing the New Project Complexity Model - Management
Concepts
(Haller, 1976) Haller M. (1976) - Les objectifs du Risk Management - Les cahiers de Genève, n°2.
(Hartigan, 1975) Hartigan, J.A. (1975) - Clustering algorithms - Editions John Wiley & Sons.
(Hartuv and Shamir, 2000) Hartuv, E. and Shamir, R. (2000) - A clustering algorithm based on
graph connectivity - Information processing letters vol. 76, no4-6, pp.175-181
(Hellström, 2007) Hellström, T. (2007) - Critical infrastructure and systemic vulnerability :
Towards a planning framework - Safety science vol. 45, no3, pp. 415-430
(Hennig and Hausdorf, 2006) Hennig, C. and Hausdorf, B. (2006) - A robust distance coefficient
between distribution areas incorporating geographic distances- Systematic Biology: 55(1): 170-175
(Heylighen and al., 2006) Heylighen, F., Cilliers, P. and Gershenson, C. (2006) - Complexity and
Philosophy - Complexity, Science and Society. Ed. Radcliffe.
(Holder, 1990) Holder, R.D. (1990) - Some comments on the analytic hierarchy process - Journal
of Operational Research Society 41 11 (pp. 1073–1076
(Horn and Johnson, 1990) Horn, R.A. and Johnson, C.R. (1990) - Matrix Analysis - Cambridge
University Press

- 188 -
I. (IEC, 1995) IEC (1995) - Dependability management, International Standard - CEI
(IPMA, 2006a) IPMA (2006) - Evaluation of project management complexity for IPMA
certification process on level B - Draft IPMA
(IPMA, 2006b) IPMA (2006) - IPMA Competence Baseline (ICB). Version 3.0. - Editor:
International Project Management Association
(Isaacs, 1963) Isaacs, H.H. (1963) - Sensitivity of decisions to probability estimation errors -
Operations Research 11, pp. 536–552
(ISO, 2003) ISO (2003) - ISO:10006 Quality management systems -- Guidelines for quality
management in projects - ISO
(Ivan and Sandu, 2008) Ivan, I. and Sandu, A. (2008) - Projects Hierarchy Based on Duration and
Complexity - 22nd IPMA World Conference, Roma, Italy.
J. (Jaafari, 2001) Jaafari, A. (2001) - Management of risks, uncertainties and opportunities on
projects: time for a fundamental shift - International Journal of Project Management, Vol.19,
Issue 1, pp.89-101
(Jaafari, 2003) Jaafari, A. (2003)- Project management in the age of complexity and change -
Project Management Journal Vol.34, No. 4, pp. 47-57
(Jankovic, 2006) Jankovic, M. (2006) - Prise des décisions collaboratives dans le processus de
conception de nouveaux produits. Application à l'automobile - Thèse de Doctorat de l'Ecole
Centrale de Paris, Laboratoire Génie Industriel.
(Johnson, 1967) Johnson, S.C. (1967) - Hierarchical clustering schemes - Psychometrika, 12, n° 3,
241–254.

- 189 -
K. (Kaimann, 1974) Kaimann, R.A. (1974) - Coefficient of Network Complexity - Management
Science,Vol. 21, No. 2, pp. 172-177
(Kannan and al., 2004) Kannan, R., Vempala, S. and Vetta A. (2001) - On clusterings: good, bad
and spectral - Working Paper.
(Karp, 1977) Karp, R.M (1976) - Probabilistic analysis of partitioning algorithms for the traveling-
salesman problem in the plane - Mathematics of Operations Research, Math. Oper. Res. (USA),
vol.2, (no.3), p.209-24.
(Karsky, 1997) Karsky, M (1997) - La dynamique des systèmes complexes ou la systémique de
l’ingénieur - Cours de l'Ecole Centrale Paris.
(Keeney and Raifa, 1976) Keeney, R. and Raiffa, H. (1976) - Decisions with multiple objectives:
preferences and value trade−offs. Wiley: New York.
(Kelly and Adger, 2005) Kelly, P.M. and Adger, W.N. (1999) - Assessing vulnerability to climate
change and facilitating adaptation - CSERGE Working Paper GEC 99-07. Centre for Social &
Economic Research on the Global Environment, School of Environmental Sciences, University of
East Anglia, Norwich, U.K.
(Kernighan and Lin, 1970) Kernighan, B. W. and Lin, S. (1970) - An efficient heuristic procedure
for partitioning graphs - Bell Systems Technical Journal 49: 291-307.
(Kim, 2003) Kim, S. (2003) - Graph theoretic sequence clustering algorithms and their
applications to genome comparison - in Wu, C.H., Wang, P. and Wang, J.T.L. (Eds.): Chapter 4 in
Computational Biology and Genome Informatics, World Scientific, Singapore
(Koivu and al., 2004) Koivu, T., Nummelin, J., Tukiainen, S., Tainio, R. and Atkin, B. (2004) -
Institutional complexity affecting the outcomes of global projects - Published by VTT, VTT
Working Papers 14, ISSN 1459-7683. http://www.vtt.fi/inf/pdf
(Kutsch and Hall, 2005) Kutsch, E. and Hall, M. (2005) - Intervening conditions on the
management of project risk: Dealing with uncertainty in information technology projects -
International Journal of Project Management, Volume 23, Issue 8, Pages 591-599.

- 190 -
L. (Lakroum and al., 2005) Lakroum, S., Devlaminck, V., Terrier, P., Biela-Enberg, P. and Postaire,
J.G. (2005) - Clustering of the Poincare vectors - Image Processing, 2005. ICIP 2005. IEEE
International Conference on Volume 2, Issue , 11-14
(Latora and Marchiori, 2005) Latora V. and Marchiori M. (2005) - Vulnerability and protection of
infrastructure networks - Physical Review E 71, 015103
(Latva-Koivisto, 2001) Latva-Koivisto A. (2001) - Finding a complexity measure for business
process models - Research report Helsinki University of Technology, Systems Analysis Laboratory
(Laufer, 1997) Laufer, A. (1997) - Simultaneous management - Amacon, New-York.
(Laurikkala and al., 2001) Laurikkala, H., Puustiner, E., Pajarre, E. and K. Tanskanen (2001) -
Reducing complexity of modelling in large delivery projects - International Conference on
Engineering Design, ICED’01, Vol.1, Glasgow, pp.165-172, Professional Engineering Publishing,
Bury St Edmunds.
(Le Moigne, 1990) Le Moigne, J.L. (1990) - La théorie du système général. Théorie de la
modélisation - Presses Universitaires de France.
(Ledet and Himmelblau, 1970) Ledet, W and Himmelblau, D. (1970) - Decomposition procedures
for the solving of large scale systems - Advances in Chemical Engineering, Vol.8, pp.185-224
(Lehner, 2009) Lehner J.M. (2009) - The staging model: The contribution of classical theatre
directors to project management in development contexts - International Journal of Project
Management, Volume 27, Issue 3, Pages 195-205
(Liang, 2003) Liang, W.Y. (2003) - The analytic hierarchy process in project evaluation: an R & D
case study in Taiwan - Benchmarking, Vol. 10, No. 5, pp.445–456
(Lin and al., 2008) Lin, C.C., Wang, W.C., and Yu, W.D. (2008) - Improving AHP for construction
with an adaptive AHP approach - Automation in Construction, Vol. 17, p. 180 – 187.
(Lindkvist, 2008) Lindkvist, L. (2008) - Project management: exploring its adaptation properties -
International Journal of Project Management, Vol. 26, No.1, pp.13-20

- 191 -
(Linstone and al., 2002) Linstone, H. and Turoff, M. (2002) - The Delphi method: techniques and
applications - Edited by Harold A. Linstone and Murray Turoff.
(Little, 2005) Little, T. (2005) -Context Adaptive Agility: Managing Complexity and Uncertainty -
IEEE Software, Vol. 22, No. 2.
(Lowrance, 1976) Lowrance W.W. (1976) - Of acceptable risk - William Kaufmann
(Luers and al., 2003) Luers, A., Lobell, D., Sklar, L.S., Addams, C.L. and Matson, P.M. (2003) - A
method for quantifying vulnerability, applied to the Yaqui Valley, Mexico - Global Environmental
Change 13, 255–267.
(Lundin, 1995) Lundin, R.A. (1995) - Editorial: Temporary Organizations and Project
Management - Scandinavian Journal of Management, vol. 11, No. 4, pp. 315-318.
M. (Maestroni and al., 2007) Maestroni M.-L., Theou N., Prognon P. and Bonan B. (2007) - Economic
impact of programmed 5-fluorouracil (5FU) chemotherapy compounding in a reconstitution unit -
34th ESCP, Springer, Paris.
(Mahalanobis, 1936) Mahalanobis, P.C. (1936) - On the generalised distance in statistics -
Proceedings of the National Institute of Sciences of India 2 (1): 49–55.
(Mahmoodzadeh and al, 2007) Mahmoodzadeh, S., Shahrabi, J., Pariazar, M. and M. S. Zaeri
(2007) - Project Selection by Using Fuzzy AHP andTOPSIS Technique - World Academy of
Science, Engineering and Technology 30 2007
(Marle and Bocquet, 2001) Marle, F. and Bocquet, J.C. (2007) - A multi-project management
approach for improved planning process - International Conference on Engineering Design,
ICED’01, Glasgow, Ecosse
(Marle and Vidal, 2008) Marle, F. and Vidal, L.A. (2008) - Potential applications of DSM
principles in project risk management - Proceedings of the 10th Design Structure Matrix
Conference, 2008. Stockholm, Sweden.
(Marle, 2002) Marle, F. (2002) - Modèle d’informations et méthodes pour aider à la prise de
décision en management de projets - Thèse en Génie Industriel de l’Ecole Centrale Paris.

- 192 -
(Marle, 2009) Marle, F. (2009) - Project risk management methodologies: a critical state of the art
- Working paper, Ecole Centrale Paris.
(Maskrey, 1989) Maskrey, A. (1989) - Disaster Mitigation: A Community-Based Approach -
Oxford, Oxfam.
(Millhiser and Solow, 2007) Millhiser, W.P. and Solow, D. (2007) - How large should a complex
system be? An application in organizational teams - Complexity, Vol. 12, Issue 4, pp. 54-70.
(Morel & Ramanujam, 1999) Morel, B. and Ramanujam, R. (1999) - Through the looking glass of
complexity : the dynamics of organizations as adaptive and evolving systems - Organization
science Vol.10, No.3, pp.278-293
(Morrison, 1967) Morrison, D.F. (1967) - Multivariate Statistical Methods - McGraw-Hill Book
Co., New York.
N. (Nassar and Hegab, 2006) Nassar, K. M. and Hegab, M. Y. (2006) - Developing a complexity
measure for schedules - Journal of Construction Engineering and Management, 132 (6), 554-561.
(Newell, 2004) Newell, S. (2004) - Enhancing Cross-Project Learning - Engineering Management
Journal, 16:1, pp. 12–20.
O. (Okoli and Pawlowski, 2004) Okoli, C. and Pawlowski, S.D. (2004) - The Delphi method as a
research tool: an example, design considerations and application - Information & Management 42:
15-29.
P. (Packendorff, 1995) Packendorff, J. (1995) - Inquiring into the Temporary Organization: New
Directions for Project Management Research - Scandinavian Journal of Management, vol. 11, No.
4, pp. 319-333.

- 193 -
(Parsons-Hann and Liu., 2005) Parsons-Hann, H. and Liu, K. (2005) - Measuring requirement
complexity to increase the probability of project success - Working Paper Informatics Research
Centre, The University of Reading, Reading, Berkshire
(Pearce, 2005) Peace, D.J. (2005) - Some directed graph algorithms and their application to
pointer analysis - Ph.D. thesis, Imperial College, London.
(Penalva, 1997) Penalva, J.M. (1997) - La modélisation par les systèmes en situations complexes -
Thèse en sciences de Parix XI Orsay préparée au Laboratoire d’Informatique appliquée de
Commissariat à l’Energie Atomique.
(Pender, 2001) Pender, S. (2001) - Managing incomplete knowledge: why risk management is not
sufficient - International Journal of Project Management, Vol.19, Issue 1, pp.79_87
(Perrow, 1984) Perrow, C. (1984) - Normal accidents : living with high risk technologies - Basic
Books, New York.
(Perry and al., 2006) Perry, M., Dulio, A. and Cubanski, J. (2006) - Voices of beneficiaries:
Medicare Part D insights and observations one year later - Kaiser Family Foundation report.
(Pich and al., 2007) Pich, M.T., Loch, C.H. and De Meyer, A. (2002) - On uncertainty, ambiguity,
and complexity in project management - Management Science Vol.48, No.8, pp 1008-1023.
(Pingaud and Gourc, 2003) Pingaud, H. and Gourc, D. (2003) - Démarche de pilotage d'un projet
industriel par l'analyse des risques - 5ème Congrès International de Génie Industriel, Laval,
Canada
(PMI, 2004) PMI (2004) - A guide to the project management body of knowledge (PMBOK) (2004
ed.) - Newton Square, PA, USA, Project Management Institute.
(Pothen and al. 1990) Pothen, A., Horst D.S. and Kang-Pu L. (1990) - Partitioning sparse matrices
with eigenvectors of graphs - SIAM J. Matrix Anal. Appl. 11(3), 430–452.
(Prigogine, 1996) Prigogine, I. (1996) - La fin des certitudes - Odile Jacob.
(Pritchard, 1997) Pritchard, C.L. (1997) - Risk Management: Concepts and Guidance - Arlington,
VA: ESI International.

- 194 -
R. (Ravalison, 2004) Ravalison, B. (2004) - Méthodologie d'identification des risques des projets de
systèmes d'information: quelle place pour les acteurs? - Congrès EDSYS, Toulouse.
(Raz and Hillson, 2005) Raz, T. and Hillson, D. (2005) - A comparative review of risk management
standards. - Risk Management: An international journal, 7 (4): p. 53-66.
(Rendl and Wolkowicz, 1990) Rendl, F. and Wolkowicz H. (1990) - A Projection Technique for
Partitioning the Nodes of Graph - Technical Report, University of Technology, Graz.
(Rodgers and Nicewander, 1988) Rodgers, J. L. and Nicewander, W.A. (1988) - Thirteen Ways to
Look at the Correlation Coefficient - The American Statistician, 42, 59-66.
(Rodrigues and Bowers, 1996) Rodrigues, A. and Bowers, J. (1996) - The role of system dynamics
in project management - International Journal of Project Management Vol.14, No. 4, pp. 213-220.
(Rowe, 1977) Rowe, W.D. (1977) - An anatomy of risk - Wiley
(Roy, 1968) Roy, B. (1968) - Classement et choix en présence de points de vue multiples: la
méthode ELECTRE - RIRO, no. 8, pp. 57-75.
(Roy, 1978) Roy, B. (1978) -ELECTRE HI: Un algorithme de classement fondé sur une
représentation floue des préférences en présence de critères multiples - Cahiers du CERO, Vol.
20, pp. 3-24.
(Roy, 1985) Roy, B. (1985) - Méthodologie multicritère d'aide a la décision - Economica, Paris.
S. (Saaty, 1977) Saaty, T. (1977) - A scaling method for priorities in hierarchical structures - Journal
of Mathematical Psychology, 15, p. 234-281.
(Saaty, 1980) Saaty, T. (1980) - The Analytic Hierarchy Process: Planning, Priority Setting,
ResourceAllocation - McGraw-Hill.
(Saaty, 1981) Saaty, T.L. (1981) - The Analytical Hierarchy Process - McGraw Hill, New York,
NY.

- 195 -
(Saaty, 1990) Saaty, T.L. (1990) - How to make a decision: the analytic hierarchy process -
European Journal of Operational Research, 48, 9-26.
(Saaty, 2003) Saaty, T. L. (2003) -Decision making in complex environments - Super Decisions.
(Schaeffer, 2007) Schaeffer, S.E. (2007) - Graph clustering - Computer Science Review I, 27-64
(Schindler and al., 2007) Schindler, A., Bocquet, J.C. and Dudézert, A. (2007) - Systemic
approach as a multi-criteria design method: healthcare R&D centre application - International
Conference on Engineering Design, ICED'07, Paris, France.
(Schindler and Eppler, 2003) Schindler, M. and Eppler, M. (2003) - Harvesting Project
Knowledge: A Review of Project Learning Methods and Success Factors - International Journal of
Project Management. 21, 219-228.
(Schlindwein and Ison, 2005) Schlindwein, S. and Ison, R. (2005) - Human knowing and perceived
complexity: implications for systems practice - Emergence: complexity & organisation Vol. 6, No.
3, pp.19.24
(Schmidt and al., 2001) Schmidt, R., K., Lyytinen, K., Keil, M. and Cule, P. (2001) - Identifying
software project risks: an international Delphi study - Journal of Management Information
Systems 17(4): 5-36.
(Schneider, 2008) Schneider, C. (2008) - Fences and Competition in Patent Races - International
Journal of Industrial Organization, 26(6), 1348-1364.
(Scoones, 1998) Scoones, I. (1998) - Sustainable rural livelihoods. A framework for analysis - IDS
Working Paper No. 72. IDS, Brighton.
(Shahare and Gurumoorthy, 2007) Shahare, M. and Gurumoorthy, B. (2007) - Towards defining
context - International Conference on Engineering Design, ICED'07, Paris, France.
(Shannon, 1948) Shannon, C.E. (1948) - The mathematical theory of communication - Bell
Systems Technological Journal, No. 27, pp.379-423.
(Shenhar and Dvir, 2007) Shenhar, A.J. and Dvir, D. (2007) - Reinventing Project Management -
The diamond approach to successful growth and innovation - Harvard Business School Press,
Part one: chapters 1-3. Boston.

- 196 -
(Shenhar, 2007) Shenhar, A.J. (2007) - Introduction - in Shenhar, A.J., Milosevic, D., Dvir D. and
Thamhain, H. (Eds.) Linking Project Management to Business Strategy, Newtown Square,
Pennsylvania, Project Management Institute, Inc.
(Sherwood Jones and Anderson, 2005) Sherwood Jones, B. and Anderson, P. (2005) - Diversity as
a determinant of system complexity - GIST technical report G 2005-1. 2nd Workshop on
complexity in design and engineering.
(Shi and Malik, 2000) Shi, J. and Malik, J. (2000) - Normalized Cuts and Image Segmentation -
IEEE Transactions on Pattern Analysis and Machine Intelligence, v.22 n.8, p.888-905
(Sima and Schaeffer, 2006) Sima, J. and Schaeffer, S.E. (2006) - On the NP-completeness of some
graph cluster measures - Proceedings of the SOFSEM 2006 Thirty-Second International
Conference on Current Trends in Theory and Practice of Informatics, 530-537
(Simon, 1981) Simon, H.A., (1981) - The Sciences of the artificial - Cambridge The MIT Press.
(Simon, 1991) Simon, H. A. (1991) - Bounded rationality and organizational learning -
Organization Science, 2: 125–134.
(Simpson and Cochran, 1987) Simpson, G. W. and Cochran J. K. (1987) - An Analytical approach
to programming construction projects - Civil Engineering Systems, 4, 185-190.
(Sinha and al., 2001) Sinha, S., Thomson, A.I. and Kumar, B. (2001) - A complexity index for the
design process - International Conference on Engineering Design, ICED’01, Vol.1, Glasgow,
pp.157-163, Professional Engineering Publishing, Bury St Edmunds.
(Skulmoski and al. 2007) Skulmoski, G.J., Hartman, F.T. and Krahn, J. (2007) - The Delphi
Method for Graduate Research - The Journal of Information Technology Education 6.
(Sosa and al., 2004) Sosa, M., Eppinger S. and Rowles C. (2004) - The misalignment of product
architecture and organizational structure in complex product development - Management
Science, 50(12): p. 1674-1689.
(Sosa and al., 2005) Sosa, M., Agrawal, A., Eppinger, S.D. and Rowles, C.M. (2005) - A network
approach to define modularity of product components - Proceedings of ASME Design Theory and
Methodology Conference, DETC2005/DTM-85422, Long Beach, California, USA.

- 197 -
(Stal Le Cardinal, 2000) Stal Le Cardinal J. (2001) - Etude des dysfonctionnements dans la prise
de décision. Application au choix d'acteur. - Thèse de doctorat de l'Ecole Centrale de Paris
(Steffens and al., 2007) Steffens W., Martinsuo M. and Artto K. (2007) - Change decisions in
product development projects - International Journal of Project Management 25(7): 702–713.
(Steward, 1981) Steward, D. (1981) - The Design Structure Matrix: a method for managing the
design of complex systems - IEEE Transactions in Engineering Management 28(3): 71-74.
(Strauss, 1997) Strauss, J. S. (1997) - Processes of healing and the nature of schizophrenia - In H.
D. Brenner, W. Boker, & R. Genner (Eds.), Towards a comprehensive therapy for schizophrenia,
pp.252-261, Kirkland, WA: Hogrefe & Huber.
T. (Tanimoto, 1957) Tanimoto, T. (1957) - IBM Internal Repor November 17 1957 - IBM
(Taslicali and Ercan, 2006) Taslicali A.K. and Ercan S. (2006) - The analytic hierarchy & the
analytic network processes in multicriteria decision making: A comparative study - Journal of
Aeronautics and Space Technologies, Volume 2, Number: 4, p. 55-65
(Tavistock 1966) Tavistock Institute (1966) - Interdependence and uncertainty - London:
Tavistock publications
(Tecle, 1988) Tecle, A. (1988) - A decision methodology for the resource utilization of rangeland
watersheds - PhD thesis, School of Renewable Natural Resources, University of Arizona
(Temperley, 1981) Temperley, H.M.V. (1981) - Graph Theory and Applications - England: Ellis
Horwood Ltd.
(The Standish Group, 2000) The Standish Group (2000) - Extreme Chaps - The Standish Group
(Theys, 1987) Theys, J. (1987) - La société vulnérable - in Jean Louis Fabiani et Jacques Theys
(dir.) La société vulnérable. Evaluer et maîtriser les risques, Presses de l'Ecole Normale
Supérieure, pp. 3-35.

- 198 -
(Trevino and Anantatmula, 2008) .Trevino S. and Anantatmula V. (2008) -Capitalizing from the
past projects, The Value of Lessons Learned - Project Management Institute Research
Conference, Warsaw, Poland
(Turner and al, 1988) Turner, W.S., Langerhorst, R.P., Hice, G.F., Eilers, H.B. and Uijttenbroek,
A.A. (1988) - SDM: system development methodology - North-Holland.
(Turner and Müller, 2003) Turner, J. R., and Müller, R. M. (2003) - On the nature of projects as
temporary organizations - International Journal of Project Management, 21(1).
U. (Ulrich and Probst, 1988) Ulrich, H. and Probst, G.J.B. (1988) - Anleitung zum ganzheitlichen
Denken und Handeln, ein Brevier fur Führungskräfte - Bern, Haupt
V. (Vidal and al. 2007) Vidal, L.A., Marle, F. and Bocquet, J.C. (2007) - Modelling project complexity
- International Conference on Engineering Design, ICED'07, Paris, France.
(Vidal and al., 2008) Vidal, L.A., Marle, F. and Bocquet, J.C. (2008) - Project complexity
understanding and modeling to assist project management - PMI Research Conference, 2008.
Warsow, Poland.
(Vidal and al., 2009a) Vidal, L.A., Sahin, E., Martelli, N., Berhoune, M. and Bonan, B. (2009 - To
be published) - Using the AHP to select anticancer drugs to produce by anticipation - Expert
Systems With Applications.DOI 10.1016/j.eswa.2009.06.067
(Vidal and al., 2009b) Vidal, L.A., Marle, F. and Bocquet, J.C. (2009) - Interactions-based
clustering to assist project management. International Conference on Engineering Design. 2009.
Stanford, United States of America.
(Vidal and Marle, 2008) Vidal, L.A. and Marle, F. (2008) - Understanding project complexity:
implications on project management. Kybernetes, the International Journal of Systems,
Cybernetics and Management Science
(Von Bertalanffy, 1972) Von Bertalanffy, L. (1972) - Théorie Générale des Systèmes - Paris,
Dunod

- 199 -
W. (Waits and al. 1993) Watts, M.J. and Bohle, H.G. (1993) - The space of vulnerability: the causal
structure of hunger and famine - Progress in Human Geography, 17, 1, 43- 67.
(Ward, 1999) Ward, S.C. (1999) - Assessing and managing important risks - International Journal
of Project Management, Vol.17, Issue 6, pp. 331-336
(Williams, 1995) Williams, T.M. (1995) - A classified bibliography of research relating to project
risk - European Journal of Operational Research, 85, 18-38.
(Williams, 1996) Williams, T.M (1996) - The two-dimensionality of project risk - International
Journal of Project Management, 14, 3, 185-186.
(Williams, 1999) Williams, T.M. (1999) - The need for new paradigms for complex projects -
International Journal of Project Management, Vol. 17, No. 5, pp 269-273
(Williams, 2003) Williams, T.M. (2003) - The contribution of mathematical modelling to the
practice of project management - IMA Journal of Management Mathematics 14(1):3-30
Z. (Zhang, 2007) Zhang, H. (2007) - A redefinition of the project risk process: Using vulnerability to
open up the event-consequence link - International Journal of Project Management, Volume 25,
Issue 7, Pages 694-701


Résumé Un projet est un effort temporaire et unique entrepris pour fournir un résultat. Ce résultat est toujours un changement pour l'organisation, qu’il prenne effet dans ses processus, sa performance, ses produits ou services. De nombreux manques ont été détectés tant dans le monde industriel que dans le monde académique dans la mesure où les paramètres usuels (délai, coût, qualité) ne sont clairement plus suffisants pour permettre de décrire et gérer le projet à un instant t. Dès lors, les méthodes actuelles ne sont plus suffisantes pour répondre aux enjeux grandissant de la complexité projet, source de nombreux risques. Cette thèse de doctorat propose de penser le management de projet dans ces contextes de complexité en cherchant à comprendre comment des aspects liés à la complexité peuvent être intégrés plus efficacement dans les pratiques de management de projet, et plus particulièrement dans le processus de management des risques projets. Elle commence par définir les concepts nécessaires puis vise à décrire dans un premier temps ce qu’est la complexité projet grâce à l’élaboration d’un référentiel de complexité projet. Ce référentiel est ensuite raffiné à travers la réalisation d’une étude Delphi internationale. Ce référentiel raffiné permet alors de construire une structure hiérarchique de type Analytic Hierarchy Process (AHP) et d’en déduire un indicateur relatif de complexité projet. En pratique cette approche permet notamment d’identifier les projets les plus complexes à l’intérieur d’un portefeuille ou les zones les plus complexes à l’intérieur d’un projet, afin d’assister le management de projets complexes. Ensuite, ce rapport a l’ambition de décrire les conséquences de la complexité projet et de comprendre en quoi les méthodes actuelles de management des risques projet ne permettent pas de prendre en compte convenablement certains effets de la complexité. Cette thèse de doctorat propose alors deux approches innovantes pour assister le management des risques des projets complexes. La première est une approche fondée sur la pensée systémique et qui repose sur l’introduction du concept de vulnérabilité projet. La seconde se fonde quant à elle principalement sur une approche analytique dont l’ambition est de regrouper les risques en fonction de leur niveau d’interaction potentielle (en termes de possibilité de relation de cause à effet) afin de faciliter la coordination. L’ensemble des résultats est testé et illustré grâce à des études de cas diverses (dans les secteurs de l’industrie automobile, pharmaceutique, du spectacle et de la construction). Mots clés : Projet, Management de Projet, Complexité, Risque, Aide à la décision, Analyse systémique, AHP, Vulnérabilité, Partitionnement de graphe. Abstract A project is a temporary and unique endeavour undertaken to deliver a result. This result is always a change in the organization, whatever it is in its processes, performance, products or services. Limits and lacks have been detected in research as well as in industry about the project predictability, since usual parameters (time, cost and quality) are clearly not sufficient to describe properly the complete situation at a given time. As a whole, current methods have shown their limits, since they cannot face anymore the stakes of ever growing project complexity, which is an ever growing source of project risks. This Ph.D. thesis aims at thinking project management in the age of complexity and understand how complexity aspects can be integrated into project management practices, particularly in the case of the project risk management process. After defining concepts, this thesis aims at describing project complexity thanks to the elaboration of a project complexity framework, which is refined thanks to an international Delphi study. This refined framework is then the basis of an Analytic Hierarchy Process (AHP) hierarchical structure which permits to build a relative project complexity index in order to assist decision-making. For all practical purposes, it notably permits to focus on the most complex projects within a portfolio or on the most complex zones of a project in order to assist complex project management. Then, after describing the consequences of project complexity and understanding the limits of existing project risk management processes to cope with some complexity-related aspects, this Ph.D. thesis proposes two innovative approaches to assist complex project risk management. The first one is based on a systems approach through the introduction of the concept of project vulnerability. The second one is mainly based on an analytical approach which aims at clustering project risks according to the strength of their interactions (in terms of possible cause-consequence link). Diverse industrial case studies permit to test these proposals (automotive, pharmaceutical, entertainment and construction industries). Keywords : Project, Project management, Complexity, Risk, Decision-making, Systems analysis, AHP, Vulnerability, Graph clustering.