thinking in data workshop
TRANSCRIPT
Thinking About Your Data
David Weisman, Ph.D.
LATEX compile time: November 9, 2014, 07:47
© 2014 David Weisman. All rights reserved.
If you’d like to use this material for any purpose,please contact [email protected].
All names and stories are fictitious unless otherwise noted.
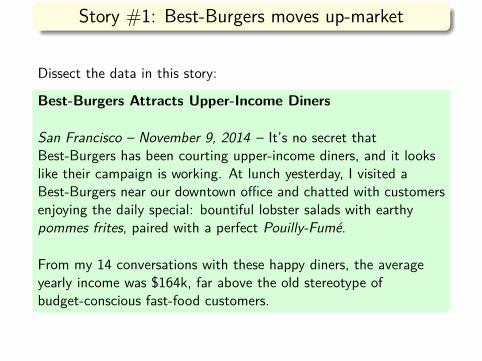
Story #1: Best-Burgers moves up-market
Dissect the data in this story:
Best-Burgers Attracts Upper-Income Diners
San Francisco – November 9, 2014 – It’s no secret thatBest-Burgers has been courting upper-income diners, and it lookslike their campaign is working. At lunch yesterday, I visited aBest-Burgers near our downtown office and chatted with customersenjoying the daily special: bountiful lobster salads with earthypommes frites, paired with a perfect Pouilly-Fume.
From my 14 conversations with these happy diners, the averageyearly income was $164k, far above the old stereotype ofbudget-conscious fast-food customers.
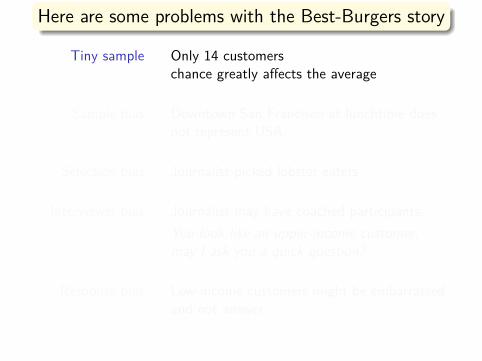
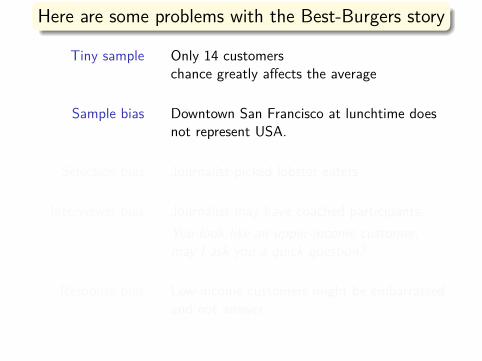
Here are some problems with the Best-Burgers story
Tiny sample Only 14 customerschance greatly affects the average
Sample bias Downtown San Francisco at lunchtime doesnot represent USA.
Selection bias Journalist picked lobster eaters
Interviewer bias Journalist may have coached participants:You look like an upper-income customer,may I ask you a quick question?
Response bias Low-income customers might be embarrassedand not answer.
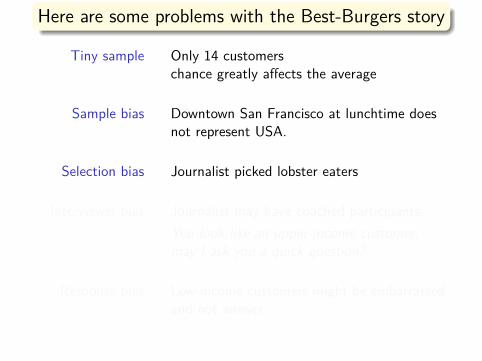
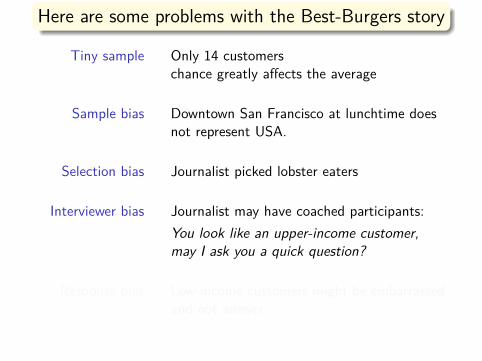
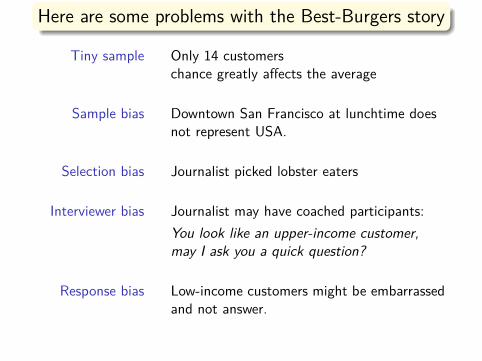
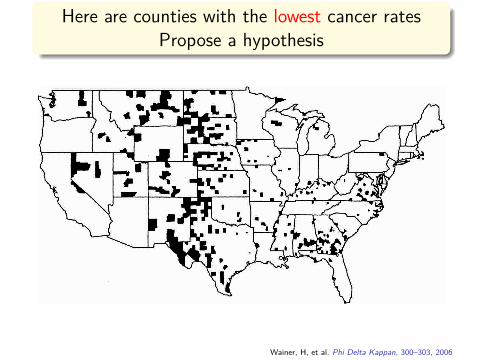
Here are counties with the lowest cancer ratesPropose a hypothesis
Wainer, H, et al. Phi Delta Kappan, 300–303, 2006
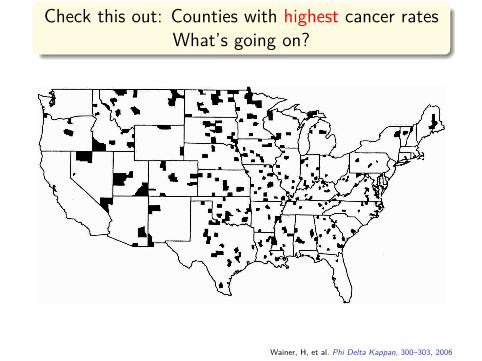
Check this out: Counties with highest cancer ratesWhat’s going on?
Wainer, H, et al. Phi Delta Kappan, 300–303, 2006
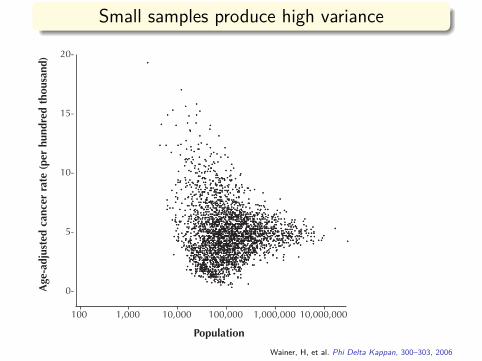
Small samples produce high varianceFIGURE 3.
Age-adjusted
can
cer rate (per hundred thousand) 20-
15-
10-
5-
0-
100 1,000 10,000 100,000 1,000,000 10,000,000
Population
Wainer, H, et al. Phi Delta Kappan, 300–303, 2006
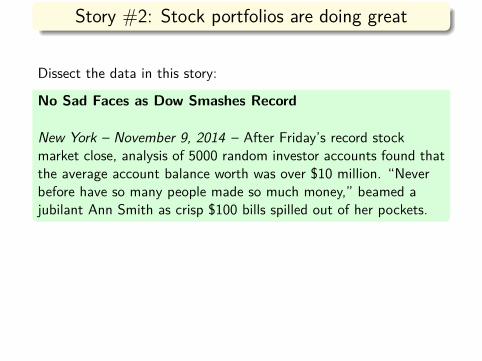
Story #2: Stock portfolios are doing great
Dissect the data in this story:
No Sad Faces as Dow Smashes Record
New York – November 9, 2014 – After Friday’s record stockmarket close, analysis of 5000 random investor accounts found thatthe average account balance worth was over $10 million. “Neverbefore have so many people made so much money,” beamed ajubilant Ann Smith as crisp $100 bills spilled out of her pockets.
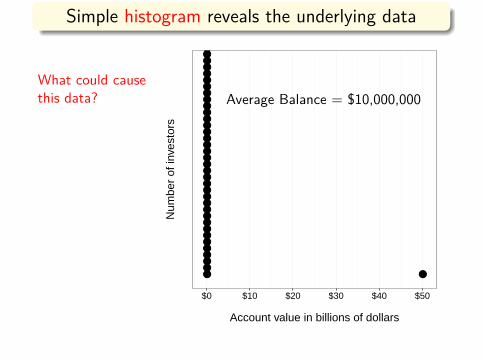
Simple histogram reveals the underlying data
●●●●●●●●●●●●●●●●●●●●●●●●●●●●●●●●●●●●●
●
$0 $10 $20 $30 $40 $50
Account value in billions of dollars
Num
ber
of in
vest
ors
Average Balance = $10,000,000What could causethis data?
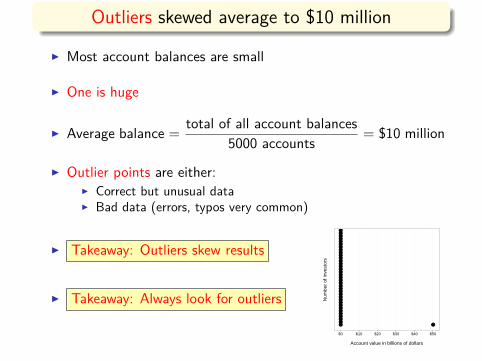
Outliers skewed average to $10 million
I Most account balances are small
I One is huge
I Average balance = total of all account balances5000 accounts = $10 million
I Outlier points are either:I Correct but unusual dataI Bad data (errors, typos very common)
I Takeaway: Outliers skew results
I Takeaway: Always look for outliers●●●●●●●●●●●●●●●●●●●●●●●●●●●●●●●●●●●●●
●
$0 $10 $20 $30 $40 $50
Account value in billions of dollars
Num
ber
of in
vest
ors
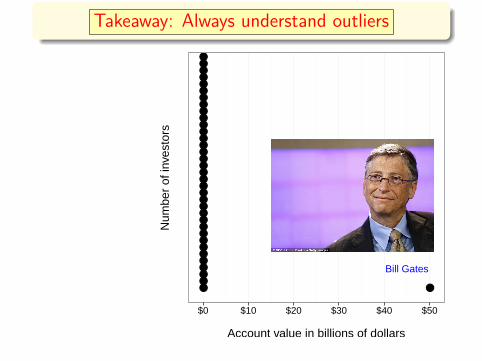
Takeaway: Always understand outliers
●●●●●●●●●●●●●●●●●●●●●●●●●●●●●●●●●●●●●
●
Bill Gates
$0 $10 $20 $30 $40 $50
Account value in billions of dollars
Num
ber
of in
vest
ors
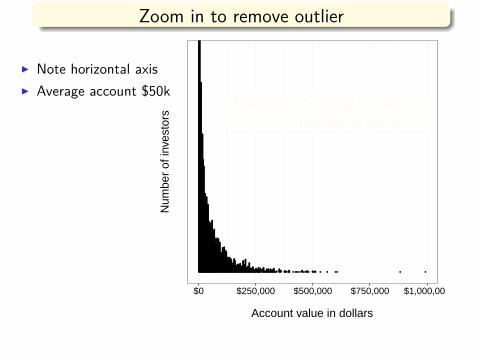
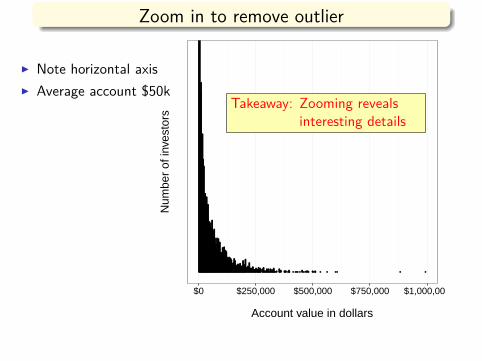
Zoom in to remove outlier
●●●●●●●●●●●●●●●●●●●●●●●●●●●●●●●●●●●●●●●●●●●●●●●●●●●●●●●●●●●●●●●●●●●●●●●●●●●●●●●●●●●●●●●●●●●●●●●●●●●●●●●●●●●●●●●●●●●●●●●●●●●●●●●●●●●●●●●●●●●●●●●●●●●●●●●●●●●●●●●●●●●●●●●●●●●●●●●●●●●●●●●●●●●●●●●●●●●●●●●●●●●●●●●●●●●●●●●●●●●●●●●●●●●●●●●●●●●●●●●●●●●●●●●●●●●●●●●●●●●●●●●●●●●●●●●●●●●●●●●●●●●●●●●●●●●●●●●●●●●●●●●●●●●●●●●●●●●●●●●●●●●●●●●●●●●●●●●●●●●●●●●●●●●●●●●
●●●●●●●●●●●●●●●●●●●●●●●●●●●●●●●●●●●●●●●●●●●●●●●●●●●●●●●●●●●●●●●●●●●●●●●●●●●●●●●●●●●●●●●●●●●●●●●●●●●●●●●●●●●●●●●●●●●●●●●●●●●●●●●●●●●●●●●●●●●●●●●●●●●●●●●●●●●●●●●●●●●●●●●●●●●●●●●●●●●●●●●●●●●●●●●●●●●●●●●●●●●●●●●●●●●●●●●●●●●●●●●●●●●●●●●●●●●●●●●●●●●●●●●●●●●●●●●●●●●●●●●●●●●●●●●●●●●●●●●●●●●●●●●●●●●●●●●●●●●●●●●●●●●●●●●●●●●●●●●●●●●●●●●●●●●●●●●●●●●●●●●●●●●●●●●
●●●●●●●●●●●●●●●●●●●●●●●●●●●●●●●●●●●●●●●●●●●●●●●●●●●●●●●●●●●●●●●●●●●●●●●●●●●●●●●●●●●●●●●●●●●●●●●●●●●●●●●●●●●●●●●●●●●●●●●●●●●●●●●●●●●●●●●●●●●●●●●●●●●●●●●●●●●●●●●●●●●●●●●●●●●●●●●●●●●●●●●●●●●●●●●●●●●●●●●●●●●●●●●●●●●●●●●●●●●●●●●●●●●●●●●●●●●●●●●●●●●●●●●●●●●●●●●●●●●●●
●●●●●●●●●●●●●●●●●●●●●●●●●●●●●●●●●●●●●●●●●●●●●●●●●●●●●●●●●●●●●●●●●●●●●●●●●●●●●●●●●●●●●●●●●●●●●●●●●●●●●●●●●●●●●●●●●●●●●●●●●●●●●●●●●●●●●●●●●●●●●●●●●●●●●●●●●●●●●●●●●●●●●●●●●●●●●●●●●●●●●●●●●●●●●●●●●●●●●●●●●●●●●●●●●●●●●●●●●●●●●●●●●●●●●●●●●●●●●●●●●●●●●●●●●●●●●●●●●●●●●●●●●●●●●●●●●●●●●
●●●●●●●●●●●●●●●●●●●●●●●●●●●●●●●●●●●●●●●●●●●●●●●●●●●●●●●●●●●●●●●●●●●●●●●●●●●●●●●●●●●●●●●●●●●●●●●●●●●●●●●●●●●●●●●●●●●●●●●●●●●●●●●●●●●●●●●●●●●●●●●●●●●●●●●●●●●●●●●●●●●●●●●●●●●●●●●●●●●●●●●●●●●●●●●●●●●●●
●●●●●●●●●●●●●●●●●●●●●●●●●●●●●●●●●●●●●●●●●●●●●●●●●●●●●●●●●●●●●●●●●●●●●●●●●●●●●●●●●●●●●●●●●●●●●●●●●●●●●●●●●●●●●●●●●●●●●●●●●●●●●●●●●●●●●●●●●●●●●●●●●●●●●●●●●●●●●●●●●●●●●●●●●●●●●●●●●●●●●●●●●●●●●●●●●●●●●●●●●●
●●●●●●●●●●●●●●●●●●●●●●●●●●●●●●●●●●●●●●●●●●●●●●●●●●●●●●●●●●●●●●●●●●●●●●●●●●●●●●●●●●●●●●●●●●●●●●●●●●●●●●●●●●●●●●●●●●●●●●●●●●●●●●●●●●●●●●●●●●●●●●●●●●●●●●●●●●●●●●●●●●●●●
●●●●●●●●●●●●●●●●●●●●●●●●●●●●●●●●●●●●●●●●●●●●●●●●●●●●●●●●●●●●●●●●●●●●●●●●●●●●●●●●●●●●●●●●●●●●●●●●●●●●●●●●●●●●●●●●●●●●●●●●●●●●●●●●●●●●●●●●●●●●●●●●●●●●●●●●●●●
●●●●●●●●●●●●●●●●●●●●●●●●●●●●●●●●●●●●●●●●●●●●●●●●●●●●●●●●●●●●●●●●●●●●●●●●●●●●●●●●●●●●●●●●●●●●●●●●●●●●●●●●●●●●●
●●●●●●●●●●●●●●●●●●●●●●●●●●●●●●●●●●●●●●●●●●●●●●●●●●●●●●●●●●●●●●●●●●●●●●●●●●●●●●●●●●●●●●●●●●●●●●●●●●●●●●●●●●●●●●●●●●●
●●●●●●●●●●●●●●●●●●●●●●●●●●●●●●●●●●●●●●●●●●●●●●●●●●●●●●●●●●●●●●●●●●●●●●●●●●●●●●●●●●●●●●●●●●●●●●●●●
●●●●●●●●●●●●●●●●●●●●●●●●●●●●●●●●●●●●●●●●●●●●●●●●●●●●●●●●●●●●●●●●●●●●●●●●●●●●●●●●●●●●●●●●●●●●●●●●●●●●●●●●●●●●●●
●●●●●●●●●●●●●●●●●●●●●●●●●●●●●●●●●●●●●●●●●●●●●●●●●●●●●●●●●●●●●●●●●●●●●●●●●●●●●●●●●●●●●●●●●●●●●●●●●●
●●●●●●●●●●●●●●●●●●●●●●●●●●●●●●●●●●●●●●●●●●●●●●●●●●●●●●●●●●●●●●●●●●●●●●●●●●●●●●●●●●●●●●●●●●●●●●●●●●●
●●●●●●●●●●●●●●●●●●●●●●●●●●●●●●●●●●●●●●●●●●●●●●●●●●●●●●●●●●●●●●●●●●●●●●
●●●●●●●●●●●●●●●●●●●●●●●●●●●●●●●●●●●●●●●●●●●●●●●●●●●●●●●●●●●●●●●●●●●●●●●●●●
●●●●●●●●●●●●●●●●●●●●●●●●●●●●●●●●●●●●●●●●●●●●●●●●●●●●●●●●●●●●●●●●●●●●●●●●
●●●●●●●●●●●●●●●●●●●●●●●●●●●●●●●●●●●●●●●●●●●●●●●●●●●●●●●●●●●●●●●●●
●●●●●●●●●●●●●●●●●●●●●●●●●●●●●●●●●●●●●●●●●●●●●●●●●●●●●●●●●●
●●●●●●●●●●●●●●●●●●●●●●●●●●●●●●●●●●●●●●●●●●●●●●●●●●●●●●●●●●●●●●●●●●●●●●●●●●●●
●●●●●●●●●●●●●●●●●●●●●●●●●●●●●●●●●●●●●●●●●●●●●●●●●●●●●●●●●●●●●
●●●●●●●●●●●●●●●●●●●●●●●●●●●●●●●●●●●●●●●●●●●●●●●●●●●●
●●●●●●●●●●●●●●●●●●●●●●●●●●●●●●●●●●●●●●●●●●●●●●●●●●●●●●●●●●●●●●●
●●●●●●●●●●●●●●●●●●●●●●●●●●●●●●●●●●●●●●●●●●●●●●●●●●
●●●●●●●●●●●●●●●●●●●●●●●●●●●●●●●●●●●●●●●●●●
●●●●●●●●●●●●●●●●●●●●●●●●●●●●●●●●●●
●●●●●●●●●●●●●●●●●●●●●●●●●●●●●●●●●●●●●●●●●●●●●●●●●●
●●●●●●●●●●●●●●●●●●●●●●●●●●●●●●●●●●●●●●●●●●●
●●●●●●●●●●●●●●●●●●●●●●●●●●●●●●●●●●●●●●●●●●●●●●●●●
●●●●●●●●●●●●●●●●●●●●●●●●●●●●●●●●●●●●●
●●●●●●●●●●●●●●●●●●●●●●●●●●●●●●●●●●●●●●●●●●●●
●●●●●●●●●●●●●●●●●●●●●●●●●●●●●
●●●●●●●●●●●●●●●●●●●●●●●●●●●●●
●●●●●●●●●●●●●●●●●●●●●●●●●
●●●●●●●●●●●●●●●●●●●●●●●●●●●●●●●●●●●●
●●●●●●●●●●●●●●●●●●●●●●●●●
●●●●●●●●●●●●●●●●●●●●●●●●●●●●●●●●●●●●●
●●●●●●●●●●●●●●●●●●●
●●●●●●●●●●●●●●●●●●●●●●●●●●●●●●●●
●●●●●●●●●●●●●●●●●●●●●●●●●●●●●●
●●●●●●●●●●●●●●●●●●
●●●●●●●●●●●●●●●●●●●●●●
●●●●●●●●●●●●●●●●●●
●●●●●●●●●●●●●●●●●●●●●●
●●●●●●●●●●●●●●●●●●●●●
●●●●●●●●●●●●●●●●●●●●
●●●●●●●●●●●●●●●●●●
●●●●●●●●●●●●
●●●●●●●●●●●●●
●●●●●●●●●●●●●●
●●●●●●●●●●●●●●●●●●●●
●●●●●●●●●●●●●●●●●
●●●●●●●●●●●
●●●●●●●●
●●●●●●●●●●
●●●●●●●●●●●●
●●●●●●●●●●●
●●●●●●●●●●
●●●●●●●●●●●●●
●●●●●●●●●
●●●●●●●●●
●●●●●
●●●●●●●●●●●●●●●●●
●●●●●●●●●●
●●●●●●●●●●●
●●●●●●●●●●●●●●●●●●●
●●●●●●●
●●●●●●●
●●●●●●●●●
●●●●●●●●
●●●●●●●●●●●●●●
●●●●●●
●●●●●●
●●●●
●●●●●●●●
●●●●
●●●●
●●●●
●●●●●●
●●●●
●●●●
●●●●●●●
●●●●
●●●●●●
●●●●
●●●●●
●●●●●●●
●●
●●
●●
●●●●●
●●●●
●●●●●
● ●●●●●
● ●●●●
● ●●●●●●
●●
● ●●
●●●●●
● ●●●
●●
●●
●●
● ●●●
● ● ● ● ● ● ●●●
● ● ●●
●●
● ●●
● ●●● ● ● ● ● ● ●
$0 $250,000 $500,000 $750,000 $1,000,000
Account value in dollars
Num
ber
of in
vest
ors
I Note horizontal axisI Average account $50k
Takeaway: Zooming revealsinteresting details
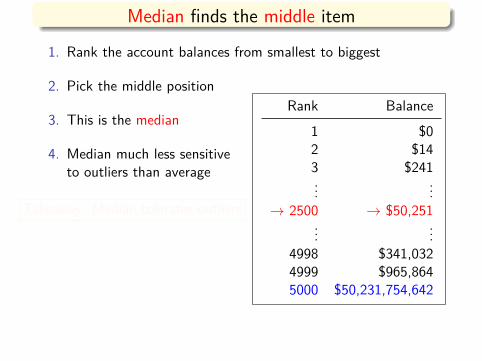
Median finds the middle item1. Rank the account balances from smallest to biggest
2. Pick the middle position
3. This is the median
4. Median much less sensitiveto outliers than average
Rank Balance1 $02 $143 $241... ...
→ 2500 → $50,251... ...
4998 $341,0324999 $965,8645000 $50,231,754,642
Takeaway: Median tolerates outliers
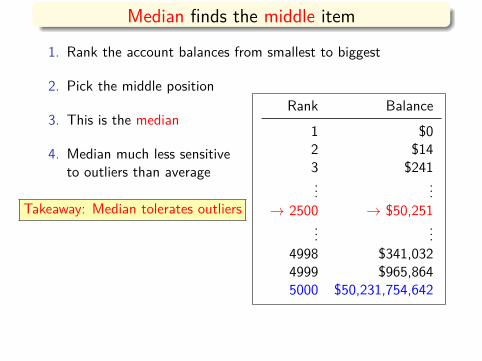
Story #3: Refrigerator prices in deep freeze
Dissect the data in this story:
Refrigerator Prices Stuck in Deep Freeze
Chicago – November 9, 2014 – Median refrigerator prices havebeen flat for the past ten years, despite a flood of new high-endproducts with luxury styling, celebrity endorsements, andhigh-efficiency green technology.
What are some possibilities here?
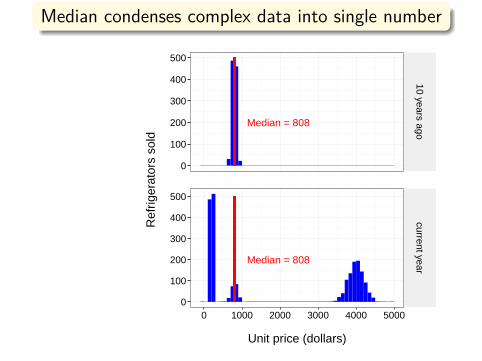
Median condenses complex data into single number
Median = 808
Median = 808
0
100
200
300
400
500
0
100
200
300
400
500
10 years agocurrent year
0 1000 2000 3000 4000 5000
Unit price (dollars)
Ref
riger
ator
s so
ld
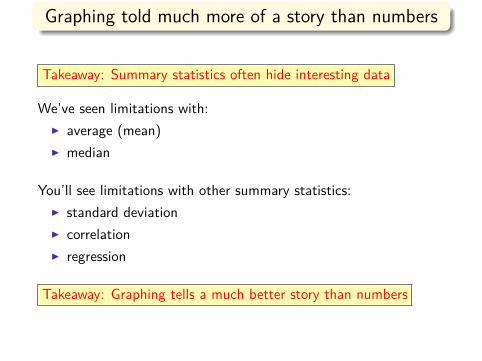
Graphing told much more of a story than numbers
Takeaway: Summary statistics often hide interesting data
We’ve seen limitations with:I average (mean)I median
You’ll see limitations with other summary statistics:I standard deviationI correlationI regression
Takeaway: Graphing tells a much better story than numbers
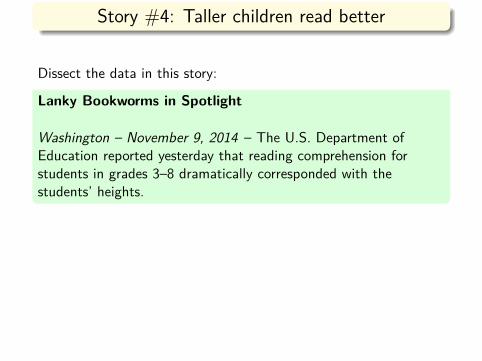
Story #4: Taller children read better
Dissect the data in this story:
Lanky Bookworms in Spotlight
Washington – November 9, 2014 – The U.S. Department ofEducation reported yesterday that reading comprehension forstudents in grades 3–8 dramatically corresponded with thestudents’ heights.
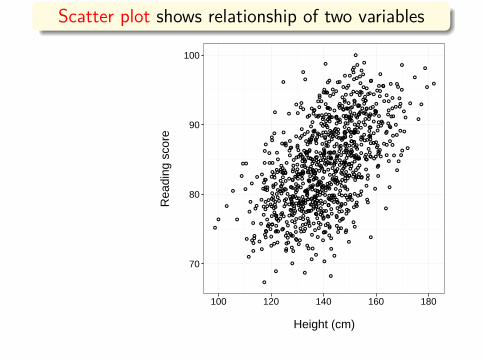
Scatter plot shows relationship of two variables
●
●
●
●
●
●
●
●
●
●
●
●
●
●
●
●
●
●
●
●
●
●
●
●
●
●
●
●
●
●
●
●
●
●
●
●
●
●
●
●
●
●
●
●
●
●
●
●
●
●
●
●
●
●
●
●
●
●
●
●
●
●
●
●
●
●
●
●
●
●
●
●
●
●
●
●
●
●
●
●
●
●
●
●
●
●
●
●
●
●
●
●
●
●
●
●
●
● ●
●
●
●
●
●
●●
●
●
●●
●
●
●
●
●
●
●
●
●
●
●
●
●
●
●
●
●
●
●
●
●
●
●
●
●
●
●
●
●
●
●
●
●
●
●
●
●
●
●
●
●
●
●
●
●
●
●
●
●
●
●
●
●
●
●
●
●
●
●
●
●
●
●
●
●
●
●
●
●
●
●
●
●●
●
●
●
●
●
●
●
●
●
●
●
●
●
●
●
●●
●
●
●
●
●
●
●
●
●
●
●
●
●
●
●
●
●
●
●
●
●
●
●
●
●
●
●
●
●
●
●
●
●
●
●
●
●
●
●
●
●
●
●
●
●
●
●
●
●
●
●
●
●
●
●
●
●
●
●
●
●
●
●
●
●
●
●
●
●
●
●
●
●●
●
●
●●
●
●
●
●
●
●
●
●
●
●
●
●
●
●
●
●
●
●
●
●
●
●
●
●
●
●
●
●
●
●
●
●
●●
●
●
●
●
●●
●
●
●
●
●
●
●
●
●
●
●
●
●
●
●
●
●
●
●
●
●
●
●
●
●
●
●
●
●
●
●
●
●
●
●
●
●
●
●
●
●
●
●
●
●
●
●
●
●
●
●
●
●
●
●
●
●
●
●
●
●
●
●
●
●
●
●
●
●
●
●
●
●
●
●
●
●
●
●
●
●
●●
●
●
●
●●
●
●
●
●
●
●
●
● ●
●
●
●
●
●
●
●●
●
●
●
●
●
●
●
●
●
●
●
●
●
●
●
●
●
●
●
●
●●
●
●
●
●
●
●
●
●
●●
●
●
●
●
●
●
●
●
●
●
●
●
●
●
●
●
●
●
●
●
●
●
●
●
●
●
●
●
●
●
●
●
●
●
●
●●
●
●
● ●
●
●
●●
●
●
●
●
●
●●
●
●
●
●
●
●
●
●
●
●
●
●
●
●
●
●
●
●
●
●
●●
●
●
●
●●
●
●
●
●
●
●
●
●
●
●
●
●
●
●
●
●
●
●
●
●
●
●
●
●
●
●●
●●
●
●
●
●
●
●
●●
●
●
●
●
●
●●
●
●
●
●
●
●●
●
●
●
●
●
●
●
●
●
●
●
●
●
● ●
●
●
●
●
●
●
●
●
●
●
●
●
●
●
●
●
●
●
●
●
●
●
●
●
●
●
●
●
●
●
●
●
●
●
●
●
●
●
●
●
●
●
●
●
●
●
●
●
●
●
●
●
●
●
●
●
●
●
●
●
●
●
●
●
●
●
●
●
●
●
●
●
●
●
●
●
●
●
●
●●
●
●
●
●
●
●
●
●
●
●
●
●
●
●
●
●
●
●
●
●
●
●
●
●
●
●
●
●
●
●
●
●
●
●
●
●
●
●
●
●●
●
●
●
●
●
●
●
●
●
●
●
●
●●
●
●
●
●
●
●
●
●
●
●
●
●
●
●
●
●
●
●
●
●
●
●
●
●
●●
●
●
●
●
●
●●
●
●
●
●
●
●
●
●
●●
●
●
●
●
●
●
●
●
●
●
●
●
●
●
●
●
●
●
●
●
●
●
●
●
●
●
●
●
●
●
●
●
●
●
●
●
●
●
●
●
●●
●
●
●
●
●
●●
●
●
●
●●
●
●
●
●
●
●
●
●
●
●
●
●
●
●
●
●
●
●
●
●
●
●
●
●
●
●
●
●
●
●
●
●
●●
●
●
●
●
●
●
●
●
●
●
●●
●
●
●
●
●
●
●
●
●
●
●
●
●
●
●
●
●
●
●
●
●
●
●
●
●
●
●
●
●
●
●
●
●
●
●
●
●
●
●
●
●
●
●
●
●
●
●
●
●
●
●
●
●
●
●
●
●
●
●
●
●
●
●
●
●
●●
●
●
●
●
●
●
●
●
●
●
●●
●
●
●
●
●
●
●
●
●
●
●
●
●
●
●
●
●
●
●●
●●
●
●
●
●
●
●
●
●
●
●
●
●
●
●
●
●
●
●
●
70
80
90
100
100 120 140 160 180
Height (cm)
Rea
ding
sco
re
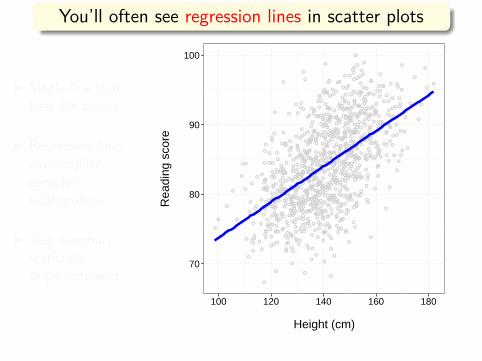
You’ll often see regression lines in scatter plots
●
●
●
●
●
●
●
●
●
●
●
●
●
●
●
●
●
●
●
●
●
●
●
●
●
●
●
●
●
●
●
●
●
●
●
●
●
●
●
●
●
●
●
●
●
●
●
●
●
●
●
●
●
●
●
●
●
●
●
●
●
●
●
●
●
●
●
●
●
●
●
●
●
●
●
●
●
●
●
●
●
●
●
●
●
●
●
●
●
●
●
●
●
●
●
●
●
● ●
●
●
●
●
●
●●
●
●
●●
●
●
●
●
●
●
●
●
●
●
●
●
●
●
●
●
●
●
●
●
●
●
●
●
●
●
●
●
●
●
●
●
●
●
●
●
●
●
●
●
●
●
●
●
●
●
●
●
●
●
●
●
●
●
●
●
●
●
●
●
●
●
●
●
●
●
●
●
●
●
●
●
●●
●
●
●
●
●
●
●
●
●
●
●
●
●
●
●
●●
●
●
●
●
●
●
●
●
●
●
●
●
●
●
●
●
●
●
●
●
●
●
●
●
●
●
●
●
●
●
●
●
●
●
●
●
●
●
●
●
●
●
●
●
●
●
●
●
●
●
●
●
●
●
●
●
●
●
●
●
●
●
●
●
●
●
●
●
●
●
●
●
●●
●
●
●●
●
●
●
●
●
●
●
●
●
●
●
●
●
●
●
●
●
●
●
●
●
●
●
●
●
●
●
●
●
●
●
●
●●
●
●
●
●
●●
●
●
●
●
●
●
●
●
●
●
●
●
●
●
●
●
●
●
●
●
●
●
●
●
●
●
●
●
●
●
●
●
●
●
●
●
●
●
●
●
●
●
●
●
●
●
●
●
●
●
●
●
●
●
●
●
●
●
●
●
●
●
●
●
●
●
●
●
●
●
●
●
●
●
●
●
●
●
●
●
●
●●
●
●
●
●●
●
●
●
●
●
●
●
● ●
●
●
●
●
●
●
●●
●
●
●
●
●
●
●
●
●
●
●
●
●
●
●
●
●
●
●
●
●●
●
●
●
●
●
●
●
●
●●
●
●
●
●
●
●
●
●
●
●
●
●
●
●
●
●
●
●
●
●
●
●
●
●
●
●
●
●
●
●
●
●
●
●
●
●●
●
●
● ●
●
●
●●
●
●
●
●
●
●●
●
●
●
●
●
●
●
●
●
●
●
●
●
●
●
●
●
●
●
●
●●
●
●
●
●●
●
●
●
●
●
●
●
●
●
●
●
●
●
●
●
●
●
●
●
●
●
●
●
●
●
●●
●●
●
●
●
●
●
●
●●
●
●
●
●
●
●●
●
●
●
●
●
●●
●
●
●
●
●
●
●
●
●
●
●
●
●
● ●
●
●
●
●
●
●
●
●
●
●
●
●
●
●
●
●
●
●
●
●
●
●
●
●
●
●
●
●
●
●
●
●
●
●
●
●
●
●
●
●
●
●
●
●
●
●
●
●
●
●
●
●
●
●
●
●
●
●
●
●
●
●
●
●
●
●
●
●
●
●
●
●
●
●
●
●
●
●
●
●●
●
●
●
●
●
●
●
●
●
●
●
●
●
●
●
●
●
●
●
●
●
●
●
●
●
●
●
●
●
●
●
●
●
●
●
●
●
●
●
●●
●
●
●
●
●
●
●
●
●
●
●
●
●●
●
●
●
●
●
●
●
●
●
●
●
●
●
●
●
●
●
●
●
●
●
●
●
●
●●
●
●
●
●
●
●●
●
●
●
●
●
●
●
●
●●
●
●
●
●
●
●
●
●
●
●
●
●
●
●
●
●
●
●
●
●
●
●
●
●
●
●
●
●
●
●
●
●
●
●
●
●
●
●
●
●
●●
●
●
●
●
●
●●
●
●
●
●●
●
●
●
●
●
●
●
●
●
●
●
●
●
●
●
●
●
●
●
●
●
●
●
●
●
●
●
●
●
●
●
●
●●
●
●
●
●
●
●
●
●
●
●
●●
●
●
●
●
●
●
●
●
●
●
●
●
●
●
●
●
●
●
●
●
●
●
●
●
●
●
●
●
●
●
●
●
●
●
●
●
●
●
●
●
●
●
●
●
●
●
●
●
●
●
●
●
●
●
●
●
●
●
●
●
●
●
●
●
●
●●
●
●
●
●
●
●
●
●
●
●
●●
●
●
●
●
●
●
●
●
●
●
●
●
●
●
●
●
●
●
●●
●●
●
●
●
●
●
●
●
●
●
●
●
●
●
●
●
●
●
●
●
70
80
90
100
100 120 140 160 180
Height (cm)
Rea
ding
sco
re
I Single line thatbest fits points
I Regression linesoversimplifycomplexrelationships
I Just summarystatistics:slope, intersect
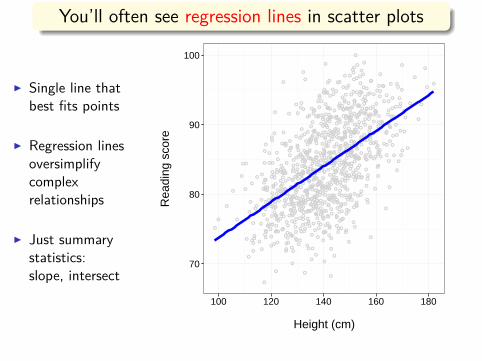
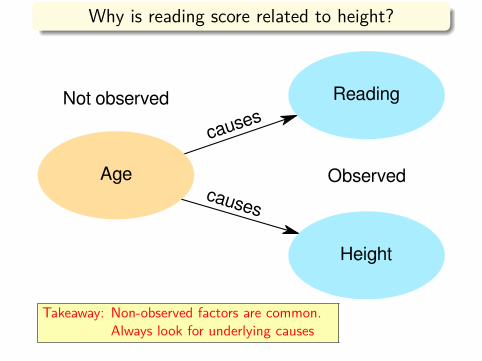
Why is reading score related to height?
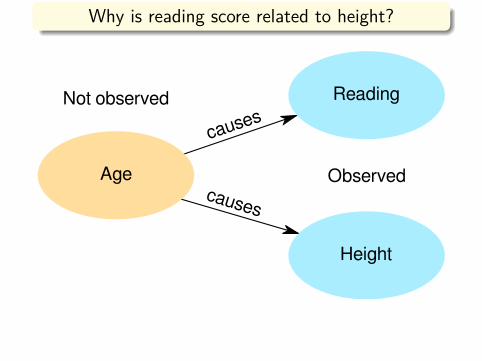
Why is reading score related to height?
Age Observed
Not observed Reading
Height
causes
causes
Why is reading score related to height?
Age Observed
Not observed Reading
Height
causes
causes
Takeaway: Non-observed factors are common.Always look for underlying causes
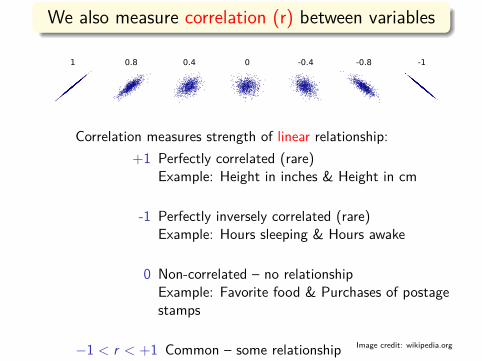
We also measure correlation (r) between variables
1 0.8 0.4 0 -0.4 -0.8 -1
1 1 1 -1 -1 -1
0 0 0 0 0 0 0
Correlation measures strength of linear relationship:+1 Perfectly correlated (rare)
Example: Height in inches & Height in cm
-1 Perfectly inversely correlated (rare)Example: Hours sleeping & Hours awake
0 Non-correlated – no relationshipExample: Favorite food & Purchases of postagestamps
−1 < r < +1 Common – some relationship Image credit: wikipedia.org
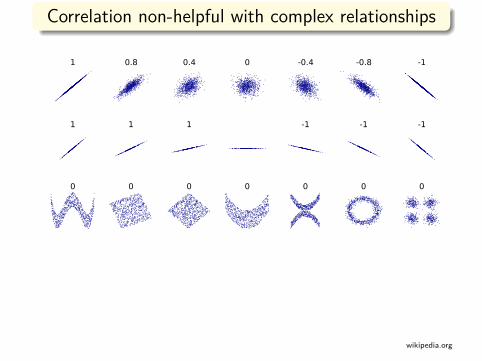
Correlation non-helpful with complex relationships
1 0.8 0.4 0 -0.4 -0.8 -1
1 1 1 -1 -1 -1
0 0 0 0 0 0 0
wikipedia.org
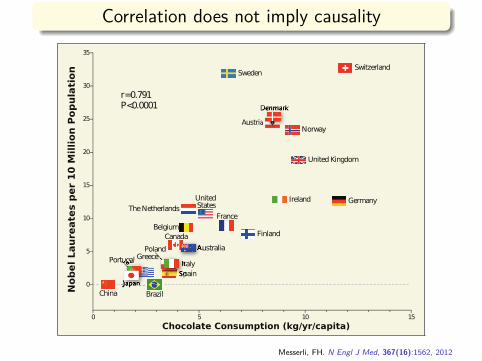
Correlation does not imply causality35
30
25
20
10
5
15
0
0 5 10 15
Chocolate Consumption (kg/yr/capita)
Nob
el Lau
reate
s p
er
10 M
illion
Pop
ula
tion
Poland
SwitzerlandSweden
Norway
China Brazil
GreecePortugal
United States
Germany
France
Finland
Italy
Australia
The Netherlands
CanadaBelgium
United Kingdom
Ireland
Spain
Austria
Denmark
r=0.791P<0.0001
Japan
Messerli, FH. N Engl J Med, 367(16):1562, 2012
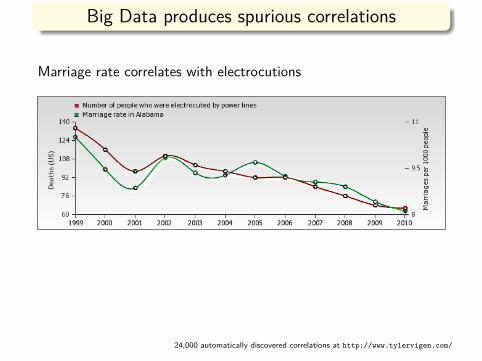
Big Data produces spurious correlations
Marriage rate correlates with electrocutions
24,000 automatically discovered correlations at http://www.tylervigen.com/
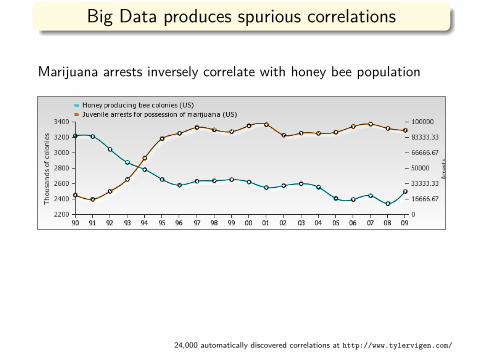
Big Data produces spurious correlations
Marijuana arrests inversely correlate with honey bee population
24,000 automatically discovered correlations at http://www.tylervigen.com/
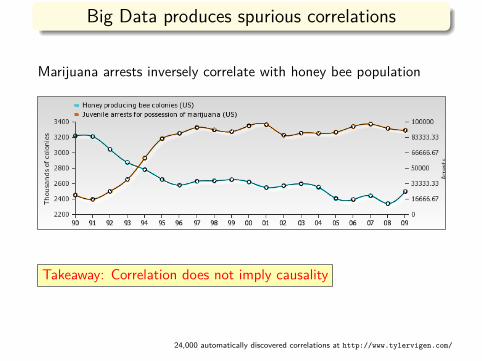
Big Data produces spurious correlations
Marijuana arrests inversely correlate with honey bee population
Takeaway: Correlation does not imply causality
24,000 automatically discovered correlations at http://www.tylervigen.com/
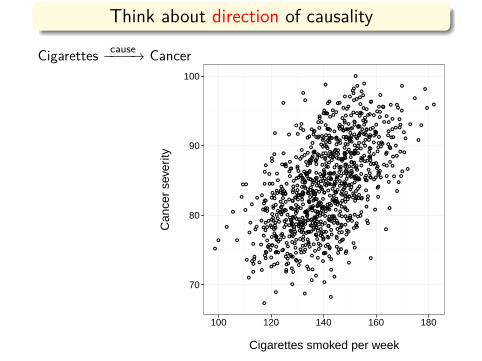
Think about direction of causality
Cigarettes cause−−−−→ Cancer
●
●
●
●
●
●
●
●
●
●
●
●
●
●
●
●
●
●
●
●
●
●
●
●
●
●
●
●
●
●
●
●
●
●
●
●
●
●
●
●
●
●
●
●
●
●
●
●
●
●
●
●
●
●
●
●
●
●
●
●
●
●
●
●
●
●
●
●
●
●
●
●
●
●
●
●
●
●
●
●
●
●
●
●
●
●
●
●
●
●
●
●
●
●
●
●
●
● ●
●
●
●
●
●
●●
●
●
●●
●
●
●
●
●
●
●
●
●
●
●
●
●
●
●
●
●
●
●
●
●
●
●
●
●
●
●
●
●
●
●
●
●
●
●
●
●
●
●
●
●
●
●
●
●
●
●
●
●
●
●
●
●
●
●
●
●
●
●
●
●
●
●
●
●
●
●
●
●
●
●
●
●●
●
●
●
●
●
●
●
●
●
●
●
●
●
●
●
●●
●
●
●
●
●
●
●
●
●
●
●
●
●
●
●
●
●
●
●
●
●
●
●
●
●
●
●
●
●
●
●
●
●
●
●
●
●
●
●
●
●
●
●
●
●
●
●
●
●
●
●
●
●
●
●
●
●
●
●
●
●
●
●
●
●
●
●
●
●
●
●
●
●●
●
●
●●
●
●
●
●
●
●
●
●
●
●
●
●
●
●
●
●
●
●
●
●
●
●
●
●
●
●
●
●
●
●
●
●
●●
●
●
●
●
●●
●
●
●
●
●
●
●
●
●
●
●
●
●
●
●
●
●
●
●
●
●
●
●
●
●
●
●
●
●
●
●
●
●
●
●
●
●
●
●
●
●
●
●
●
●
●
●
●
●
●
●
●
●
●
●
●
●
●
●
●
●
●
●
●
●
●
●
●
●
●
●
●
●
●
●
●
●
●
●
●
●
●●
●
●
●
●●
●
●
●
●
●
●
●
● ●
●
●
●
●
●
●
●●
●
●
●
●
●
●
●
●
●
●
●
●
●
●
●
●
●
●
●
●
●●
●
●
●
●
●
●
●
●
●●
●
●
●
●
●
●
●
●
●
●
●
●
●
●
●
●
●
●
●
●
●
●
●
●
●
●
●
●
●
●
●
●
●
●
●
●●
●
●
● ●
●
●
●●
●
●
●
●
●
●●
●
●
●
●
●
●
●
●
●
●
●
●
●
●
●
●
●
●
●
●
●●
●
●
●
●●
●
●
●
●
●
●
●
●
●
●
●
●
●
●
●
●
●
●
●
●
●
●
●
●
●
●●
●●
●
●
●
●
●
●
●●
●
●
●
●
●
●●
●
●
●
●
●
●●
●
●
●
●
●
●
●
●
●
●
●
●
●
● ●
●
●
●
●
●
●
●
●
●
●
●
●
●
●
●
●
●
●
●
●
●
●
●
●
●
●
●
●
●
●
●
●
●
●
●
●
●
●
●
●
●
●
●
●
●
●
●
●
●
●
●
●
●
●
●
●
●
●
●
●
●
●
●
●
●
●
●
●
●
●
●
●
●
●
●
●
●
●
●
●●
●
●
●
●
●
●
●
●
●
●
●
●
●
●
●
●
●
●
●
●
●
●
●
●
●
●
●
●
●
●
●
●
●
●
●
●
●
●
●
●●
●
●
●
●
●
●
●
●
●
●
●
●
●●
●
●
●
●
●
●
●
●
●
●
●
●
●
●
●
●
●
●
●
●
●
●
●
●
●●
●
●
●
●
●
●●
●
●
●
●
●
●
●
●
●●
●
●
●
●
●
●
●
●
●
●
●
●
●
●
●
●
●
●
●
●
●
●
●
●
●
●
●
●
●
●
●
●
●
●
●
●
●
●
●
●
●●
●
●
●
●
●
●●
●
●
●
●●
●
●
●
●
●
●
●
●
●
●
●
●
●
●
●
●
●
●
●
●
●
●
●
●
●
●
●
●
●
●
●
●
●●
●
●
●
●
●
●
●
●
●
●
●●
●
●
●
●
●
●
●
●
●
●
●
●
●
●
●
●
●
●
●
●
●
●
●
●
●
●
●
●
●
●
●
●
●
●
●
●
●
●
●
●
●
●
●
●
●
●
●
●
●
●
●
●
●
●
●
●
●
●
●
●
●
●
●
●
●
●●
●
●
●
●
●
●
●
●
●
●
●●
●
●
●
●
●
●
●
●
●
●
●
●
●
●
●
●
●
●
●●
●●
●
●
●
●
●
●
●
●
●
●
●
●
●
●
●
●
●
●
●
70
80
90
100
100 120 140 160 180
Cigarettes smoked per week
Can
cer
seve
rity
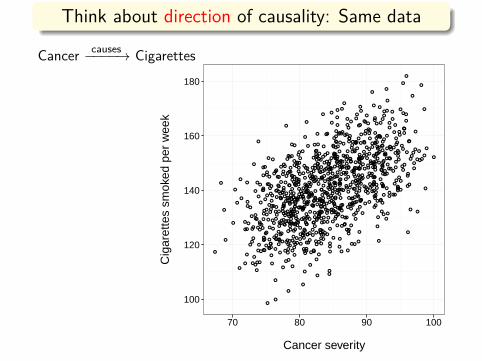
Think about direction of causality: Same data
Cancer causes−−−−→ Cigarettes
●
●
●
●
●
●
●
●
●
●
●
●
●
●
●
●
●
●
●
●
●
●
●
●
●
●
●
●
●
●
●
●
●
●
●●
●
●
●
●
●
●
●
●
●
●
●
●
●
●
●
●
●
●
●
●
●
●
●
●
●
●
●
● ●
●
●
●
●
●
●
●
●
●
●
●
●
●
●
●
●
●
●
●
●
●
●
●
●
●
●
●
●
●
●
●
●
●
●
●
●
●
●
●
●●
●
●
●
●
●
●
●●
●
●
●
●
●
●
●
●
●●
●
●
●
●
●
●
●
●
●
●
●
●
●
●
●
●
●
●
●
●
●
●
●
●
●
●
●
●
●
●
●
●●
●
●
●
●
●
●
●
●
●
●
●●
●●
●
●●
●
●
●
●
●
●●
●
●
●
●
●
●
●
●
●
●
●
●
●
●
●
●
●
●
●
●●
●
●
●
●
●
●
●
●
●
●
●
●●
●
●
●
●
●
●
●
●
●
●
●
●
●
●
●
●●
●
●
●
●
●
●
●
●
●
●
●
●
●
●
●
●
●
●
●
●
●
●
●
●
●
●
●
●
●
●
●
●
●
●
●
●
●
●
●
●
●
●
●
●
●
●
●
●
●●
●
●
●
●
●
●●
●
●
●
●
●
●●
●
●
●
●
●
●
●
●
●
●
●
●
●
●
●
●
●
●
●
●
●
●
●
●
●
●
●
●
●
●
●
●
●
●
● ●
●
●
●
●
●
●
●
●
●●
●
●●
●●
●
●
●
●
●
●
●
●
●
●
●
●
●
●
●
●
●
●
●
●
●
●
●●
●
●
●
●
●
●
●
●
●
●
●
●
●
●
●
●
●
●
●
●
●
●
●
●
●
●
●
● ●
●
●
●
●
●
●
●
●
●
●
●
●
●
●
●
●
●
●
●
●
●
●
●
●
●
●
●
●
●●
●
●
●
●
●
●
●
●
●
●
●
●
●
●
●
●
●
●
●
●
●
●
●
●
●
●
●
●
●
●
●
●
●
●
●
●
●
●
●
●
●
●
●
●
●
●
●
●
●
●
●
●
●
●
●
●
●●
●
●
●
●
●
●
●
●
●
●
●
●
●
●
●
●
●
●
●
●
●
●
●
●
●●
●
● ●
●
●
●
●
●
●
●
●
●
●
●
●
●
●●●●
● ●
●
●
●
●
●
●
●
●
●
●
●
●
●
●
● ●●
●
●
●
●
●
●
●
●
●
●
●
●
●
●
●
●
●
●
●
●
●
●
●
●
●
●
●
●
●●●
●
●
●
●
● ●
●
●
●
●
●
●
●
●
●
●
●
●
●
●
●
●
●●
●●
●
●
●
●
●●
●
●
● ●
●
●
●
●
●
●
●
●
●
●
●
●
●
●
●
●
●
●
●
●
●
●●
●
●
●●
●
●
●
●
●
●
●
●
●
●
●
●
●●
●
●
●
●
●
●
●
●
●
●
●
●
●
●
●
●
●
●
●
●
●
●
●
●
●
●
●
●
●
●
●●
●
●
●
●
● ●
●
●
●
●
●
●
●
●
●
●
●
●
●
●
●
●
●
●
●●
●●
●
●●
●
●
●
●
●
●
●
●
●
●●
●
●
●
●
●
●
●
●
●
●
●
●
●
●
●
●
●
●
●●
●
●
●
●
●
●
●
●
●
●
●
●
●
●
●
●
●
●
●
●
●
●
●
●
●
●
●
●
●
●
●
●
●
●
●
●
●
●
●
●
●
●
●
●
●
●
●
●
●
●
●
●
●
●
●
●
●
●
●
●
●
●
●
●
●
●●
●
●●
●
●
●
●
●●
●
●
●
●
●
●
●
●
●
●
●
●
●
●
●
●●
●
●
●
●
●
●
●
●
●
●
●
●
●
●●
●
●
●
●
●
●
●●
●
●
●
●
●
●
●
●
●
●
●
●
●
●
●
●
●
●●
●
●
●
●
●
●
●
●
●
●
●
●
●
●
●
●
●
●
●
●
●
●
●
●●
●
●
●
●
●
●
●●
●
●
●
●
●
●
●
●
●
●
●
●
●
●
●
●
●●
●
●
●
●
●
●
●
●
●
●
●
●
●
●
●●●
●
●
●
●
●
●
●
●
●
●
●
●
●
●
●
●●
●
●
●
●
●
●
●
●
●
●
●
●●
●
●●
●●
●
●
●
●
●
●
●
100
120
140
160
180
70 80 90 100
Cancer severity
Cig
aret
tes
smok
ed p
er w
eek
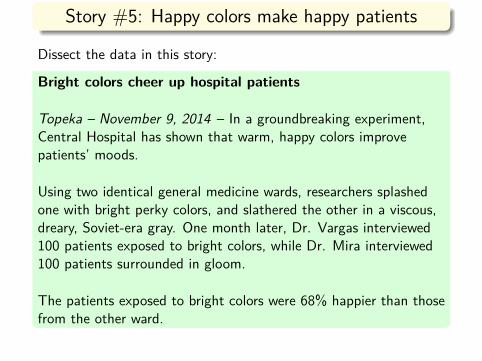
Story #5: Happy colors make happy patients
Dissect the data in this story:
Bright colors cheer up hospital patients
Topeka – November 9, 2014 – In a groundbreaking experiment,Central Hospital has shown that warm, happy colors improvepatients’ moods.
Using two identical general medicine wards, researchers splashedone with bright perky colors, and slathered the other in a viscous,dreary, Soviet-era gray. One month later, Dr. Vargas interviewed100 patients exposed to bright colors, while Dr. Mira interviewed100 patients surrounded in gloom.
The patients exposed to bright colors were 68% happier than thosefrom the other ward.

Find some possible biases here?
Vargas
Mira
Brightpaint
Patients
Gloomypaint
Patients
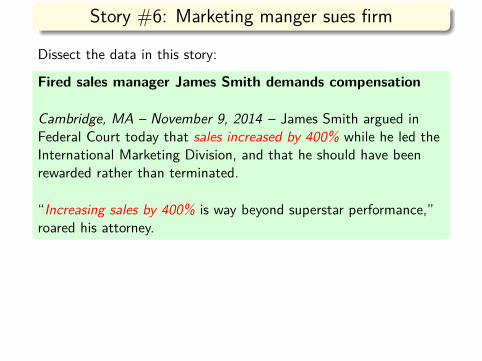
Story #6: Marketing manger sues firm
Dissect the data in this story:
Fired sales manager James Smith demands compensation
Cambridge, MA – November 9, 2014 – James Smith argued inFederal Court today that sales increased by 400% while he led theInternational Marketing Division, and that he should have beenrewarded rather than terminated.
“Increasing sales by 400% is way beyond superstar performance,”roared his attorney.
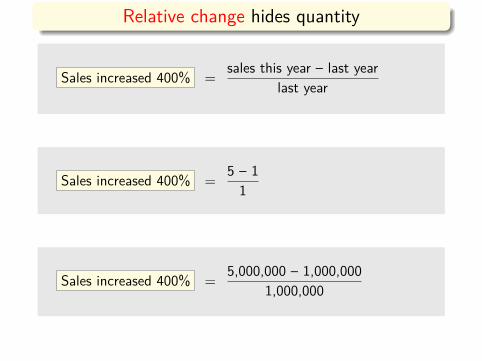
Relative change hides quantity
Sales increased 400% = sales this year – last yearlast year
Sales increased 400% = 5 – 11
Sales increased 400% = 5,000,000 – 1,000,0001,000,000
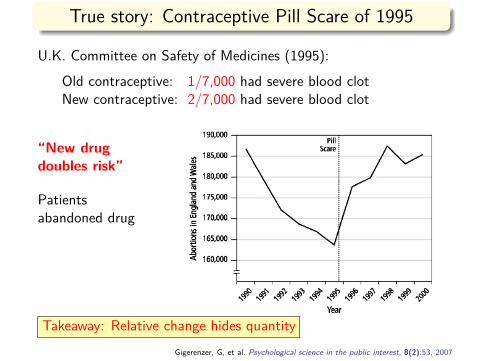
True story: Contraceptive Pill Scare of 1995
U.K. Committee on Safety of Medicines (1995):Old contraceptive: 1/7,000 had severe blood clotNew contraceptive: 2/7,000 had severe blood clot
“New drugdoubles risk”
Patientsabandoned drug
Takeaway: Relative change hides quantityGigerenzer, G, et al. Psychological science in the public interest, 8(2):53, 2007
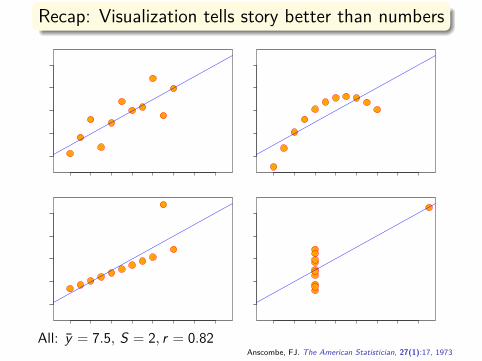
Recap: Visualization tells story better than numbers
All: y = 7.5, S = 2, r = 0.82Anscombe, FJ. The American Statistician, 27(1):17, 1973
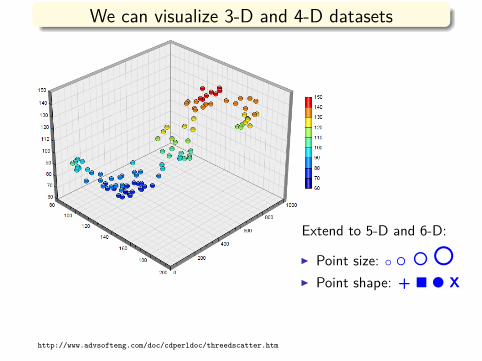
We can visualize 3-D and 4-D datasets
Extend to 5-D and 6-D:
I Point size: O O O OI Point shape: + � l X
http://www.advsofteng.com/doc/cdperldoc/threedscatter.htm
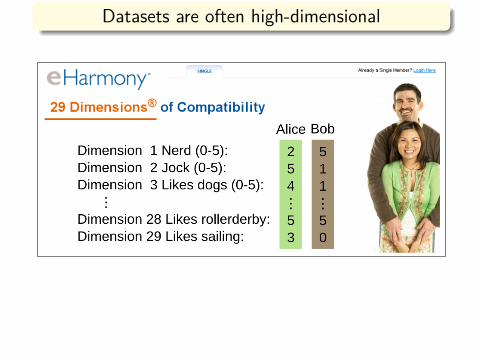
Datasets are often high-dimensional
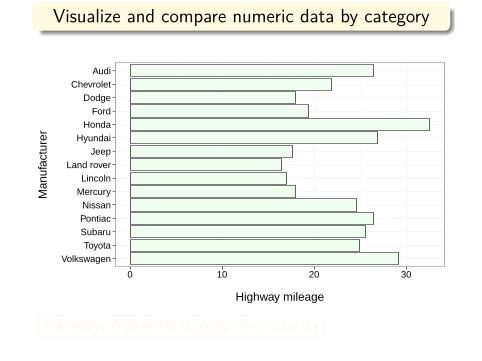
Visualize and compare numeric data by category
VolkswagenToyota
SubaruPontiacNissan
MercuryLincoln
Land roverJeep
HyundaiHonda
FordDodge
ChevroletAudi
0 10 20 30
Highway mileage
Man
ufac
ture
r
Takeaway: Alphabetic ordering obscures story
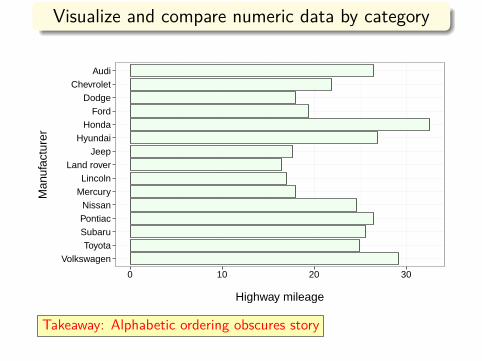
Visualize and compare numeric data by category
VolkswagenToyota
SubaruPontiacNissan
MercuryLincoln
Land roverJeep
HyundaiHonda
FordDodge
ChevroletAudi
0 10 20 30
Highway mileage
Man
ufac
ture
r
Takeaway: Alphabetic ordering obscures story
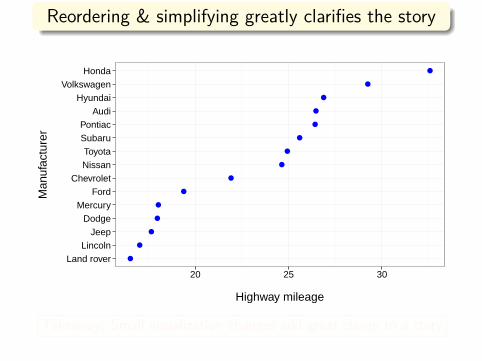
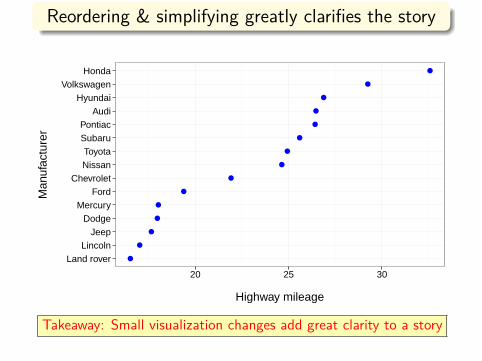
Reordering & simplifying greatly clarifies the story
●
●
●
●
●
●
●
●
●
●
●
●
●
●
●
Land roverLincoln
JeepDodge
MercuryFord
ChevroletNissanToyota
SubaruPontiac
AudiHyundai
VolkswagenHonda
20 25 30
Highway mileage
Man
ufac
ture
r
Takeaway: Small visualization changes add great clarity to a story
Reordering & simplifying greatly clarifies the story
●
●
●
●
●
●
●
●
●
●
●
●
●
●
●
Land roverLincoln
JeepDodge
MercuryFord
ChevroletNissanToyota
SubaruPontiac
AudiHyundai
VolkswagenHonda
20 25 30
Highway mileage
Man
ufac
ture
r
Takeaway: Small visualization changes add great clarity to a story

Visualize and compare histograms by category
0
200
400
600
0
30
60
90
120
Cats (1000)
Dogs (1000)
0 5 10 15 20
Number of tricks
Num
ber
of p
ets
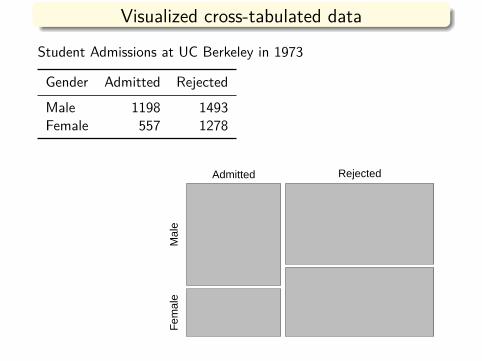
Visualized cross-tabulated dataStudent Admissions at UC Berkeley in 1973
Gender Admitted RejectedMale 1198 1493Female 557 1278
Admitted RejectedM
ale
Fem
ale
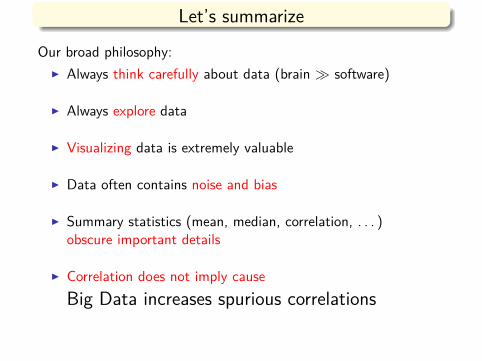
Let’s summarizeOur broad philosophy:I Always think carefully about data (brain � software)
I Always explore data
I Visualizing data is extremely valuable
I Data often contains noise and bias
I Summary statistics (mean, median, correlation, . . . )obscure important details
I Correlation does not imply causeBig Data increases spurious correlations