thin-walled structures 45 p283-300
TRANSCRIPT
ARTICLE IN PRESS
0263-8231/$ - se
doi:10.1016/j.tw
�CorrespondE-mail addr
Thin-Walled Structures 45 (2007) 283–300
www.elsevier.com/locate/tws
Quasi-static and dynamic crushing behaviors of aluminum andsteel tubes with a cutout
Haipeng Hana, Farid Taheria,�, Neil Peggb
aDepartment of Civil Engineering, Dalhousie University, 1360 Barrington Street, Halifax, NS, Canada B3J 2Z1bDefense Research and Development Canada Atlantic, 9 Grove Street, Dartmouth, NS, Canada B2Y 3Z7
Received 8 June 2006; received in revised form 12 February 2007; accepted 23 February 2007
Available online 27 April 2007
Abstract
Tubular members are commonly used as an energy absorber in engineering structures and many such members have a cutout. In this
study, the crushing behaviors of tubes with a cutout are characterized and the effects of cutout on the energy absorption capabilities of
these tubes are quantified. Systematic parametric studies were carried out to study the effect of material properties, including yield and
ultimate strength of material, strain rate effect, location of cutout, tube length and impact speed on the crushing behaviors and energy
absorption capacity of aluminum and steel tubes. First, a numerical model was constructed with a commercial explicit finite element
code. It will be first proven that the numerical simulation can produce sufficiently accurate results in an economic manner. Subsequently,
the crushing behavior of aluminum and steel tubes with a cutout was experimentally characterized and their energy absorption capacity
was evaluated in terms of mean crushing force, peak crushing force and specific energy absorption (SEA). Tubes of various lengths with a
cutout located at different locations, subject to both quasi-static and dynamic impact loadings were considered. For steel tubes, the
numerical simulation investigated the influence of the strain rate effect and variation in strain hardening ratio of the material. Empirical
equations describing the mean and peak crushing forces of aluminum and steel tubes with a cutout were developed using linear and
nonlinear regression methods applied to the results obtained from the numerical and experimental studies.
r 2007 Published by Elsevier Ltd.
Keywords: Energy absorption; Tubes; Cutout; Finite element; Strain rate; Empirical equation
1. Introduction
An energy absorber is a system that converts, totally or partially, an applied kinetic energy into another form of energy.Energy dissipated in the form of plastic deformation in metallic energy absorbers is irreversible. Generally, the objective ofan energy absorber is to dissipate the energy that is applied to the structure, so that the contents or occupants of thestructure are protected. An intensive review on the types and behaviors of collapsible impact energy absorbers can be foundin Ref. [1].
Tubular sections are commonly used in engineering structures, such as in fuselages and landing gears in aircrafts, inpipelines and oil/gas risers in offshore oil fields, and in the chassis of automobiles. These structures commonly include somegeometric discontinuities, such as attachments of stiffeners and cutouts. Impact events are generated by many means, suchas traffic accidents, natural collisions, and earthquakes. Therefore, understanding the crushing behaviors of tubularstructures has been the subject of several scholarly works [2–8].
It was shown in previous studies that perfect tubes could be crushed in several modes, such as the concertina(axisymmetric) mode and diamond (unaxisymmetric) collapse mode. Research has also been done to study the crushingbehaviors of tubes made of materials with and without strain hardening and strain rate effects. Previous work has
e front matter r 2007 Published by Elsevier Ltd.
s.2007.02.010
ing author. Tel.: +1902 494 3935; fax: +1 902 484 6635.
ess: [email protected] (F. Taheri).
ARTICLE IN PRESSH. Han et al. / Thin-Walled Structures 45 (2007) 283–300284
investigated energy absorbers with the shapes of tubes, frusta, multi-cornered columns, struts, sandwich plates, honeycombcells and other shapes including single-hat and double-hat thin-walled sections [2–12].
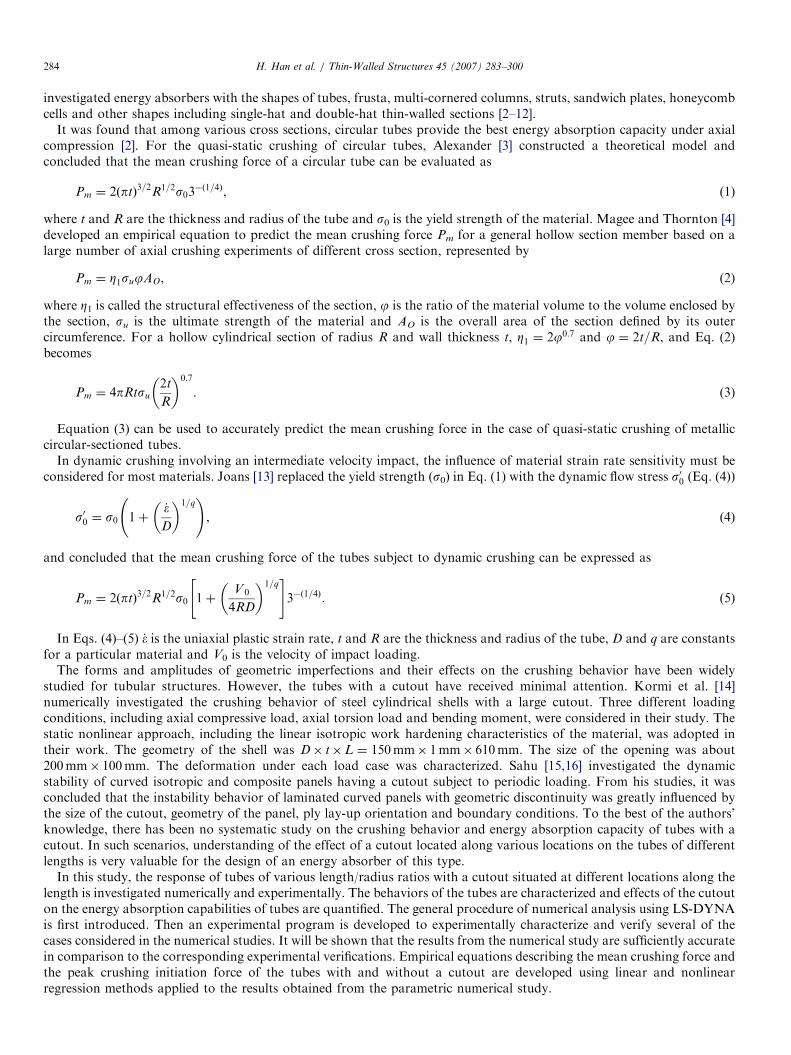
It was found that among various cross sections, circular tubes provide the best energy absorption capacity under axialcompression [2]. For the quasi-static crushing of circular tubes, Alexander [3] constructed a theoretical model andconcluded that the mean crushing force of a circular tube can be evaluated as
Pm ¼ 2ðptÞ3=2R1=2s03�ð1=4Þ, (1)
where t and R are the thickness and radius of the tube and s0 is the yield strength of the material. Magee and Thornton [4]developed an empirical equation to predict the mean crushing force Pm for a general hollow section member based on alarge number of axial crushing experiments of different cross section, represented by
Pm ¼ Z1sujAO, (2)
where Z1 is called the structural effectiveness of the section, j is the ratio of the material volume to the volume enclosed bythe section, su is the ultimate strength of the material and AO is the overall area of the section defined by its outercircumference. For a hollow cylindrical section of radius R and wall thickness t, Z1 ¼ 2j0:7 and j ¼ 2t=R, and Eq. (2)becomes
Pm ¼ 4pRtsu2t
R
� �0:7
. (3)
Equation (3) can be used to accurately predict the mean crushing force in the case of quasi-static crushing of metalliccircular-sectioned tubes.
In dynamic crushing involving an intermediate velocity impact, the influence of material strain rate sensitivity must beconsidered for most materials. Joans [13] replaced the yield strength (s0) in Eq. (1) with the dynamic flow stress s00 (Eq. (4))
s00 ¼ s0 1þ_�
D
� �1=q !
, (4)
and concluded that the mean crushing force of the tubes subject to dynamic crushing can be expressed as
Pm ¼ 2ðptÞ3=2R1=2s0 1þV 0
4RD
� �1=q" #
3�ð1=4Þ. (5)
In Eqs. (4)–(5) _� is the uniaxial plastic strain rate, t and R are the thickness and radius of the tube, D and q are constantsfor a particular material and V0 is the velocity of impact loading.
The forms and amplitudes of geometric imperfections and their effects on the crushing behavior have been widelystudied for tubular structures. However, the tubes with a cutout have received minimal attention. Kormi et al. [14]numerically investigated the crushing behavior of steel cylindrical shells with a large cutout. Three different loadingconditions, including axial compressive load, axial torsion load and bending moment, were considered in their study. Thestatic nonlinear approach, including the linear isotropic work hardening characteristics of the material, was adopted intheir work. The geometry of the shell was D� t�L ¼ 150mm� 1mm� 610mm. The size of the opening was about200mm� 100mm. The deformation under each load case was characterized. Sahu [15,16] investigated the dynamicstability of curved isotropic and composite panels having a cutout subject to periodic loading. From his studies, it wasconcluded that the instability behavior of laminated curved panels with geometric discontinuity was greatly influenced bythe size of the cutout, geometry of the panel, ply lay-up orientation and boundary conditions. To the best of the authors’knowledge, there has been no systematic study on the crushing behavior and energy absorption capacity of tubes with acutout. In such scenarios, understanding of the effect of a cutout located along various locations on the tubes of differentlengths is very valuable for the design of an energy absorber of this type.
In this study, the response of tubes of various length/radius ratios with a cutout situated at different locations along thelength is investigated numerically and experimentally. The behaviors of the tubes are characterized and effects of the cutouton the energy absorption capabilities of tubes are quantified. The general procedure of numerical analysis using LS-DYNAis first introduced. Then an experimental program is developed to experimentally characterize and verify several of thecases considered in the numerical studies. It will be shown that the results from the numerical study are sufficiently accuratein comparison to the corresponding experimental verifications. Empirical equations describing the mean crushing force andthe peak crushing initiation force of the tubes with and without a cutout are developed using linear and nonlinearregression methods applied to the results obtained from the parametric numerical study.

ARTICLE IN PRESSH. Han et al. / Thin-Walled Structures 45 (2007) 283–300 285
2. Numerical analysis using the finite element method
The aluminum and steel tubes selected are typical laboratory-scale sizes, with a 40mm outside diameter and wallthickness (t) of 0.889mm, as shown in Fig. 1. A square cutout of 7.5mm� 7.5mm was created at various locations alongthe length of the tubes. The distance between the centers of the cutout to the bottom end of the tube is denoted as L0. Thevariation of L0 ( ¼ 0.50�0.95L) was considered. To alleviate the excessive stress concentration around the cutout, cornerchamfers of 0.5mm radius were introduced around the cutout. As stated in [17], only a few works have investigated theinfluence of a cutout on the intermediate length or slender cylindrical shells when subjected to either static or dynamic axialcompression loading. In this paper, short (L ¼ 2D ¼ 80mm), intermediate length (L ¼ 5D ¼ 200mm) and long(L ¼ 10D ¼ 400mm) tubes with and without a cutout, subject to both quasi-static and dynamic axial impact loadingconditions are investigated.
The commercially available code, LS-DYNA, was used for the numerical simulation. Material model 24 of LS-DYNA(MAT_PIECEWIRE-LINEAR- PLASTICITY) [18], was selected to model both the aluminum and steel tubes. Thematerial models are schematically shown in Fig. 2. The aluminum tubes are made of 6061-T6 aluminum alloys with thesheet rolling direction in the circumferential direction. The engineering stress–strain curves were determined using six dog-bone tensile specimens machined from the walls of the extruded tubes according to ASTM B557 standard. Based on theexperimental results, a multi-linear isotropic hardening constitutive model was constructed to represent the uniaxialstress–strain behavior of the aluminum material, using the von-Mises flow rule as the yield criterion. Two types of materialmodels, namely MAT1 and MAT2, were chosen to represent the steel in the numerical simulation. These models representtwo type of strain hardening ratios, which is defined as the ratio of ultimate strength to the yield strength of the steelmaterials. MAT1 and MAT2 have the same value of yield strength (s0 ¼ 275MPa). However, MAT1 is high-strength low-
Fig. 1. FEM model of the aluminum and steel tubes.
0.0
50.0
100.0
150.0
200.0
250.0
0
Str
ess (
MP
a)
Aluminum
Plastic strain
(mm/mm)
Stress
(MPa)
0 170.0
0.01668 184.0
0.0208 187.0
0.041 199.0
0.0607 205.0
0.0806 207.0
0.0
100.0
200.0
300.0
400.0
500.0
0 0.2
Str
ess (
MP
a)
MAT1 (strain hardening ratio=1.65)
MAT2 (strain hardening ratio=1.32)
Plastic strain
0.02 0.04 0.06 0.08 0.1
Plastic strain
0.05 0.1 0.15 0.25
Fig. 2. Material models of the aluminum and steel tubes.

ARTICLE IN PRESSH. Han et al. / Thin-Walled Structures 45 (2007) 283–300286
alloyed steel, with relatively high-strain hardening ratio (su/s0 ¼ 1.65), while MAT2 is mild steel, with relatively low-strainhardening ratio (su/s0 ¼ 1.32). Aluminum has been found to be less strain rate sensitive [13], therefore, the strain rate effectis not considered for the aluminum tube. For both MAT1 and MAT2, the parameters that describe the strain rate effect ofthe material in Eq. (4) is taken as D ¼ 40.4 and q ¼ 5 [13].
Belyschko–Tsay quadrilateral shell elements [18] were used to model the wall of both aluminum and steel tubes. Themeshed shell elements were located at the mid-plane of the tube’s wall.
In the modeling of quasi-static crushing, the bottom end of the tube was assumed to be built-in and was constrained inall degrees of freedom. The upper end was free and subject to compression by the rigid loading plate. The loading plate wasmodeled as a rigid wall and its mass was assumed to be 100 kg. In the simulation of a quasi-static crushing event, the massof both loading plate and tube can be scaled up to a certain limit for the purpose of computation saving, while stillmaintaining the quasi-static condition [19,20]. In this study, the density of the loading plate and tube were all scaled up by afactor of 1000. It was shown that the ratio of total kinetic energy (KE) to the total internal energy was less than 5% overthe crushing process, thus maintaining the quasi-static condition. The loading plate was displaced using *BOUNDARY_PRESCRIBED_MOTION_RIGID at a constant loading rate of 100mm/s. Two types of contact algorithm were used tosimulate the boundary conditions of quasi-static crushing. The first one was to simulate the interface between the loadingplate and the upper end of the tube using the *CONTACT_CONSTRAINT _NODES_TO_SURFACE command of LS-DYNA. The interface force between the loading plate and the tube was used to obtain the force-displacement responses.The other was to prevent the tube from drifting on the bottom end of tube; this was done by employing the*RIGIDWALL_ GEOMETRIC_FLAT command in LS-DYNA, by which a flat rigid surface was defined beneath thetube. In this way, the tube would always stay on the top of this flat surface, even if the tube started folding at the bottomend.
For simulation of the dynamic axial crushing, the same boundary conditions were applied to the bottom end of the tubesand the upper end was set free in all degree of freedom. The tube was impacted by the loading plate with certain downwardvelocity. The initial velocity of the loading plate was introduced by the *INITIAL_VELOCITY_RIGID_BODYcommand. In both quasi-static and dynamic crushing simulations, a self-contact algorithm, invoked by the *CONTACT_AUTOMATIC_SINGLE_SURFACE command was used to prevent interpenetration during the folding of the tubes.
3. Experimental program
Test specimens were cut from commercially available aluminum tubes of intermediate length (L ¼ 5D). A square cutoutof 7.5mm� 7.5mm was carefully drilled and machine-finished along three different locations on the tubes, at locationsL0 ¼ 0.50, 0.75 and 0.95L.
3.1. Quasi-static crushing test
These tests were conducted using a MTS loading frame controlled by Instron 8500 electronics to study some of the casesinvestigated in the numerical simulations. The crushing speed was 10mm/min in the test. The specimens were constrainedby a steel sleeve fixture at their bottom end while the top end was set free and subject to compression by the rigid loadingplate, mimicing the fixed-free boundary condition used in the numerical simulations. The crushing force versus crushingdisplacement response was recorded. Three identical specimens were tested for each case, and the average of the data wasused for comparison purpose.
3.2. Impact load testing
The impact testing system (ITS) was fabricated in our research laboratory, as shown in Fig. 3. The drop tower-testingmachine controlled by a motor is about 3.25m high, which results in a maximum impact velocity of 8.0m/s. A dynamicforce sensor (Model 200C50, 50000 lb capacity, PSB Piezotronics Inc. Depew, NY) was used to catch the instantaneouscompression force. Three quartz shear model ICP accelerometers (Model 353B15) were mounted on the top of the loadingplate to measure the acceleration during the impact event. The signals from the force sensor and accelerometers weredirected through an ICP signal conditioner, and were then collected by an 8 channel, 12 bit, 200 ks/s data acquisition card(NI PCI-6023E, E-series multifunctional) connected to the computer. A high-speed video camera (Photron USA Inc., SanDiego, CA) connected to the built-in data acquisition card of the same computer was also used to record the crushing eventof the tubes. The maximum frame rate of the high-speed camera was 10,000Frame/s. The Motion Tool software (PhotronUSA Inc., San Diego, CA) associated with the high-speed video camera, was used to synchronize the real-time image withthe corresponding signal from the force sensor and accelerometers. By tracking the motion of the loading plate via therecorded images, the crushing distance versus time history could be constructed. This was synchronized with the forceversus time history recorded by the dynamic force sensor. Thus, the load-crushing displacement curve could be obtained.

ARTICLE IN PRESS
PC
Rails supporting the weight
Concrete Floor
HS-Video camera
Fixture
cutout
Specimen
Weight
Connected to Motor
Dynamic force sensor
accelerometer
Fig. 3. Schematic impact testing system.
H. Han et al. / Thin-Walled Structures 45 (2007) 283–300 287
4. Results and discussions
The numerical simulations of the crushing event were carried out for tubes with and without a cutout. Tubes of threedifferent length/diameter ratios (L/D ¼ 2, 5 and 10) were analyzed. The 7.5mm� 7.5mm cutout was located at mid-height(L0 ¼ 0.50L) of the 2D tubes. A cutout of the same size was located at three different locations for the 5D tubes(L0 ¼ 0.50, 0.70 and 0.90L) and the 10D tubes (L0 ¼ 0.50, 0.75 and .95L). Therefore, the cutout was essentially located atthe upper half of the tubes. Both quasi-static and dynamic crushing with various impact velocities were carried out for eachtube. The velocity of impact varied between 6 and 20m/s. In each case, the crushing force versus crushing displacementresponse and the crushed profile information were used to identify the crushing mode. The absorbed energy, peak crushingforce, mean crushing force within certain crushing displacement and the specific energy absorption (SEA) were used toevaluate the energy absorption capability of the tubes.
The experimental program was carried out to verify a set of selected cases in the numerical studies. The cases studied inthe experimental program included the 5D aluminum tubes with and without a cutout. The tests included quasi-static anddynamic tests. Due to the height limitation of the drop tower and capacity of the ITS, the maximum capacity of thedropping mass and velocity were at 60 kg and 8m/s, respectively. Therefore all of the tubes are impacted by a drop mass of60 kg and velocity of 7m/s, so that the total energy input to the system was E ¼ 1=2mv2 ¼ 1470 J. It was noted thatrebound impacts would occur after the first impacting stroke; nonetheless, in all tests, only the information correspondingto the first crushing stroke was of interest. Although the high speed video camera and sensors recorded the entire eventincluding the multiple impacts after the first impulse, the analyses were carried out only with reference to the first crushingstroke.
Figs. 4–8 illustrates the crushing force versus displacement responses of tubes that have been simulated. Tables 1 and 2tabulate the summary of the crushing response and energy absorption capacity of the aluminum and steel tubes,respectively, with and without a cutout obtained through the numerical analyses. The results in Tables 1 and 2 indicate thatthe crushing modes of all simulated tubes could be classified into two categories; that is, a global buckling (GB) mode or aprogressive crushing (PC) mode. In the PC category, depending on the variation of tube length and location of the cutout,the mode could be further classified into 4 sub- modes, namely PC1, PC2, PC3 and PC4. The descriptions of these crushingmodes are listed at the end of each table. Section 4.1 provides the detail of the experimental results and comparisons with

ARTICLE IN PRESS
0.0
5.0
10.0
15.0
20.0
25.0
0.0 40.0 60.0 80.0 100.0 120.0 140.0
Cru
shin
g forc
e (
kN
)
A5D_QSA5D_v6A5D_v10A5D_v14A5D_v20
0.0
5.0
10.0
15.0
20.0
0.0 20.0 40.0
Cru
shin
g forc
e (
kN
)
A5D50L_QSA5D50L_v6A5D50L_v10A5D50L_v14A5D50L_v20
0.0
5.0
10.0
15.0
20.0
25.0
40.0
Cru
shin
g forc
e (
kN
)
A5D70L_QSA5D70L_v6A5D70L_v10A5D70L_v14A5D70L_v20
0.0
5.0
10.0
15.0
20.0
25.0
Cru
shin
g forc
e (
kN
)
A5D90L_QSA5D90L_v6A5D90L_v10A5D90L_v14A5D90L_v20
Crushing displacement (mm)
20.0
Crushing displacement (mm)
80.060.0 100.0 120.0 140.0
0.0
Crushing displacement (mm)
20.0 60.0 80.0 100.0 120.0 140.0
Crushing displacement (mm)
20.00.0 40.0 60.0 80.0 100.0 120.0 140.0
Fig. 5. Crushing response of the 5D aluminum tubes with and without a cutout subject to quasi-static and dynamic crushing.
0.0
5.0
10.0
15.0
20.0
25.0
0.0
Crushing displacement (mm)
Cru
sh
ing
fo
rce
(kN
)
A2D_QSA2D_v6A2D_v10A2D_v14A2D_v20
0.0
5.0
10.0
15.0
20.0
25.0
Cru
shin
g forc
e (
kN
) A2D50L_QSA2D50L_v6A2D50L_v10A2D50L_v14A2D50L_v20
10.0 20.0 30.0 40.0 50.0 60.0
0.0
Crushing displacement (mm)
10.0 20.0 30.0 40.0 50.0 60.0
Fig. 4. Crushing response of the 2D aluminum tubes with and without a cutout subject to quasi-static and dynamic crushing.
H. Han et al. / Thin-Walled Structures 45 (2007) 283–300288

ARTICLE IN PRESS
0.0
10.0
20.0
30.0
40.0
50.0
0.0 20.0 30.0 40.0 50.0 60.0
Crushing displacement (mm)
Cru
shin
g forc
e (
kN
)
MAT2_QS
MAT2_v6
MAT2_v20
MAT1_QS
MAT1_v6
MAT1_v20
0.0
10.0
20.0
30.0
40.0
50.0
0.0 10.0 20.0 30.0 40.0 50.0 60.0
Crushing displacement (mm)
Cru
shin
g forc
e (
kN
)
MAT1_QS
MAT1_v6
MAT1_v20
MAT2_QS
MAT2_v6
MAT2_v20
10.0
Fig. 7. Crushing response of the 2D steel tubes with and without a cutout subject to quasi-static and dynamic crushing.
0.0
4.0
8.0
12.0
16.0
20.0
0.0
20.0
40.0
60.0
80.0
120.
0
140.
0
160.
0
180.
0
200.
0
Cru
shin
g f
orc
e (
kN
)A10D_QSA10D_v6A10D_v10A10D_v14A10D_v20
0.0
4.0
8.0
12.0
16.0
20.0
0.0
20.0
40.0
60.0
80.0
100.
0
120.
0
140.
0
160.
0
180.
0
200.
0
Cru
sh
ing
fo
rce
(kN
)
A10D50L_QS
A10D50L_v6
A10D50L_v10
A10D50L_v14
A10D50L_v20
0.0
4.0
8.0
12.0
16.0
20.0
60.0
120.
0
140.
0
160.
0
180.
0
200.
0
Cru
shin
g forc
e (
kN
)
A10D75L_QSA10D75L_v6A10D75L_v10A10D75L_v14A10D75L_v20
0.0
4.0
8.0
12.0
16.0
20.0
0.0
20.0
40.0
60.0
80.0
100.
0
120.
0
140.
0
160.
0
180.
0
200.
0
Crushing displacement (mm)
Cru
shin
g forc
e (
kN
)
A10D95L_QSA10D95L_v6A10D95L_v10A10D95L_v14A10D95L_v20
Crushing displacement (mm)
100.
0
Crushing displacement (mm)
Crushing displacement (mm)
0.0
20.0
40.0
80.0
100.
0
Fig. 6. Crushing response of the 10D aluminum tubes with and without a cutout subject to quasi-static and dynamic crushing.
H. Han et al. / Thin-Walled Structures 45 (2007) 283–300 289
ARTICLE IN PRESS
0.0
10.0
20.0
30.0
40.0
50.0
0.0 20.0 40.0 80.0 100.0 120.0 140.0 160.0
Crushing displacement (mm)
Cru
shin
g forc
e (
kN
)
MAT1_QSMAT1_v6MAT1_v20MAT2_QSMAT2_v6MAT2_v20
0.0
10.0
20.0
30.0
40.0
50.0
0.0 120.0 140.0 160.0
Cru
shin
g f
orc
e (
kN
)
MAT1_QSMAT1_v6MAT1_v20MAT2_QSMAT2_v6MAT2_v20
0.0
10.0
20.0
30.0
40.0
50.0
20.0 80.0 140.0 160.0
Cru
shin
g forc
e (
kN
)
MAT1_QSMAT1_v6MAT1_v20MAT2_QSMAT2_v6MAT2_v20
60.0
Crushing displacement (mm)
20.0 40.0 60.0 80.0 100.0
Crushing displacement (mm)
0.0 40.0 60.0 100.0 120.0
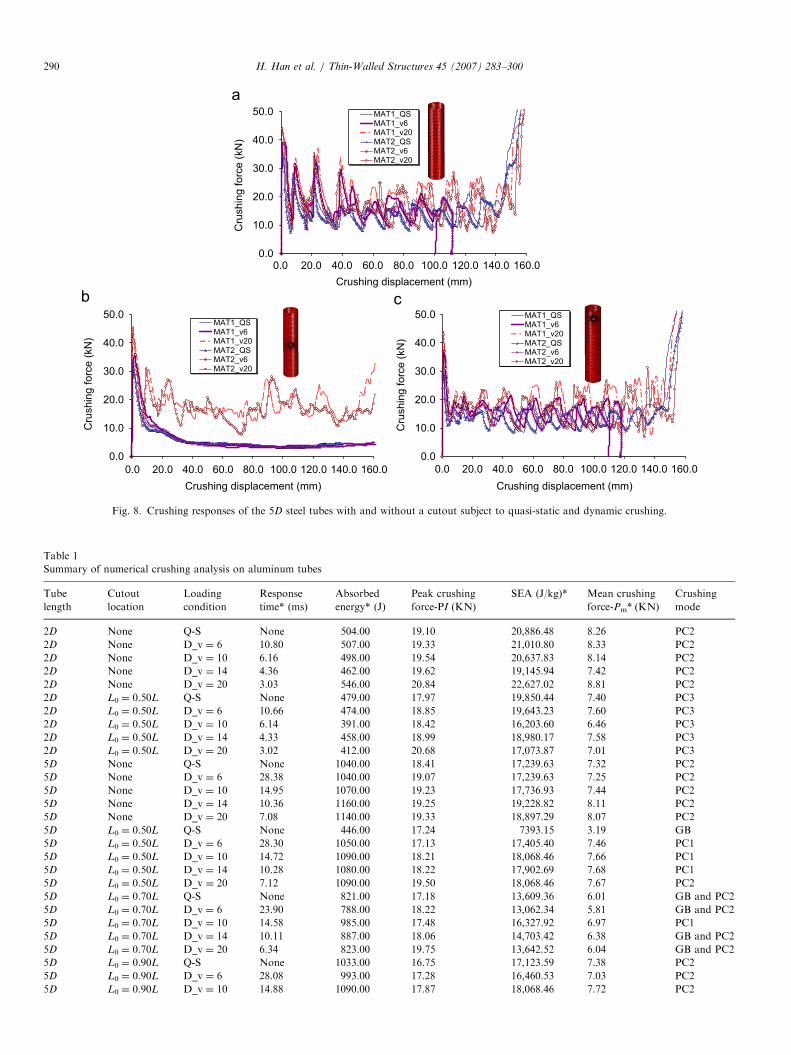
Fig. 8. Crushing responses of the 5D steel tubes with and without a cutout subject to quasi-static and dynamic crushing.
Table 1
Summary of numerical crushing analysis on aluminum tubes
Tube
length
Cutout
location
Loading
condition
Response
time* (ms)
Absorbed
energy* (J)
Peak crushing
force-PI (KN)
SEA (J/kg)* Mean crushing
force-Pm* (KN)
Crushing
mode
2D None Q-S None 504.00 19.10 20,886.48 8.26 PC2
2D None D_v ¼ 6 10.80 507.00 19.33 21,010.80 8.33 PC2
2D None D_v ¼ 10 6.16 498.00 19.54 20,637.83 8.14 PC2
2D None D_v ¼ 14 4.36 462.00 19.62 19,145.94 7.42 PC2
2D None D_v ¼ 20 3.03 546.00 20.84 22,627.02 8.81 PC2
2D L0 ¼ 0.50L Q-S None 479.00 17.97 19,850.44 7.40 PC3
2D L0 ¼ 0.50L D_v ¼ 6 10.66 474.00 18.85 19,643.23 7.60 PC3
2D L0 ¼ 0.50L D_v ¼ 10 6.14 391.00 18.42 16,203.60 6.46 PC3
2D L0 ¼ 0.50L D_v ¼ 14 4.33 458.00 18.99 18,980.17 7.58 PC3
2D L0 ¼ 0.50L D_v ¼ 20 3.02 412.00 20.68 17,073.87 7.01 PC3
5D None Q-S None 1040.00 18.41 17,239.63 7.32 PC2
5D None D_v ¼ 6 28.38 1040.00 19.07 17,239.63 7.25 PC2
5D None D_v ¼ 10 14.95 1070.00 19.23 17,736.93 7.44 PC2
5D None D_v ¼ 14 10.36 1160.00 19.25 19,228.82 8.11 PC2
5D None D_v ¼ 20 7.08 1140.00 19.33 18,897.29 8.07 PC2
5D L0 ¼ 0.50L Q-S None 446.00 17.24 7393.15 3.19 GB
5D L0 ¼ 0.50L D_v ¼ 6 28.30 1050.00 17.13 17,405.40 7.46 PC1
5D L0 ¼ 0.50L D_v ¼ 10 14.72 1090.00 18.21 18,068.46 7.66 PC1
5D L0 ¼ 0.50L D_v ¼ 14 10.28 1080.00 18.22 17,902.69 7.68 PC1
5D L0 ¼ 0.50L D_v ¼ 20 7.12 1090.00 19.50 18,068.46 7.67 PC2
5D L0 ¼ 0.70L Q-S None 821.00 17.18 13,609.36 6.01 GB and PC2
5D L0 ¼ 0.70L D_v ¼ 6 23.90 788.00 18.22 13,062.34 5.81 GB and PC2
5D L0 ¼ 0.70L D_v ¼ 10 14.58 985.00 17.48 16,327.92 6.97 PC1
5D L0 ¼ 0.70L D_v ¼ 14 10.11 887.00 18.06 14,703.42 6.38 GB and PC2
5D L0 ¼ 0.70L D_v ¼ 20 6.34 823.00 19.75 13,642.52 6.04 GB and PC2
5D L0 ¼ 0.90L Q-S None 1033.00 16.75 17,123.59 7.38 PC2
5D L0 ¼ 0.90L D_v ¼ 6 28.08 993.00 17.28 16,460.53 7.03 PC2
5D L0 ¼ 0.90L D_v ¼ 10 14.88 1090.00 17.87 18,068.46 7.72 PC2
H. Han et al. / Thin-Walled Structures 45 (2007) 283–300290

ARTICLE IN PRESS
Table 2
Summary of numerical crushing analysis on steel tubes
Tube
length
Material
type
Strain
rate
effect
Cutout
location
Loading
condition
Response
time* (ms)
Absorbed
energy (J)*
Peak
crushing
force –PI
(KN)
SEA (J/
kg)*
Mean
crushing
force-Pm*
(KN)
Crushing
mode
2D MAT1 Yes None Q-S None 995.00 34.93 14,182.47 16.49 PC2
2D MAT1 Yes None D_v ¼ 6 12.48 1200.00 47.41 17,104.48 20.02 PC2
2D MAT1 Yes None D_v ¼ 20 3.05 1300.00 50.89 18,529.86 21.13 PC2
2D MAT2 Yes None Q-S None 954.00 34.85 13,598.07 15.75 PC3
2D MAT2 Yes None D_v ¼ 6 12.15 1160.00 42.44 16,534.33 19.48 PC3
2D MAT2 Yes None D_v ¼ 20 3.05 1240.00 48.91 17,674.63 20.17 PC3
2D MAT2 No None D_v ¼ 20 3.04 917.00 42.64 13,070.68 14.95 PC3
2D MAT1 Yes L0 ¼ 0.50L Q-S None 1050.00 32.90 14,966.42 17.40 PC2
2D MAT1 Yes L0 ¼ 0.50L D_v ¼ 6 12.21 1140.00 39.20 16,249.26 19.20 PC2
2D MAT1 Yes L0 ¼ 0.50L D_v ¼ 20 3.03 1270.00 48.76 18,102.25 20.91 PC2
2D MAT2 Yes L0 ¼ 0.50L Q-S None 680.00 32.50 9692.54 11.39 PC2
2D MAT2 Yes L0 ¼ 0.50L D_v ¼ 6 11.90 958.00 38.93 13,655.08 15.95 PC2
2D MAT2 Yes L0 ¼ 0.50L D_v ¼ 20 3.05 1150.00 48.39 16,391.80 18.95 PC2
2D MAT2 No L0 ¼ 0.50L D_v ¼ 20 3.01 832.00 38.29 11,859.11 13.69 PC2
5D MAT1 Yes None Q-S None 1540.00 34.48 8780.30 15.15 PC2
5D MAT1 Yes None D_v ¼ 6 32.20 1790.00 39.23 10,205.68 16.63 PC2
5D MAT1 Yes None D_v ¼ 20 5.16 2060.00 44.33 11,745.08 20.14 PC2
5D MAT2 Yes None Q-S None 1390.00 34.27 7925.08 13.61 PC2
5D MAT2 Yes None D_v ¼ 6 25.80 1630.00 38.77 9293.44 15.66 PC2
5D MAT2 Yes None D_v ¼ 20 5.13 1820.00 44.00 10,376.72 17.83 PC2
5D MAT2 No None D_v ¼ 20 5.10 1450.00 33.95 8267.17 14.24 PC2
5D MAT1 Yes L0 ¼ 0.50L Q-S None 634.20 32.82 3615.89 7.27 GB
5D MAT1 Yes L0 ¼ 0.50L D_v ¼ 6 14.90 716.00 36.20 4082.27 7.49 GB
5D MAT1 Yes L0 ¼ 0.50L D_v ¼ 20 5.12 1910.00 45.35 10889.86 18.62 PC3
Table 1 (continued )
Tube
length
Cutout
location
Loading
condition
Response
time* (ms)
Absorbed
energy* (J)
Peak crushing
force-PI (KN)
SEA (J/kg)* Mean crushing
force-Pm* (KN)
Crushing
mode
5D L0 ¼ 0.90L D_v ¼ 14 10.28 1040.00 17.64 17,239.63 7.37 PC2
5D L0 ¼ 0.90L D_v ¼ 20 7.12 1080.00 18.49 17,902.69 7.64 PC2
10D None Q-S None 1420.00 17.65 11,769.36 7.00 PC2
10D None D_v ¼ 6 46.20 1440.00 16.72 11,935.13 7.07 PC2
10D None D_v ¼ 10 22.00 1610.00 19.06 13,344.14 7.94 PC4
10D None D_v ¼ 14 15.04 1630.00 19.13 13,509.90 7.98 PC4
10D None D_v ¼ 20 10.20 1610.00 18.95 13,344.14 7.95 PC2
10D L0 ¼ 0.50L Q-S None 980.00 17.49 8122.52 4.91 GB
10D L0 ¼ 0.50L D_v ¼ 6 39.60 608.00 18.64 5039.28 3.31 PC2–4GB
10D L0 ¼ 0.50L D_v ¼ 10 21.20 1220.00 18.46 10,111.71 6.09 PC1–4GB
10D L0 ¼ 0.50L D_v ¼ 14 14.94 1540.00 18.61 12,763.96 7.58 PC1
10D L0 ¼ 0.50L D_v ¼ 20 10.10 938.00 19.49 7774.41 4.63 PC2–4GB
10D L0 ¼ 0.75L Q-S None 952.58 16.97 8140.64 4.91 GB
10D L0 ¼ 0.75L D_v ¼ 6 41.22 1100.00 18.20 9117.11 5.50 PC1–4GB
10D L0 ¼ 0.75L D_v ¼ 10 30.56 1380.00 18.10 11,437.83 6.75 PC1–4GB
10D L0 ¼ 0.75L D_v ¼ 14 14.46 1390.00 18.06 11,520.71 6.92 PC1–4GB
10D L0 ¼ 0.75LL D_v ¼ 20 10.20 1600.00 19.50 13,261.25 7.89 PC2
10D L0 ¼ 0.95L Q-S None 1523.61 16.20 12,623.07 7.60 PC2
10D L0 ¼ 0.95L D_v ¼ 6 45.80 1400.00 16.04 11,603.60 6.92 PC2
10D L0 ¼ 0.95L D_v ¼ 10 21.68 1460.00 17.73 12,100.89 7.21 PC2
10D L0 ¼ 0.95L D_v ¼ 14 14.88 1470.00 17.58 12,183.78 7.32 PC2
10D L0 ¼ 0.95L D_v ¼ 20 10.20 1520.00 18.49 12,598.19 7.53 PC2
Note: Loading condition: Q-S: quasi-static; D_v ¼ 6: dynamic crushing (v ¼ 6m/s); D_v ¼ 10: dynamic crushing (v ¼ 10m/s); D_v ¼ 14: dynamic
crushing (v ¼ 14m/s); D_v ¼ 20: dynamic crushing (v ¼ 20m/s). *These values are calculated based on 60mm crushing distance for 2D (80mm) tubes;
likewise, 100mm for 5D (200mm) tubes, and 200mm for 10D (400mm) tubes. Crushing modes: GB—global Buckling; PC1- initial folding occurred at
around the cutout. The folding then occurred on the top part of the shell, and finally the bottom part folded; PC2—initial folding occurred at the loaded
end progressively, and propagated downwards; PC3—initial folding occurred simultaneously at the loaded end and around the cutout; PC4—initial
folding occurred at both top and bottom end, and folding continued progressively.
H. Han et al. / Thin-Walled Structures 45 (2007) 283–300 291

ARTICLE IN PRESS
Table 2 (continued )
Tube
length
Material
type
Strain
rate
effect
Cutout
location
Loading
condition
Response
time* (ms)
Absorbed
energy (J)*
Peak
crushing
force –PI
(KN)
SEA (J/
kg)*
Mean
crushing
force-Pm*
(KN)
Crushing
mode
5D MAT2 Yes L0 ¼ 0.50L Q-S None 647.00 32.61 3688.87 6.47 GB
5D MAT2 Yes L0 ¼ 0.50L D_v ¼ 6 18.20 710.00 35.31 4048.06 6.72 GB
5D MAT2 Yes L0 ¼ 0.50L D_v ¼ 20 5.12 1800.00 44.83 10,262.69 17.58 PC3
5D MAT2 No L0 ¼ 0.50L D_v ¼ 20 5.12 1450.00 33.72 8267.17 14.12 PC3
5D MAT1 Yes L0 ¼ 0.90L Q-S None 1420.00 31.21 8096.12 13.98 PC2
5D MAT1 Yes L0 ¼ 0.90L D_v ¼ 6 26.20 1630.00 37.33 9293.44 15.86 PC2
5D MAT1 Yes L0 ¼ 0.90L D_v ¼ 20 5.16 1930.00 43.59 11,003.88 18.97 PC2
5D MAT2 Yes L0 ¼ 0.90L Q-S None 1350.00 29.21 7697.02 13.37 PC2
5D MAT2 Yes L0 ¼ 0.90L D_v ¼ 6 24.40 1530.00 36.98 8723.29 15.00 PC2
5D MAT2 Yes L0 ¼ 0.90L D_v ¼ 20 5.16 1750.00 43.03 9977.62 17.21 PC2
5D MAT2 No L0 ¼ 0.90L D_v ¼ 20 5.12 1350.00 32.05 7697.02 13.25 PC2
10D MAT1 Yes None Q-S None 2940.00 34.14 8381.20 14.59 PC2
10D MAT1 Yes None D_v ¼ 6 34.60 1800.00 38.49 5131.35 18.24 PC2
10D MAT1 Yes None D_v ¼ 20 10.56 3820.00 43.60 10,889.86 18.76 PC2
10D MAT2 Yes None Q-S None 2670.00 33.97 7611.50 13.24 PC2
10D MAT2 Yes None D_v ¼ 6 37.20 1800.00 37.98 5131.35 16.67 PC2
10D MAT2 Yes None D_v ¼ 20 10.50 3470.00 42.89 9892.09 17.12 PC2
10D MAT2 No None D_v ¼ 20 10.38 2700.00 31.84 7697.02 13.32 PC2
10D MAT1 Yes L0 ¼ 0.50L Q-S None 651.20 33.48 1856.41 3.26 GB
10D MAT1 Yes L0 ¼ 0.50L D_v ¼ 6 None 712.00 37.67 2029.73 3.56 GB
10D MAT1 Yes L0 ¼ 0.50L D_v ¼ 20 10.28 2180.00 45.33 6214.63 10.73 PC3–
4GB
10D MAT2 Yes L0 ¼ 0.50L Q-S None 1030.00 33.35 2936.27 5.15 GB
10D MAT2 Yes L0 ¼ 0.50L D_v ¼ 6 None 763.00 37.61 2175.12 3.82 GB
10D MAT2 Yes L0 ¼ 0.50L D_v ¼ 20 9.80 2890.00 44.81 8238.66 14.65 PC3-
4GB
10D MAT2 No L0 ¼ 0.50L D_v ¼ 20 10.36 2690.00 33.69 7668.51 13.29 PC2
10D MAT1 Yes L0 ¼ 0.95L Q-S None 3230.00 32.25 9207.91 15.76 PC2
10D MAT1 Yes L0 ¼ 0.95L D_v ¼ 6 40.00 1790.00 36.57 5102.84 16.27 PC2
10D MAT1 Yes L0 ¼ 0.95L D_v ¼ 20 10.56 3710.00 43.59 10,576.27 18.32 PC2
10D MAT2 Yes L0 ¼ 0.95L Q-S None 2600.00 31.37 7411.94 12.80 PC2
10D MAT2 Yes L0 ¼ 0.95L D_v ¼ 6 41.00 1800.00 36.32 5131.35 15.00 PC2
10D MAT2 Yes L0 ¼ 0.95L D_v ¼ 20 10.48 3350.00 43.03 9550.00 16.66 PC2
10D MAT2 No L0 ¼ 0.95L D_v ¼ 20 10.36 2600.00 32.05 7411.94 12.89 PC2
Note: Loading condition: Q–S: quasi-static; D_v ¼ 6: dynamic crushing (v ¼ 6m/s); D_v ¼ 10: dynamic crushing (v ¼ 10m/s); D_v ¼ 14: dynamic
crushing (v ¼ 14m/s); D_v ¼ 20: dynamic crushing (v ¼ 20m/s).*These values are calculated based on 60mm crushing distance for 2D (80mm) tubes;
likewise, 100mm for 5D (200mm) tubes, and 200mm for 10D (400mm) tubes.Crushing modes: GB—global buckling; PC1— initial folding occurred at
around the cutout. The folding then occurred on the top part of the shell, and finally the bottom part folded; PC2—initial folding occurred at the loaded
end progressively, and propagated downwards; PC3—initial folding occurred simultaneously at the loaded end and around the cutout; PC4—initial
folding occurred at both top and bottom end, and folding continued progressively.
H. Han et al. / Thin-Walled Structures 45 (2007) 283–300292
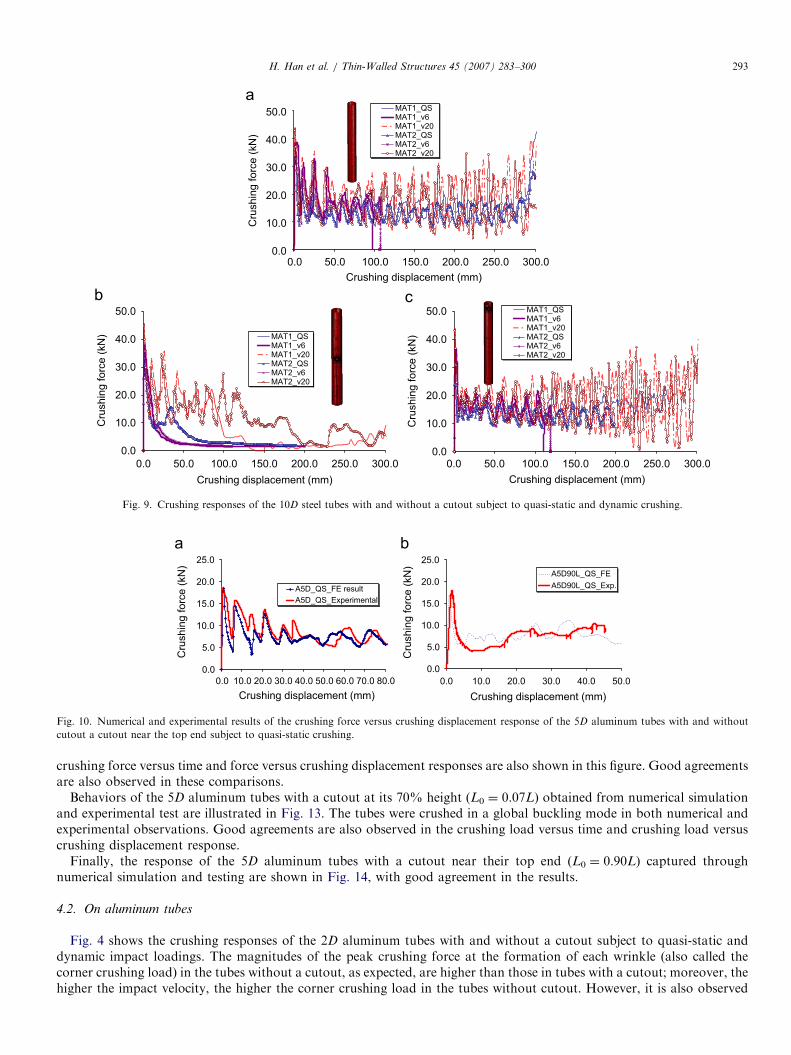
the corresponding numerical simulations. Sections 4.2 and 4.3 present the results and discussions on numerical crushingsimulation of the aluminum and steel tubes with a cutout (Fig. 9).
4.1. Comparisons of experimental and numerical simulations
Fig. 10 shows the numerical and experimental crushing force versus crushing displacement response for the quasi-staticcrushing of the 5D aluminum tubes without and with a cutout near their loaded end (L0 ¼ 0.90L). Good agreement isobserved between the numerical simulations and experimental results.
The numerical and experimental crushing response of 5D aluminum tubes without a cutout is shown in Fig. 11. Again,good agreement is observed. The numbers of circumferential and axial waves observed in the numerical and experimentalresults were found to be six and four, respectively.
Fig. 12 illustrates the crushing behaviors of 5D aluminum tubes with a cutout at its mid-height obtained from thenumerical simulation and experimental tests. The crushing profile (both the isometric and plan views) at 80mm crushingdistance obtained from the numerical simulation and experimental testing are compared. Similar circumferential and axialwave forms in the crushed tubes were also observed through the examination the numerical and experimental results. The
ARTICLE IN PRESS
0.0
10.0
20.0
30.0
40.0
50.0
0.0 50.0C
rush
ing
fo
rce
(kN
)
MAT1_QSMAT1_v6MAT1_v20MAT2_QSMAT2_v6MAT2_v20
0.0
10.0
20.0
30.0
40.0
50.0
100.0 150.0
Cru
shin
g forc
e (
kN
) MAT1_QSMAT1_v6MAT1_v20MAT2_QSMAT2_v6MAT2_v20
0.0
10.0
20.0
30.0
40.0
50.0
300.0
Cru
sh
ing
fo
rce
(kN
)
MAT1_QSMAT1_v6MAT1_v20MAT2_QSMAT2_v6MAT2_v20
Crushing displacement (mm)
100.0 150.0 200.0 250.0 300.0
Crushing displacement (mm)
0.0 50.0 200.0 250.0 300.0
Crushing displacement (mm)
0.0 50.0 100.0 150.0 200.0 250.0
Fig. 9. Crushing responses of the 10D steel tubes with and without a cutout subject to quasi-static and dynamic crushing.
0.0
5.0
10.0
15.0
20.0
25.0
Cru
shin
g f
orc
e (
kN
)
A5D_QS_FE result
A5D_QS_Experimental
0.0
5.0
10.0
15.0
20.0
25.0
Cru
shin
g forc
e (
kN
)
A5D90L_QS_FE
A5D90L_QS_Exp.
Crushing displacement (mm)
0.0 10.0 20.0 30.0 40.0 50.0 60.0 70.0 80.0
Crushing displacement (mm)
0.0 10.0 20.0 30.0 40.0 50.0
Fig. 10. Numerical and experimental results of the crushing force versus crushing displacement response of the 5D aluminum tubes with and without
cutout a cutout near the top end subject to quasi-static crushing.
H. Han et al. / Thin-Walled Structures 45 (2007) 283–300 293
crushing force versus time and force versus crushing displacement responses are also shown in this figure. Good agreementsare also observed in these comparisons.
Behaviors of the 5D aluminum tubes with a cutout at its 70% height (L0 ¼ 0.07L) obtained from numerical simulationand experimental test are illustrated in Fig. 13. The tubes were crushed in a global buckling mode in both numerical andexperimental observations. Good agreements are also observed in the crushing load versus time and crushing load versuscrushing displacement response.
Finally, the response of the 5D aluminum tubes with a cutout near their top end (L0 ¼ 0.90L) captured throughnumerical simulation and testing are shown in Fig. 14, with good agreement in the results.
4.2. On aluminum tubes
Fig. 4 shows the crushing responses of the 2D aluminum tubes with and without a cutout subject to quasi-static anddynamic impact loadings. The magnitudes of the peak crushing force at the formation of each wrinkle (also called thecorner crushing load) in the tubes without a cutout, as expected, are higher than those in tubes with a cutout; moreover, thehigher the impact velocity, the higher the corner crushing load in the tubes without cutout. However, it is also observed

ARTICLE IN PRESS
FE
At 80mm crushing distance At 80mm crushing distance
FE ExperimentalExperimental
0.0
5.0
10.0
15.0
20.0
25.0
Cru
sh
ing
fo
rce
(kN
) A5D_v6_Finite Element result
A5D_v6_Experimental
0.0
5.0
10.0
15.0
20.0
25.0
70.0
Cru
sh
ing
fo
rce
(kN
) A5D_v6_Finite Element result
A5D_v6_Experimental
0.0
Time (ms)
5.0 10.0 15.0 20.0 25.0 30.0
Crushing displacement (mm)
0.0 10.0 20.0 30.0 40.0 50.0 60.0 80.0
Fig. 11. Comparison of the numerical and experimental results for the 5D aluminum tube subject to dynamic crushing (v ¼ 6m/s).
H. Han et al. / Thin-Walled Structures 45 (2007) 283–300294
from Fig. 4 that the corner crushing load in 2D tubes with a cutout at its mid height is less sensitive to the change in velocitythan in tubes without a cutout. The crushing load goes steadily after the initial peak load, be it with less fluctuation, untilthe occurrence of bottoms out. It can be seen from Table 1 that the peak crushing force for the 2D tubes with and without acutout slightly increased with the increase of impact velocity. However, the variation of mean crushing force in tubes withand without cutout is found to be irregular with respect to the change in impact velocity. In general, the presence of acutout reduced the mean crushing force by about 10%. The 2D tubes without a cutout were crushed in PC2 mode, whereasthe tubes with a cutout crushed in PC3 mode.
Fig. 5 illustrates the crushing response of 5D aluminum tubes with and without a cutout subject to quasi-static anddynamic impact loadings. As stated previously, three different locations of cutout were considered. Not surprisingly, thetubes without a cutout progressively crushed in PC2 mode, and in general the energy absorption capacity increases with theincrease of impact velocity. It is found from Table 1 that the peak crushing force increases with the increase in loadingvelocity for tubes with and without a cutout. It is also found from Fig. 5 and Table 1 that the worst situation is createdwhen the cutout is located at mid-height of the tubes, and when the tube is subject to quasi-static crushing, thecorresponding crushing mode is a global buckling mode. Obviously, the presence of a cutout reduces the energy absorptioncapacity of the tubes. The negative influence of the cutout is alleviated as the cutout is moved from tubes’ mid-height tonear the top end or when the tubes are subject to dynamic crushing rather than quasi-static crushing. Interestingly, in allcases of dynamic crushing, the cutout location of L0 ¼ 0.7.L created the worst situation, in comparison to tubes with thecutout located at either L0 ¼ 0.50 or 0.90L. This phenomenon is also observed in the experimental results. The meancrushing force, absorbed energy and SEA in L0 ¼ 0.50 and 0.90L were very close to each other in the dynamic crushing,although they exhibited different crushing modes. The tubes with a cutout at L0 ¼ 0.50L were crushed essentially in PC1mode, while the tubes with a cutout at L0 ¼ 0.90L were all crushed in PC2 mode. By comparison, the tubes without acutout and tubes with a cutout at L0 ¼ 0.90L, showed that when the cutout was located near the upper end, their peakcrushing force was reduced, while less influence was observed on the mean crushing force and SEA in the tubes. This isindeed a preferred situation when designing energy absorbers.

ARTICLE IN PRESS
0.0
A5D50L_v6_Finite Element resultA5D50L_v6_Experimental
A5D50L_v6_Finite Element resultA5D50L_v6_Experimental
FEOriginal Experimental Experimental
FE
Cru
shin
g forc
e (
kN
)
20.0
15.0
10.0
5.0
0.0
Cru
shin
g forc
e (
kN
) 20.0
15.0
10.0
5.0
0.0 5.0
Time (ms)
10.0 15.0 20.0 25.0 30.0 0.0 20.0
Crushing displacement (mm)
40.0 60.0 80.0 100.0 120.0140.0
a
b c
Fig. 12. Comparison of the numerical and experimental results for the 5D aluminum tube with a cutout at its mid-height subject to dynamic crushing
(v ¼ 6m/s).
H. Han et al. / Thin-Walled Structures 45 (2007) 283–300 295
The crushing responses of the 10D aluminum tubes with and without a cutout subject to quasi-static and dynamic impactloadings are shown in Fig. 6 and summarized in Table 1. For the 10D tubes without a cutout, as the impact velocityincreased from 0 to 20m/s, the corresponding absorbed energy, peak and mean crushing forces are first increased, followedby a decreasing trend. The maximum energy absorption (EA) capacity was observed when the impact velocity was at 14m/s. Correspondingly, the crushing mode changed from PC2 to PC4 and back to PC2 as the loading velocity was increased.The same trend applies to the 10D tubes with a cutout at mid-height, in terms of the variation observed in their energyabsorption capacity as a function of the variation in impact velocity. The maximum EA capacity also occurred when theimpact velocity was at 14m/s, and the crushing mode in this case was observed as progressive crushing (PC1) mode. Thefinal failure mode of the other tubes with a cutout at their mid-height was a global buckling mode; however, their pre-global buckling mode differed. In this case, the pre-global buckling modes were a PC1 mode for v ¼ 10m/s, and PC2 modefor v ¼ 6 and 20m/s. In the 10D tubes with a cutout located at L0 ¼ 0.75 and 0.95L, their EA capacity increased as theimpact velocity increased. In tubes with a cutout at L0 ¼ 0.75L, the crushing mode changed gradually from a globalbuckling mode to a progressive crushing mode, as the impact velocity increased from 0 to 20m/s. On the other hand, thetubes with a cutout at L0 ¼ 0.95L crushed in a progressive crushing (PC2) mode, regardless of the impact velocity. Bycomparison when considering the tubes without a cutout and tubes with a cutout at L0 ¼ 0.95L, it is found that when thecutout was located near the upper end, the peak crushing force was reduced, while it had less influence on the energyabsorption capacity of the tubes. This finding conforms to that observed in the 5D aluminum tubes.
4.3. On steel tubes
As stated in Section 2, two types of steel materials, namely MAT1 and MAT2, were considered in the numerical part ofthe research. MAT1 and MAT2 have the same yield strength, but different strain hardening ratio. The strain rate effect wasaccounted when modeling the steel. One of the objectives of this study is to determine how the energy absorption capabilityis related to the variation of strain hardening ratio.

ARTICLE IN PRESS
Original
0.0 10.0 15.0 20.0 25.0
Cru
shin
g forc
e (
kN
)
A5D70L_v6_finite element result
A5D70_v6_experimental
A5D70L_v6_FE result
A5D70L_v6_Experimental
FE Experimental
25.0
20.0
15.0
10.0
5.0
0.0
Cru
shin
g forc
e (
kN
)
25.0
20.0
15.0
10.0
5.0
0.0
Time (ms)
5.0
a
b c
0.0 20.0
Crushing displacement (mm)
40.0 60.0 80.0 100.0 120.0140.0
Fig. 13. Comparison of the numerical and experimental results for the 5D aluminum tube with a cutout at L0 ¼ 0.70L subject to dynamic crushing
(v ¼ 6m/s).
H. Han et al. / Thin-Walled Structures 45 (2007) 283–300296
Fig. 7 shows the crushing response of the 2D steel tubes with and without a cutout made of MAT1 and MAT2 materials,subject to quasi-static and dynamic impact loadings. It is shown in Fig. 7 that there is a remarkable difference betweenquasi-static crushing and dynamic crushing for the steel tubes without a cutout, which is because of the strain rate effect.The peak and mean crushing forces in the dynamic crushing are much higher than those in the quasi-static crushing. Withthe increase of impact velocity, the corner crushing load grows larger, and reaches to almost the same magnitude as theinitial peak crushing forces, particularly in the tubes made of MAT1 that has higher strain hardening ratio. Interestingly, itis found that the 2D tubes made of MAT1, with a cutout at their mid-height, could absorb more energy under quasi-staticcrushing than the counterparts with no cutout, although lower peak crushing force is attained because of the cutout.However, this phenomenon would not occur in tubes made of MAT2. Both peak and mean crushing forces for the tubeswith a cutout are lower than those in the tubes without a cutout under dynamic crushing. With the increase of impactvelocity under dynamic crushing, the reduction effect due to the cutout is alleviated, as shown in Table 2. With the presenceof a cutout in the 2D tubes, the tubes made of MAT1 have much more EA capacity than the tubes made of MAT2. Ingeneral, the cutout in the 2D tubes has very small effect on the EA capability of tubes, and with some positive effect in somecase (tube made of MAT1 under quasi-static crushing). All of the tubes without a cutout are crushed in a progressivecrushing mode (PC2) and the tubes with a cutout at their mid-height are crushed in a PC3 crushing mode.
Fig. 8 shows the crushing response of the 5D steel tubes with and without a cutout made of MAT1 and MAT2, subject tothe quasi-static and dynamic impact loading. For the 5D tubes without a cutout, tubes made of MAT1 exhibited more EAcapacity than the MAT2 tubes. It was observed, the higher the impact velocity, the higher the peak and mean crushingforces, the absorbed energy and SEA. For the 5D tubes with a cutout at their mid-height (L0 ¼ 0.50L), the quasi-staticcrushing modes for both types of materials are global buckling mode. Even at relatively low-impact velocities, the tubes arealso crushed in a global buckling mode. As the impact velocity was increased from 6 to 20m/s, the crushing mode changedfrom a global buckling mode to a progressive crushing mode (PC3). The EA capacity also increased remarkably as theimpact velocity increased from 6 to 20m/s. For the 5D tubes with a cutout near their top end (L0 ¼ 0.90L), the crushingmodes for both quasi-static and dynamic crushing events were all progressive crushing modes (PC2). In every loading case,by moving the location of the cutout from mid-height to near the top end, the EA capacity of the tubes was increased

ARTICLE IN PRESS
Original FE
15.0
Cru
shin
g forc
e (
kN
)
A5D90L_v6_FE result
A5D90L_v6_Experimental
A5D90L_v6_FE result
A5D90L_v6_Experimental
0.0
Cru
shin
g forc
e (
kN
)
Experimental
25.0
20.0
15.0
10.0
0.0
5.0
0.0 5.0
Time (ms)
10.0 20.0 25.0 30.0
25.0
20.0
15.0
10.0
5.0
Crushing displacement (mm)
0.0 30.0 60.0 90.0 120.0 150.0
a
b c
Fig. 14. Comparison of the numerical and experimental results for the 5D aluminum tube with a cutout near top end (L0 ¼ 0.90L) subject to dynamic
crushing (v ¼ 6m/s).
H. Han et al. / Thin-Walled Structures 45 (2007) 283–300 297
significantly. Unlike the case of the 2D tubes, the presence of the cutout in the 5D tubes always reduced the EA capacityregardless of the cutout location.
Fig. 9 shows the crushing response of the 10D steel tubes with and without a cutout made of MAT1 and MAT2materials, subject to quasi-static and dynamic impact loadings. All the tubes without and those with a cutout near the topend (L0 ¼ 0.95L) were crushed in a progressive crushing mode (PC2). It is noted that under a dynamic crushing loadingwith an impact velocity of 6m/s, all tubes without a cutout and with a cutout near the top end (L0 ¼ 0.95L) absorbedsimilar amount of energy (1800 J). This is believed to be due to the fact that the total energy input in the system was 1800 J(0.5mv2 ¼ 0.5� 10� 62). As seen from Figs. 9a and c, it takes more crushing displacement for a MAT2 tube to absorb the1800 J input energy. This is observed in both cases of tubes without a cutout (Fig. 9a) and with a cutout near the upper end(Fig. 9c). It should be noted that in all tubes, except those subject to an impact velocity of v ¼ 6m/s, the crushing energyand the mean crushing force were calculated based on a 200mm crushing displacement in the force versus displacementcurve. However, as seen in Figs. 9a and c, when the tube is subject to an impact velocity of 6m/s, the crushingdisplacement does not reach 200mm (in fact, approximate 98–120mm); therefore, in these cases, the crushing energy andmean crushing force are calculated from the crushing displacements seen on the Figs (i.e. 98–120mm). In the 10D tubeswith a cutout at their mid-height, the crushing modes were essentially all in a global buckling mode, with the exception thatin the dynamic impact case, with a velocity of 20m/s, the tubes were first crushed in a progressive crushing mode (PC3),and finally collapsed in a global buckling mode, as shown in Fig. 9 (see also Table 2). In general, it was observed that therelationship between the EA capacity and cutout location, and the impact velocity of the 10D tubes was similar to that inthe 5D tubes.
Moreover, to further demonstrate the influence of strain rate effect in steel, all the MAT2 steel tubes subject to dynamiccrushing with an impact velocity of 20m/s, were considered with and without the strain rate effect. It is seen from Table 2that there are significant differences between the comparable case studies, in terms of the peak crushing force and energyabsorption capacity. When the strain rate effect is taken into account, the peak crushing force and the energy absorptioncapacity became significantly higher than when there was no such effect.

ARTICLE IN PRESSH. Han et al. / Thin-Walled Structures 45 (2007) 283–300298
5. Prediction of mean and peak crushing forces
The crushing behavior and response of the aluminum and steel tubes subjected to quasi-static and dynamic axialcompressive loading were presented in the previous sections. It was found that the energy absorption was relative to thetube length, material properties, cutout location and impact velocities. The research reported here demonstrated very goodagreement between the results from the experiments and numerical analyses. This observation encouraged us to conductsystematic numerical simulations and to develop appropriate empirical equations based on the result obtained. In thissection, a series of empirical equations were developed by means of linear and/or nonlinear regression analysis on the datathat was reported in Section 4. These empirical equations may be used to predict the peak and mean crushing forces ofaluminum or steel tubes with a cutout along different locations, subject to both quasi-static compression and dynamicimpact loadings with various impact velocities.
5.1. Equations for aluminum tubes
From this study, it was found that Eq. (3) could be used to predict the mean crushing force of aluminum tubes very well.Empirical equations were also developed for the aluminum tubes without a cutout, subject to both quasi-static anddynamic crushing load conditions. Under quasi-static crushing, the mean crushing forces for tubes of various lengths couldbe predicted by
Pm ¼ 4pRtsu
2t
R
� �0:7
1:01� 0:0179L
2R
� �, (6)
whereas under a dynamic crushing condition, the mean crushing force of aluminum tubes could be evaluated by thefollowing equation, which considers the variation of both tube length and impact velocity.
Pm ¼ 4pRtsu
2t
R
� �0:7
1:01� 0:0179L
2R
� �ð0:968þ 0:00654V Þ. (7)
For aluminum tubes with a cutout at various locations, the mean crushing forces for quasi-static and dynamic crushingconditions could be predicted by Eqs. (8) and (9), respectively.
Under quasi-static crushing:
Pm ¼ 4pRtsu
CN
C
2t
R
� �0:7
1:01� 0:0179L
2R
� �0:2326þ 0:9506
L0
L
� �. (8)
Under dynamic crushing:
Pm ¼ 4pRtsu
CN
C
2t
R
� �0:7
1:01� 0:0179L
2R
� �ð0:968þ 0:00654V Þ 0:732þ 0:287
L0
L
� �. (9)
Under a quasi-static crushing condition, the reference peak crushing force may be calculated by PI ¼ 2ptRs0, becausethe crushing initiation force is proportional to the net section yielding at the crushing front. That said, the peak crushingforce is also a function of the impact velocity, as shown by the results obtained from the numerical simulations reported inTables 1 and 2. For aluminum tubes with and without a cutout, the peak crushing force could be predicted by
PI_A ¼ pRtðs0 þ suÞCN
C1:02� 0:00931
L
2R
� �1:04� 0:129
L0
L
� �ð0:994þ 0:00188V Þ. (10)
In Eqs. (8)–(10) CN is the net circumference of the tubes where the cutout is located, and C is the overall circumference ofthe tubes (without a cutout). The ratio of CN over C describes the reduction effect of a cutout. Eqs. (6)–(10) are developedbased on linear regression analysis and apply to fixed-free supported tubes with L/D ratios between 2 and 10, impactvelocity of between 6 and 20m/s and the cutout location in the interval of 0.50pL0p0.95L.
5.2. Equations for steel tubes
It is known that steel is a strain rate-sensitive material, thus sensitive to the variation in impact velocity. In this study, itwas found that a model developed based on combining Joans [13] and Magee and Thornton [4] models could be used topredict the mean crushing force in steel tubes, subject to low or intermediate-velocity (up to 20m/s) axial impact, with good

ARTICLE IN PRESSH. Han et al. / Thin-Walled Structures 45 (2007) 283–300 299
accuracy, the model can be represented by
Pm ¼ 4pRtsu
2t
R
� �0:7
1þV 0
4RD
� �1=q" #
. (11)
Based on Eq. (11), nonlinear regression analysis is conducted to develop the empirical equations predicting the mean andpeak crushing forces of steel tubes subject to quasi-static compression and dynamic impact loading. For steel tubes withoutcutout, the mean crushing force can be predicted by
Pm ¼ 4pRtsu
2t
R
� �0:7
0:951� 0:0149L
2R
� �1:42� 0:371
su
s0
� �1þ
V 0
4RD
� �1=q" #
. (12)
For steel tubes with a cutout, the mean crushing force can be predicted by
Pm ¼ 4pRtsu
CN
C
2t
R
� �0:7
0:39864þL0
L
L
2R
� ��0:55206 su
s0
� ��0:117211þ
V0
4RD
� �1=q" #( )
. (13)
The same approach can also be used to determine the peak force (crushing initiation force) of the tubes subject to eitherquasi-static compression or dynamic axial impact. Since the peak crushing force is a function of material properties andimpact velocity, the following equation can be used to produce a base value for determining the peak crushing forces ofsteel tubes of various lengths with or without a cutout:
PI_S ref ¼ 2ptRs0 1þV0
4RD
� �1=q" #
. (14)
For steel tubes without a cutout, the peak crushing force can be predicted by
PI_S ¼ 2ptRs0 1:22� 0:0153L
2R
� �0:999þ 0:0893
su
s0
� �1þ
V 0
4RD
� �1=q" #
. (15)
For steel tubes with a cutout, the peak crushing force can be predicted by
PI_S ¼ 2ptRs0CN
C1þ 0:624881
L0
L
� �L
2R
� ��0:43694 su
s0
� �1þ
V 0
4RD
� �1=q" #( )
. (16)
As can be seen both the mean and peak crushing forces are function of the tubes’ length/radius ratio, materials strainhardening ratio and strain rate parameters, and the impact velocity. Eqs. (12)–(13) and (15)–(16) apply to steels tubesconfined by the following conditions:
2pL=Dp10; 1:32psu=s0p1:65; 0:50pL0=Lp0:95; and 6:0pV0p20:0m=s
If the impact velocity approaches zero, then Eqs. (11)–(16) automatically produce the corresponding quasi-staticcrushing values.
6. Conclusions
Quasi-static and dynamic crushing response and energy absorption capacity of aluminum and steel tubes with andwithout a cutout were studied numerically and experimentally. The influence of location of cutout on the energy absorptioncapacity of tubes having various length/radius ratios, subject to various impact loading conditions, was investigated, bothnumerically and experimentally. Very good agreements were observed between numerical and experimental results. Thenumerical studies also investigated the response of tubes made of strain rate insensitive (aluminum) and sensitive (steel)materials.
The results revealed that in quasi-static crushing, the energy absorption efficiency of both aluminum and steel tubes wasimproved when the cutout location was moved from mid-height to their top end. In general, when the cutout was located atthe mid-height, the tubes were crushed in a global buckling mode; conversely, when the cutout is located near the top end,the tubes crushed in a progressive crushing mode.
Under dynamic impact conditions, as the impact velocity increased, the negative influence of the cutout was decreased.However, this trend was not observed for the specific case of 5D aluminum tubes with a cutout located at L0 ¼ 0.70L whensubject to dynamic crushing, and the 2D steel tubes with a cutout at their mid-height, subject to quasi-static crushing.

ARTICLE IN PRESSH. Han et al. / Thin-Walled Structures 45 (2007) 283–300300
Empirical equations for predicting the mean and peak crushing forces of aluminum and steel tubes with and without acutout were developed based on combining the approaches used by Joans [13] and Magee et al. [4]. These equations werebased on linear and nonlinear fit to the results obtained from the parametric numerical study conducted in this research.
Acknowledgments
The financial support of the Natural Sciences and Engineering Council of Canada (NSERC) in the form of DiscoveryGrants to the second and third authors in support of this work is gratefully acknowledged.
References
[1] Alghamdi AAA. Collapsible impact energy absorbers: an overview. Thin-Wall Struct 2001;39:189–213.
[2] Yamashita M, Gotoh M, Sawairi Y. Axial crush of hollow cylindrical structures with various polygonal cross-sections numerical simulation and
experiment. J Mater Process Technol 2003;140:59–64.
[3] Alexander JM. An approximate analysis of the collapse of thin cylindrical shells under axial loading. Quart J Mechd Appl Math 1960;13:10–5.
[4] Magee CL, Thornton PH. Design consideration in energy absorption by structural collapse. SAE Technical paper no. 780434, 1978.
[5] Zhao H, Abdennadher S. On the strength enhancement under impact loading of square tubes made from rate insensitive metals. Int J Solids Struct
2004;41:6681–97.
[6] Schneider F, Joans N. Impact of thin-wall high strength steel structural section, In: Proceedings of the institution of mechanical engineers 218 (D): J
Automob Eng, 2004; 131–158.
[7] Dipaolo BP, Monteiro PJM, Gronsky R. Quasi-static axial crush response of a thin-wall, stainless steel box component. Int J Solids Struct
2004;41:3707–33.
[8] Wang B, Lu G. Mushrooming of circular tubes under dynamic axial loading. Thin-Wall Struct 2002;40:167–82.
[9] Mantena PR, Mann R. Impact and dynamic response of high-density structural foams used as filler inside circular steel tube. Compos Struct
2003;61:291–302.
[10] Bouchet J, Jacquelin E, Hamelin P. Static and dynamic behavior of combined composite aluminum tube for automotive applications. Compos Sci
Technol 2000;60:1891–900.
[11] Mamalis AG, Manolakos DE, Ioannidis MB, Kostazos PK. Crushing of hybrid square sandwich composite vehicle hollow bodyshells with reinforced
core subjected to axial loading: numerical simulation. Compos Struct 2003;61:175–86.
[12] Marsoleka J, Reimerdes HG. Energy absorption of metallic cylindrical shells with induced non-axisymmetric folding patterns. Int J Impact Eng
2004;30:1209–23.
[13] Joans N. Structural impact. Cambridge University Press; 1997.
[14] Kormi K, Webb DC, Montague P. Crash behavior of circular tubes with large side openings. Int J Mech Sci 1993;35(3/4):193–208.
[15] Sahu SK, Datta PK. Dynamic stability of curved panels with cutouts. J Sound Vib 2002;251(4):683–96.
[16] Sahu SK, Datta PK. Dynamic stability of laminated composite curved panels with cutouts. J Eng Mech ASCE 2003:1245–53.
[17] Han HP, Taheri F, Cheng JQ, Pegg N. Numerical and experimental investigations of the response of aluminum cylinders with a cutout subject to
axial compression. Thin Wall Struct 2006;44:254–70.
[18] LS-DYNA keyword user’s manual, V970, LSTC, Livermore, CA, 2005.
[19] El-Hage HH. A numerical study on the quasi-static axial crush characteristics of square aluminum and aluminum-composite hybrid tubes, PhD
thesis, University of Windsor, 2004.
[20] Olovsson L, Simonsson K, Unosson M. Selective mass scaling for explicit finite element analyses. Int J Num Meth Eng 2005;63:1436–45.