thin-mat floating marsh enhancement demonstration project ... final report.pdf · thin-mat floating...
TRANSCRIPT

FINAL REPORT
THIN-MAT FLOATING MARSH ENHANCEMENT DEMONSTRATION PROJECT TE-36
Seventh Priority List Demonstration Project of the Coastal Wetlands Planning, Protection, and Restoration Act (Public Law 101-646)
Charles E. Sasser, Guerry O. Holm, Jr., Jenneke M. Visser, and Erick M. Swenson
Coastal Ecology Institute School of the Coast & Environment
Louisiana State University Baton Rouge, LA 70803
March 2005

ii
TABLE OF CONTENTS
LIST OF FIGURES ....................................................................................................................... iv
LIST OF TABLES....................................................................................................................... viii
ACKNOWLEDGMENTS ............................................................................................................. ix
INTRODUCTION .......................................................................................................................... 1 Project Objectives ....................................................................................................................... 4
STUDY AREA ............................................................................................................................... 5
VEGETATION............................................................................................................................. 10 Introduction............................................................................................................................... 10 Methods..................................................................................................................................... 10 Results....................................................................................................................................... 12
Transplant Survival............................................................................................................... 12 Biomass................................................................................................................................. 13 Vegetation Cover .................................................................................................................. 15 Tissue Nutrients .................................................................................................................... 21
Discussion................................................................................................................................. 24
WATER AND MARSH SURFACE DYNAMICS ...................................................................... 25 Introduction............................................................................................................................... 25 Methods..................................................................................................................................... 25
Gauge Description ................................................................................................................ 25 Gauge Calibration and Setup ................................................................................................ 26 Gauge Deployment ............................................................................................................... 27 Vertical Movement of the Marsh Mat .................................................................................. 27 Data Analysis ........................................................................................................................ 28
Results....................................................................................................................................... 29 Discussion................................................................................................................................. 43
SOIL AND WATER PROPERTIES ............................................................................................ 46 Introduction............................................................................................................................... 46 Methods..................................................................................................................................... 46
Belowground Biomass .......................................................................................................... 46 Water Nutrients..................................................................................................................... 46 Soil Nutrients ........................................................................................................................ 46 Bulk Properties...................................................................................................................... 47 Soil Strength and Mat Thickness .......................................................................................... 47 Suspended Sediments............................................................................................................ 48 Site Specific Analyses........................................................................................................... 48
Results....................................................................................................................................... 48 Belowground Biomass .......................................................................................................... 48 Water Nutrients..................................................................................................................... 49 Soil Nutrients ........................................................................................................................ 52

iii
Bulk Properties...................................................................................................................... 55 Soil Strength and Mat Thickness .......................................................................................... 55 Suspended Sediments............................................................................................................ 55
Discussion................................................................................................................................. 67
DISCUSSION............................................................................................................................... 69
CONCLUSIONS........................................................................................................................... 71
RECOMMENDATIONS.............................................................................................................. 72
REFERENCES ............................................................................................................................. 73

iv
LIST OF FIGURES Figure 1. Location of the project sites and the site used to collect Panicum hemitomon
plugs for transplant treatments (Donor Site) ................................................................5
Figure 2. Generalized layout of each site showing the eight treatments and station numbers within each site. .............................................................................................8
Figure 3. Survival of Panicum hemitomon transplants (plugs) in the first three months after transplantation. ...................................................................................................12
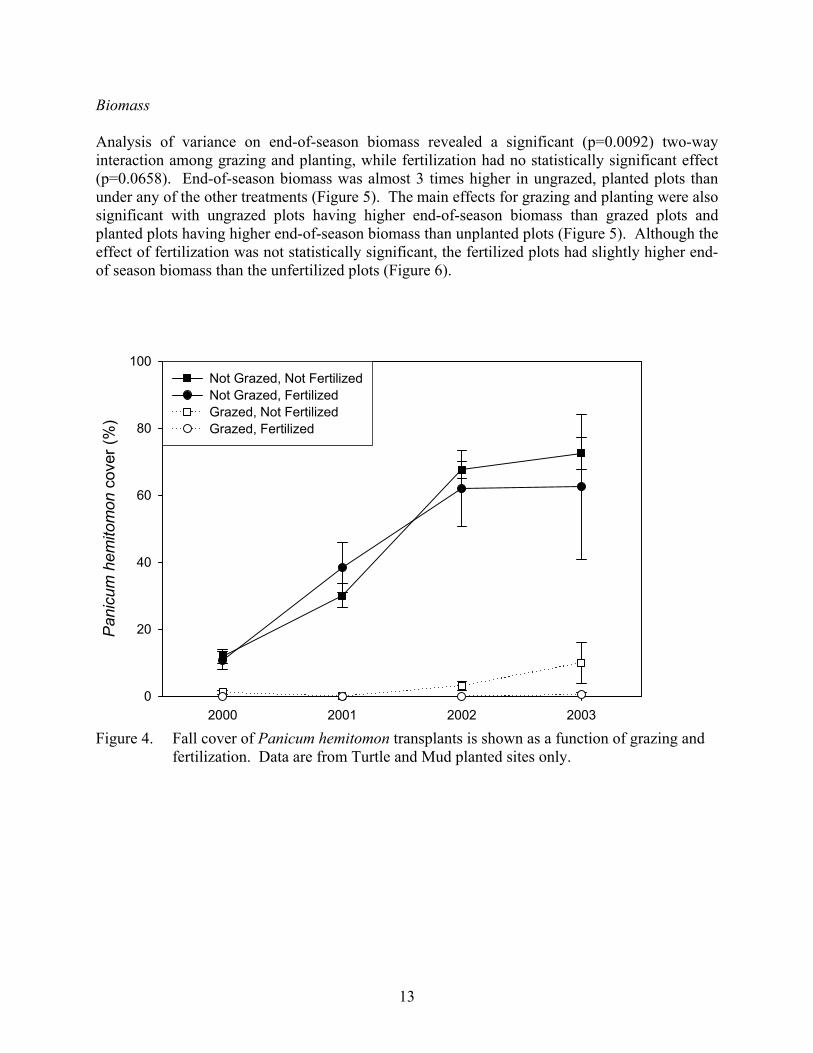
Figure 4. Fall cover of Panicum hemitomon transplants is shown as a function of grazing and fertilization..............................................................................................13
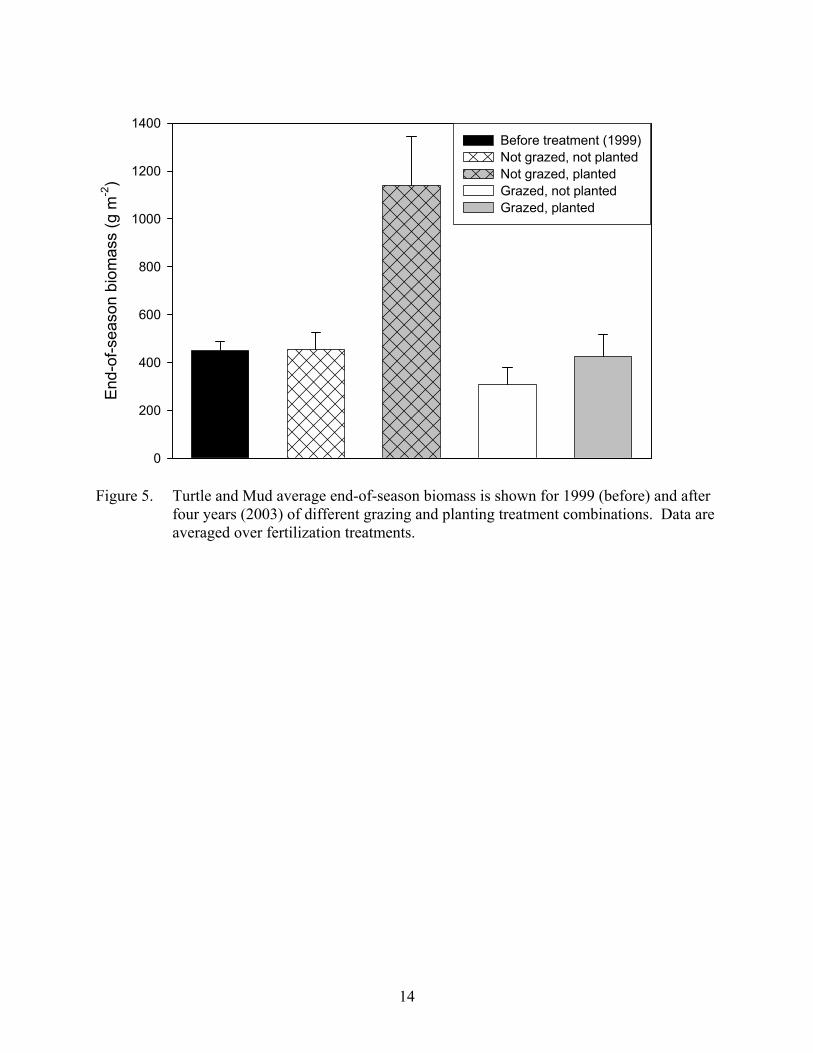
Figure 5. Turtle and Mud average end-of-season biomass is shown for 1999 (before) and after four years (2003) of different grazing and planting treatment combinations...............................................................................................................14
Figure 6. Turtle and Mud average end-of-season biomass is shown for 1999 (before) and after four years (2003) of either unfertilized or fertilized treatment ...................15
Figure 7. Percent cover estimated at the 4 sites in September 1999..........................................16
Figure 8. Effect of the different treatments on the number of species in each plot ...................17
Figure 9. Effect of the different treatments on the total vegetative cover in each plot..............18
Figure 10. The interaction of the effects of grazing and planting on Eleocharis baldwinii cover ...........................................................................................................................19
Figure 11. Effect of the different treatments on Eleocharis baldwinii cover ..............................20
Figure 12. Nitrogen and phosphorus content of Panicum hemitomon tissues collected. ............22
Figure 13. Tissue Nitrogen and Phosphorus concentrations in species mixtures harvested from Turtle and Mud over the period of study ...........................................................23
Figure 14. Photograph of a typical interior marsh site.................................................................26
Figure 15. Diagram of a vertical movement indicator (VMI) used to measure the maximum vertical movement of the marsh surface ...................................................29
Figure 16. Time series plots of hourly open water level measurements from the four study sites in the Penchant marshes............................................................................30
continued

v
LIST OF FIGURES continued Figure 17. Time series plots of hourly marsh water level measurements from the four
study sites in the Penchant marshes............................................................................31
Figure 18. Time series plots of hourly marsh mat level measurements from mat sensor 1 at the four study sites in the Penchant marshes ..........................................................32
Figure 19. Time series plots of hourly marsh mat level measurements from mat sensor 2 at the four study sites in the Penchant marshes ..........................................................33
Figure 20. Time series plots of daily mean water at the open level recorder at all of the sites and daily stage of the Atchafalaya River in Morgan City.................................37
Figure 21. Plot of daily mean open water level at site Turtle versus daily stage of the Atchafalaya River at Morgan City .............................................................................38
Figure 22. Plot of daily mean open water level at site Mud versus daily stage of the Atchafalaya River at Morgan City .............................................................................38
Figure 23. Plot of daily mean open water level at site Texaco versus daily stage of the Atchafalaya River at Morgan City .............................................................................39
Figure 24. Plot of daily mean open water level at site Towhead versus daily stage of the Atchafalaya River at Morgan City .............................................................................39
Figure 25. Plot of daily mean marsh water level versus daily mean mat levels for sensor 1 and sensor 2 at site Turtle........................................................................................40
Figure 26. Plot of daily mean open water level versus daily mean mat levels for sensor 1 and sensor 2 at site Mud .............................................................................................40
Figure 27. Plot of daily mean open water level versus daily mean mat levels for sensor 1 and sensor 2 at site Texaco.........................................................................................41
Figure 28. Plot of daily mean open water level versus daily mean mat levels for sensor 1 and sensor 2 at site Towhead......................................................................................41
Figure 29. Average vertical mat movement, in centimeters, from the eight vertical movement indicators for each site from each sampling trip over the time period of March, 2000 through October, 2001...........................................................41
Figure 30. Plot of daily mean open water level versus daily mean marsh water levels at all of the study sites ....................................................................................................44
continued
vi
LIST OF FIGURES continued Figure 31. Live belowground biomass by treatment harvested in autumn 2003 .........................49
Figure 32. A comparison of marsh pore water nutrients from the upper 5-8 cm of fertilized and unfertilized plots at sites Turtle (upper graph) and Mud (lower graph)..........................................................................................................................50
Figure 33. A comparison of Fall 2003 marsh pore water concentrations at 5 cm (upper) and 25 cm (lower) depths at two experimental sites and a donor marsh dominated by Panicum hemitomon ............................................................................51
Figure 34. A comparison of open water nutrient availability directly adjacent to the experimental sites (fall 1999-fall 2003; n=33 for each analyte).................................52
Figure 35. Carbon to nitrogen ratio of dry soil measured prior to experimental manipulation (1999; black) and at the end of the experiment (2003; grey) at each site ......................................................................................................................53
Figure 36. Total nitrogen of dry soil measured prior to experimental manipulation (1999; black) and at the end of the experiment (2003; grey) at each site ..................54
Figure 37. Soil-P (plant available) measured prior to experimental manipulation (1999; black) and at the end of the experiment (2003; grey) at each site..............................56
Figure 38. Soil-K+ measured prior to experimental manipulation (1999; black) and at the end of the experiment (2003; grey) at each site .........................................................57
Figure 39. Soil-Na+ measured prior to experimental manipulation (1999; black) and at the end of the experiment (2003; grey) at each site....................................................58
Figure 40. Soil-Ca2+ measured prior to experimental manipulation (1999; black) and at the end of the experiment (2003; grey) at each site....................................................59
Figure 41. Soil-Mg2+ measured prior to experimental manipulation (1999; black) and at the end of the experiment (2003; grey) at each site....................................................60
Figure 42. Soil bulk density and organic matter percentage for each site prior to treatment application (1999; black) and at the end of the experiment (2003; grey)............................................................................................................................61
Figure 43. An overall increase in the mineral density at both Turtle and Mud sites occurred between the beginning of the experiment (1999) and the end (2003).........62
continued

vii
LIST OF FIGURES continued Figure 44. Soil strength of sites Turtle (shaded circles) and Mud (open) at the end of the
experiment (spring 2004) by each treatment combination. ........................................63
Figure 45. Estimates of root mat thickness (the portion of the soil profile containing the greatest concentration of live roots that form a cohesive unit) at the end of the experiment (spring 2004) ...........................................................................................64
Figure 46. Average suspended mineral and organic matter in the open water adjacent to each site for the period 2000-2002 .............................................................................65
Figure 47. Suspended mineral sediment concentration in the open water adjacent to each site...............................................................................................................................66
viii
LIST OF TABLES Table 1. Plant species found in thin-mat spikerush and thick-mat maidencane marshes
within the project area. ...............................................................................................3
Table 2. Coordinates for the four project sites. ..........................................................................5
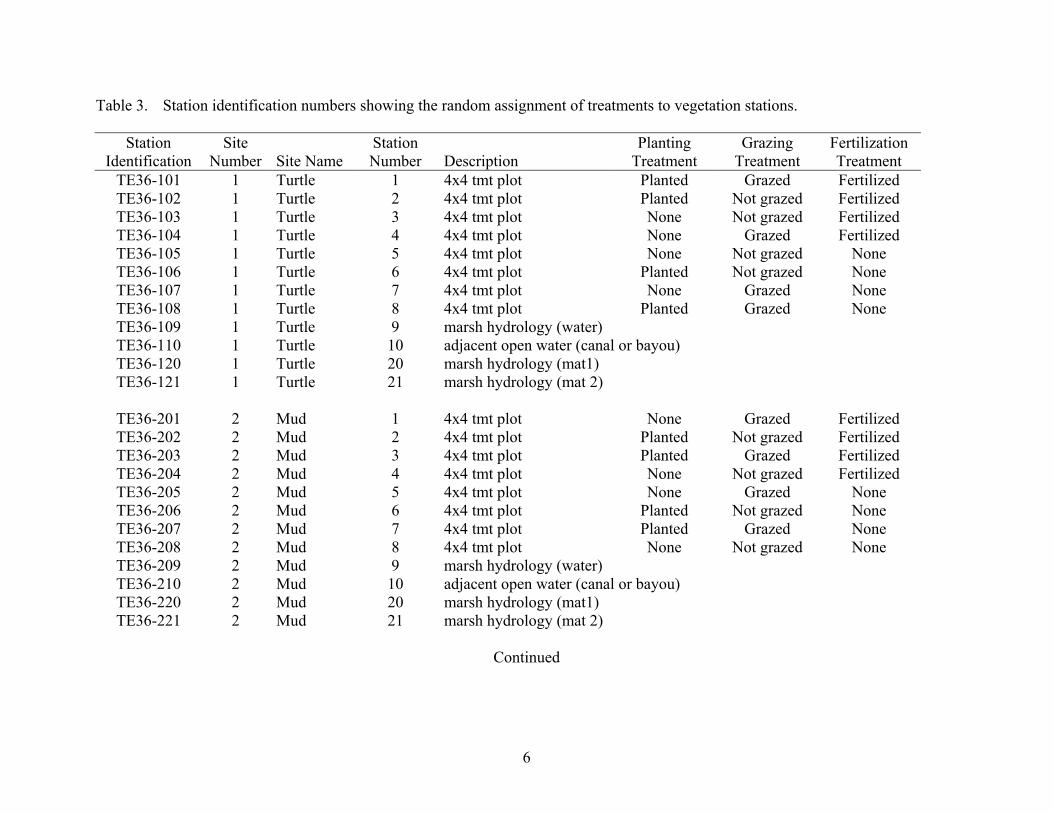
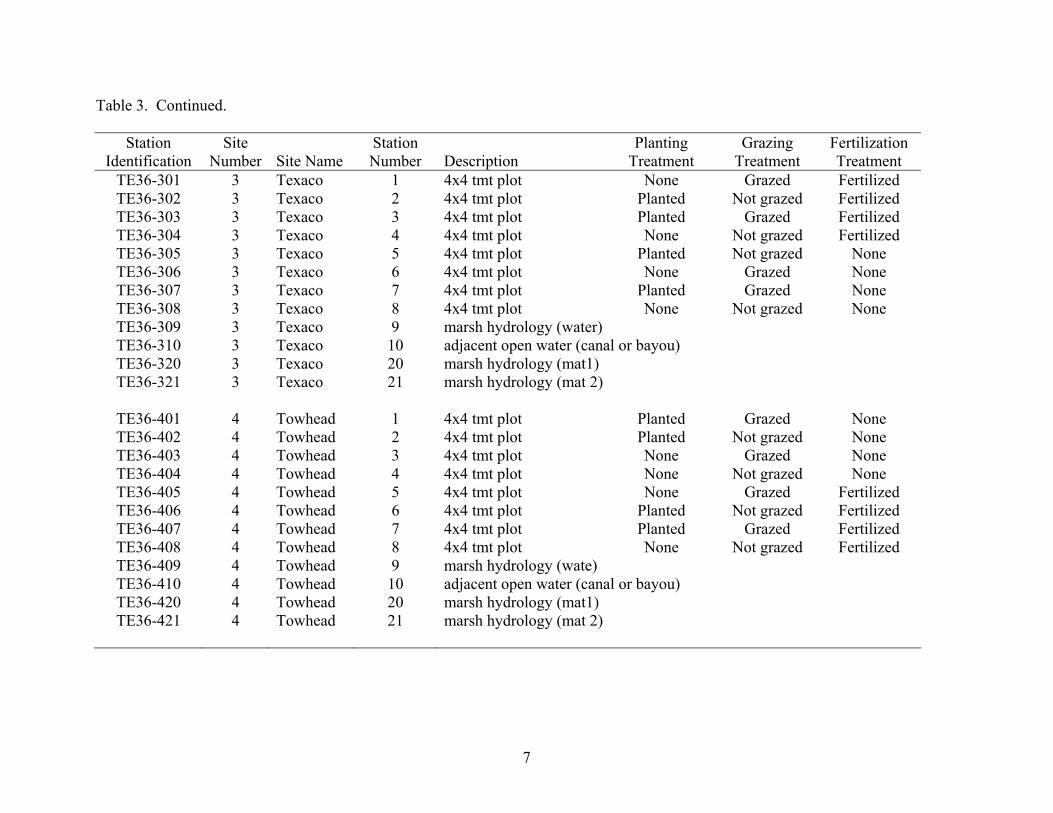
Table 3. Station identification numbers showing the random assignment of treatments to vegetation stations. ...................................................................................................6
Table 4. Treatments that were compromised by nutria grazing during the winter of 2000-01.........................................................................................................................9
Table 5. Dates that vegetation was sampled during this study. ................................................11
Table 6. Nitrogen and phosphorus content of Eleocharis baldwinii tissue harvested from the study sites in September 1999, and Panicum hemitomon tissue harvested from the donor site in May 2000................................................................21
Table 7. Summary of deployment times for each of the study sites.........................................28
Table 8. Correlation of hourly water levels between sites for the CWPPRA TE-36 project sites in the Penchant marsh area.....................................................................34
Table 9. Correlation of hourly water and mat levels, within a site, for the CWPPRA TE-36 project sites in the Penchant marsh area..........................................................35
Table 10. Sampling dates for pore water nutrients. ....................................................................47

ix
ACKNOWLEDGMENTS We appreciate the help provided by numerous people during this project. LSU personnel who assisted in various phases of the project included Elaine Evers, Eura DeHart, Gary Peterson, Kelly Kinler, Heather Haas, Chris Baker, Jay Gore, and Kate Carpenter. Dr. James G. Gosselink provided helpful advice throughout the project, and reviewed the comprehensive report. LDNR and NRCS personnel played important roles in the project in various ways from concept to completion, and included: Darin Lee, Elaine Lear, Todd Folse, Cindy Steyer, and Tim Landrineau. We gratefully acknowledge Continental Land & Fur Co., Inc. for allowing the use of marshes on their property for the demonstration project field sites, and particularly thank Mr. George Strain and Mr. Herman Crawford for their assistance with that part of the project. This project was funded by the Coastal Wetlands Planning, Protection, and Restoration Act (CWPPRA) Task Force.
1
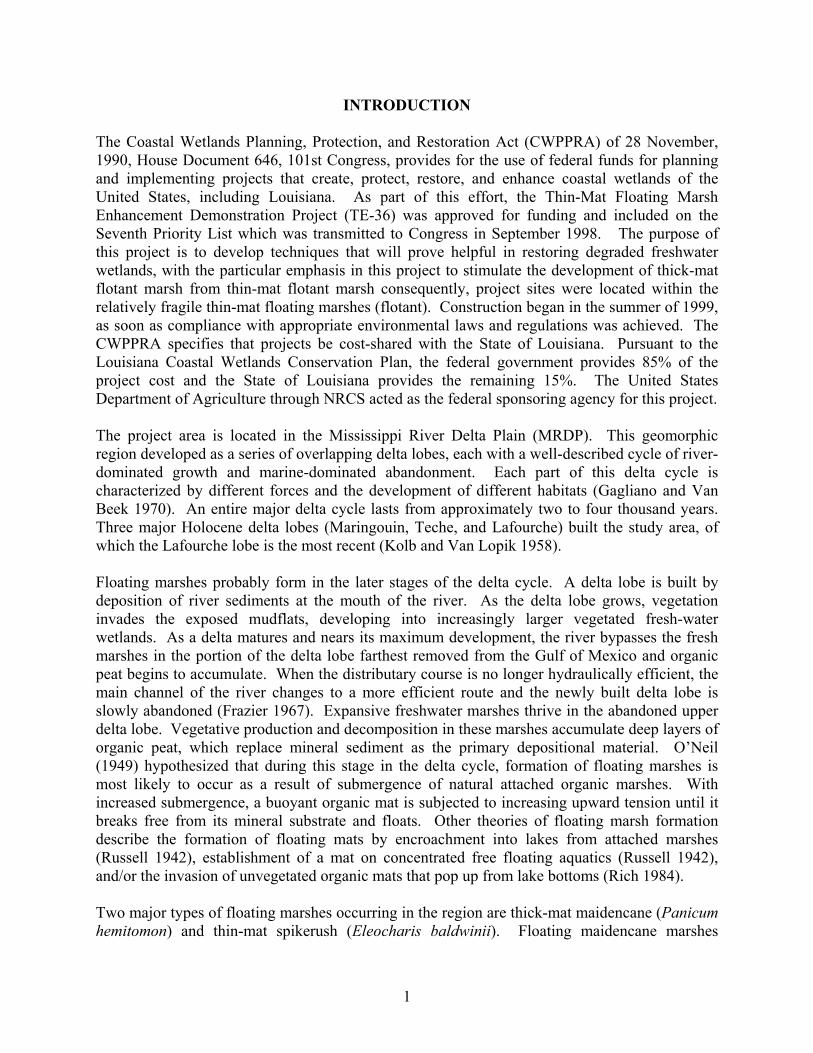
INTRODUCTION The Coastal Wetlands Planning, Protection, and Restoration Act (CWPPRA) of 28 November, 1990, House Document 646, 101st Congress, provides for the use of federal funds for planning and implementing projects that create, protect, restore, and enhance coastal wetlands of the United States, including Louisiana. As part of this effort, the Thin-Mat Floating Marsh Enhancement Demonstration Project (TE-36) was approved for funding and included on the Seventh Priority List which was transmitted to Congress in September 1998. The purpose of this project is to develop techniques that will prove helpful in restoring degraded freshwater wetlands, with the particular emphasis in this project to stimulate the development of thick-mat flotant marsh from thin-mat flotant marsh consequently, project sites were located within the relatively fragile thin-mat floating marshes (flotant). Construction began in the summer of 1999, as soon as compliance with appropriate environmental laws and regulations was achieved. The CWPPRA specifies that projects be cost-shared with the State of Louisiana. Pursuant to the Louisiana Coastal Wetlands Conservation Plan, the federal government provides 85% of the project cost and the State of Louisiana provides the remaining 15%. The United States Department of Agriculture through NRCS acted as the federal sponsoring agency for this project. The project area is located in the Mississippi River Delta Plain (MRDP). This geomorphic region developed as a series of overlapping delta lobes, each with a well-described cycle of river-dominated growth and marine-dominated abandonment. Each part of this delta cycle is characterized by different forces and the development of different habitats (Gagliano and Van Beek 1970). An entire major delta cycle lasts from approximately two to four thousand years. Three major Holocene delta lobes (Maringouin, Teche, and Lafourche) built the study area, of which the Lafourche lobe is the most recent (Kolb and Van Lopik 1958). Floating marshes probably form in the later stages of the delta cycle. A delta lobe is built by deposition of river sediments at the mouth of the river. As the delta lobe grows, vegetation invades the exposed mudflats, developing into increasingly larger vegetated fresh-water wetlands. As a delta matures and nears its maximum development, the river bypasses the fresh marshes in the portion of the delta lobe farthest removed from the Gulf of Mexico and organic peat begins to accumulate. When the distributary course is no longer hydraulically efficient, the main channel of the river changes to a more efficient route and the newly built delta lobe is slowly abandoned (Frazier 1967). Expansive freshwater marshes thrive in the abandoned upper delta lobe. Vegetative production and decomposition in these marshes accumulate deep layers of organic peat, which replace mineral sediment as the primary depositional material. O’Neil (1949) hypothesized that during this stage in the delta cycle, formation of floating marshes is most likely to occur as a result of submergence of natural attached organic marshes. With increased submergence, a buoyant organic mat is subjected to increasing upward tension until it breaks free from its mineral substrate and floats. Other theories of floating marsh formation describe the formation of floating mats by encroachment into lakes from attached marshes (Russell 1942), establishment of a mat on concentrated free floating aquatics (Russell 1942), and/or the invasion of unvegetated organic mats that pop up from lake bottoms (Rich 1984). Two major types of floating marshes occurring in the region are thick-mat maidencane (Panicum hemitomon) and thin-mat spikerush (Eleocharis baldwinii). Floating maidencane marshes
2
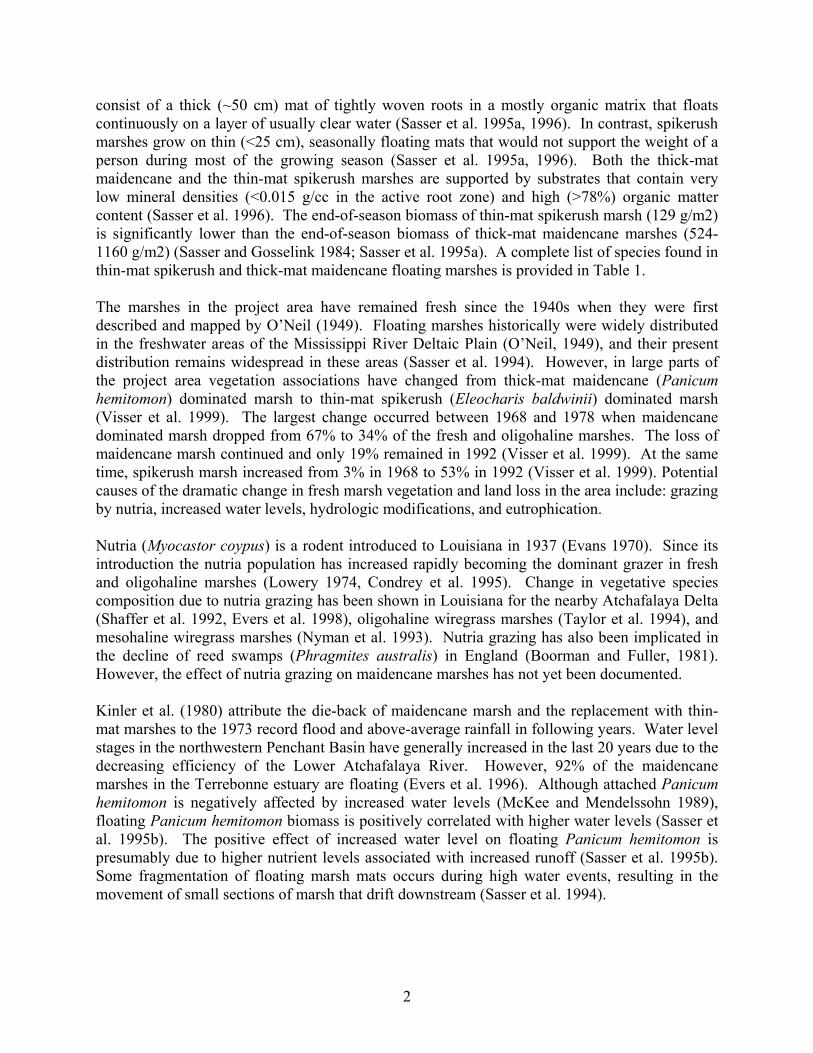
consist of a thick (~50 cm) mat of tightly woven roots in a mostly organic matrix that floats continuously on a layer of usually clear water (Sasser et al. 1995a, 1996). In contrast, spikerush marshes grow on thin (<25 cm), seasonally floating mats that would not support the weight of a person during most of the growing season (Sasser et al. 1995a, 1996). Both the thick-mat maidencane and the thin-mat spikerush marshes are supported by substrates that contain very low mineral densities (<0.015 g/cc in the active root zone) and high (>78%) organic matter content (Sasser et al. 1996). The end-of-season biomass of thin-mat spikerush marsh (129 g/m2) is significantly lower than the end-of-season biomass of thick-mat maidencane marshes (524-1160 g/m2) (Sasser and Gosselink 1984; Sasser et al. 1995a). A complete list of species found in thin-mat spikerush and thick-mat maidencane floating marshes is provided in Table 1. The marshes in the project area have remained fresh since the 1940s when they were first described and mapped by O’Neil (1949). Floating marshes historically were widely distributed in the freshwater areas of the Mississippi River Deltaic Plain (O’Neil, 1949), and their present distribution remains widespread in these areas (Sasser et al. 1994). However, in large parts of the project area vegetation associations have changed from thick-mat maidencane (Panicum hemitomon) dominated marsh to thin-mat spikerush (Eleocharis baldwinii) dominated marsh (Visser et al. 1999). The largest change occurred between 1968 and 1978 when maidencane dominated marsh dropped from 67% to 34% of the fresh and oligohaline marshes. The loss of maidencane marsh continued and only 19% remained in 1992 (Visser et al. 1999). At the same time, spikerush marsh increased from 3% in 1968 to 53% in 1992 (Visser et al. 1999). Potential causes of the dramatic change in fresh marsh vegetation and land loss in the area include: grazing by nutria, increased water levels, hydrologic modifications, and eutrophication. Nutria (Myocastor coypus) is a rodent introduced to Louisiana in 1937 (Evans 1970). Since its introduction the nutria population has increased rapidly becoming the dominant grazer in fresh and oligohaline marshes (Lowery 1974, Condrey et al. 1995). Change in vegetative species composition due to nutria grazing has been shown in Louisiana for the nearby Atchafalaya Delta (Shaffer et al. 1992, Evers et al. 1998), oligohaline wiregrass marshes (Taylor et al. 1994), and mesohaline wiregrass marshes (Nyman et al. 1993). Nutria grazing has also been implicated in the decline of reed swamps (Phragmites australis) in England (Boorman and Fuller, 1981). However, the effect of nutria grazing on maidencane marshes has not yet been documented. Kinler et al. (1980) attribute the die-back of maidencane marsh and the replacement with thin-mat marshes to the 1973 record flood and above-average rainfall in following years. Water level stages in the northwestern Penchant Basin have generally increased in the last 20 years due to the decreasing efficiency of the Lower Atchafalaya River. However, 92% of the maidencane marshes in the Terrebonne estuary are floating (Evers et al. 1996). Although attached Panicum hemitomon is negatively affected by increased water levels (McKee and Mendelssohn 1989), floating Panicum hemitomon biomass is positively correlated with higher water levels (Sasser et al. 1995b). The positive effect of increased water level on floating Panicum hemitomon is presumably due to higher nutrient levels associated with increased runoff (Sasser et al. 1995b). Some fragmentation of floating marsh mats occurs during high water events, resulting in the movement of small sections of marsh that drift downstream (Sasser et al. 1994).

3
Table 1. Plant species found in thin-mat spikerush and thick-mat maidencane marshes within the project area. Based on Sasser et al. (1994, 1995a) and Visser et al. (1999).
Scientific Name Common Name Marsh* Aeschynomene indica L. Sensitive Joint Vetch SAlthernanthera philoxeroides (Mart.) Griseb. Alligatorweed M,S Amaranthus australis (Gray) Sauer Southern Waterhemp M Andropogon glomeratus (Walter) B.S.P. Broomsedge M,S Bacopa monnieri (L.) Wettst. Coastal Waterhyssop M,S Bidens laevis (L.) B.S.P. Smooth Beggar-tick, Fouchet S Boehmeria cylindrica (L.) Sw. False Nettle M Cephalanthus occidentalis L. Buttonbush M,S Colocasia antiquorum (L.) Schot Elephant-ear M,S Conoclinium coelestinum (L.) DC. Mistflower M,S Cyperus odoratus L. Fragrant Sedge M,S Cyperus polystachyos Rottb. Sedge M,S Decodon verticillatus (L.) Elliott Water-willow M,S Dichromena colorata (L.) Hitchc. White-top Sedge M,S Echinochloa crusgalli (L.) Beauv. Barnyard grass M,S Eichornia crassipes (Mart.) Solms. Water hyacinth S Eleocharis albida Torr. Spikerush M,S Eleocharis baldwinii (Torr.) Chapman. Spikerush S Eleocharis macrostachya Britt Largespike Spikerush M Eleocharis parvula (R.&S.) Link. Dwarf Spikerush M,S Eupatorium capillifolium (Lam.) Small. Dog-fennel M,S Fuirena pumila (Torr.) Spreng. Umbrella Grass S Hibiscus lasciocarpus Cav. Marsh Mallow M,S Hydrocotyle ranunculoides L. Floating Pennywort S Hydrocotyle umbellata L. Marsh Pennywort M,S Ipomoea sagittata Poir in Lam. Saltmarsh Morningglory M Kosteletzkia virginica (L.) K. Presl ex Gray Seashore Marshmallow M Leersia oryzoides (L.) Sw. Rice Cutgrass M,S Limnobium spongia (Bosc.) Steud. Common Frogbit S Ludwigia leptocarpa (Nutt.) Hara False Loosestrife M,S Myrica cerifera L. Waxmyrtle M,S Panicum hemitomon Schult. Maidencane, Paille Fine M,S Panicum sp. M,S Paspalum vaginatum Sw. Seashore Paspalum M,S Phragmites australis (Cav.) Trin. ex Steud. Common Reed, Roseau Cane M,S Phyla lanceolata (Michx.) Greene Lance-leafed Frogfruit M,S Polygonum punctatum Ell. Dotted Smartweed M,S Pontedaria cordata L. Pickerelweed M Ptilimnium capillaceum (Michx.) Raf. Mock Bishop’s Weed M Sacciolepis striata (L.) Nash Bagscale M,S Sagittaria lancifolia L. Bulltongue M,S Sagittaria latifolia Wild. Arrowhead, Wapato M,S Scirpus americanus Pers. Three Square M Scirpus cubensis Poepp. & Kunth in Kunth Sedge S Setaria geniculata (Lam.) Beauv. Foxtail M,S Solidago sempervirens L. Seaside Goldenrod M,S Thelypteris palustris Schott. Marsh Fern M,S Triadenum virginicum (L.) Raf. Marsh St. John’s-wort M,S Typha latifolia L. Cattail M,S Vigna luteola (Jacq.) Benth. Deerpea M *M=Maidencane, S=Spikerush

4
A large number of oil and gas access canals have changed the hydrology of this region since the 1950s. This, in combination with the construction of the Avoca Island Cutoff levee, has changed the historical overland flooding in the project area. The area is somewhat isolated from the major flows of the region, with lower flow rates and low suspended load (Sasser et al., 1995a). It is therefore plausible that the conversion of the high productivity maidencane floating marsh to a low productivity spikerush floating marsh could be a result of reduced nutrient input. In contrast, some researchers believe that the demise of the maidencane marsh in the project area is due to eutrophication. Eutrophication has been indicated in the demise of reed swamps (Phragmites australis marshes) in Europe (Klötzli 1971). An increase in the nitrogen to potassium ratio in the environment results in less sclerenchymatous tissue in the Phragmites australis rhizomes as well as a decrease in belowground biomass of floating reed (Boar et al. 1989). Therefore, floating reed swamps are more prone to breakup and are lost from eutrophic waters, while attached marshes are unaffected (Boar et al. 1989). Although both nitrogen and phosphorus concentrations have significantly increased in the waters of the Mississippi and Atchafalaya rivers since the 1960s, the only water quality station near the project area (Bayou Black at Gibson) showed no significant trends in water quality (turbidity, dissolved oxygen, total nitrogen, nitrate and nitrite, total phosphorus and total carbon) between 1958 and 1991 (Rabalais et al. 1995). This, in addition to the apparent lack of penetration of these sediment-laden waters into the project area, makes it seem unlikely that eutrophication is the driving factor in the observed demise of maidencane marsh. Project Objectives The objective of this demonstration project was to induce the development of thick-mat floating marsh in thin-mat floating marsh areas. Three methods were used to enhance growth of the naturally vegetated mat: (1) transplanting plant species of existing Panicum hemitomon-dominated thick-mat floating marshes into the thin-mat areas, (2) induce growth through fertilization, and (3) induce growth through reduction of mammal grazing. The combinations of these management techniques were evaluated, as outlined below:
• Convert existing spikerush thin-mat floating marsh to healthy maidencane floating marsh. • Evaluate transplanting of maidencane floating marsh as a tool for thin-mat to thick-mat
marsh conversion. • Evaluate fertilization as a tool for thin-mat to thick-mat marsh conversion. • Evaluate grazing exclusion as a tool for thin-mat to thick-mat marsh conversion. • Evaluate combinations of the three methods as a tool for thin-mat to thick-mat marsh
conversion. This report describes the results of work associated with the demonstration project, including results from data collected and analyzed.

5
STUDY AREA The Thin-Mat Floating Marsh Enhancement Demonstration Project (TE-36) directly impacts approximately 4 acres of fresh marsh within the northwestern part of the Penchant Basin in Terrebonne Parish, southeast of Morgan City, LA. The project methods are replicated at four sites (Figure 1, coordinates are provided in Table 2) in an area bounded on the north by the Gulf Intracoastal Waterway (GIWW), on the east by Bayou Copesaw, on the south by Superior Canal, and on the west by Bayou Chene.
0 51
miles
Bayo
u Ch
ene
Gulf Intracoastal Waterway
Bay
ou C
opes
awSuperior Canal
Towhead
Turtle
Mud
Texaco
Donor
Study Sites
Donor Site 0 51
kilometers
0 51
miles
Bayo
u Ch
ene
Gulf Intracoastal Waterway
Bay
ou C
opes
awSuperior Canal
Towhead
Turtle
Mud
Texaco
Donor
Study Sites
Donor Site 0 51
kilometers
Figure 1. Location of the project sites and the site used to collect Panicum hemitomon plugs
for transplant treatments (Donor Site). Station numbers for each project site are provided in Table 3.
Table 2. Coordinates for the four project sites. Site 1:
Turtle Site 2: Mud
Site 3: Texaco
Site 4: Towhead
Latitude: 29˚34’50’’ 29˚33’32’’ 29˚33’15’’ 29˚28’36’’ Longitude: 91˚04’12’’ 91˚01’09’’ 91˚09’12’’ 91˚05’28’’
6
Table 3. Station identification numbers showing the random assignment of treatments to vegetation stations.
Station Identification
Site Number Site Name
Station Number Description
Planting Treatment
Grazing Treatment
Fertilization Treatment
TE36-101 1 Turtle 1 4x4 tmt plot Planted Grazed Fertilized TE36-102 1 Turtle 2 4x4 tmt plot Planted Not grazed Fertilized TE36-103 1 Turtle 3 4x4 tmt plot None Not grazed Fertilized TE36-104 1 Turtle 4 4x4 tmt plot None Grazed Fertilized TE36-105 1 Turtle 5 4x4 tmt plot None Not grazed None TE36-106 1 Turtle 6 4x4 tmt plot Planted Not grazed None TE36-107 1 Turtle 7 4x4 tmt plot None Grazed None TE36-108 1 Turtle 8 4x4 tmt plot Planted Grazed None TE36-109 1 Turtle 9 marsh hydrology (water) TE36-110 1 Turtle 10 adjacent open water (canal or bayou) TE36-120 1 Turtle 20 marsh hydrology (mat1) TE36-121 1 Turtle 21 marsh hydrology (mat 2)
TE36-201 2 Mud 1 4x4 tmt plot None Grazed Fertilized TE36-202 2 Mud 2 4x4 tmt plot Planted Not grazed Fertilized TE36-203 2 Mud 3 4x4 tmt plot Planted Grazed Fertilized TE36-204 2 Mud 4 4x4 tmt plot None Not grazed Fertilized TE36-205 2 Mud 5 4x4 tmt plot None Grazed None TE36-206 2 Mud 6 4x4 tmt plot Planted Not grazed None TE36-207 2 Mud 7 4x4 tmt plot Planted Grazed None TE36-208 2 Mud 8 4x4 tmt plot None Not grazed None TE36-209 2 Mud 9 marsh hydrology (water) TE36-210 2 Mud 10 adjacent open water (canal or bayou) TE36-220 2 Mud 20 marsh hydrology (mat1) TE36-221 2 Mud 21 marsh hydrology (mat 2)
Continued
7
Table 3. Continued.
Station Identification
Site Number Site Name
Station Number Description
Planting Treatment
Grazing Treatment
Fertilization Treatment
TE36-301 3 Texaco 1 4x4 tmt plot None Grazed Fertilized TE36-302 3 Texaco 2 4x4 tmt plot Planted Not grazed Fertilized TE36-303 3 Texaco 3 4x4 tmt plot Planted Grazed Fertilized TE36-304 3 Texaco 4 4x4 tmt plot None Not grazed Fertilized TE36-305 3 Texaco 5 4x4 tmt plot Planted Not grazed None TE36-306 3 Texaco 6 4x4 tmt plot None Grazed None TE36-307 3 Texaco 7 4x4 tmt plot Planted Grazed None TE36-308 3 Texaco 8 4x4 tmt plot None Not grazed None TE36-309 3 Texaco 9 marsh hydrology (water) TE36-310 3 Texaco 10 adjacent open water (canal or bayou) TE36-320 3 Texaco 20 marsh hydrology (mat1) TE36-321 3 Texaco 21 marsh hydrology (mat 2)
TE36-401 4 Towhead 1 4x4 tmt plot Planted Grazed None TE36-402 4 Towhead 2 4x4 tmt plot Planted Not grazed None TE36-403 4 Towhead 3 4x4 tmt plot None Grazed None TE36-404 4 Towhead 4 4x4 tmt plot None Not grazed None TE36-405 4 Towhead 5 4x4 tmt plot None Grazed Fertilized TE36-406 4 Towhead 6 4x4 tmt plot Planted Not grazed Fertilized TE36-407 4 Towhead 7 4x4 tmt plot Planted Grazed Fertilized TE36-408 4 Towhead 8 4x4 tmt plot None Not grazed Fertilized TE36-409 4 Towhead 9 marsh hydrology (wate) TE36-410 4 Towhead 10 adjacent open water (canal or bayou) TE36-420 4 Towhead 20 marsh hydrology (mat1) TE36-421 4 Towhead 21 marsh hydrology (mat 2)

8
At each site, a T-shaped boardwalk was constructed in the summer of 1999 to minimize impacts on the existing vegetation during construction and monitoring. At each site, eight 172 ft2 (4 x 4 m) plots were assigned to one of the eight treatment combinations (Table 3). Figure 2 shows the general layout for each site with station numbers. Treatment assignment within each site was performed as follows. First, one arm of the boardwalk was randomly selected to receive the four fertilized treatments and the other arm received the non fertilized treatments. Four treatment combinations (A. grazed and planted, B. grazed and unplanted, C. not grazed and planted, and D. not grazed and unplanted) were randomly assigned to each plot within a fertilizer treatment. Exclosures for the ungrazed treatment were constructed in April of 2000. Thirty plugs (3 inch diameter) with at the minimum 3 stems of Panicum hemitomon were transplanted from the donor site into each planted treatment in April of 2000. Osmocote 18-6-12 was applied at a rate of 20 g N m-2 in each of the fertilized treatments in May 2000 and July 2000 and the spring of 2003.
Figure 2. Generalized layout of each site showing the eight treatments and station numbers
within each site.
Not Fertilized Fertilized
1 2
3 4
5 6
7 8
Planted , Grazed
Planted,
Not planted, Grazed
Not planted,
Water level gauge
Mat level gauge
Planted, Ungrazed
Not planted, Grazed
Not planted, Ungrazed
Water level gauge
Mat level gauge
9
10
20 21

9
During the first winter after treatments were initiated (2000-2001), we noticed signs of nutria grazing inside several of the ungrazed treatments at both the Texaco and Towhead sites (Table 4). Nutria were entering these “ungrazed” treatments from under the mat and no holes in the fences were found. Therefore it was impossible to avoid this grazing activity. In addition to grazing, the nutria also constructed grazing platforms which thoroughly altered the substrate elevation in parts of these treatments. During the growing season, the holes created in the mat closed and nutria were no longer entering these sites. However, the second winter some of these and some additional “ungrazed” treatments at these two sites were again impacted by nutria. Because these two sites did not provide a good representation of the treatments evaluated, we omitted them from the analyses of vegetation and substrate characteristics. Table 4. Treatments that were compromised by nutria grazing during the winter of 2000-01.
Station Identification
Site Name
Station Number
Planting Treatment
Grazing Treatment
Fertilization Treatment
TE36-304 Texaco 4 None Not grazed Fertilized TE36-308 Texaco 8 None Not grazed None TE36-402 Towhead 2 Planted Not grazed None TE36-404 Towhead 4 None Not grazed None TE36-408 Towhead 8 None Not grazed Fertilized

10
VEGETATION Introduction This section includes the methods, results, and discussion of variables related to vegetation in the demonstration project including transplanted, protected and control treatments. The following variables are included in the discussion: tissue nutrients, transplant survival, species composition and percent cover, and above-ground biomass at the completion of the project. Methods Vegetation was sampled at the four sites in September 1999 and May 2000 to assess the existing vegetation condition prior to initiation of the project treatments. May 2000 samples were taken before the last treatment (fertilization) was applied and only two weeks after construction of the exclosures and transplanting treatments were initiated. Therefore we consider the May 2000 samples as representing the vegetation condition before implementation of treatments Vegetation was sampled at the four sites in the fall of 2000, 2001, 2002, and 2003 and the summer of 2000 and 2001 to assess the vegetation condition after the initiation of the project treatments (Table 5). Aboveground biomass was sampled at each site in the fall of 1999 (before) at five random plots and 2003 (after) with two replicate plots per treatment. Plants were cut at the substrate surface, stored in plastic bags and transported to LSU. Plants were sorted by species and then dried to constant weight. The number of transplanted plugs with live Panicum hemitomon stems were determined at time of establishment (April 2000) and in May and July of 2000. By September, 2000, individual plugs were no longer recognizable in several exclosures, consequently, survival at that time is reflected in the Panicum hemitomon cover values. In September 1999, cover of all emergent plant species was estimated to the nearest 5% in a 10.76 ft2 (1 m2) plot at the lower left corner (viewed from the boardwalk) within each of the eight treatment plots at each site. In May of 2000 each 172 ft2 (16 m2) plot was subdivided into four 43 ft2 (4 m2) subplots and cover of all emergent plant species was estimated to the nearest 5% in each subplot. In July, only the two subplots that could be surveyed from the boardwalk were surveyed. In September, all subplots were surveyed. Because species sometimes overlap in coverage of the substrate the total cover for a plot can exceed 100%. Because exclosures were compromised by nutria damage at the Texaco and Towhead sites during the winter of 2000-2001, we emphasized analysis of data from the Turtle and Mud sites (for more detail see Study Area section). In the fall of 1999, we harvested plant material of Eleocharis baldwinii from each plot for tissue analysis. Eleocharis baldwinii was chosen because this was the only species that occurred at all sites (Table 5). In the spring of 2000, leaf tissue from the most common species at each site was harvested in order to be more representative. We assume that by using the most common

11
Table 5. Dates that vegetation was sampled during this study. Period Date Cover Biomass Tissue nutrients Before Implementation
September, 1999 1 m2 0.1 m2 E. baldwinii
May, 2000 4 x 4 m2 mixture* & donor$ P. hemitomon
After Implementation
July, 2000 2 x 4 m2
September, 2000 4 x 4 m2 mixture & transplanted P. hemitomon
May, 2001 2 x 4 m2 mixture, transplanted & donor P. hemitomon
July, 2001 2 x 4 m2
October, 2001 2 x 4 m2 mixture
October, 2002 2 x 4 m2 mixture & donor P. hemitomon
September-October, 2003 2 x 4 m2 0.1 or 0.25 m2
mixture & donor P. hemitomon
*mixture means that we sampled tissues from a mixture of species. $donor means that tissue samples were obtained from Panicum hemitomon at the donor site. species, the samples reflect the uptake of nutrients by the vegetation as a whole. This tissue sampling was repeated through the study period (Table 5). Tissue samples were processed by the LSU Agronomy Laboratory. Nitrogen concentration in the tissue was determined using Dumas dry-combustion method with a Leco FP-428 (St. Joseph, MI). The reported N concentration is equivalent to Kjeldahl N (TKN). Phosphorus concentration was determined using nitric acid digestion combined with induced coupling plasma (ICP) following the procedures described by Havlin and Soltanpour (1980). In addition, the ICP analysis provided concentration data for Ca, Mg, S, K, Al, B, Cd, Cu, Fe, Mn, Na, Ni, Pb, and Zn. These additional elements were not analyzed for this report, because N and P are considered the major elements affecting wetland plant growth.

12
Results Transplant Survival Transplant survival was unaffected by fertilization, but was significantly reduced in the presence of grazing. By mid July 2000 (3 months after transplantation), almost all grazed plots had no surviving Panicum hemitomon transplants (Figure 3). Survival was significantly higher in the ungrazed plots with 68% (20.5 of 30) of transplanted plugs surviving 3 months after transplantation. In September, vegetation in the ungrazed plots was very robust, making it impossible to accurately estimate the number of surviving transplants. Immediately after transplantation, Panicum hemitomon covered approximately 1% of the planted plots. In the grazed plots, cover declined rapidly as few transplants survived to July 2000. However, some recovery from the root stock was observed in the non-fertilized grazed plots at the end of the first growing season (September 2000) and a few Panicum hemitomon sprigs were observed in a few grazed, transplanted plots at the end of the study (2003). In the ungrazed plots, some loss of cover was observed due to transplant failure in July of the first growing season (2000). However, by the end of the first growing season the surviving transplants increased in cover to approximately the same level as immediately after transplantation. In subsequent growing seasons Panicum hemitomon cover increased significantly in all ungrazed plots, with fertilization having no-effect (Figure 4.)
01-Apr-00 01-May-00 01-Jun-00 01-Jul-00 01-Aug-00
Num
ber o
f liv
e pl
ugs
0
5
10
15
20
25
30
35Not grazed, not fertilizedNot grazed, fertilizedGrazed, not fertilizedGrazed, fertilized
Figure 3. Survival of Panicum hemitomon transplants (plugs) in the first three months after
transplantation.
13
Biomass Analysis of variance on end-of-season biomass revealed a significant (p=0.0092) two-way interaction among grazing and planting, while fertilization had no statistically significant effect (p=0.0658). End-of-season biomass was almost 3 times higher in ungrazed, planted plots than under any of the other treatments (Figure 5). The main effects for grazing and planting were also significant with ungrazed plots having higher end-of-season biomass than grazed plots and planted plots having higher end-of-season biomass than unplanted plots (Figure 5). Although the effect of fertilization was not statistically significant, the fertilized plots had slightly higher end-of season biomass than the unfertilized plots (Figure 6).
2000 2001 2002 2003
Pani
cum
hem
itom
on c
over
(%)
0
20
40
60
80
100Not Grazed, Not FertilizedNot Grazed, FertilizedGrazed, Not FertilizedGrazed, Fertilized
Figure 4. Fall cover of Panicum hemitomon transplants is shown as a function of grazing and
fertilization. Data are from Turtle and Mud planted sites only.
14
End-
of-s
easo
n bi
omas
s (g
m-2
)
0
200
400
600
800
1000
1200
1400Before treatment (1999)Not grazed, not plantedNot grazed, plantedGrazed, not plantedGrazed, planted
Figure 5. Turtle and Mud average end-of-season biomass is shown for 1999 (before) and after
four years (2003) of different grazing and planting treatment combinations. Data are averaged over fertilization treatments.

15
Before Not fertilized Fertilized
End-
of-s
easo
n bi
omas
s (g
m-2
)
0
200
400
600
800
1000
Figure 6. Turtle and Mud average end-of-season biomass is shown for 1999 (before) and after
four years (2003) of either unfertilized or fertilized treatment. Data are averaged over the grazing and planting treatments. Differences shown are not statistically significant.
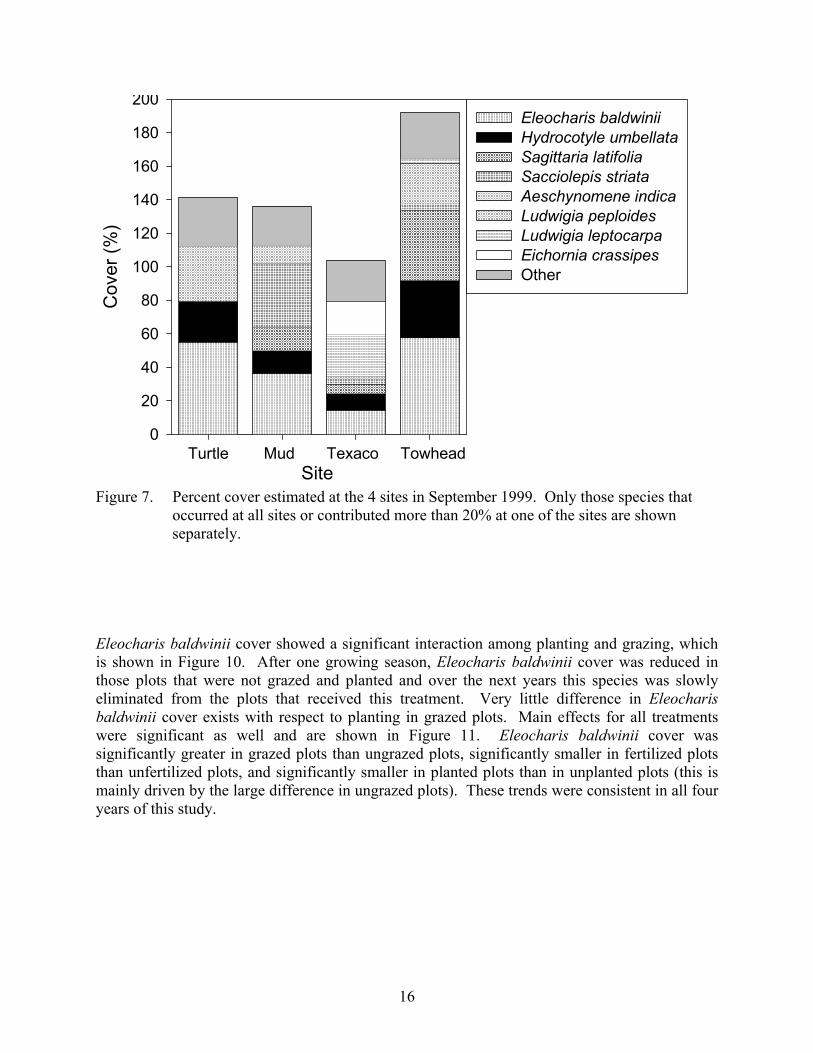
Vegetation Cover In the fall of 1999 before implementation of the treatments, significant differences in total vegetation cover were detected among the 4 sites (ANOVA, α = 0.05, Figure 7). The highest cover (192 ± 7) was found at Towhead. This site had two different layers of vegetation. The bottom layer was dominated by Eleocharis baldwinii and Hydrocotyle umbellata and the top layer was dominated by Sagittaria latifolia and Aeschynomene indica. Texaco had the lowest cover (104 ± 3) and was dominated by Ludwigia leptocarpa and Eichornia crassipes. Turtle and Mud had intermediate cover and were dominated by Eleocharis baldwinii. None of the treatments had a significant effect on the total number of species found in the plots (ANOVA, α = 0.05, Figure 8) or the total vegetative cover (ANOVA, α = 0.05, Figure 9). The analysis revealed many significant interactions between year and treatment combinations, but a review of the data showed no consistent effects in either total cover or number of species over the years.
16
Site
Cov
er (%
)
0
20
40
60
80
100
120
140
160
180
200Eleocharis baldwiniiHydrocotyle umbellataSagittaria latifoliaSacciolepis striataAeschynomene indicaLudwigia peploidesLudwigia leptocarpaEichornia crassipesOther
Turtle Mud Texaco Towhead
Figure 7. Percent cover estimated at the 4 sites in September 1999. Only those species that
occurred at all sites or contributed more than 20% at one of the sites are shown separately.
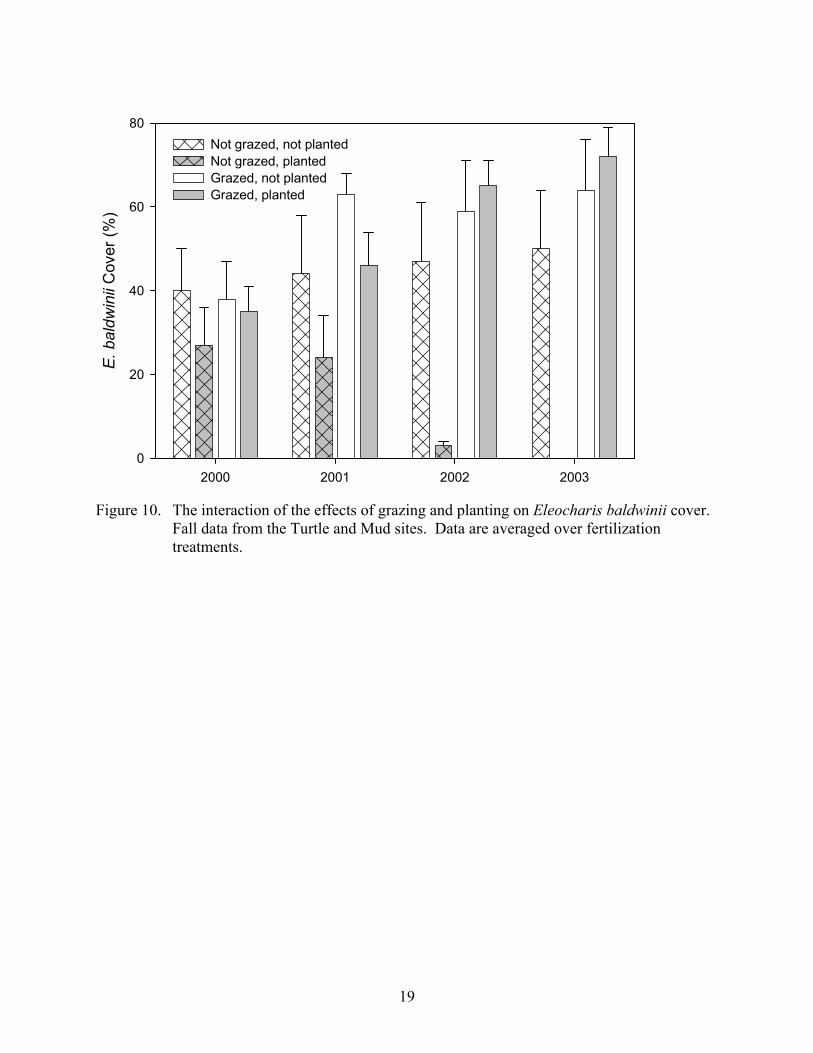
Eleocharis baldwinii cover showed a significant interaction among planting and grazing, which is shown in Figure 10. After one growing season, Eleocharis baldwinii cover was reduced in those plots that were not grazed and planted and over the next years this species was slowly eliminated from the plots that received this treatment. Very little difference in Eleocharis baldwinii cover exists with respect to planting in grazed plots. Main effects for all treatments were significant as well and are shown in Figure 11. Eleocharis baldwinii cover was significantly greater in grazed plots than ungrazed plots, significantly smaller in fertilized plots than unfertilized plots, and significantly smaller in planted plots than in unplanted plots (this is mainly driven by the large difference in ungrazed plots). These trends were consistent in all four years of this study.

17
Figure 8. Effect of the different treatments on the number of species in each plot. Fall data
from the Turtle and Mud sites. Data for each effect were averaged over the other treatments.
Grazing Effect
2000 2001 2002 2003
Num
ber o
f spe
cies
0
2
4
6
8
10
12
14 Not grazedGrazed
Fertilization Effect
2000 2001 2002 2003
Num
ber o
f spe
cies
0
2
4
6
8
10
12
14 Not fertilizedFertilized
Planting Effect
2000 2001 2002 2003
Num
ber o
f spe
cies
0
2
4
6
8
10
12
14 Not plantedPlanted

18
Grazing Effect
2000 2001 2002 2003
Cov
er (%
)
0
50
100
150
200 Not grazedGrazed
Fertilization Effect
2000 2001 2002 2003
Cov
er (%
)
0
50
100
150
200 Not fertilizedFertilized
Planting Effect
2000 2001 2002 2003
Cov
er (%
)
0
50
100
150
200 Not plantedPlanted
Figure 9. Effect of the different treatments on the total vegetative cover in each plot. Fall data
from the Turtle and Mud sites. Data for each effect were averaged over the other treatments.
19
2000 2001 2002 2003
E. b
aldw
inii
Cov
er (%
)
0
20
40
60
80Not grazed, not plantedNot grazed, plantedGrazed, not plantedGrazed, planted
Figure 10. The interaction of the effects of grazing and planting on Eleocharis baldwinii cover.
Fall data from the Turtle and Mud sites. Data are averaged over fertilization treatments.

20
Grazing Effect
2000 2001 2002 2003
E. b
aldw
inii
Cov
er (%
)
0.0
2.5
5.0
7.5
10.0Not grazedGrazed
Fertilization Effect
2000 2001 2002 2003
E. b
aldw
inii
Cov
er (%
)
0.0
2.5
5.0
7.5
10.0Not fertilizedFertilized
Planting Effect
2000 2001 2002 2003
E. b
aldw
inii
Cov
er (%
)
0.0
2.5
5.0
7.5
10.0Not plantedPlanted
Figure 11. Effect of the different treatments on Eleocharis baldwinii cover. Fall data from the
Turtle and Mud sites. Data for each effect were averaged over the other treatments.

21
Tissue Nutrients In the fall of 1999, Eleocharis baldwinii tissues from the Texaco site had the highest percentage of nitrogen and phosphorus (Table 6). Texaco is the only site that seems at the optimum N:P ratio (between 14 and 16). The other three sites had a N:P ratio greater than 16, indicating that phosphorus is the growth limiting nutrient (Koerselman and Meuleman 1996) in these spikerush marshes. In contrast, Panicum hemitomon tissue harvested in May 2000, September 2002, and 2003 from the donor marsh had a N:P ratio smaller than 14, indicating that at the donor marsh growth is generally limited by nitrogen. In contrast, the N:P ratio of the donor site tissue in September 2000 was 18 and in May 2001 it was 20, indicating that during this period the donor site was limited by phosphorus. After one growing season (September 2000), the harvested Panicum hemitomon tissue from those plots where sufficient Panicum hemitomon was present for tissue sampling (planted, ungrazed, fertilized plots at Turtle and Towhead and planted, ungrazed, unfertilized plot at Turtle) had N:P ratios greater than 16 indicating that phosphorus was the limiting nutrient for Panicum hemitomon even in the fertilized plots (Figure 12). The transplanted Panicum hemitomon increased in both nitrogen and phosphorus content in the fertilized plots compared to the donor site (Figure 12). In contrast, nitrogen and phosphorus content decreased in Panicum hemitomon that was transplanted into unfertilized plots (Figure 12). All transplanted Panicum hemitomon maintained a N:P ratio greater than 16 indicating that phosphorus is the limiting nutrient for Panicum hemitomon in the Turtle and Towhead sites. Table 6. Nitrogen and phosphorus content of Eleocharis baldwinii tissue harvested from the
study sites in September 1999, and Panicum hemitomon tissue harvested from the donor site in May 2000.
Species /Site Nitrogen (%) Phosphorus (%) N:P ratio Eleocharis baldwinii (Sept. 1999) Turtle 1.42 ± 0.06 0.078 ± 0.006 18.7 ± 0.9 Mud 1.54 ± 0.07 0.094 ± 0.006 16.7 ± 0.7 Texaco 1.68 ± 0.05 0.118 ± 0.007 14.5 ± 0.8 Towhead 1.53 ± 0.06 0.077 ± 0.001 19.8 ± 0.5 Panicum hemitomon Donor Site (May 2000)) 0.93 ± 0.06 0.113 ± 0.018 8.8 ± 1.3

22
Nitrogen (%)
0.5 1.0 1.5 2.0 2.5 3.0 3.5 4.0
Phos
phor
us (%
)
0.08
0.10
0.12
0.14
0.16
0.18
0.20Donor Siteunfertilized transplantsfertilized transplants
Fall 2000Spring 2001
Fall 2002
Fall 2003
Spring 2001
Spring 2000
Fall 2000
Fall 2000 Spring 2000
Figure 12. Nitrogen and phosphorus content of Panicum hemitomon tissues collected. Although grazing and planting affected species composition (see above) nitrogen and phosphorus content in harvested tissues was not significantly affected by these treatments. In contrast, both nitrogen and phosphorus content were significantly higher in tissues collected from the fertilized plots than in tissues collected from unfertilized plots (Figure 13). Nutrient content increased at all sites over the first growing season with significantly larger increases for fertilized plots. This indicates that some of the added nutrients were taken up by the plants. The differences in tissue nitrogen and phosphorus content were highest in the fall of 2000 (when fertilizer was added in May and July) and declined in years where no additional fertilizer was added (2001 and 2002). The single application of fertilizer in the spring of 2003 had relatively minor effect on tissue nitrogen content, but significantly increased tissue phosphorus (Figure 13). Species mixtures harvested all had N:P ratios less than 14, indicating that overall the vegetation is limited by nitrogen. Tissue N:P ratios of the mixture were unaffected by fertilization.

23
season
sp00 fa00 sp01 fa01 fa02 fa03
Tiss
ue N
itrog
en (%
)
0
1
2
3
4FertilizedNot Fertilized
season
sp00 fa00 sp01 fa01 fa02 fa03
Tiss
ue P
hosp
horu
s (%
)
0.0
0.1
0.2
0.3
0.4FertilizedNot fertilized
Figure 13. Tissue Nitrogen and Phosphorus concentrations in species mixtures harvested from
Turtle and Mud over the period of study. Data are averaged over the planting and grazing treatments.

24
Discussion The results indicate that Panicum hemitomon plants transplanted into the thin-mat floating marsh at the demonstration sites survived well when protected from grazing. Sixty-eight percent of the transplanted plugs survived 3 months after transplantation in the ungrazed plots, while above-ground plant components were almost completely removed by grazers in the unprotected plots. Additionally, Panicum hemitomon cover values continued to increase in subsequent growing seasons in protected plots, while in the unprotected plots, only a few Panicum hemitomon stems grew from the belowground rhizomes that remained after grazing of the above-ground material. The ungrazed Panicum hemitomon plants grew very well with or with-out fertilization. The application of additional nitrogen and phosphorus in applied fertilizer had no effect on the ultimate success of transplants. Although harvesting end-of-season above-ground biomass was not a required part of the project monitoring plan, we felt the addition of this variable would provide the best information on vegetation growth condition at the end of the demonstration project. The results indicate that vegetation biomass was far greater in the ungrazed, planted plots than any other treatment. Fertilization of plots resulted in only slightly higher end-of-season biomass values and were not statistically significant. Vegetation species at the four study sites supported their classification as Eleocharis baldwinii – dominated thin-mat marsh type, although there were differences in total cover among the sites. Overall, during the course of the demonstration project, the total number of species found in plots and the total vegetative cover were not influenced by the project treatments. However it is of interest that a primary plant species in the thin-mat vegetation type, Eleocharis baldwinii, was reduced in cover after one growing season in the transplanted and ungrazed plots, and over time was slowly eliminated from the plots receiving this treatment. As the Panicum hemitomon plants grew and increased total cover, Eleocharis baldwinii was apparently not able to compete for space and necessary resources. Overall, nitrogen and phosphorus content in harvested tissues was not significantly affected by either grazing or planting treatments. However nitrogen and phosphorus content were significantly higher in plant tissue from fertilized plots compared to unfertilized plots. The differences were highest immediately after application of fertilizer and then moderated over time.
25
WATER AND MARSH SURFACE DYNAMICS Introduction The primary goal of the water level and mat level data collection was to determine the buoyancy characteristics of the experimental sites, with particular focus on the seasonal dynamics of mat movement. To this end, the following parameters were measured at each of the sites using continuously recording gauges:
1. Open water level (bayou or canal). 2. Inland marsh water level (~160 ft or 50 m inland). 3. Inland marsh mat vertical movement (replicate sensors, ~160 ft or 50 m inland).
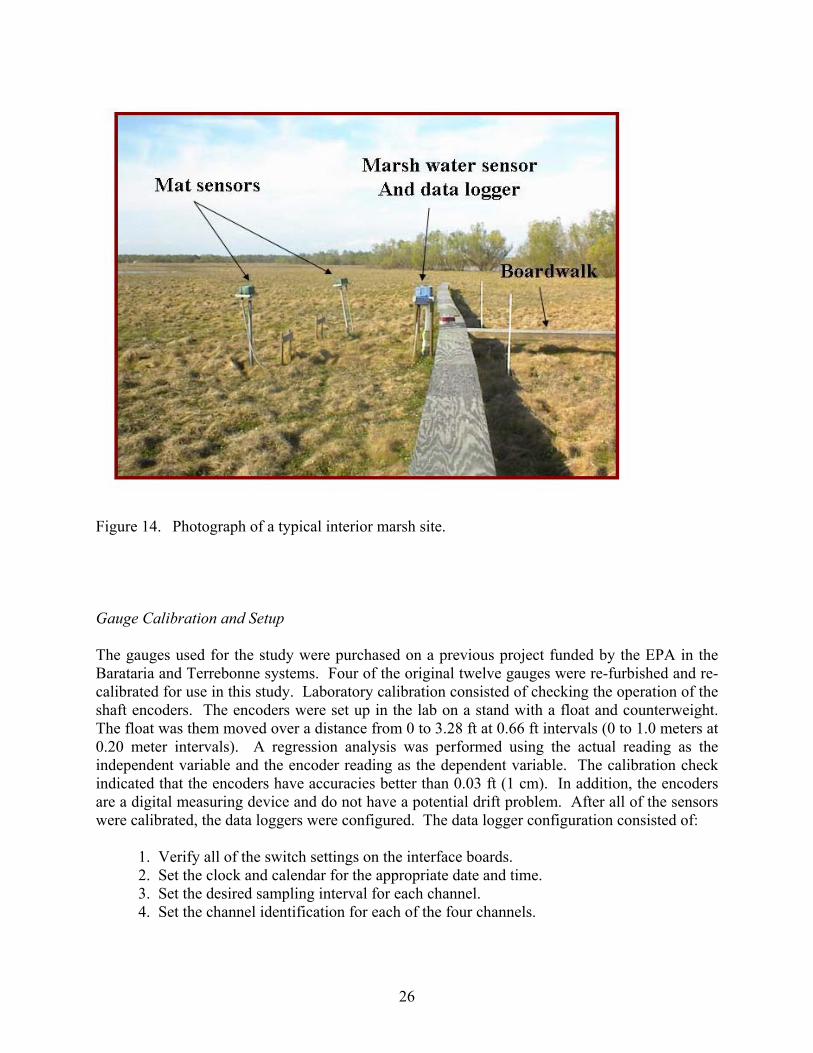
Methods Gauge Description The inland data were collected using a multi-channel data logger (Stevens Multiloggers®, Leupold and Stevens Inc., Beaverton, Oregon) which was located on a platform (~ 160 ft or 50 m inland from adjacent open water) next to the boardwalk. The inland marsh water and mat levels were measured at this point, using two sensors, one on each side of the gauge platform. A photograph of a typical internal marsh setup is shown in Figure 14. The open water bayou or canal levels were measured with a single channel data logger (Stevens Type A/F®, Leupold and Stevens Inc., Beaverton, Oregon) deployed on a platform along the water's edge. The water levels were measured using a stilling well with a float and counterweight system. The cable attached to the float goes over the sensor pulley and is attached to a weight. Thus, as the float moves vertically (with the water), it moves the cable, which in turn rotates the sensor pulley attached to the digital shaft encoder. The rotation of the encoder shaft is converted to a digital signal which is recorded by the data logger onto solid state memory modules. The mat levels are monitored by using a float-counterweight encoder, but without the float. The sensor is deployed on a single pipe (to minimize friction effects) with the counterweight located inside the pipe. The cable attached to the weight is placed over the sensor pulley and then attached to a dog leash anchor that has been augured into the mat. Thus, as the mat moves vertically, it moves the cable, which in turn rotates the sensor pulley attached to the digital shaft encoder. The rotation of the encoder shaft is converted to a digital signal which is recorded by the data logger onto solid state memory modules. The gauges were serviced regularly, at which time the memory modules were retrieved, the batteries replaced, and a new memory module installed. The data stored on the memory module was recovered upon return to LSU using a memory module reader interfaced with a laptop computer.
26
Figure 14. Photograph of a typical interior marsh site. Gauge Calibration and Setup The gauges used for the study were purchased on a previous project funded by the EPA in the Barataria and Terrebonne systems. Four of the original twelve gauges were re-furbished and re-calibrated for use in this study. Laboratory calibration consisted of checking the operation of the shaft encoders. The encoders were set up in the lab on a stand with a float and counterweight. The float was them moved over a distance from 0 to 3.28 ft at 0.66 ft intervals (0 to 1.0 meters at 0.20 meter intervals). A regression analysis was performed using the actual reading as the independent variable and the encoder reading as the dependent variable. The calibration check indicated that the encoders have accuracies better than 0.03 ft (1 cm). In addition, the encoders are a digital measuring device and do not have a potential drift problem. After all of the sensors were calibrated, the data loggers were configured. The data logger configuration consisted of:
1. Verify all of the switch settings on the interface boards. 2. Set the clock and calendar for the appropriate date and time. 3. Set the desired sampling interval for each channel. 4. Set the channel identification for each of the four channels.

27
Gauge Deployment After all of the gauges were set-up and their operation was verified, field deployment began. The gauges were deployed in the following manner:
1. A platform with a float and counterweight well for water level measurements was installed in the open water along the water’s edge.
2. The single channel data logger, and battery pack was installed on the platform. 3. A platform to hold the data logger and batteries was installed on the marsh
surface next to the boardwalk. This platform also had a float and counterweight well for measurement of marsh water levels.
4. The multi-channel data logger, and battery pack was installed on the platform. 5. The mat sensors were installed in the marsh on each side of the gauge platform,
and connected to the data logger with an armored cable.
After all connections were made and checked, the batteries were attached, the data cards were installed, and the gauges were set up to start recording. The gauges were checked by using the top of the mounting platform as a reference level. During installation the distance from the top of the data logger (or mat sensor) platform to the water (or mat) surface was measured. The gauges were set so that the top of the platform corresponds to a reading of 16.4 ft (5.0 m). Thus, if the distance from the platform to the water (or mat) was 6.6 ft (2.0 m), then the gauge should be reading 9.8 ft (3.0 m). This distance was measured on each servicing trip, and compared to the actual gauge reading, to ensure that the float cable had not slipped on the pulley. The gauges were deployed for about 3 years at each site over the time period from June 1999, through February, 2003. The station identifications and time periods of data collection for each site are listed in Table 7. Vertical Movement of the Marsh Mat
To measure the vertical movement of the marsh mat surface at several discrete locations at each of the sample sites, vertical mat movement indicators (Figure 15) were installed near the mat gauges in September 1999 and in each treatment plot in May 2000. These devices were fabricated from 1/2 inch schedule 40 PVC pipe, 1" PVC pipe, PVC bucket lids, and springs. The 1/2" PVC pipe was driven into the firm substrate below the marsh surface, and the PVC bucket lid (which had a hole in the center) was slid down the PVC pipe until it rested on the marsh surface. A piece of 1" PVC pipe was placed over the 1/2" PVC pipe and allowed to rest on the PVC bucket lid. A spring was then wrapped around the 1/2" PVC pipe, and pushed down until it contacted the 1" PVC pipe. Upward movement of the marsh mat pushed up on the PVC bucket lid, which pushed up the 1" PVC pipe and the spring. The spring remained in the maximum position reached between servicing trips. During each servicing trip, the distance from the top of the 1/2" PVC pipe to the spring was measured, then the spring was pushed back into position so that it contacted the 1" PVC pipe. Thus, the instrument measured the maximum vertical movement over a given time period, in addition to indicating the height of the marsh mat relative to other service dates. A schematic of the indicator is presented in Figure 15.
28
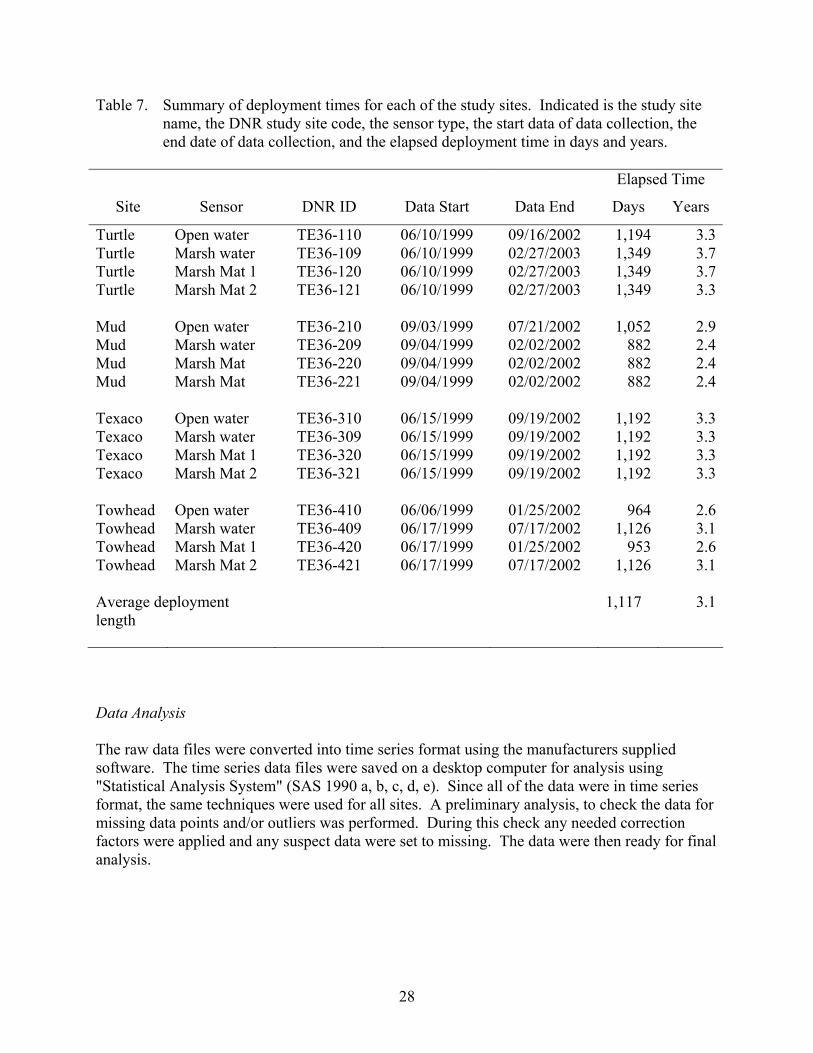
Table 7. Summary of deployment times for each of the study sites. Indicated is the study site name, the DNR study site code, the sensor type, the start data of data collection, the end date of data collection, and the elapsed deployment time in days and years.
Elapsed Time
Site Sensor DNR ID Data Start Data End Days Years
Turtle Open water TE36-110 06/10/1999 09/16/2002 1,194 3.3 Turtle Marsh water TE36-109 06/10/1999 02/27/2003 1,349 3.7Turtle Marsh Mat 1 TE36-120 06/10/1999 02/27/2003 1,349 3.7 Turtle Marsh Mat 2 TE36-121 06/10/1999 02/27/2003 1,349 3.3 Mud Open water TE36-210 09/03/1999 07/21/2002 1,052 2.9Mud Marsh water TE36-209 09/04/1999 02/02/2002 882 2.4Mud Marsh Mat TE36-220 09/04/1999 02/02/2002 882 2.4Mud Marsh Mat TE36-221 09/04/1999 02/02/2002 882 2.4 Texaco Open water TE36-310 06/15/1999 09/19/2002 1,192 3.3 Texaco Marsh water TE36-309 06/15/1999 09/19/2002 1,192 3.3 Texaco Marsh Mat 1 TE36-320 06/15/1999 09/19/2002 1,192 3.3 Texaco Marsh Mat 2 TE36-321 06/15/1999 09/19/2002 1,192 3.3 Towhead Open water TE36-410 06/06/1999 01/25/2002 964 2.6 Towhead Marsh water TE36-409 06/17/1999 07/17/2002 1,126 3.1 Towhead Marsh Mat 1 TE36-420 06/17/1999 01/25/2002 953 2.6Towhead Marsh Mat 2 TE36-421 06/17/1999 07/17/2002 1,126 3.1 Average deployment length
1,117 3.1
Data Analysis The raw data files were converted into time series format using the manufacturers supplied software. The time series data files were saved on a desktop computer for analysis using "Statistical Analysis System" (SAS 1990 a, b, c, d, e). Since all of the data were in time series format, the same techniques were used for all sites. A preliminary analysis, to check the data for missing data points and/or outliers was performed. During this check any needed correction factors were applied and any suspect data were set to missing. The data were then ready for final analysis.

29
Root Mat
Firm Substrate
Hemic Peat
Sapric Peat
1/2” PVC Pole
Spring
1” PVC Pipe
PVC Bucket Lid
Figure 15. Diagram of a vertical movement indicator (VMI) used to measure the maximum
vertical movement of the marsh surface. A buoyant marsh mat moves the disk upward, which pushes the spring upward. The spring then holds its position until an event of greater movement. The PVC pole is driven through the peat to a firm substrate.
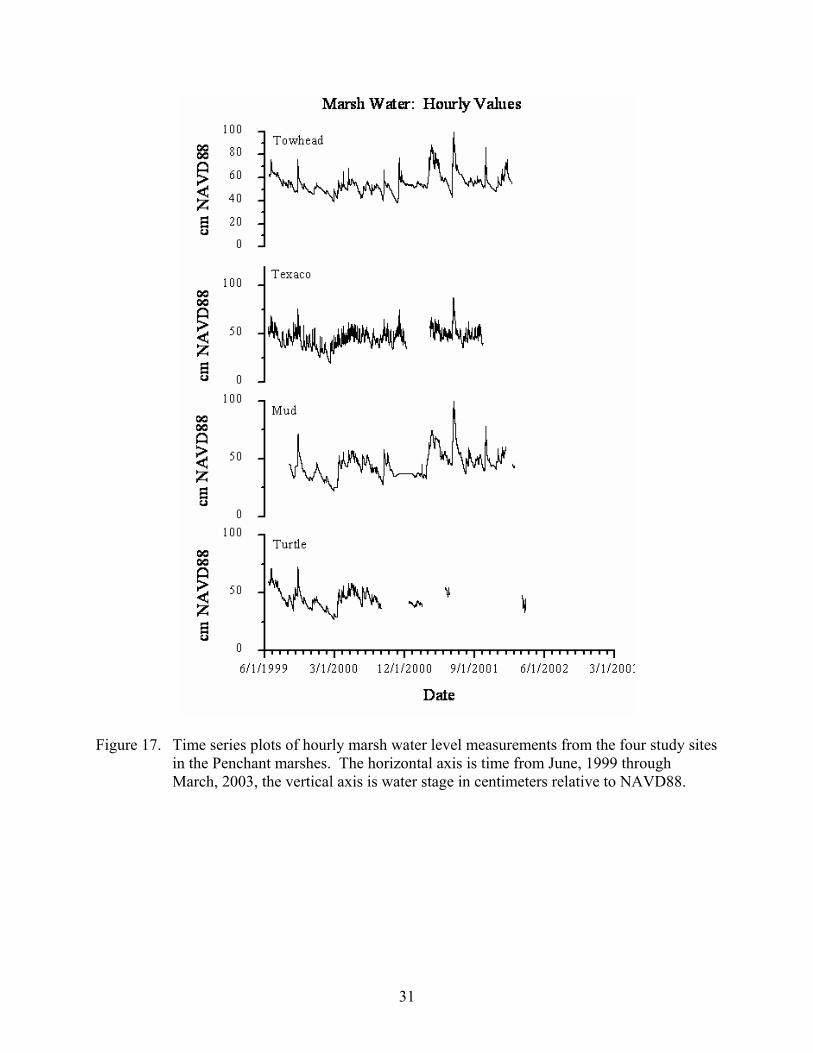
Results Time series data plots of the hourly open water level, marsh water level, and marsh mat levels are presented in Figures 16 through 19. The levels are in centimeters, relative to NAVD88, and cover the time period from June, 1999 through February, 2003. Marsh water levels at sites Turtle, Mud, and Towhead track the open water levels, although the tidal fluctuations are much reduced. The marsh water at site Texaco tracks the open water levels including the tidal fluctuations, especially at higher water levels. The marsh mat movement at sites Turtle, Mud , and Texaco track the marsh water level signal but do not respond to all of the marsh water level pulses. The marsh mat at site Texaco closely follows the marsh water levels.

30
Figure 16. Time series plots of hourly open water level measurements from the four study sites in the Penchant marshes. The horizontal axis is time from June, 1999 through March, 2003, the vertical axis is water stage in centimeters relative to NAVD88.
31
Figure 17. Time series plots of hourly marsh water level measurements from the four study sites in the Penchant marshes. The horizontal axis is time from June, 1999 through March, 2003, the vertical axis is water stage in centimeters relative to NAVD88.

32
Figure 18. Time series plots of hourly marsh mat level measurements from mat sensor 1 at the four study sites in the Penchant marshes. The horizontal axis is time from June, 1999 through March, 2003, the vertical axis is water stage in centimeters relative to NAVD88.

33
Figure 19. Time series plots of hourly marsh mat level measurements from mat sensor 2 at the four study sites in the Penchant marshes. The horizontal axis is time from June, 1999 through March, 2003, the vertical axis is water stage in centimeters relative to NAVD88.
34
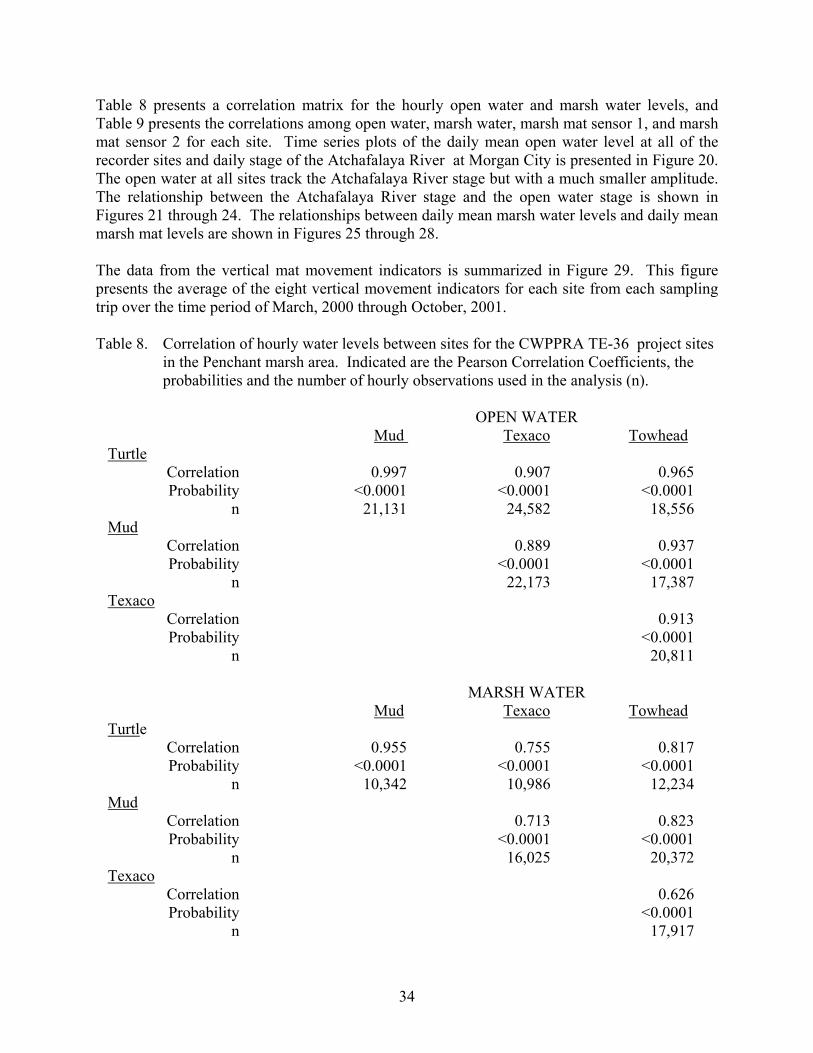
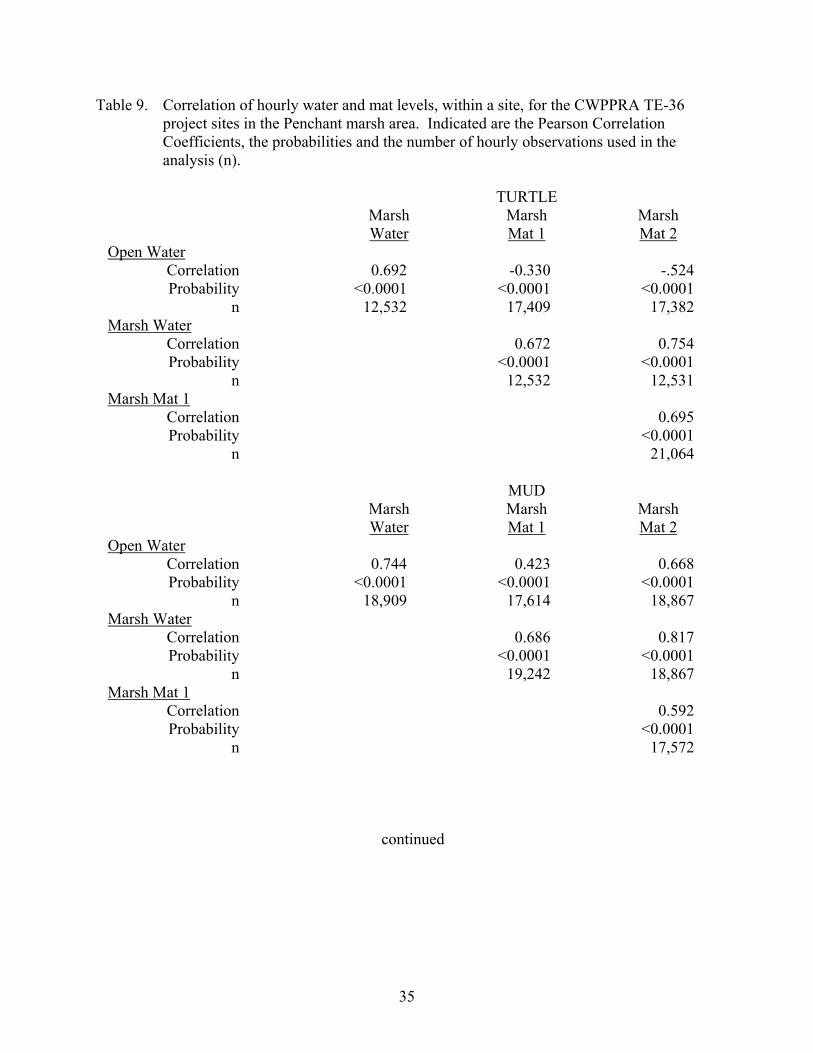
Table 8 presents a correlation matrix for the hourly open water and marsh water levels, and Table 9 presents the correlations among open water, marsh water, marsh mat sensor 1, and marsh mat sensor 2 for each site. Time series plots of the daily mean open water level at all of the recorder sites and daily stage of the Atchafalaya River at Morgan City is presented in Figure 20. The open water at all sites track the Atchafalaya River stage but with a much smaller amplitude. The relationship between the Atchafalaya River stage and the open water stage is shown in Figures 21 through 24. The relationships between daily mean marsh water levels and daily mean marsh mat levels are shown in Figures 25 through 28. The data from the vertical mat movement indicators is summarized in Figure 29. This figure presents the average of the eight vertical movement indicators for each site from each sampling trip over the time period of March, 2000 through October, 2001. Table 8. Correlation of hourly water levels between sites for the CWPPRA TE-36 project sites
in the Penchant marsh area. Indicated are the Pearson Correlation Coefficients, the probabilities and the number of hourly observations used in the analysis (n).
OPEN WATER Mud Texaco Towhead Turtle Correlation 0.997 0.907 0.965 Probability <0.0001 <0.0001 <0.0001 n 21,131 24,582 18,556 Mud Correlation 0.889 0.937 Probability <0.0001 <0.0001 n 22,173 17,387 Texaco Correlation 0.913 Probability <0.0001 n 20,811
MARSH WATER Mud Texaco Towhead Turtle Correlation 0.955 0.755 0.817 Probability <0.0001 <0.0001 <0.0001 n 10,342 10,986 12,234 Mud Correlation 0.713 0.823 Probability <0.0001 <0.0001 n 16,025 20,372 Texaco Correlation 0.626 Probability <0.0001 n 17,917
35
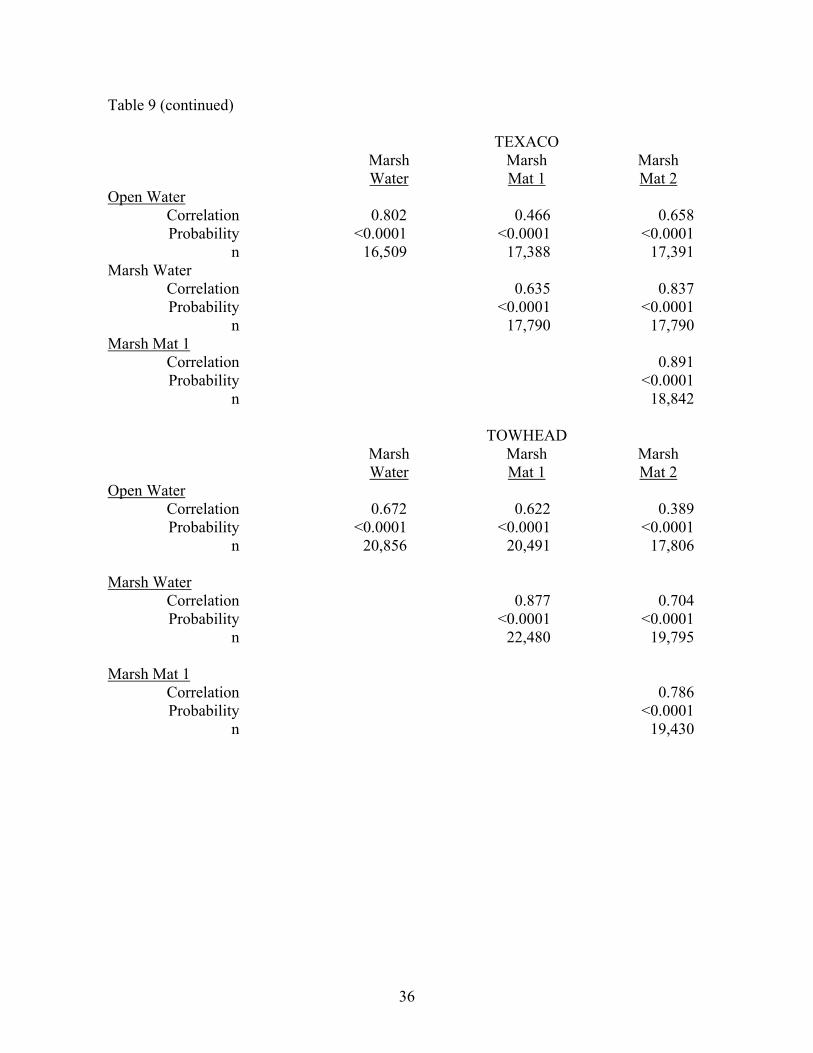
Table 9. Correlation of hourly water and mat levels, within a site, for the CWPPRA TE-36 project sites in the Penchant marsh area. Indicated are the Pearson Correlation Coefficients, the probabilities and the number of hourly observations used in the analysis (n).
TURTLE Marsh Marsh Marsh Water Mat 1 Mat 2 Open Water Correlation 0.692 -0.330 -.524 Probability <0.0001 <0.0001 <0.0001 n 12,532 17,409 17,382 Marsh Water Correlation 0.672 0.754 Probability <0.0001 <0.0001 n 12,532 12,531 Marsh Mat 1 Correlation 0.695 Probability <0.0001 n 21,064 MUD Marsh Marsh Marsh Water Mat 1 Mat 2 Open Water Correlation 0.744 0.423 0.668 Probability <0.0001 <0.0001 <0.0001 n 18,909 17,614 18,867 Marsh Water Correlation 0.686 0.817 Probability <0.0001 <0.0001 n 19,242 18,867 Marsh Mat 1 Correlation 0.592 Probability <0.0001 n 17,572
continued
36
Table 9 (continued)
TEXACO Marsh Marsh Marsh Water Mat 1 Mat 2 Open Water Correlation 0.802 0.466 0.658 Probability <0.0001 <0.0001 <0.0001 n 16,509 17,388 17,391 Marsh Water Correlation 0.635 0.837 Probability <0.0001 <0.0001 n 17,790 17,790 Marsh Mat 1 Correlation 0.891 Probability <0.0001 n 18,842
TOWHEAD Marsh Marsh Marsh Water Mat 1 Mat 2 Open Water Correlation 0.672 0.622 0.389 Probability <0.0001 <0.0001 <0.0001 n 20,856 20,491 17,806 Marsh Water Correlation 0.877 0.704 Probability <0.0001 <0.0001 n 22,480 19,795 Marsh Mat 1 Correlation 0.786 Probability <0.0001 n 19,430

37
Figure 20. Time series plots of daily mean water level at the open water level recorder at all of
the sites and daily stage of the Atchafalaya River in Morgan City. The horizontal axis is time from June, 1999 through February, 2003, the vertical axis is water stage in centimeters relative to NAVD88.

38
Figure 21. Plot of daily mean open water level at site Turtle versus daily stage of the Atchafalaya River at Morgan City. The Atchafalaya River stage is relative to NGVD, the stage at site Turtle is in centimeters relative to NAVD88. The results of a linear regression are indicated on the plot.
Figure 22. Plot of daily mean open water level at site Mud versus daily stage of the Atchafalaya River at Morgan City. The Atchafalaya River stage is relative to NGVD, the stage at site Mud Canal is in centimeters relative to NAVD88. The results of a linear regression are indicated on the plot.

39
Figure 23. Plot of daily mean open water level at site Texaco versus daily stage of the Atchafalaya River at Morgan City. The Atchafalaya River stage is relative to NGVD, the stage at site Texaco Canal is in centimeters relative to NAVD88. The results of a linear regression are indicated on the plot.
Figure 24. Plot of daily mean open water level at site Towhead versus daily stage of the Atchafalaya River at Morgan City. The Atchafalaya River stage is relative to NGVD, the stage at site Towhead Canal is in centimeters relative to NAVD88. The results of a linear regression are indicated on the plot.

40
Figure 25. Plot of daily mean marsh water level versus daily mean mat levels for sensor 1 and sensor 2 at site Turtle. The results of linear regressions are indicated on the plot.
Figure 26. Plot of daily mean open water level versus daily mean mat levels for sensor 1 and sensor 2 at site Mud. The results of linear regressions are indicated on the plot.
41
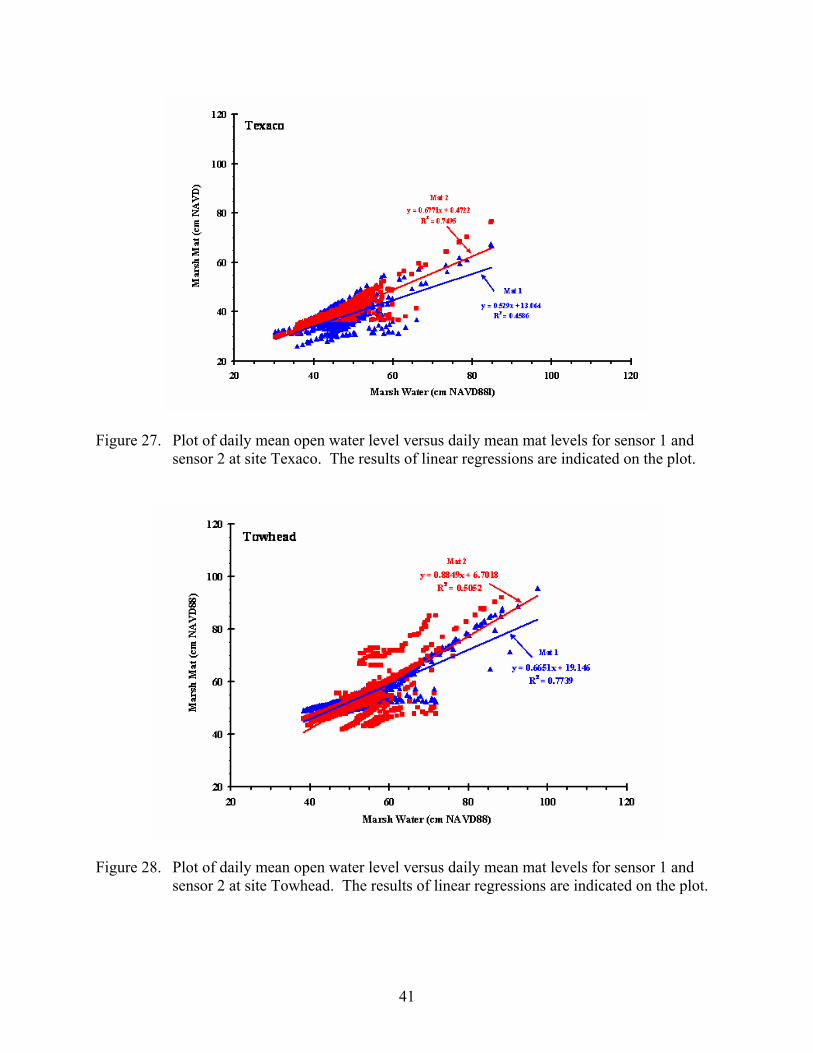
Figure 27. Plot of daily mean open water level versus daily mean mat levels for sensor 1 and sensor 2 at site Texaco. The results of linear regressions are indicated on the plot.
Figure 28. Plot of daily mean open water level versus daily mean mat levels for sensor 1 and sensor 2 at site Towhead. The results of linear regressions are indicated on the plot.

42
verti
cal m
at m
ovem
ent (
cm)
-60
-40
-20
0
20
40
60
verti
cal m
at m
ovem
ent (
cm)
-60
-40
-20
0
20
40
60
verti
cal m
at m
ovem
ent (
cm)
-60
-40
-20
0
20
40
60
Turtle
Mud
Texaco
verti
cal m
at m
ovem
ent (
cm)
-60
-40
-20
0
20
40
60
2000M JJ A O N DJ M A M JJ AS S OF
2001
Towhead
Figure 29. Average vertical mat movement, in centimeters, from the eight vertical movement
indicators for each site from each sampling trip over the time period of March, 2000 through October, 2001.

43
Discussion The 25-hour diurnal tidal signal which is superimposed upon other longer-term fluctuations was observed in the open water data at all of the stations. This type of open water level signal has been shown to be typical for the Louisiana coastal marshes (Byrne et al. 1976, Adams and Baumann 1980, Chuang and Swenson, 1981, Swenson and Turner 1987, Sasser et al, 1994). The open water signals are highly correlated, ranging from 0.89 to 0.99, indicating that the open water levels have the same response at all of the sites. Marsh water levels at three of the sites (Turtle, Mud, Towhead) exhibit very little fluctuations at hourly time scales (minimal tidal influence). Site Texaco was characterized by a fairly strong tidal influence. The correlations between open water and marsh water were ~0.70 at sites Turtle, Mud, and Towhead and were ~0.80 at site Texaco indicating that site Texaco is more freely connected to the open water. Regression analysis using the Atchafalaya Stage as the independent variable and the open water at each site as the dependent variable was performed. The analysis indicated that the Atchafalaya River stage explains about 80% of the open water signal at sites Turtle, Mud, and Towhead and about 60% of the open water signal at site Texaco. Similar relationships between Atchafalaya River stage and marsh water levels in the Penchant System was observed by Sasser et al (1995).
All of the mats exhibited floating behavior, with vertical movement of ~50 centimeters. Although there were differences in the relationships for each mat sensor at a given site, in most cases the marsh water signal explains about 80% of the mat level signal. The relationship between open water levels and marsh water levels for all of the sites is shown in Figure 30. Site Texaco exhibits a strong relationship at all levels, where sites Towhead, Turtle, and Mud show a characteristic “impoundment” effect in which the marsh water level closely tracks the open water level once a critical value is exceeded. This critical level is the level at which impedance to water exchange (typically high natural levees or spoil banks) is overcome. Sasser, et al (1994), described five basic types of floating mats based on their floating behavior:
1. Free floating: These sites have a free connection between open water and marsh water, and a strong relationship between open water level, marsh water level, and marsh mat level, over most of the range of fluctuations. These mats typically have a vertical movement around 30 to 50 centimeters.
2. Damped floating: These sites behave similar to free floating but the mat
sometimes moves while submerged. 3. Impounded floating: These sites exhibit a poor relationship between open
water level and marsh water level and a strong relationship between marsh water level and marsh mat level. The relationship between open water level and marsh water level becomes stronger at high water levels when impedance to water exchange (typically spoil banks, high natural levees) are overcome.

44
Figure 30. Plot of daily mean open water level versus daily mean marsh water levels at all of
the study sites. A line indicating a slope of 1.0 is indicated on the graph.

45
4. Micro-floating similar to free floating but the mat movement is around 5 centimeters. These types of mats often have weak relationships between open water and marsh water at all water levels.
5. Non-floating.
The results of the present study indicate that site Texaco would be classified as Free Floating, the rest of the sites would be classified as Impounded Floating.

46
SOIL AND WATER PROPERTIES Introduction
We measured the nutrient properties of soils (the vegetative peat mat) and their pore water under experimental (fertilization, grazing, transplantation) and natural conditions over the duration of this 4-year demonstration. We also measured the bulk characteristics of these largely organic soils. This section includes the methods, results, and discussion of the following belowground variables: root biomass, water nutrients, soil nutrients, suspended sediments, bulk properties, soil strength, and root mat thickness. The data include comparisons of before (1999) and after (2003) treatment conditions. Methods
Belowground Biomass To measure differences in root and rhizome biomass among the treatments, we took cores (n=2; 10 cm diameter x 30 cm depth) from each plot (treatment) at the end of the experiment (fall 2003). No belowground biomass samples were collected at the beginning of the project; thus, our comparison of treatment effect was restricted to the end of the experiment. Cores were sectioned into 10 cm intervals and sorted by root and rhizome components. Weights were recorded on a dry mass basis. Water Nutrients We sampled the pore water inorganic nutrients NH4
+(ammonium), NO2- + NO3
- (nitrite+nitrate), and PO4
3- (phosphate) at 5 cm and 25 cm depths on a seasonal basis. We collected two replicates by depth, plot, and season. The years and seasons we sampled pore water nutrients are shown in Table 10. Samples were filtered through a pore water rinsed 0.45 µm nylon membrane, with care not to expose samples to excess oxygen. Samples were preserved on ice in the field and were frozen at LSU until analysis. The LSU Coastal Ecology Institute Analytical Laboratory completed nutrient analyses. Soil Nutrients We collected a core (n=1; diameter=7.62 cm, depth=40 cm) from each plot (treatment) and sectioned it into 10 cm intervals, which were placed in polyethylene bags. We refrigerated the samples until analysis by the LSU Agronomy Department Soil Testing Laboratory. Soil samples were analyzed at their field moisture for total extractable phosphorus (Bray) and exchangeable cations (Ca2+, K+, Na+). The soil phosphorus and cation concentrations (m mol cm-3) were corrected for field moisture to a dry weight basis per unit volume of soil.

47
Table 10. Sampling dates for pore water nutrients.
Year Winter Spring Summer Fall
1999 Oct 12
2000 May 11 Jul 13 Sep 28
2001 Feb 22 May 8 Jul 15 Oct 10 / Nov 14*
2002 Mar 6 May 15 Aug 1 Oct 9 / Oct 30
2003 Jun 1 Oct 1 * Hurricane Lili and Tropical Storm Isidore confounded sampling in the Fall 2001 sampling. Turtle was sampled early; the other three sites were sampled later. Total carbon and nitrogen were measured as a total percentage of dry matter with a CHN analyzer (Perkin-Elmer) at the LSU Coastal Ecology Institute Analytical Laboratory. Prior to analysis the soil was ground and homogenized (#40 mesh) in a Wiley mill. Bulk Properties To measure bulk density and percentage organic matter, we collected one core (n=1; diameter=7.62 cm, depth=30 cm) from each plot (treatment) and sectioned it into 10 cm intervals. Each 10 cm interval was weighed for its field moisture (wet bulk density) and then dried to a constant weight (60° C) to determine dry bulk density and water content. Percentage organic matter of soil samples was determined by mass loss of approximately 1.0 g of homogeneous sample (milled through a #40 mesh) after ignition in a muffle furnace for 3 hours at 550°C. Soil Strength and Mat Thickness We measured soil strength at the end of the project (spring 2004). We also measured soil strength several times throughout the project (spring 2000, fall 2000, fall 2001). For the purposes of this report, we based our treatment comparisons on the end of project measurements to eliminate possible inconsistency among operators. We used the Trodden Soiltest Torvane (ELE International, Lake Bluff, Illinois) to determine the amount of torque (kg cm-2) required to produce shear failure of a sample. We took cores (n=3; diameter=7.62 cm, depth=30cm) from each plot, extruded the cores, and bisected them longitudinally. Both of the flat, bisected faces of each soil interval (0-10, 10-20, 20-30 cm) were tested with the 1.0 vane. Each face represented a replicate measurement. Mat thickness was determined qualitatively from cores (n=3) that were collected for soil strength measurements. We examined the core for a marked change in peat cohesiveness—a change in peat consistency from fibrous (live and dead root matter) to humic (intermediate in decay) or

48
sapric (highly decayed) matter. Thus, the mat thickness measurement represented the portion of peat matrix that remained cohesive or resisted mechanical hand separation compared to that of underlying unconsolidated organic particles. Suspended Sediments Suspended matter of the open water adjacent to each site was determined from three replicate water samples. Water samples were collected in clean nalgene® sample containers. The bottles were rinsed with ambient water, then filled, capped and placed in an ice chest. The samples were returned to the laboratory for total suspended load and organic/mineral content analysis. Samples were collected on 12 separate trips from May 2000 to December 2002. Total suspended matter was determined by filtering a known volume of water through a pre-combusted (550 ˚C) and pre-weighed glass fiber filter (Whatman GF/F or equivalent). The filters were dried at 60 ˚C to a constant weight then re-weighed to determine total suspended load in mg/l. The filters were then combusted at 550 ˚C, cooled, and then re-weighed to estimate the mass of organic matter lost by combustion (APHA, 1992). Site Specific Analyses We focused our analyses on Turtle and Mud sites, since Towhead and Texaco were confounded by nutria disturbance (see Study Area section). At a general level, means were compared between these two sites with respect to beginning and ending conditions, and the treatments of fertilization, transplanting, and grazing. In some cases, site means were pooled (i.e. belowground biomass). Otherwise, most parameters were examined on a site-by-site basis. Open water nutrient and suspended sediment comparisons (means) were made for all four sites to understand the relative influence of the Atchafalaya River compared to our experimental sites, Turtle and Mud. Results Belowground Biomass Fertilization did not increase live belowground biomass in plots that were planted with Panicum hemitomon and protected from grazing (Figure 31; means pooled from both sites Turtle and Mud). Exclusion of grazers from the natural community did not enhance the live belowground biomass compared to that of the control (grazed, natural community): control biomass (600±186 g m-2) was almost equal to ungrazed biomass of the spikerush community (567±228 g m-2). The average belowground biomass (1,367±175 g m-2) of the ungrazed, transplanted Panicum hemitomon treatments (both fertilized and unfertilized) more than doubled that of the control and ungrazed, unplanted treatments.
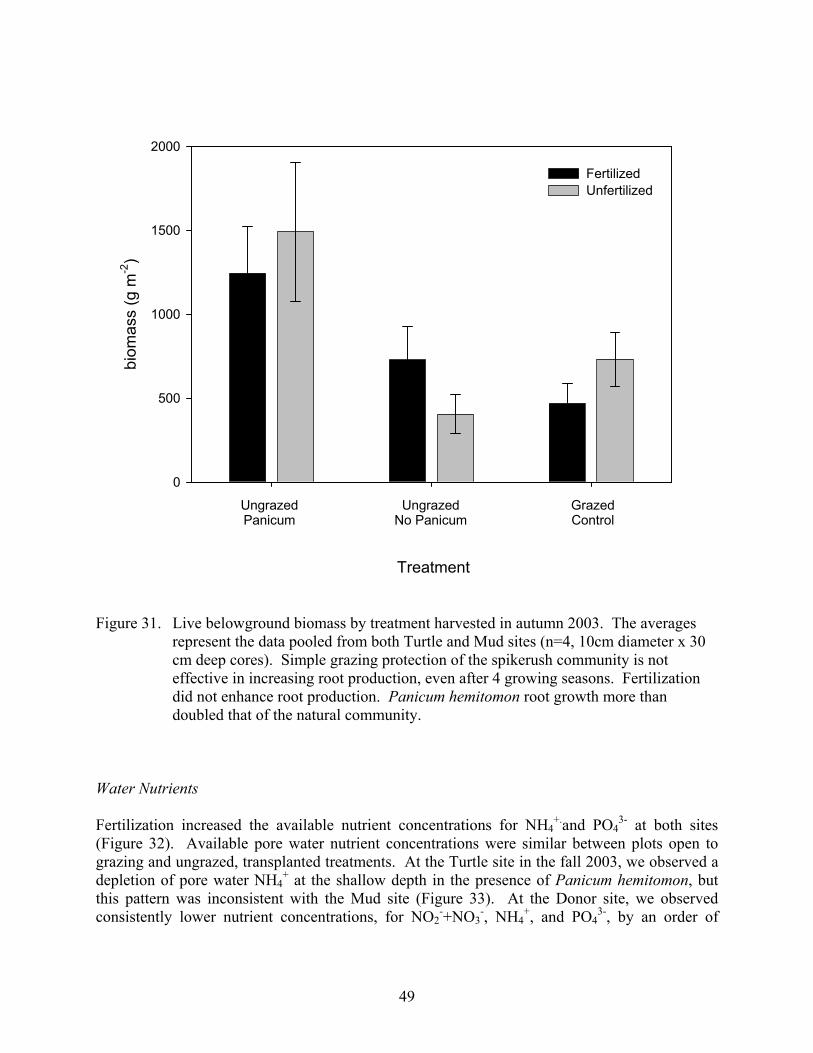
49
Treatment
biom
ass
(g m
-2)
0
500
1000
1500
2000
FertilizedUnfertilized
GrazedControl
UngrazedPanicum
UngrazedNo Panicum
Figure 31. Live belowground biomass by treatment harvested in autumn 2003. The averages
represent the data pooled from both Turtle and Mud sites (n=4, 10cm diameter x 30 cm deep cores). Simple grazing protection of the spikerush community is not effective in increasing root production, even after 4 growing seasons. Fertilization did not enhance root production. Panicum hemitomon root growth more than doubled that of the natural community.
Water Nutrients Fertilization increased the available nutrient concentrations for NH4
+.and PO43- at both sites
(Figure 32). Available pore water nutrient concentrations were similar between plots open to grazing and ungrazed, transplanted treatments. At the Turtle site in the fall 2003, we observed a depletion of pore water NH4
+ at the shallow depth in the presence of Panicum hemitomon, but this pattern was inconsistent with the Mud site (Figure 33). At the Donor site, we observed consistently lower nutrient concentrations, for NO2
-+NO3-, NH4
+, and PO43-, by an order of

50
magnitude (Figure 33). A concentration gradient of NH4+ increased with depth at both Turtle
and Mud sites, and this trend was consistent among seasons and years.
conc
entra
tion
(mg
l-1)
0.0
0.2
0.4
0.6
0.8
1.0co
ncen
tratio
n (m
g l-1
)
0.0
0.2
0.4
0.6
0.8
1.0
NH4+
NO2- + NO3
-
PO43-
Turtle
Mud
Fertilized Natural
Fertilized Natural
Figure 32. A comparison of marsh pore water nutrients from the upper 5-8 cm of fertilized and unfertilized plots at sites Turtle (upper graph) and Mud (lower graph). The means represent the time period from fall 1999 and fall 2003 (n=104). There is a significant fertilization effect at both sites for NH4
+.and PO43-. PO4
3- concentrations in the natural plots are at a level similar to P-enriched areas of the Florida Everglades (Kuhn et al. 2003). Turtle and Mud were similar in natural available nutrient status.

51
conc
entra
tion
(mg
l -1 )
0.0
0.1
0.2
0.6
0.8
1.0
1.2
conc
entra
tion
(mg
l -1 )
0.0
0.2
0.4
0.6
0.8
1.0
1.2
depth
lower upper
conc
entra
tion
(mg
l -1 )
0.0
0.10.8
1.0
1.2NH4
+
NO2-+NO3
-
PO43-
NH4+
NO2-+NO3
-
PO43-
NH4+
NO2-+NO3
-
PO43-
Turtle
Mud
Donor
Figure 33. A comparison of Fall 2003 marsh pore water concentrations at 5 cm (upper) and 25
cm (lower) depths at two experimental sites and a donor marsh dominated by Panicum hemitomon. The experimental plots were transplanted with Panicum hemitomon and received no fertilization. At the Turtle site, NH4
+ was depleted in the upper depth to levels similar to the donor marsh; however, this trend was not apparent at the Mud site. The donor site had available nutrient concentrations that were an order of magnitude less than experimental plots with the natural spikerush community.
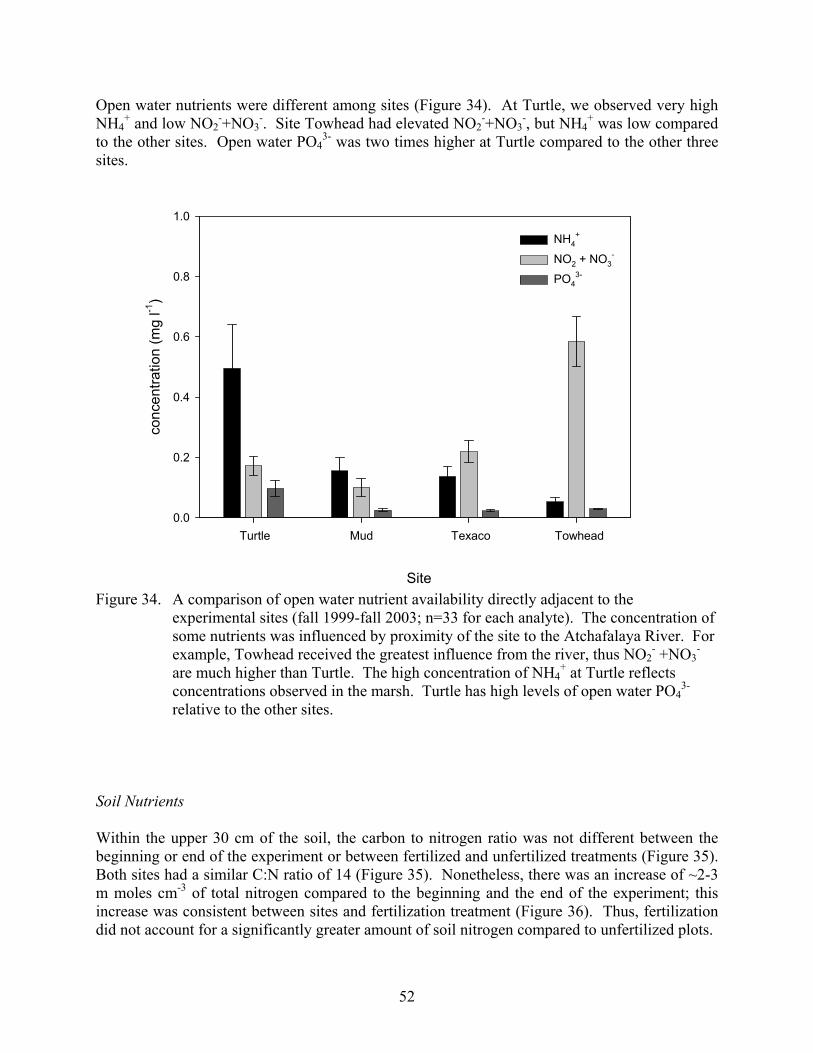
52
Open water nutrients were different among sites (Figure 34). At Turtle, we observed very high NH4
+ and low NO2-+NO3
-. Site Towhead had elevated NO2-+NO3
-, but NH4+ was low compared
to the other sites. Open water PO43- was two times higher at Turtle compared to the other three
sites.
Figure 34. A comparison of open water nutrient availability directly adjacent to the experimental sites (fall 1999-fall 2003; n=33 for each analyte). The concentration of some nutrients was influenced by proximity of the site to the Atchafalaya River. For example, Towhead received the greatest influence from the river, thus NO2
- +NO3-
are much higher than Turtle. The high concentration of NH4+ at Turtle reflects
concentrations observed in the marsh. Turtle has high levels of open water PO43-
relative to the other sites. Soil Nutrients Within the upper 30 cm of the soil, the carbon to nitrogen ratio was not different between the beginning or end of the experiment or between fertilized and unfertilized treatments (Figure 35). Both sites had a similar C:N ratio of 14 (Figure 35). Nonetheless, there was an increase of ~2-3 m moles cm-3 of total nitrogen compared to the beginning and the end of the experiment; this increase was consistent between sites and fertilization treatment (Figure 36). Thus, fertilization did not account for a significantly greater amount of soil nitrogen compared to unfertilized plots.
Site
conc
entra
tion
(mg
l-1)
0.0
0.2
0.4
0.6
0.8
1.0
NH4+
NO2 + NO3-
PO43-
Turtle Mud Texaco Towhead

53
C:N
0
5
10
15
20
25
1999 C:N2003 C:N
C:N
0
5
10
15
20
25
Mud
Turtle
FertilizedUnfertilized
Figure 35. Carbon to nitrogen ratio of dry soil measured prior to experimental manipulation
(1999; black) and at the end of the experiment (2003; grey) at each site. Means represent a depth composite of 0-30 cm of soil (three, 10-cm depth intervals). Any difference between the black bars between treatments within a site represents natural nutrient variability before fertilization. By the end of the experiment, there was no substantial change in carbon to nitrogen ratios.
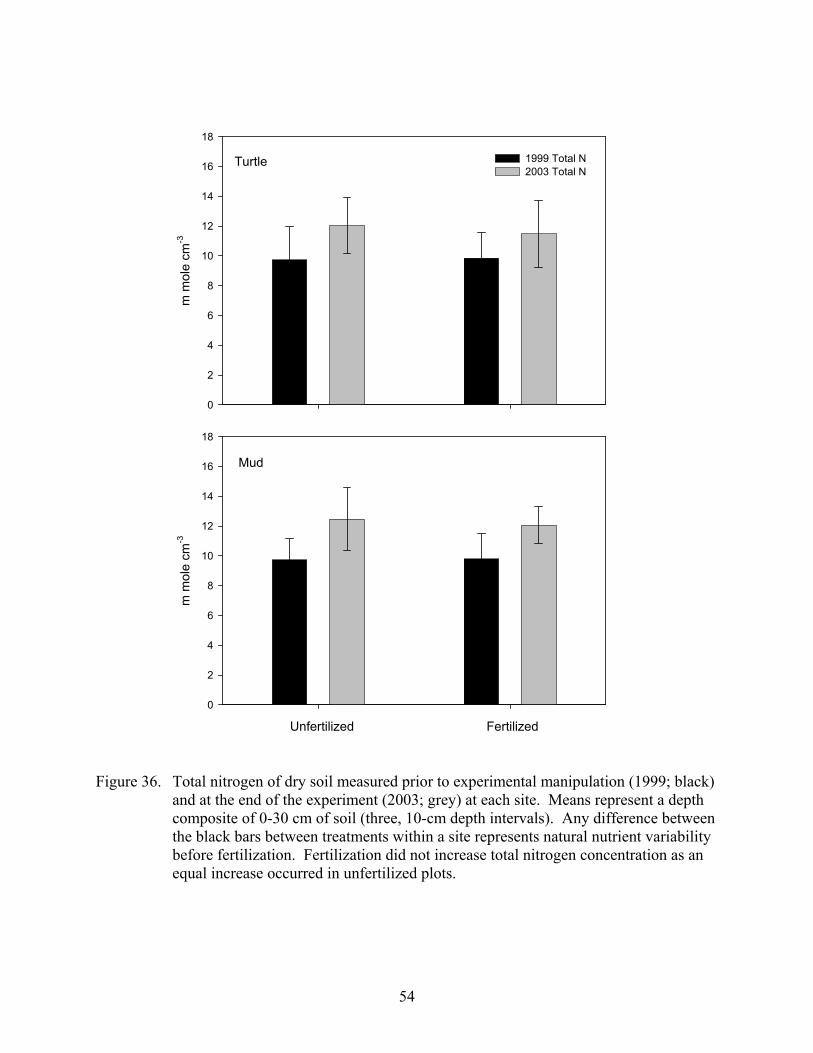
54
m m
ole
cm-3
0
2
4
6
8
10
12
14
16
18
1999 Total N2003 Total N
m m
ole
cm-3
0
2
4
6
8
10
12
14
16
18
FertilizedUnfertilized
Turtle
Mud
Figure 36. Total nitrogen of dry soil measured prior to experimental manipulation (1999; black)
and at the end of the experiment (2003; grey) at each site. Means represent a depth composite of 0-30 cm of soil (three, 10-cm depth intervals). Any difference between the black bars between treatments within a site represents natural nutrient variability before fertilization. Fertilization did not increase total nitrogen concentration as an equal increase occurred in unfertilized plots.

55
The amount of plant available P was highly variable between the beginning and the end of the experiment and with respect to fertilization treatment and site (Figure 37). No distinguishable trend was ascertained for soil-P, in contrast to pore water PO4
3-. Soil-K+ was highly variable at the beginning and end of the experiment (Figure 38). A fertilization effect was observed at the Turtle site and less so for the Mud site, by the end of the experiment. Despite high variability, there was an increase in K+ in unfertilized plots by the end of the experiment. A marked increase of Na+ occurred in the upper 30 cm of the soil from beginning to the end of the experiment (Figure 39). Na+ more than doubled at both sites regardless of fertilization treatment. Similar to Na+, both cations, Ca2+ and Mg2+, showed increases at both sites regardless of fertilization treatment (Figures 40 and 41). Bulk Properties Bulk density increased at both sites from 1999 to 2003; however, the percentage of organic matter of the soil remained stable over time (Figure 42). The bulk density increase was caused by an increase in the mineral density of the soil (Figure 43). This increase in mineral density was not isolated to any depth interval (Figure 43). Soil Strength and Mat Thickness Based on strength measurements taken at the end of the study (spring 2004), we found that mat strength was greatest in the upper 0-10 cm of the plots protected from grazing with Panicum transplants (Figure 41); both Turtle and Mud had similar strength in this upper section (~0.35 kg cm-2; Figure 44). Elimination of grazing did not increase the soil strength of the natural community at either site (Figure 44). Fertilization did not enhance soil strength in combination with any of the other treatments (Figure 44). The only appreciable increases in mat thickness were observed in plots containing transplanted Panicum (Figure 45). We conservatively estimated that Panicum contributed an additional 8-10 cm of root mat thickness compared to control conditions (Figure 45). Suspended Sediments Measurements of suspended sediment load at each site showed that total suspended sediment in the open water bodies adjacent to our study sites were different by site (Figure 46). Averaged over the year, total mineral sediment loads were highest at Towhead (~50 mg/l) and lowest at Turtle (<20 mg/l), with intermediate concentrations (<30 mg/l) at Mud and Texaco. Site differences in total suspended material were attributable to the mineral fraction (Figure 46). Average annual suspended organic material concentration was equal among sites (Figure 46). Suspended mineral load was lowest in the autumn, while late winter and spring had the highest load with river flooding (Figure 47).

56
m m
ole
cm-3
0
2
4
6
8
10
1999 plant available P 2003 plant available P
m m
ole
cm-3
0
2
4
6
8
10
Turtle
Mud
Unfertilized Fertilized Figure 37. Soil-P (plant available) measured prior to experimental manipulation (1999; black)
and at the end of the experiment (2003; grey) at each site. Means represent a depth composite of 0-30 cm of soil (three, 10-cm depth intervals). Any difference between the black bars between treatments within a site represents natural nutrient variability before fertilization. Although there was a strong effect of fertilization on the concentration of marsh pore water PO4
3-, the availability of soil-P from fertilization was not significant.

57
m m
ole
cm-3
0
2
4
6
8
10
12
1999 K+
2003 K+
m m
ole
cm-3
0
2
4
6
8
10
12
Unfertilized Fertilized
Turtle
Mud
Figure 38. Soil-K+ measured prior to experimental manipulation (1999; black) and at the end of
the experiment (2003; grey) at each site. Means represent a depth composite of 0-30 cm of soil (three, 10-cm depth intervals). Any difference between the black bars between treatments within a site represents natural nutrient variability before fertilization. There were similar gains in soil-K+ in the 4-year interval over the amount supplied from fertilization.

58
m m
ole
cm-3
0
20
40
60
80
1999 Na+
2003 Na+
m m
ole
cm-3
0
20
40
60
80
Unfertilized Fertilized
Mud
Turtle
Figure 39. Soil-Na+ measured prior to experimental manipulation (1999; black) and at the end
of the experiment (2003; grey) at each site. Means represent a depth composite of 0-30 cm of soil (three, 10-cm depth intervals). Any difference between the black bars between treatments within a site represents natural nutrient variability before fertilization. Na+, not normally associated with fresh water or river influence, doubled in concentration since 1999.

59
m m
ole
cm-3
0
100
200
300
400
1999 Ca++
2003 Ca++
m m
ole
cm-3
0
100
200
300
400
Unfertilized Fertilized
Turtle
Mud
Figure 40. Soil-Ca2+ measured prior to experimental manipulation (1999; black) and at the end
of the experiment (2003; grey) at each site. Means represent a depth composite of 0-30 cm of soil (three, 10-cm depth intervals). Any difference between the black bars between treatments within a site represents natural nutrient variability before fertilization. Soil-Ca2+ concentration in 2003 was almost twice that of 1999 at both sites. Ca2+ was not present in the fertilizer.
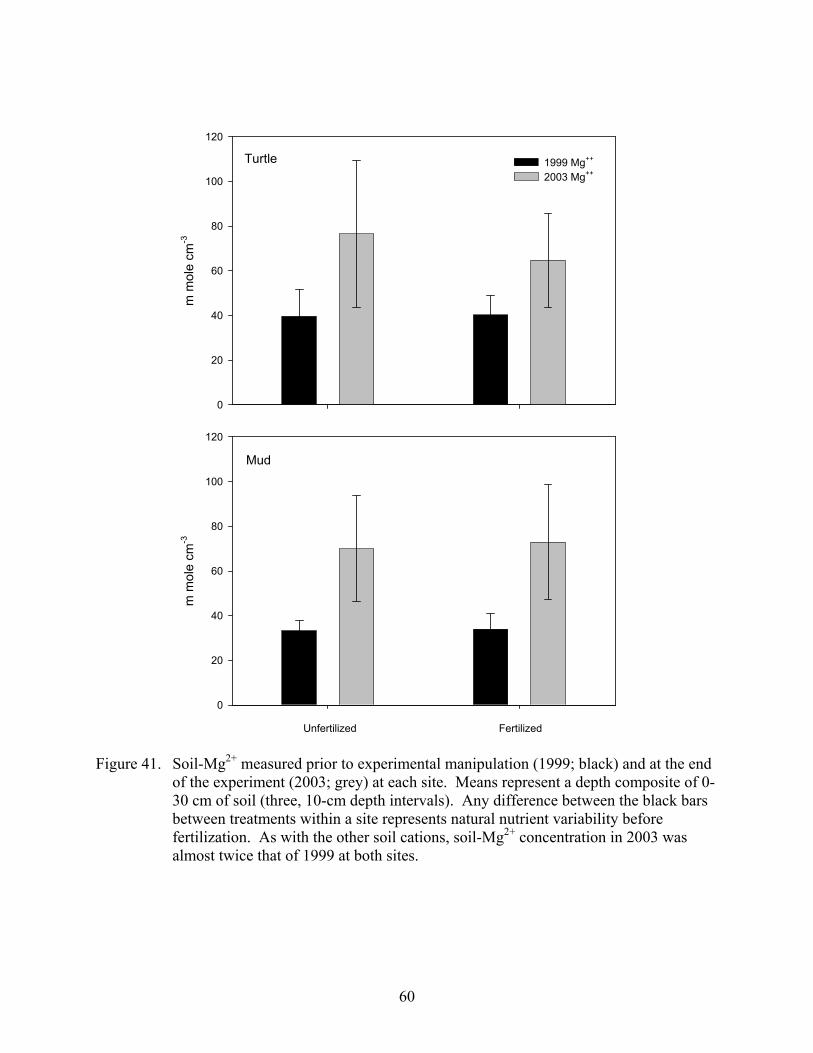
60
m m
ole
cm-3
0
20
40
60
80
100
120
1999 Mg++
2003 Mg++
m m
ole
cm-3
0
20
40
60
80
100
120
Unfertilized Fertilized
Turtle
Mud
Figure 41. Soil-Mg2+ measured prior to experimental manipulation (1999; black) and at the end
of the experiment (2003; grey) at each site. Means represent a depth composite of 0-30 cm of soil (three, 10-cm depth intervals). Any difference between the black bars between treatments within a site represents natural nutrient variability before fertilization. As with the other soil cations, soil-Mg2+ concentration in 2003 was almost twice that of 1999 at both sites.

61
Bulk
den
sity
(g c
m-3
)
0.00
0.02
0.04
0.06
0.08
0.10
0.12
19992003
Org
anic
mat
ter (
%)
0
20
40
60
80
100
MudTurtle
Site Figure 42. Soil bulk density and organic matter percentage for each site prior to treatment
application (1999; black) and at the end of the experiment (2003; grey). Means represent an average of the upper 30 cm of soil and all the plots at a site (n=8). A marginal increase in bulk density (upper panel) occurred at both sites over the experimental duration. Although the organic matter percentage has not changed in the soil, there was an increase in soil mineral density (see Fig. 40), which controls changes in bulk density.

62
0.00 0.01 0.02 0.03 0.04 0.05
20031999
mineral density (g cm-3)
0.00 0.01 0.02 0.03 0.04 0.05
dept
h (c
m)
0
5
15
25
0
5
15
25
dept
h (c
m)
Turtle
Mud
Figure 43. An overall increase in the mineral density at both Turtle and Mud sites occurred between the beginning of the experiment (1999) and the end (2003). There was an overall increase of approximately 5 mg cm-3 in the soil mineral density at both sites. Mineral sediment increases may account for the cation and nutrient concentration differences observed between the beginning and ending of the experiment.

63
shear strength (kg cm-2)
0.0 0.1 0.2 0.3 0.4 0.5 0.6
dept
h (c
m)
-30
-25
-20
-15
-10
-5
0
shear strength (kg cm-2)
0.0 0.1 0.2 0.3 0.4 0.5 0.6
dept
h (c
m)
-30
-25
-20
-15
-10
-5
0
shear strength (kg cm-2)
0.0 0.1 0.2 0.3 0.4 0.5 0.6
dept
h (c
m)
-30
-25
-20
-15
-10
-5
0
shear strength (kg cm-2)
0.0 0.1 0.2 0.3 0.4 0.5 0.6
dept
h (c
m)
-30
-25
-20
-15
-10
-5
0
shear strength (kg cm-2)
0.0 0.1 0.2 0.3 0.4 0.5 0.6
dept
h (c
m)
-30
-25
-20
-15
-10
-5
0
shear strength (kg cm-2)
0.0 0.1 0.2 0.3 0.4 0.5 0.6
dept
h (c
m)
-30
-25
-20
-15
-10
-5
0
Panicum, no grazing Panicum, no grazing
No grazing No grazing
Grazed, control Grazed, control
Fertilized Unfertilized Figure 44. Soil strength of sites Turtle (shaded circles) and Mud (open) at the end of the
experiment (spring 2004) by each treatment combination. Transplanting Panicum increases the soil strength in the upper 10 cm of the peat profile. Excluding grazing does not appreciably increase soil strength. The relatively high soil strength observed in the unfertilized, grazed, control at Mud Canal is due to the presence of a relic mat of well preserved dead, fine roots.
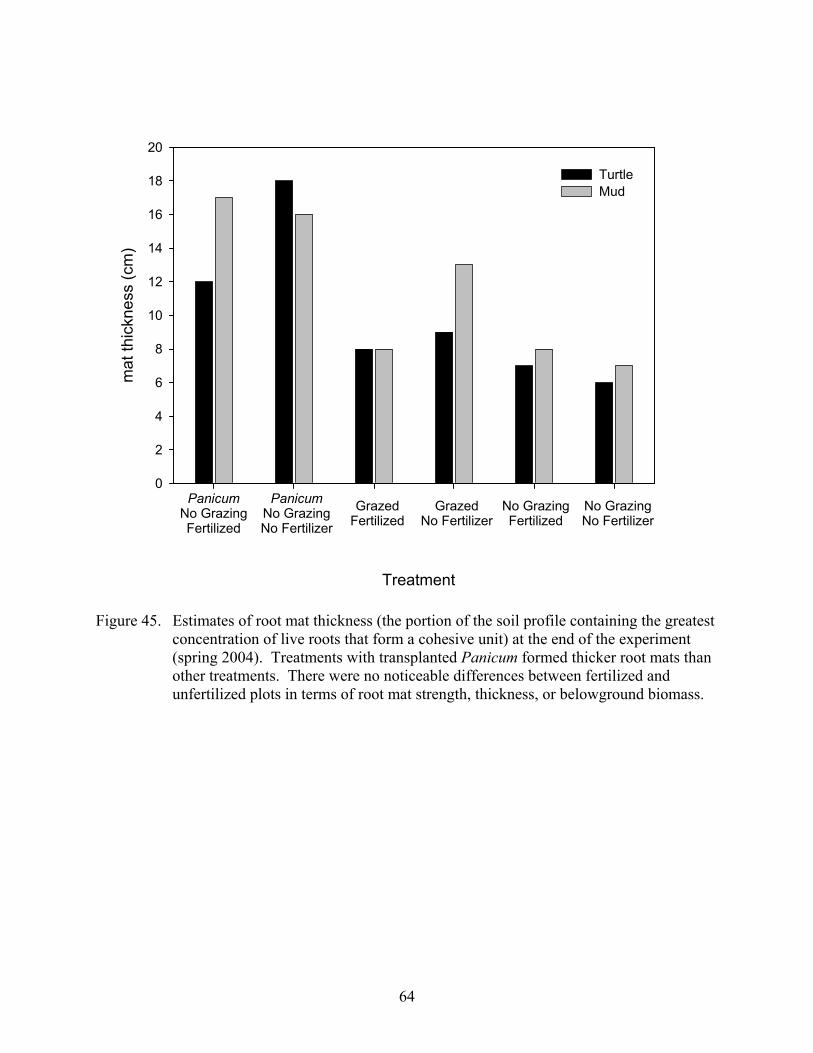
64
Treatment
mat
thic
knes
s (c
m)
0
2
4
6
8
10
12
14
16
18
20
TurtleMud
PanicumNo GrazingFertilized
PanicumNo GrazingNo Fertilizer
GrazedNo Fertilizer
GrazedFertilized
No GrazingFertilized
No GrazingNo Fertilizer
Figure 45. Estimates of root mat thickness (the portion of the soil profile containing the greatest concentration of live roots that form a cohesive unit) at the end of the experiment (spring 2004). Treatments with transplanted Panicum formed thicker root mats than other treatments. There were no noticeable differences between fertilized and unfertilized plots in terms of root mat strength, thickness, or belowground biomass.

65
Site
Turtle Mud Texaco Towhead
susp
ende
d m
atte
r (m
g l-1
)
0
10
20
30
40
50
60
mineralorganic
Figure 46. Average suspended mineral and organic matter in the open water adjacent to each
site for the period 2000-2002. Organic matter contribution to total suspended matter concentration was consistent over time and site; thus, the effect of mineral sediments accounted for site differences. Means are absolute to the y-axis (bars not stacked but overlain).
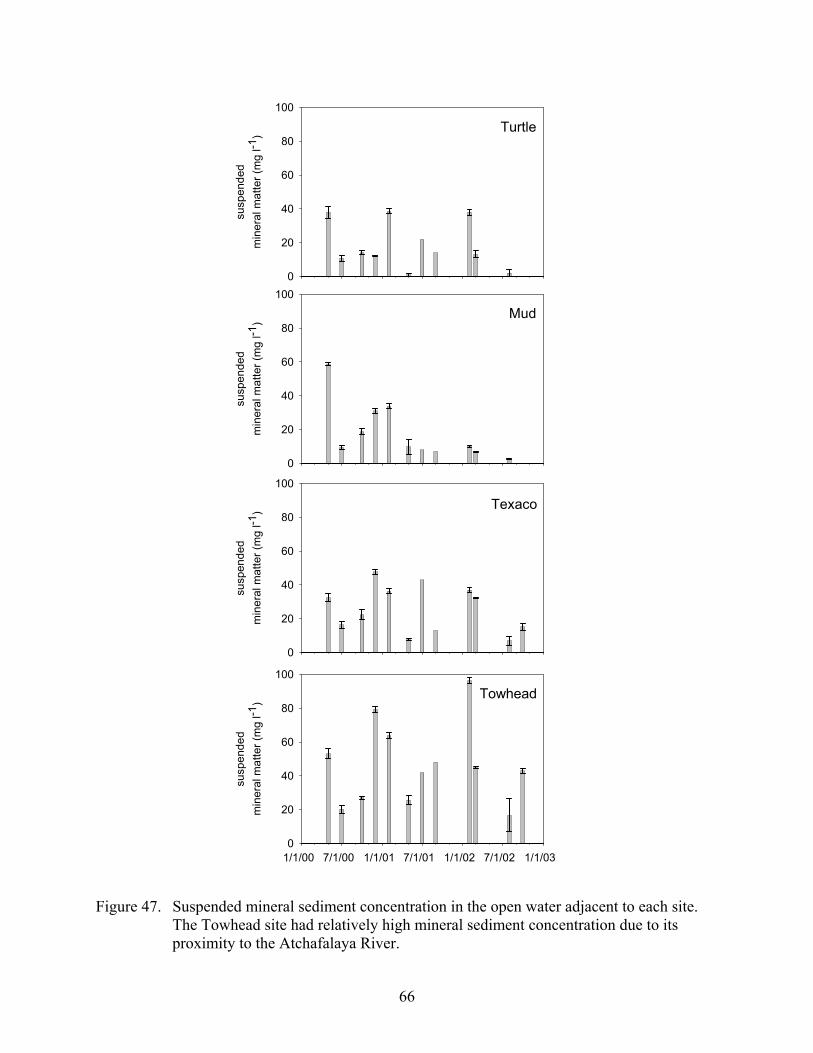
66
susp
ende
dm
iner
al m
atte
r (m
g l-1
)
0
20
40
60
80
100
susp
ende
dm
iner
al m
atte
r (m
g l-1
)
0
20
40
60
80
100
susp
ende
dm
iner
al m
atte
r (m
g l-1
)
0
20
40
60
80
100
1/1/00 7/1/00 1/1/01 7/1/01 1/1/02 7/1/02 1/1/03
susp
ende
dm
iner
al m
atte
r (m
g l-1
)
0
20
40
60
80
100
Towhead
Turtle
Texaco
Mud
Figure 47. Suspended mineral sediment concentration in the open water adjacent to each site.
The Towhead site had relatively high mineral sediment concentration due to its proximity to the Atchafalaya River.

67
Discussion
The concentration of available nutrients in the open water reflected a continuum of source water from the marsh habitat or the Atchafalaya River. For example, Towhead experienced the strongest influence from the river, thus NO2
-+NO3- concentrations (0.8 mg l-1) were much higher
than those observed at Turtle and Mud, which received less river influence. Turner and Rabalais (1991) reported the average concentration of NO3
- in the Mississippi River to be approximately 1.0-1.5 mg l-1 N-NO3
-. In contrast, a high concentration of NH4+ in the open water at Turtle
mirrored concentrations observed in the marsh. Mud and Turtle sites were similar in open water nutrient concentrations and reflect a minor river influence, which is corroborated by the rather low suspended mineral sediment concentration we observed at these sites. Thus, the peat-based marshes of our study area appear to be a source of reduced, inorganic nitrogen (as NH4
+) to the open water habitat. The high concentration of NH4
+ in the open water of the Penchant watershed observed by Lane et al. (2002) relative to that of the Atchafalaya River has been hypothesized as re-mineralized N largely from organic matter decay, presumably of marsh origin. The open water at Turtle had appreciably higher (2X) levels of PO4
3- relative to the other sites; the reason for this is not entirely clear. It is possible that the lower amount of PO4
3- found at the other sites is governed by P transformations depending on the source water, whether marsh or river-borne. Available-P (as PO4
3-) concentration is controlled by the reduction-oxidation status of the aqueous environment. River-borne suspended, mineral sediments that usually contain oxidized iron (Fe3+) will readily adsorb P, making it unavailable for direct biological uptake. However, when Fe3+ is reduced and exposed to organic acids, as expected in the acidic and anoxic, peat-marsh sediments, P can be released (Schlesinger 1997). It is possible that conditions at the Turtle site are favorable for release of inorganic P to the surrounding open water. Another potential mechanism for the high inorganic P at the Turtle site (relative to other sites) may be the lack of a river water dilution effect. Lane et al. (2002) showed that the Bayou Penchant watershed (connected to Atchafalaya River discharge) exhibited higher PO4
3- concentrations in the open water than the Atchafalaya River during periods of low river flow. PO4
3- concentrations in the pore water at Turtle were similar to levels reported in the enriched areas of the Florida Everglades (Kuhn et al. 2003, Newman et al. 1996). That the high level of PO4
3- (> 0.15 mg l-l) in the marsh pore water was not assimilated or immobilized suggests that the dominant emergent plants (i.e. Eleocharis sp.) and their microbial communities have low nutrient requirements or uptake capacity. High concentrations of inorganic-P may also be caused by rapid microbial mineralization rates. Available nutrient concentrations of NH4
+ and PO43- in pore water at the thin-mat sites were
consistently an order of magnitude higher than those found in our nearby Panicum-dominated donor marsh. Apparently, Panicum hemitomon exhibits a high capacity for nutrient assimilation. Intense grazing of the thin-mat habitat may accelerate the rate of soil N and P mineralization through fecal deposition and increased solar insolation to the marsh surface. Thus, the mechanisms responsible for excess nutrient availability of the thin-mat ecosystem indicate a strong interaction between the plant community and grazing intensity, in combination with dynamical river flooding. That is, emergent plant productivity and subsequent nutrient immobilization is limited by excessive grazing (nutria), which results in rapid nutrient turnover.

68
The ending belowground biomass of the transplanted Panicum hemitomon and the natural community was not enhanced significantly with fertilization. This may indicate adequate, natural nutrient concentrations of the marsh pore water. We observed an average pore water NH4
+ concentration of ~0.4 mg l-1 in our unfertilized plots (at both sites); these pore water concentrations were similar to those documented in an Everglades study that used a relatively high N fertilizer application rate of 22 g N m-2 yr-1 (Craft et al. 1995). Given the lack of a significant biomass response with fertilization and the naturally elevated concentration of available N and P in this system, we concluded that nutrient limitation at our study sites was not a significant constraint on establishment and growth of Panicum hemitomon. Soil total-N increased between both sites over the 4 years and the availability of nitrogen was not unbalanced with respect to carbon. Our sites had a natural (unfertilized) C:N ratio (~14) that was well below the threshold (20) where nitrogen immobilization occurs (Kulshreshtha and Gopal 1982). The increase of cation concentrations, commensurate with increasing mineral density throughout the 30 cm soil depth at both sites, suggests that the overall base status or mineral nutrition of our sites improved over the 4-year experimental period. The increase in divalent cation concentration (especially Mg2+ and Ca2+) was also associated with a proportional increase in soil Na+. Without S or Fe data, it is unknown to what degree the increase in mineral density and cation concentration in the soil was influenced by marine storm events or simply an incremental influence of the river over time.

69
DISCUSSION Panicum hemitomon-dominated floating freshwater marshes form a significant portion of the extensive Louisiana coastal marshes. This marsh type is one of the major, naturally occurring vegetation types that historically covered even larger areas of our coastal basins. It represents a major part of the natural diversity of our coastal landscape to be protected and restored under CWPPRA. A mature floating thick-mat maidencane marsh is a self maintaining, integrated system—a single functional unit. The floating substrate is formed by the plants that grow on and in it. The living plants use carbon dioxide, water and inorganic nutrients to harvest the sun’s energy as organic material, growing stems and leaves and transporting excess organic production to grow roots, which build the mat. A healthy maidencane marsh usually has a thick (40-60cm; Sasser et al. 1995) buoyant, organic mat that rises and falls with water level changes, and as a result has a constant water level relative to the marsh surface. The Eleocharis baldwinii-dominated thin-mat floating marshes, such as those where the demonstration project sites are located, are quite different from the maidencane marsh described above. It is generally thought to be a degraded form of the maidencane marsh, and is dominated by Eleocharis baldwinii early in the growing season. Later other plants such as Ludwigia leptocarpa, Phyla nodiflora, and Bidens laevis overtop them and appear to dominate the late summer flora (Sasser et al. 1996). This plant association produces a much thinner mat, no more than 30 cm thick, with the root zone held together by the fine root system of Eleocharis baldwinii. The root zone of this mat is much weaker and more easily disrupted. The mats have been documented to float more irregularly and unpredictably in some years where they appear to lose buoyancy during the winter months and regain it during the summer (Sasser et al. 1996). Because the mat is thinner than maidencane mats, it is not as buoyant and will rarely support the weight of a man. This plant association was seldom recorded in the Louisiana coast-wide marsh survey carried out by Chabreck in 1968. By 1992, it accounted for 41% of the fresh and oligohaline marsh area on transects east of the Atchafalaya River that had previously been dominated by maidencane (Visser et al. 1999). This area includes the Bayou Penchant watershed where this demonstration project is located. It is the objective of this demonstration project to induce the development of thick-mat floating marsh in thin-mat floating marsh areas by transplanting Panicum hemitomon into them and inducing vegetation growth through fertilization and protection from mammal grazing. The results of the demonstration are clear. Transplanted Panicum hemitomon survived, became established, and grew well at all sites when protected from grazing. Fertilization resulted in higher nutrient concentrations in both plant tissues and interstitial substrate water; however, the results of this demonstration project show that fertilization for survival or improved biomass production of Panicum hemitomon is not necessary in this system. Grazing by nutria is a crucial factor in the survival of Panicum hemitomon at all sites. Because of the large observed populations and grazing damage to vegetation, nutria are generally considered to be a major cause of marsh degradation in coastal Louisiana. In extreme cases, as

70
indicated from studies in the Atchafalaya River Delta in early successional marshes, vigorous stands of vegetation have been entirely removed by grazing, leaving an unvegetated mud flat (Evers et al. 1998). Kinler et al. (1987) and a recent literature review for the Louisiana Brown Marsh research effort summarized studies of vegetation damage caused by nutria in Louisiana. The best evidence of the importance of grazing by fur bearers in the mainland marshes of coastal Louisiana is from the surveys completed by Linscombe and Kinler utilizing observations made from a helicopter. For example their survey of Barataria and Terrebonne marshes (Linscombe and Kinler, 1994) detected 91 damaged areas totaling approximately 15,500 acres. Since they surveyed about 28% of the total fresh, intermediate and brackish marsh in the region, this translates to about 55,000 acres of damage in the basin. Over one half of the damage occurred in fresh marshes and 66-86% of the damage was classified as moderate or severe. Floating marshes are the preferred habitat with nutria densities as high as 18 animals per acre. The results of this demonstration project emphasize the point, as evidenced by the vigorous plant growth of Panicum hemitomon when compared to adjacent open marsh that is shorter and disturbed in appearance from grazing. It is clear that the effects of grazing by nutria must be controlled and minimized to allow successful long-term restoration of Panicum hemitomon marshes in the freshwater marsh areas of coastal Louisiana where this plant species previously thrived.
71
CONCLUSIONS
• Transplanted Panicum hemitomon survived, became established, and grew well at all sites only when protected from grazing.
• Grazing by nutria is the crucial factor in the survival of Panicum hemitomon at all sites. Protection from grazing was essential for the establishment and continued growth of transplanted Panicum hemitomon (maidencane). Grazing protection coupled with maidencane transplantation doubled the root standing stock compared to control conditions of the natural community (Eleocharis baldwinii). Simple grazing protection of the natural community did not produce increases in live root standing stock.
• Although fertilization initially stimulated aboveground coverage of Panicum hemitomon, by the end of the demonstration there was no statistically significant difference in end-of-season biomass of above ground plant material in non-fertilized versus fertilized treatments.
• The natural nutrient availability of our demonstration sites was adequate for the growth of
Panicum hemitomon.
• The re-introduction of Panicum hemitomon into the thin-mat floating marsh builds a thicker and stronger marsh mat. Marsh soil strength and mat thickness were both increased by Panicum hemitomon growth coupled with grazing protection. Soil strength gains were observed in the upper 20 cm of the soil profile. An additional 10 cm of mat thickness was observed above that of control conditions. Protection from grazing of the existing thin-mat marsh plant community did not enhance soil strength or apparent root mat thickness.

72
RECOMMENDATIONS Continue and enlarge the current CWPPRA nutria control program, and develop improved methods to control nutria population. Develop methods of large-scale planting or transplanting of Panicum hemitomon into degraded freshwater marsh areas, such as by spreading viable pieces of plant rhizome material or seeds by aerial application or from barges along bayous and canals.

73
REFERENCES Adams, R. D. and R. H. Baumann. 1980. Land Building in Coastal Louisiana: Emergence of
the Atchafalaya Bay Delta. Center for Wetland Resources, Louisiana State University, Baton Rouge, LA 70803. Sea Grant Publication LSU-SG-80-02.
APHA. 1992. Standard Methods for the examination of water and wastewater, 18th ed.
American Public Health Association, Inc. New York. Boar, R. R., C. E. Crook, and B. Moss. 1989. Regression of Phragmites australis reed swamps
and recent changes of water chemistry in the Norfolk Broadland, England. Aquatic Botany 35: 41–55.
Boon, J. D., III. 1978. Suspended Solids Transport in a Salt Marsh Creek - an Analysis of
Errors. in Estuarine Transport Processes (Kjerfve, B. J., ed.). The Belle W. Baruch Library in Marine Science, Number 7. University of South Carolina Press. Columbia, South Carolina. 331 pp.
Boorman, L. A. and R. M. Fuller. 1981. The changing status of reedswamp in the Norfolk
Broads. Journal of Applied Ecology 18: 241–269. Boyd, C. E. 1970. Chemical analyses of some vascular aquatic plants. Arch. Hydrobiol. 67:78–
85. Byrne, P., M. Borengasser, G. Drew, R. Muller, B. L. Smith, Jr., and C. Wax. 1976. Barataria
Basin: Hydrologic and Climatologic Processes. Center for Wetland Resources, Louisiana State University, Baton Rouge, Louisiana 70803. Sea Grant Publication LSU-T-76-012. 175 pp.
Condrey, R, P. Kemp, J. Visser, J. Gosselink, D. Lindstedt, E. Melancon, Jr., G. Peterson, and B.
Thompson. 1995. Characterization of the current status, trends, and probable causes of change in living resources in the Barataria-Terrebonne estuarine system. BTNEP Publ. No. 21, Barataria-Terrebonne National Estuarine Program, Thibodaux, LA, USA.
Chuang, W. S., E. M. Swenson. 1981. Subtidal Water Level Variations in Lake Pontchartrain,
Louisiana. Journal Geophysical Research 86(C5):4198-4204. Craft, C.B., J. Vymazal, and C.J. Richardson. 1995. Response of Everglades plant communities
to nitrogen and phosphorus additions. Wetlands 15:258-271. DeLaune, R. D., Smith, C. J., and Sarafyan, M. N. 1986. Nitrogen cycling in a freshwater marsh
of Panicum hemitomon on the deltaic plain of the Mississippi River. Journal of Ecology 74:249–256.
Evans, J. 1970. About nutria and their control. US Fish and Wildlife Service, Washington, DC,
USA. Resource Publication 86.

74
Evers, D. E., G. O. Holm, and C. E. Sasser. 1996. Digitization of the floating marsh maps in the
Barataria and Terrebonne basins, Louisiana. BTNEP Publ. No. 28, Barataria-Terrebonne National Estuarine Program, Thibodaux, LA, USA.
Evers, D. E., C. E. Sasser, J. G. Gosselink, D. A. Fuller, and J. M. Visser. 1998. The impact of
vertebrate herbivores on wetland vegetation in Atchafalaya Bay, Louisiana. Estuaries 21: 1–13.
Frazier, D. E. 1967. Recent deltaic deposits of the Mississippi River, their development and
chronology. Gulf Coast Association of the Geological Society—Transactions 17:287-315.
Gagliano, S. M., and J. L. Van Beek. 1970. Geologic and geomorphic aspects of deltaic
processes, Mississippi delta system. Hydrologic and geologic studies of coastal Louisiana. Center for Wetland Resources, Louisiana State University, Baton Rouge, LA, USA. Report No. 1.
Gerloff, G. C., and Krombholz, P. H. 1966. Tissue analysis as a measure of nutrient availability
for the growth of angiosperm aquatic plants. Limnology and Oceanography 11:529–537. Gosselink, J. G., R. Hatton, and C. S. Hopkinson. 1984. Relationship of organic carbon and
mineral content to bulk density in Louisiana marsh soils. Soil Science 137:177-180. Hassall, M., R. Riddington, and A. Helden. 2001. Foraging behaviour of brent geese, Branta b.
bernicla, on grasslands: effects of sward length and nitrogen content. Oecologia 127:97–104.
Jacobsen, O. W. 1992. Factors affecting selection of nitrogen-fertilized grassland areas by
breeding wigeon, Anas penelope. Ornis Scandinavica 23:121–131. Kinler, N., R. G. Linscombe, and R. H. Chabreck. 1980. Smooth beggartick, its distribution,
control and impact on nutria in coastal Louisiana. In: J. A. Chapman and D, Pursley (eds.) Worldwide Furbearer Conference Proceedings, Frostburg, MD, USA.
Kjerfve, B. J. and H. N. McKeller, Jr. 1980. Time Series Measurements of Estuarine Materials
Fluxes. in Estuarine Perspectives (Kennedy, V. S., ed.). Academic Press, New York. pp. 341-357.
Kjerfve, B. J., L. H. Stevenson, J. A. Prohel, T. H. Chrzanowski and W. M. Kitchens. 1981.
Estimation of Material Fluxes in an Estuarine Cross-section: A Critical Analysis of Spatial Measurement Density and Errors. Limnology and Oceanography 26:325-335.
Klötzli, F. 1971. Biogenous influence on aquatic macrophytes especially Phragmites communis.
Hidrobiologia, Bucaresti 12: 107–111.

75
Koerselman, W., and Meuleman, A. F. M. 1996. The vegetation N:P ratio: a new tool to detect the nature of nutrient limitation. Journal of Applied Ecology 33:1441–1450.
Kolb, C. R., and J. R. Van Lopik. 1958. Geology of the Mississippi deltaic plain—southeastern
Louisiana. U.S. Army Corps of Engineers Waterways Experiment Station Technical Report 2:3–482.
Kuhn, N.L., I. A. Mendelssohn, K.L. McKee, B. Lorenzen, H. Brix, and S. Miao. 2002. Root
phosphatase activity in Cladium jamaicense and Typha domingensis grown in Everglades soil at ambient and elevated phosphorus levels. Wetlands 22:794-800.
Kulshreshtha, M. and B. Gopal. 1982. Decomposition of freshwater wetlands vegetation. I.
submerged and free-floating macrophytes. pp. 259-278. In B. Gopal, R.E. Turner, R.G Wetzel, and D.F. Whigham (Eds.) Wetlands Ecology and Management. National Institute of Ecology, Jaipur, India.
Lane, R. R., J. W. Day, B. Marx, E. Reyes, and G. P. Kemp. 2002. Seasonal and spatial water
quality changes in the outflow plume of the Atchafalaya River, Louisiana, USA. Estuaries 25:30-42.
Langvatn, R., and T. A. Hanley. 1993. Feeding-patch choice by red deer in relation to foraging
efficiency - an experiment. Oecologia 95:164–170. Lowery, H. G., Jr. 1974. The mammals of Louisiana and its adjacent waters. Louisiana State
University Press, Baton Rouge, LA, USA. McKee, K. L. and I. A. Mendelssohn. 1989. Response of freshwater marsh plant community to
increased salinity and increased water level. Aquatic Botany 34: 301–316. Newman, S., J.B. Grace, and J.W. Koebel. 1996. Effects of nutrients and hydroperiod on
Typha, Cladium, and Eleocharis: implications for Everglades restoration. Ecological Applications 6:774-783.
Nyman, J. A., R. H. Chabreck, and N. W. Kinler. 1993. Some effects of herbivory and 30 years
of weir management on emergent vegetation in a brackish marsh. Wetlands 13: 165–175. O’Neil, T. 1949. The muskrat in the Louisiana coastal marshes. Louisiana Wildlife and
Fisheries Commission, New Orleans, LA. Rabalais, N. N., Q. Dortch, D. Justic, M. B. Kilgen, P. L. Klerks, P. H. Templet, R. E. Turner, B.
Cole, D. Duet, M. Beacham, S. Lentz, M. Parsons, S. Rabalais, and R. Robichaux. 1995. Status and trends of eutrophication, pathogen contamination, and toxic substances in the Barataria and Terrebonne estuarine system. BTNEP Publ. No. 22, Barataria-Terrebonne National Estuarine Program, Thibodaux, LA, USA.
76
Rich, F. J. 1984. The development of three tree islands in the Okefenokee Swamp, as determined by palynostratigraphy and peat petrography. In: A. D.Cohen, D. J. Casagrande, M. J. Andrejko, G. R. Best (eds.). The Okefenokee Swamp: its natural history, geology, and geochemistry. Wetland Surveys, Los Alamos, NM, USA.
Riddington, R., M. Hassall, and S. J. Lane. 1997. The selection of grass swards by brent geese,
Branta b. bernicla: Interactions between food quality and quantity. Biological Conservation 81:153–160.
Russell, R. J. 1942. Flotant. Geographical Review 32:74–98. SAS Institute Inc. 1988. SAS/STAT User's Guide: Release 6.03 Edition. SAS Institute, Inc.
Cary, NC 1028 pp. SAS, 1990a. SAS Procedures Guide, Version 6, Third Edition. SAS Institute, Inc., Cary, North
Carolina. 705 pp. SAS, 1990b. SAS Language Reference, Version 6, First Edition. SAS Institute, Inc., Cary,
North Carolina. 1042 pp. SAS, 1990c. SAS/Graph Software Reference, Version 6 First Edition, Volume 1. SAS
Institute, Inc., Cary, North Carolina. 1341 pp. SAS, 1990d. SAS/Graph Software Reference, Version 6 First Edition, Volume 2. SAS
Institute, Inc., Cary, North Carolina. 605 pp. SAS, 1990e. SAS /STAT User's Guide, Release 6.03 Edition. SAS Institute, Inc., Cary, North
Carolina. 1028 pp. Sasser, C. E., Gosselink, J. G., and Shaffer, G. P. 1991. Distribution of nitrogen and phosphorus
in a Louisiana freshwater floating marsh. Aquatic Botany 41:317–331. Sasser, C. E., E. M. Swenson, D. E. Evers, J. M. Visser, G. O. Holm, and J. G. Gosselink.1994.
Floating Marshes in the Barataria and Terrebonne Basins, Louisiana. Coastal Ecology Institute, Center for Coastal, Energy, and Environmental Resources, Louisiana State University, Baton Rouge, LA 70803. Prepared for U. S. Environmental Protection Agency, Region 6, Marine and Estuarine Section, Dallas, Texas. LSU-CEI-94-02.
Sasser, C. E., J. G. Gosselink, E. M. Swenson and D. E. Evers. 1995a. Hydrology, vegetation,
and substrate of floating marshes in sediment-rich wetlands of the Mississippi river delta plain, Louisiana, USA. Wetlands Ecology 3: 171–187.
Sasser, C. E., J. M. Visser, D. E. Evers, and J. G. Gosselink. 1995b. The role of environmental
variables on interannual variation in species composition and biomass in a subtropical minerotrophic floating marsh. Canadian Journal of Botany 73: 413–424.

77
Sasser, C. E., J. G. Gosselink, E. M. Swenson, C. M. Swarzenski, and N. C. Leibowitz. 1996. Vegetation, substrate, and hydrology in floating marshes in the Mississippi river delta plain wetlands, USA. Vegetatio 122: 129–142.
Schlesinger, W.H. 1997. Biogeochemistry: An Analysis of Global Change. 2nd Edition.
Academic Press, San Diego, CA. 588pp. Shaffer, G. P., C. E. Sasser, J. G. Gosselink, and M. Rejmánek. 1992. Vegetation dynamics in
the emerging Atchafalaya delta, Louisiana, USA. Journal of Ecology 80: 677–687. Stern, M. K., J. W. Day, Jr., and K. G. Teague. 1986. Seasonality of Materials Transport
Through a Coastal Fresh Marsh: Riverine Versus Tidal Forcing. Estuaries 9(4a):301-308.
Swenson, E. M. and W. S. Chuang. 1983. Tidal and subtidal water volume exchange in an
estuarine system. Estuarine, Coastal and Shelf Science. 16:229-240. Swenson, E. M. and R. E. Turner. 1987. Spoil Banks: Effects on a Coastal Marsh Water Level
Regime. Estuarine, Coastal and Shelf Science. 24:599-609. Swenson, E. M. , R. H. Baumann, and R. D. Adams. 1981. Water and Sediment Flux in the
Northern Terrebonne Marshes. Louisiana State University, Center for Wetland Resources, Baton Rouge, Unpublished Report.
Taylor, K. L., J. B. Grace, G. R. Guntenspergen, and A. L. Foote. 1994. The interactive effects
of herbivory and fire on an oligohaline marsh, Little Lake, Louisiana, USA. Wetlands 14: 82–87.
Turner, R.E. and N.N. Rabalais. 1991. Changes in Mississippi River water quality this century:
implications for coastal food webs. BioScience 41:140-147. Visser, J. M., C. E. Sasser, R. H. Chabreck, and R. G. Linscombe. 1999. Long-term vegetation
change in Louisiana tidal marshes, 1968–1992. Wetlands 19: 168–175. Wang. F. C. 1987. Effects of Levee Extension on Marsh Flooding. Journal of Water Resources
Planning Management 113:161-176. Wilsey, B. J., R. H. Chabreck, and R. G. Linscombe. 1991. Variation in nutria diets in selected
freshwater forested wetlands of Louisiana. Wetlands 11: 263–278.