thickness and volume of sediment in pelican lake, … · thickness and volume of sediment in ......
TRANSCRIPT
THICKNESS AND VOLUME OF SEDIMENT IN PELICAN LAKE, SOUTH DAKOTA, JUNE 1994
By STEVEN K. SANDO
U.S. GEOLOGICAL SURVEY
Water-Resources Investigations Report 96-4247
Prepared In cooperation with the
PELICAN LAKE WATER PROJECT DISTRICT
Rapid City, South Dakota 1996

U.S. DEPARTMENT OF THE INTERIOR
BRUCE BABBITT, Secretary
U.S. GEOLOGICAL SURVEY
Gordon P. Eaton, Director
The use of firm, trade, or brand names in this report is for identification purposes only and does not constitute endorsement by the U.S. Geological Survey.
For addtional information write to:
District Chief U.S. Geological Survey 1608 Mt. View Rd. Rapid City, SD 57702
Copies of this report can be purchased from:
U.S. Geological Survey Information Services Box 25286Denver Federal Center Denver, CO 80225-0046

CONTENTS
Abstract.....................................................................................................................................................^ 1Introduction ..............................................................................................................................................^ 1Description of Pelican Lake area........................................................................................................................................... 3Methods ..................................................................... 3
Determination of horizontal position........................................................................................................................... 3Determination of water depth and sediment thickness................................................................................................ 4Data interpretation and analysis .................................................................................................................................. 6
Verification and effectiveness of seismic system................................................................................................................... 6Water depth and sediment thickness...................................................................................................................................... 8Summary...............................................................^ 16References............................................................................................................................................................................. 16
ILLUSTRATIONS
1. Map showing location of Pelican Lake and U.S. Coast and Geodetic Survey disks nearWatertown in northeastern South Dakota................................................................................................................... 2
2. Map showing planned locations of transects for sediment survey of Pelican Lake................................................... 43. Map showing planned locations of transects and actual locations where water-depth records were collected.......... 54. Map showing planned locations of transects and actual locations where seismic records of sediment
thickness and probing-depth records were collected.................................................................................................. 65. Example seismic record and corresponding interpreted profile.................................................................................. 76. Example seismic record and corresponding interpreted profile showing interference in sub-sediment record......... 97. Map showing water depth in Pelican Lake, June 1994............................................................................................... 108. Map showing thickness of Holocene lake sediment in Pelican Lake, June 1994....................................................... 119. Map showing locations and depth of penetration where manual probing was performed......................................... 12
10. Map showing distribution of coarser grained and fine-grained surficial sediment in Pelican Lake........................... 1311. Graphs showing interpreted cross-sectional profiles for selected transects across Pelican Lake, June 1994............. 14
TABLE
1. Elevation/area/capacity information for Pelican Lake................................................................................................ 10
Contents III

CONVERSION FACTORS AND VERTICAL DATUM
Multiply
acreacre
acre-footacre-foot
footfoot per second
inchmile
square milesquare mile
yard
By
4,0470.4047
1,2331,613.333
0.30480.3048
25.41.609
259.02.5900.9144
To obtain
square meterhectarecubic metercubic yardmetermeter per secondmillimeterkilometerhectaresquare kilometermeter
Sea level: In this report, "sea level" refers to the National Geodetic Vertical Datum of 1929 (NGVD of 1929) a geodetic datum derived from a general adjustment of the first-order level nets of both the United States and Canada, formerly called Sea Level Datum of 1929.
IV Contents

Thickness and Volume of Sediment in Pelican Lake, South Dakota, June 1994BySTEVENK. SANDO
ABSTRACT
A survey to determine the amount and distribution of fine-grained Holocene lake sedi ment in Pelican Lake, South Dakota, was made during June 1994. A high-frequency, continuous seismic-reflection system was used to estimate thickness of sediment, and a global-positioning system was used to monitor horizontal and vertical position while traversing 27 northwest-southeast transects and one southwest-northeast transect of the lake. Standard electronic fathometers were used to measure water depth. A geographic infor mation system was then used to generate plots of water depth and lake-sediment thickness, and to calculate lake sediment and water volumes, using point inputs of location, water depth, and sediment thickness. The water-surface elevation of Pelican Lake during the survey was 1,710.6 feet above sea level. The volume of water in Pelican Lake was calculated to be about 19,600 acre-feet, and the average depth was calculated to be 7.0 feet. The volume of lake sediment beneath Pelican Lake was estimated to be 41 million cubic yards. The maximum sediment thickness evident in the seis mic record for the western half of the lake was about 23 feet, and the volume-weighted mean sediment thickness beneath the western half of the lake was about 9 feet.
INTRODUCTION
Pelican Lake is a natural lake with partial artifi cial regulation in Codington County, South Dakota (fig. 1). It serves as an important recreational resource
to numerous adjacent cabin owners as well as to the nearby city of Watertown. Pelican Lake is hyper- eutrophic; in recent years, algal blooms and declining fish populations have limited the recreational opportu nities provided by the lake.
Pelican Lake was listed as a priority water body by the South Dakota Nonpoint Source Task Force for improvement of water quality. As a result, a Lake Assessment Project was initiated in August 1993 to determine the trophic status of the lake and develop specific restoration alternatives (Tony Hagen, Pelican Lake Water Project District, oral commun., 1995). Information about the amount and distribution of lake sediment was required as part of the Lake Assessment Project. Organic-rich sediments often serve as nutrient sources in shallow prairie lake systems (Keeney, 1973; Allan and others, 1980, Kenney, 1985), and restoration alternatives need to address possibilities for dealing with problems associated with sediment accumulation.
The U.S. Geological Survey, in cooperation with the Pelican Lake Water Project District, performed a sediment survey of Pelican Lake during June 1994. The primary objective of the survey was to determine the thickness and volume of fine-grained Holocene lake sediment deposited on top of the glacial drift that formed the original lake bed. A secondary objective of the survey was to determine the depth and volume of water in Pelican Lake. The purpose of this report is to present the results of the sediment survey of Pelican Lake.
Information about the amount and distribution of sediment in Pelican Lake was needed to develop and evaluate lake-management strategies, especially as related to sediment-dredging operations. Most adverse impacts from sedimentation, such as loss of capacity and aquatic life habitat degradation, are due primarily to inputs of fine-grained sediment (defined for this report as silt-sized or smaller sediment particles).
Introduction 1
97°15'
50'45" -
44°50'15" -
U.S. Coast and Geodetic A Survey Disk "Rauville"
U.S. Coast and Geodetic Survey Disk"APStaA2
50'30" -
R.54W.
T. 118N.
T. 117N.
T. 116N.
R. 53 W.
Base from U.S. Geological Survey planimetric map, 1:100,000,1985
GtL^ ENLARGED AREA
R. 52 W.
3 4 MILES
4 KILOMETERS
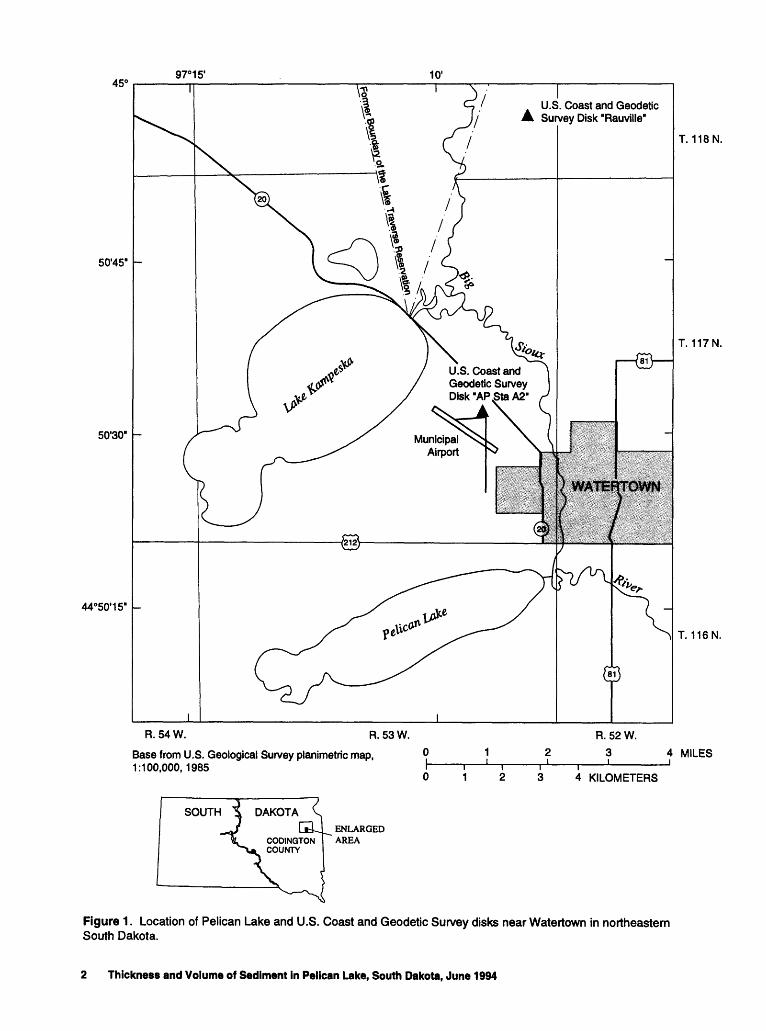
Figure 1 . Location of Pelican Lake and U.S. Coast and Geodetic Survey disks near Watertown in northeastern South Dakota.
2 Thickness and Volume of Sediment in Pelican Lake, South Dakota, June 1994

Thus, the focus of the survey was to determine the amount and distribution of fine-grained sediment in the lake. In the shallow, nearshore areas of the lake, bed materials generally were predominantly coarser grained sediments (defined for this report as sand-sized or larger sediment particles). Although some of this coarser grained material is undoubtedly of Holocene origin, the predominantly coarser grained sediments were not included in the lake-sediment thickness and volume as determined in this survey.
DESCRIPTION OF PELICAN LAKE AREA
Pelican Lake was formed by glacial processes, probably the melting of a remnant ice block, in a zone of glacial stagnation on the boundary between end- moraine till and outwash deposits (Steece, 1957). The composition of bed material of the lake shortly follow ing its formation probably consisted of till with overly ing outwash at some places. Because of the uncertainty concerning the specific formation processes and because of the water covering the sediments, the extent and thickness of outwash in the original lake bed is uncertain. Drill logs of wells located around the mar gin of the lake show variable outwash thicknesses, ranguig from 0 to about 38 feet, and show some loca tions where outwash immediately underlies the soil. Since the formation of Pelican Lake during glacial times, post-glacial sediment of Holocene age has been accumulating in the lake, reducing its original volume.
The natural drainage area of Pelican Lake is 20.4 square miles. The lake receives surface flow from numerous minor ephemeral channels surrounding the lake. Pelican Lake is hydraulically connected to the Big Sioux aquifer (Hansen, 1989); typically the aquifer discharges to the lake and, at times, can contribute sub stantially to the lake. The natural outlet of Pelican Lake consists of a short channel connecting the lake to the Big Sioux River (fig. 1). This channel could also serve as an inlet for water moving from the Big Sioux River into Pelican Lake during periods of high flow in the Big Sioux River. In the 1930's, a low-head control structure on the Big Sioux River and an associated arti ficial channel were constructed to provide partial regu lation of the water level of the lake. The control structure was modified in the 1980's and the current (June 1994) elevation of the top of the control structure is 1,710.2 feet (Ken Madison, South Dakota Depart ment of Environment and Natural Resources, oral com- mun., 1994); the control structure serves to maintain
the minimum elevation of Pelican Lake within about 1 foot of this elevation. During periods of high flow, water from the Big Sioux River is diverted into Pelican Lake through the artificial channel, and this can raise the water-surface elevation of the lake to levels it probably would not reach naturally.
Mean annual precipitation (1961-90) at the Watertown airport, located about 2.5 miles north of Pelican Lake (fig. 1) is 22.23 inches (U.S. Department of Commerce, 1994). Mean annual free-water surface evaporation for the Pelican Lake area is about 41 inches (Farnsworth and others, 1982). Although long-term systematic records of lake stage are not available for Pelican Lake, water-level fluctuations prior to the construction of the control structure probably were large due to variable surface-water inflow and ground-water discharge, and because annual evaporation generally exceeds annual precipita tion. Pelican Lake was known to have been completely dry during the 1930's prior to the construction of the control structure.
METHODS
The general approach for the survey was to traverse 27 approximately evenly spaced northwest- southeast transects and one southwest-northeast longi tudinal transect (fig. 2) by boat while simultaneously and continuously operating: (1) a standard water depth fathometer; (2) a seismic system to determine the thickness of fine-grained sediment; and (3) a global positioning system (GPS) to determine the horizontal position of the seismic and water depth measurements.
Determination of Horizontal Position
While operating the seismic system and fathometer, the horizontal position of the boat was con tinuously monitored using GPS. Accurate GPS posi tioning requires collection and post-processing of data that have been simultaneously transmitted by at least 4 NAVSTAR (NAVigation Satellite Time And Ranging) satellites and recorded by at least 2 receivers. During the survey, one receiver and antenna were located at a U.S. Coast and Geodetic Survey topographic station disk (denoted "AP Sta A2"; fig. 1) of known latitude and longitude, which served as a stationary reference base station. A second receiver was located on the boat with the antenna positioned next to the seismic
Methods
1920 21
23 24 OR 26 27
1617
18.
14
0.5 1 MILES
0 0.5 1 KILOMETERS
EXPLANATIONPLANNED TRANSECTS-Number
indicates transect identification
Base from U.S. Geological Survey 1:24,000, Watertown West, 1969 and Pelican Lake, 1969
Figure 2. Planned locations of transects for sediment survey of Pelican Lake.
transducer and served as a continuously operated rov ing receiver. Data from the two receivers were post- processed using differential-correction techniques to give horizontal positions for the roving receiver. The GPS horizontal positions were tied to the seismic and water-depth records by marking the seismic thermal chart and the fathometer chart about every minute and recording an associated GPS clock time.
The accuracy and precision of the GPS measure ments can be determined by positioning the roving GPS antenna at a standard surveying disk of known lat itude and longitude located an appropriate distance from the base-station disk. However, appropriately located surveying disks of adequate horizontal-posi tion accuracy were not present near Pelican Lake. To determine the accuracy of the horizontal positioning for this survey, the location of a Coast and Geodetic Survey standard disk (denoted "Rauville"; fig. 1) that had been disturbed and removed was estimated based on detailed measurements from reference marks. The estimated location of the disk probably was within 3 feet of the location of the original disk. The accuracy of the GPS measurements was checked by locating the roving receiver and antenna at the estimated location of the Rauville disk for about one minute, generally at the end of each day of data collection.
Comparison of GPS positions determined when occupying the estimated location of the Coast and Geodetic Survey "Rauville" disk with the known coor dinates for that disk indicated an average error of 3.5 feet. The errors ranged from 0.2 to 5.8 feet, with a standard deviation of 1.7 feet.
Determination of Water Depth and Sediment Thickness
A standard electronic strip-chart water-depth fathometer was used to determine water depth. Accuracy of the water-depth record was determined by comparing with a second concurrently-operated digital water depth fathometer and also by comparing with water depth indicated in the seismic record. The eleva tion of the lake water surface at the time of the survey was estimated by periodically measuring the depth of water flowing over the control structure on the Big Sioux River and adding it to the known elevation of the structure. The accuracy of this elevation estimate is probably about plus-or-minus 0.5 foot.
The thickness of fine-grained Holocene lake sed iment was determined using a continuous seismic- reflection system as described in Placzek and Haeni
Thickness and Volume of Sediment in Pelican Lake, South Dakota, June 1994

(1995). Continuous seismic-reflection systems trans mit and receive high-energy acoustic signals through the water column and sub-aqueous sediments (Haeni, 1986). When the signal encounters layers of different acoustical impedance (defined as the product of density of a medium and the velocity of the sound within the medium), part of the signal is reflected back to the sur face seismic receiver and part penetrates farther into the sediment. The strength of the reflection is depen dent on the contrast in acoustic impedance between two adjoining layers. The average velocity of sound in pure water and saturated sediments (approximately 5,000 feet per second; Gorin and Haeni, 1988) was used in determining the thickness of fine-grained sedi ment based on the seismic record. The tuned trans ducer of the seismic system typically was operated at 7 kilohertz during this survey. Trials were run with the transducer operated at 3.5 kilohertz in an attempt to improve the seismic record, but little improvement was achieved, and all sediment thicknesses were deter mined using the 7-kilohertz runs. The transducer was suspended from a boom extending about 3 feet out ward from the starboard gunnel of the boat, submersed about 1 foot below the water surface, and towed along side. The reflection signal from the seismic transducer
was recorded on a thermal chart recorder and a digital audio tape recorder. The digital audio tape recorder was used to play back the seismic signal for fine-tuning and interpretation during data analysis, but nearly all sediment-thickness determinations were made from the chart recorder output produced in the field. To ver ify interpretation of the seismic record, manual probing and coring were performed sporadically while the seis mic record, the fathometer record, and the GPS loca tion record were being collected.
Comparison of the strip-chart fathometer record with the simultaneously operated digital fathometer generally indicated agreement within 0.3 foot for the water-depth measurement. Locations where water- depth records were collected are shown in figure 3. Locations where sediment thickness was determined using the seismic system are shown in figure 4.
In parts of the lake where the seismic system was not effective, the thickness of fine-grained lake sedi ment was determined by manual probing. About every 400 feet along the transects, the boat was anchored and a 1/2-inch-diameter steel rod was thrust into the sedi ment as far as possible, and the depth of penetration was measured.
1920 21 22 23 24
1415
13
Base from U.S. Geological Survey 1:24,000, Watertown West, 1969 and Pelican Lake, 1969
1 MILES
1 KILOMETERS
EXPLANATIONPLANNED TRANSECTS-Number
indicates transect identification
LOCATION WHERE WATER-DEPTH RECORD WAS COLLECTED
Figure 3. Planned locations of transects and actual locations where water-depth records were collected.
Methods

1920 21 22 23
1415
1617
18
13
MILES
Base from U.S. Geological Survey 1:24,000, Watertown West, 1969 and Pelican Lake, 1969
1 KILOMETERS
EXPLANATIONPLANNED TRANSECTS-Number
indicates transect identification
LOCATION WHERE PROBING-DEPTH RECORD WAS COLLECTED
LOCATION WHERE SEDIMENT- THICKNESS RECORD WAS COLLECTED USING SEISMIC REFLECTION
Figure 4. Planned locations of transects and actual locations where seismic records of sediment thickness and probing- depth records were collected.
Data Interpretation and Analysis
Data collected in the field, including water depth, sediment thickness, and horizontal position, were loaded into the ARC/INFO Geographical Information System (GIS) on the U.S. Geological Survey Data General computer in Huron, South Dakota, to produce lines of equal water depth and fine-grained lake- sediment thickness in Pelican Lake. A kriging proce dure using a spherical function was used to produce lattices of the data. Lines of equal value were first con structed from the lattices, and then manually modified in locations where the constructed lines did not accu rately represent the original measured data. The mean area between adjacent lines was calculated on the GIS, and was multiplied by the water-depth interval or sedi ment-thickness interval between the adjacent lines to calculate the volume of water or sediment within each interval (Blanton, 1982). Total volumes of water or sediment for Pelican Lake were then calculated by summing the volumes within each interval. Cross- sectional profiles for selected transects were con structed from the plots and then modified to show greater detail in some sections by incorporating lake- sediment thickness values taken directly from the original seismic record.
VERIFICATION AND EFFECTIVENESS OF SEISMIC SYSTEM
There were distinct changes in the seismic record where qualitative changes in the surficial composition of the bed material could be felt by manual probing with steel rods and PVC pipes. Typically, a change in intensity and/or pattern in the seismic record was asso ciated with a change in composition of the bed material. An example of the seismic record and its cor responding interpreted profile are shown in figure 5 to illustrate how differences in bed composition are repre sented in the seismic record. It is evident from figure 5 that the top of the sediment is barely visible in the seismic record at some locations. This is because the settings of the seismic system were adjusted to provide optimum discernment of sub-sediment surface reflec tors. In some locations where the surficial sediments were very soft and porous, the reflector off the top of the sediment appeared very light in the seismic record.
Manual coring was performed using a piston- type coring unit in an effort to verify the interpretation of the seismic record. Although the coring unit is designed to allow extraction of sequential cores from a single hole and thus permit relatively deep penetration, the resistance of the sediments generally did not allow penetration of more than 4 or 5 feet below the
Thickness and Volume of Sediment in Pelican Lake, South Dakota, June 1994

10
15
20
25
30
^.o. ---^ V; "5 «T" i;tr rWinterference produced ' -V?- - ,7, ^^^ftffi'&'g??1. interference produced /_t|ii|^ ;';-T '£i^!|prby mu|tjPle signals " £ ,' ; ;: '< [ ^": '.£& :^5;^ by multiple signals \|
' '."'' '* ' r*i~"1 * «.'**" » ' "-"«,' ' *«ii v 'j-''"'PC-'>- x' ' *-?'" -' "- '". '.'.-':̂ ff*T\r,, " '
\ '.-" ';' ii"^^^. positioning marks, ^f^J, ~"
LULU 5n »J
DC
CO
£ 15
5o 20
30
top of sediment
layered lake sediment or glacial outwash
glacial drift
Pelican Lake
LOCATION OF SEISMIC RECORD PROFILE
Figure 5. Example seismic record and corresponding interpreted profile.
Verification and Effectiveness of Seismic System 7

sediment-water interface. Thus, the coring was of little value in verifying the seismic record that typically showed the lake sediment/glacial drift interface to be about 10 feet or more below the top of the sediment.
A strong, undulating sub-sediment reflector was apparent beneath much of the western part of the lake and was interpreted to be the interface between the fine-grained lake sediment and underlying glacial drift. At some locations, several reflectors below the top of the sediment were apparent in the seismic record (fig. 5). These reflectors could represent: (1) layers of coarser grained lake sediment; (2) compacted layers that resulted from drying and oxidizing of the sediment during periods when the lake was dewatered; or (3) layers within the glacial drift (for example, layers of outwash on top of glacial till). Where more than one reflector was present below the top of the sediment, the deepest strong reflector was assumed to be the top of the glacial till, and the depth from the top of the sedi ment to the deepest reflector was used to estimate the lake-sediment thickness. This procedural choice has the effect of possibly including any glacial outwash or coarse-grained lake sediment together with the over lying fine-grained lake sediment in subsequent sediment-thickness estimates at locations where the geologic composition of the material producing the reflectors in the seismic record was uncertain. The seismic system produced easily interpretable records for about 65 percent of the western half of the lake.
The seismic system was not everywhere effec tive in distinguishing the interface between fine grained lake sediment and glacial drift, especially in the eastern half of Pelican Lake. Deeper reflectors were not always apparent in the seismic record because, at places, they were obscured by an interfer ence near the top of the sediment. An example of seismic record with associated interpreted profile that shows such an interference is presented in figure 6. Efforts were made during the survey to reduce the interference in the seismic record by adjusting the transducer frequency, transmitter power, and chart and receiver gains, but these procedures were ineffective. The ineffectiveness of the seismic system in some areas probably was due to the presence of gas from the decomposition of organic material in the sediments. Accumulated gas within the sediments can act as a strong scatterer or reflector of the acoustic energy and result in interference patterns (typically multiple signals 1 ) that obscure deeper reflectors in the seismic record. Observations of gas bubbles released from the
sediments during probing indicated that gas tended to be more prevalent in the sediments in the eastern half of the lake. Locations where sediment thickness was estimated using manual probing are shown in figure 4.
WATER DEPTH AND SEDIMENT THICKNESS
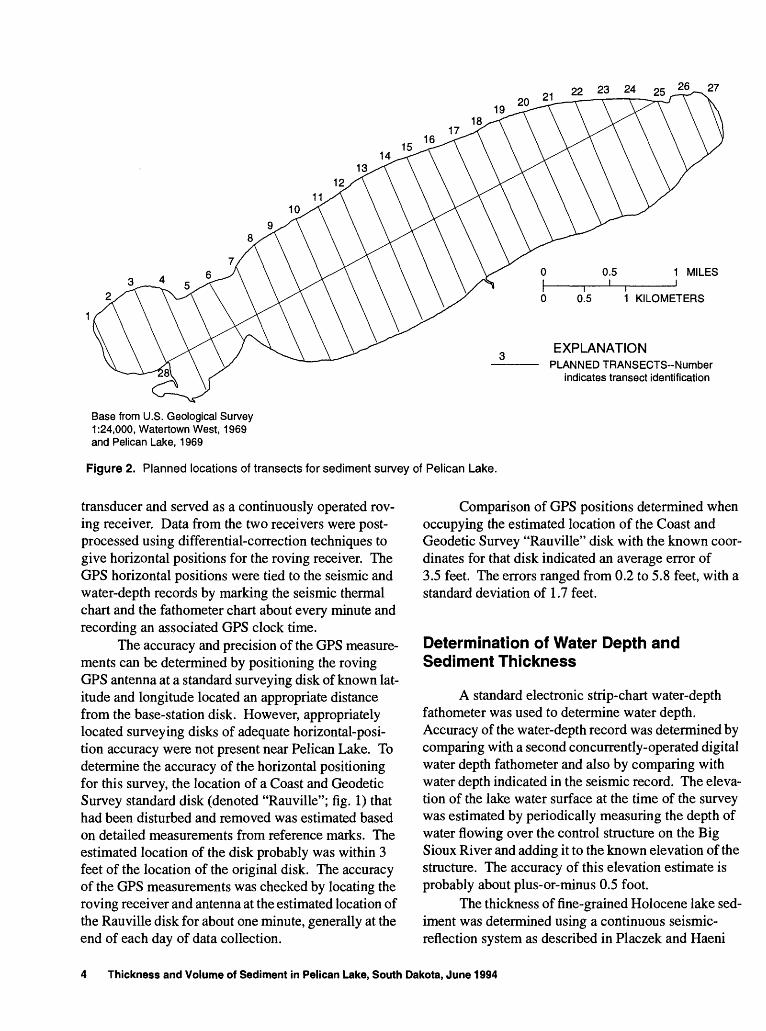
Water depth in Pelican Lake is presented in figure 7. Elevation/area/capacity data are presented in table 1. The mean water surface elevation of Pelican Lake was about 1,710.6 feet above sea level during the survey. The volume of water in Pelican Lake at the time of the survey was calculated to be about 19,600 acre-feet, and the surface area was 2,809 acres. The maximum water depth was 8.8 feet, and the average water depth was 7.0 feet.
Thickness of fine-grained lake sediment in the bed of the western half of Pelican Lake is presented in figure 8. In the western half of Pelican Lake, the max imum fine-grained lake-sediment thickness evident from the seismic record was about 23 feet, and the volume-weighted mean sediment thickness was about 9 feet.
Penetration depths for manual probing in the eastern half of Pelican Lake are shown in figure 9. Manual probing was not very effective because the lake sediments typically were sufficiently compacted about 1 foot below their top so that they resisted penetration. Also, instability of the boat, even when anchored, made it difficult to force the steel rod directly downward into the sediment. As a result, the probing penetration depth generally does not represent the total thickness of fine-grained lake sediment on top of the glacial drift. While probing in some locations, a distinct coarser grained layer that generally could not be penetrated more than about 1 foot was detected below the fine grained material at the top of the sediment. Whether this coarser grained material was coarser lake sediment or glacial outwash is unknown. Points where coarser grained material was encountered below the fine grained surficial material are indicated with an asterisk (*) in figure 9. Because probing penetration probably
Multiple signals can occur in the seismic record when the acoustic signal encounters a specific layer that reflects or scatters nearly all of the signal and allows little penetration. The signal repeatedly reflects back and forth between the specific layer and the water surface producing equally spaced bands in the seismic record.
8 Thickness and Volume of Sediment in Pelican Lake, South Dakota, June 1994

$3
30
UJ
DC
CC HC111 ID
20
UJ CO
30
top of sediment
fine-grained lake sediment
glacial drift
Pelican Lake
LOCATION OF SEISMIC RECORD PROFILE
Figure 6. Example seismic record and corresponding interpreted profile showing interference in sub-sediment record.
Water Depth and Sediment Thickness 9
1 MILES
1 KILOMETERS
EXPLANATION e LINE OF EQUAL WATER DEPTH-
Interval, 2 feet
Base from U.S. Geological Survey 1:24,000, Watertown West, 1969 and Pelican Lake, 1969
Figure 7. Water depth in Pelican Lake, June 1994 (water-surface elevation 1,710.6 feet above sea level).
Table 1 . Elevation/area/capacity information for Pelican Lake
Elevation (feet above sea level)
1,710.61,710.51,710.01,709.51,709.01,708.51,708.01,707.51,707.01,706.51,706.01,705.51,705.01,704.51,704.01,703.51,703.01,702.51,702.01,701.8
Depth below water surface at time of survey
(feet)0.00.10.61.11.62.12.63.13.64.14.65.15.66.16.67.17.68.18.68.8
Lake surface area (acres)
2,8092,8062,7922,7772,7632,7432,7242,7012,6782,6072,5352,4312,3272,0391,9771,7301,386
847242
0
Lake capacity (acre-feet)
19,59619,31517,91516,52315,13813,76212,39511,0399,6948,3727,0875,8454,6563,5642,5601,634
855296
240
10 Thickness and Volume of Sediment in Pelican Lake, South Dakota, June 1994

1 MILES
1 KILOMETERS
15
Base from U.S. Geological Survey 1:24,000, Watertown West, 1969 and Pelican Lake, 1969
EXPLANATIONAREA WHERE THE SEISMIC SYSTEM WAS
LARGELY INEFFECTIVE IN DISTINGUISHING THE INTERFACE BETWEEN LAKE SEDIMENT AND GLACIAL DRIFT
LINE OF EQUAL SEDIMENT THICKNESS- Interval, 2.5 feet
Figure 8. Thickness of sediment in Pelican Lake, June 1994.
Water Depth and Sediment Thickness 11

0.5
0.5
1 MILES______I
1 KILOMETERS
Base from U.S. Geological Survey 1:24,000, Watertown West, 1969 and Pelican Lake, 1969
2.5EXPLANATION
LOCATION OF MANUAL PROBING AND PENETRATION-Number indicates depth of penetration, in feet. Asterisk (*) indicates location where distinct layer of coarser grained material was encountered below fine-grained material.
Figure 9. Locations and depth of penetration where manual probing was performed.
12 Thickness and Volume of Sediment in Pelican Lake, South Dakota, June 1994

did not accurately measure the fine-grained lake sedi ment thickness, the probing measurements were not used in calculating the total lake sediment volume. Instead, the volume of fine-grained lake sediment beneath the eastern half of Pelican Lake was extrapo lated on the basis of area using the volume-weighted mean sediment thickness determined from the western half of the lake using the seismic record. The total
volume of fine-grained lake sediment in the lake was, thus, estimated to be about 41 million cubic yards. The lateral distribution of coarser material (that is, material containing substantial amounts of sand and/or gravel) versus fine-grained material occurring at the upper surface of the lake sediments is presented in figure 10. Interpreted cross-sectional profiles for selected transects are presented in figure 11.
1 MILES
1 KILOMETERS
Base from U.S. Geological Survey 1:24,000, Watertown West, 1969 and Pelican Lake, 1969
EXPLANATIONFINE-GRAINED SURFICIAL SEDIMENT
COARSER GRAINED SURFICIAL SEDIMENT
Figure 10. Distribution of coarser grained and fine-grained surficial sediment in Pelican Lake.
Water Depth and Sediment Thickness 13

500 1,000 1,500 2,000
DISTANCE FROM NORTHWEST SHORELINE, IN FEET2,500 3,000
Figure 11. Interpreted cross-sectional profiles for selected transects across Pelican Lake, June 1994.
14 Thickness and Volume of Sediment in Pelican Lake, South Dakota, June 1994

D'
10
LLIIII 15
g 20
£ DC5 25tt 0IS £ I °
gLU CD
LU Q
20
1 ''''' x ' ^water surface
top of sediment
lake sediment
glacial drift
500 1,000 1,500 2,000 2,500 3,000 3,500 4,000 4,500 5,000 5,500 6,000£'
301,000 2,000 3,000 4,000 5,000
DISTANCE FROM NORTHWEST SHORELINE, IN FEET6,000 7,000
Pelican Lake
LOCATIONS OF INTERPRETED CROSS-SECTIONAL PROFILES-Number indicates transect identification
D-
Figure 11. Interpreted cross-sectional profiles for selected transects across Pelican Lake, June 1994.--Continued
Water Depth and Sediment Thickness 15

SUMMARY REFERENCES
A survey to determine the amount and distribu tion of fine-grained lake sediment in Pelican Lake, South Dakota, was made during June 1994. A high- frequency, continuous seismic-reflection system and manual probing were used to estimate thickness of sediment, and a global positioning system was used to monitor horizontal and vertical position while traversing 27 northwest-southeast transects and one southwest-northeast longitudinal transect of the lake. The seismic system was not everywhere effective in distinguishing the interface between fine-grained lake sediment and underlying glacial drift, especially in the eastern half of Pelican Lake. The ineffectiveness of the seismic system in some areas probably was due to the presence of gas from the decomposition of organic material in the sediments. Standard electronic fathometers were used to measure water depth.
A geographic information system was then used to generate plots of water depth and fine-grained Holocene lake-sediment thickness, and to calculate the sediment and water volumes using point inputs of loca tion, water depth, and sediment thickness. The water- surface elevation of Pelican Lake during the survey was 1,710.6 feet above sea level. The volume of water in Pelican Lake was calculated as about 19,600 acre- feet, and the average depth was 7.0 feet. The volume of lake sediment in Pelican Lake was estimated to be 41 million cubic yards. The maximum sediment thick ness evident in the seismic record beneath the western half of the lake was about 23 feet, and the volume- weighted sediment thickness in the western half of the lake was about 9 feet.
Allan, R.J., Williams, J.S., Joshi, S.R., and Warwick, W.F., 1980, Historical changes and relationship to internal loading of sediment phosphorus forms in hypertrophic prairie lakes: Journal of Environmental Quality, v. 9, p. 199-206.
Blanton, J.O., III, 1982, Procedures for monitoring reservoir sedimentation: Denver, Technical Guideline for Bureau of Reclamation, 40 p.
Farnsworth, R.K., Thompson, E.S., and Peck, E.L., 1982, Evaporation atlas for the contiguous 48 United States: National Oceanic and Atmospheric Administration Technical Report NWS 33, 26 p.
Gorin, S.R., and Haeni, P.P., 1988, Use of surface-geophysi cal methods to assess riverbed scour at bridge piers: U.S. Geological Survey Water-Resources Investiga tions Report 88-4212, 33 p.
Haeni, P.P., 1986, Application of continuous seismic reflec tion methods to hydrologic studies: Ground Water, v. 24, no. 1, p. 23-31.
Hansen, D.S., 1989, Water resources of Codington and Grant Counties, South Dakota: U.S. Geological Survey Water-Resources Investigations Report 89-4147, 47 p.
Keeney, D.R., 1973, The nitrogen cycle in sediment-water systems: Journal of Environmental Quality, v. 2, p. 15- 29.
Kenney, B.C., 1985, Sediment resuspension and currents in Lake Manitoba: Journal of Great Lakes Research, v. 11, no. 2, p. 85-86.
Placzek, Gary, and Haeni, P.P., 1995, Surface-geophysical techniques used to detect existing and infilled scour holes near bridge piers: U.S. Geological Survey Water- Resources Investigations Report 95-4009, 44 p.
Steece, F.V., 1957, Geologic map of the Watertown area, South Dakota: South Dakota Geological Survey Geologic Quadrangle Map, scale 1:62,500.
U.S. Department of Commerce, National Oceanic and Atmospheric Administration, Environmental Data Service, 1994, Climatological data, South Dakota, annual summary 1993: Asheville, N.C., v. 95, no. 13.
16 Thickness and Volume of Sediment in Pelican Lake, South Dakota, June 1994