thetransverse and longitudinal beam … transverse and longitudinal beam characteristics of the phin...
TRANSCRIPT
THE TRANSVERSE AND LONGITUDINAL BEAM CHARACTERISTICSOF THE PHIN PHOTO-INJECTOR AT CERN
O. Mete, CERN, Geneva and EPFL, Lausanne,E. Chevallay, A. Dabrowski, S. Doebert, K. Elsener, V. Fedosseev, T. Lefèvre, M. Petrarca,
CERN, Geneva, SwitzerlandD. Egger, EPFL, Lausanne, R. Roux, LAL, Orsay, France
Abstract
The laser driven RF photo-injectors are recent candidatesfor high-brightness, low-emittance electron sources. Oneof the main beam dynamics issues for a high brightnesselectron source is the optimization of beam envelope be-havior in the presence of the space charge force in orderto get low emittance. Within the framework of the secondJoint Research Activity PHIN of the European CARE pro-gram, a new photo-injector for CTF3 has been designedand installed by collaboration between LAL, CCLRC andCERN. Beam based measurements have been made dur-ing the commissioning runs of the PHIN 2008 and 2009including measurements of the emittance, using multi-slittechnique. The demonstration of the high charge and thestability along the long pulse train are between the goalsof this photo-injector study as also being important issuesfor CTF3 and the CLIC drive beam. In this work thephoto-injector will be described and the first beam mea-surement results will be presented and compared with thePARMELA simulations.
INTRODUCTION
A photo-injector was proposed as a new electron sourcefor CTF3 (CLIC Test Facility 3) and later for the CLIC(Compact Linear Collider) drive beam [1, 2]. After the in-stallation of the PHIN photo-injector at CERN, the longi-tudinal and the transverse properties of the commission-ing beam have been measured in a range of parameters. Inlaser-driven RF photo-injectors the transverse phase spacedynamics are influenced by several issues like time depen-dency of the RF field, space charge effects and transversefocusing. The adjustment of the laser properties such asspot size, radial and temporal distribution can effectivelybe used to control the properties of the beam in both di-rections. During the high charge operation at low energies,the space charge force is the dominating effect for emit-tance growth. The space charge effect can be compensatedwith the field created by a focusing magnet. The laser spotsize dependence of the transverse size and emittance of thebeam has been investigated for the laser spot sizes of 2 mm,3 mm and 4 mm. The transverse emittance was measuredwith the multi-slit method in a range of focusing magnetcurrent to study the emittance compensation. This methodis applicable to the low energy, space charge dominatedbeams [3, 4].
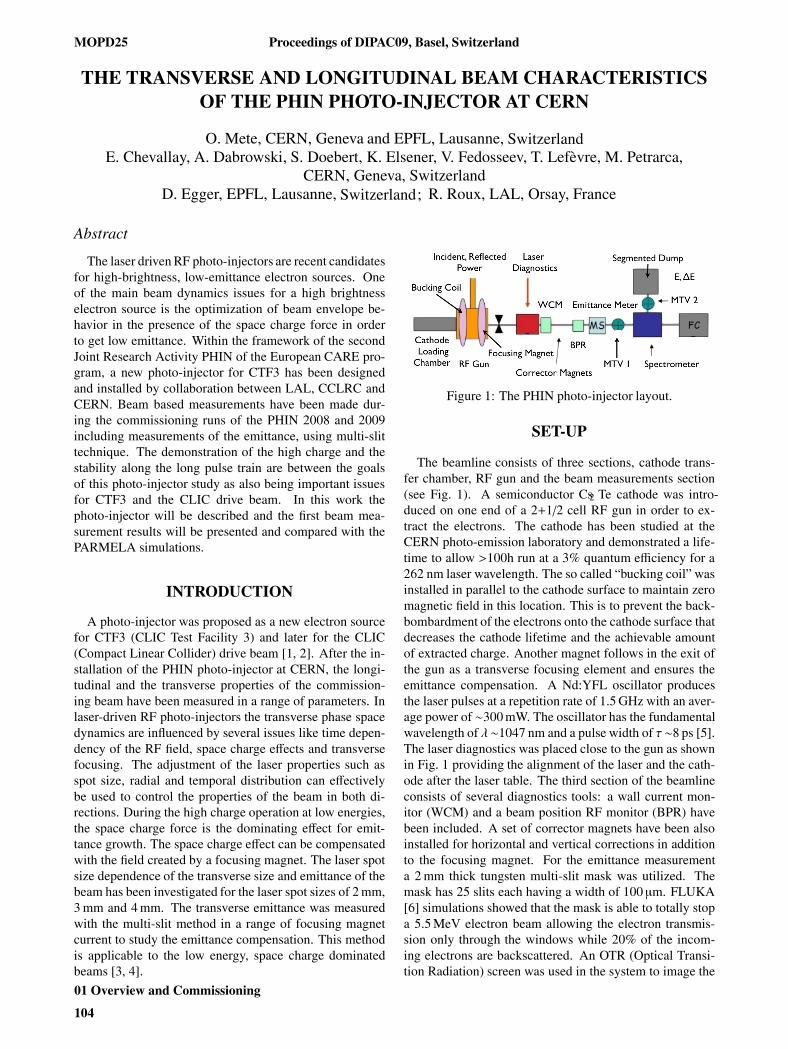
Figure 1: The PHIN photo-injector layout.
SET-UP
The beamline consists of three sections, cathode trans-fer chamber, RF gun and the beam measurements section(see Fig 1). A semiconductor Cs2 Te cathode was intro-duced on one end of a 2+1/2 cell RF gun in order to ex-tract the electrons. The cathode has been studied at theCERN photo-emission laboratory and demonstrated a life-time to allow >100h run at a 3% quantum efficiency for a262 nm laser wavelength. The so called “bucking coil” wasinstalled in parallel to the cathode surface to maintain zeromagnetic field in this location. This is to prevent the back-bombardment of the electrons onto the cathode surface thatdecreases the cathode lifetime and the achievable amountof extracted charge. Another magnet follows in the exit ofthe gun as a transverse focusing element and ensures theemittance compensation. A Nd:YFL oscillator producesthe laser pulses at a repetition rate of 1.5 GHz with an aver-age power of ∼300 mW. The oscillator has the fundamentalwavelength of λ∼1047 nm and a pulse width of τ∼8 ps [5].The laser diagnostics was placed close to the gun as shownin Fig. 1 providing the alignment of the laser and the cath-ode after the laser table. The third section of the beamlineconsists of several diagnostics tools: a wall current mon-itor (WCM) and a beam position RF monitor (BPR) havebeen included. A set of corrector magnets have been alsoinstalled for horizontal and vertical corrections in additionto the focusing magnet. For the emittance measurementa 2 mm thick tungsten multi-slit mask was utilized. Themask has 25 slits each having a width of 100 µm. FLUKA[6] simulations showed that the mask is able to totally stopa 5.5 MeV electron beam allowing the electron transmis-sion only through the windows while 20% of the incom-ing electrons are backscattered. An OTR (Optical Transi-tion Radiation) screen was used in the system to image the
Switzerland
Switzerland
;
.
MOPD25 Proceedings of DIPAC09, Basel, Switzerland
01 Overview and Commissioning
104
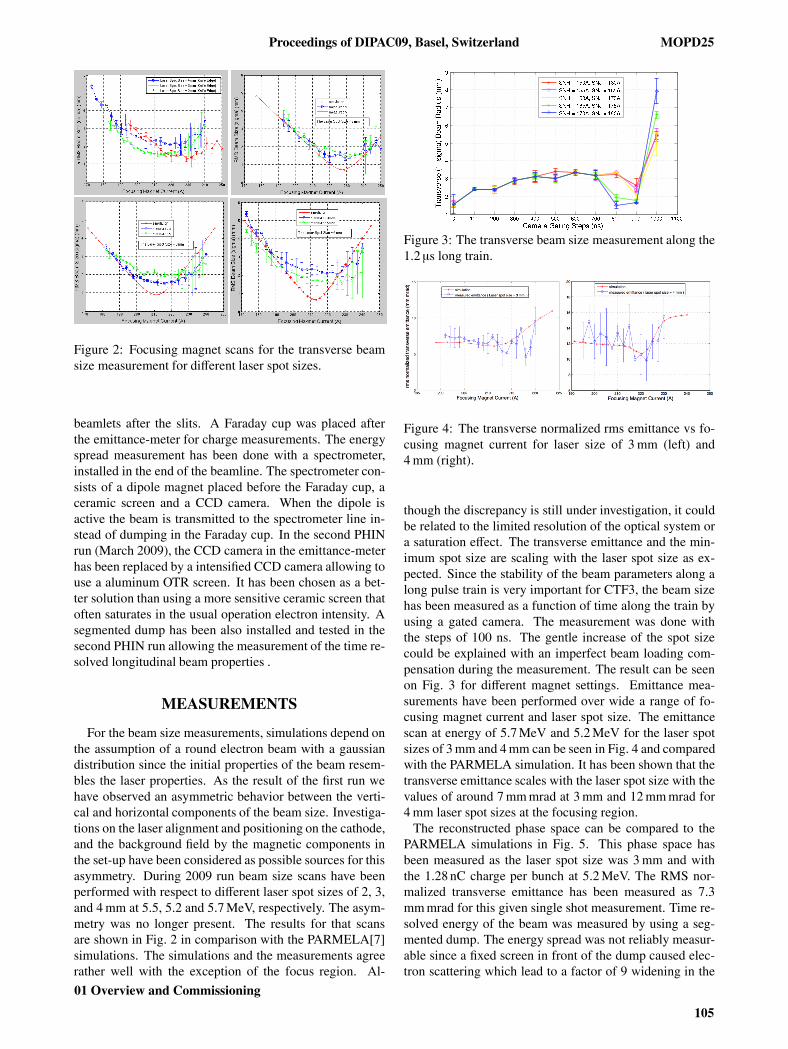
Figure 2: Focusing magnet scans for the transverse beamsize measurement for different laser spot sizes.
beamlets after the slits. A Faraday cup was placed afterthe emittance-meter for charge measurements. The energyspread measurement has been done with a spectrometer,installed in the end of the beamline. The spectrometer con-sists of a dipole magnet placed before the Faraday cup, aceramic screen and a CCD camera. When the dipole isactive the beam is transmitted to the spectrometer line in-stead of dumping in the Faraday cup. In the second PHINrun (March 2009), the CCD camera in the emittance-meterhas been replaced by a intensified CCD camera allowing touse a aluminum OTR screen. It has been chosen as a bet-ter solution than using a more sensitive ceramic screen thatoften saturates in the usual operation electron intensity. Asegmented dump has been also installed and tested in thesecond PHIN run allowing the measurement of the time re-solved longitudinal beam properties .
MEASUREMENTS
For the beam size measurements, simulations depend onthe assumption of a round electron beam with a gaussiandistribution since the initial properties of the beam resem-bles the laser properties. As the result of the first run wehave observed an asymmetric behavior between the verti-cal and horizontal components of the beam size. Investiga-tions on the laser alignment and positioning on the cathode,and the background field by the magnetic components inthe set-up have been considered as possible sources for thisasymmetry. During 2009 run beam size scans have beenperformed with respect to different laser spot sizes of 2, 3,and 4 mm at 5.5, 5.2 and 5.7 MeV, respectively. The asym-metry was no longer present. The results for that scansare shown in Fig. 2 in comparison with the PARMELA[7]simulations. The simulations and the measurements agreerather well with the exception of the focus region. Al-
Figure 3: The transverse beam size measurement along the1.2 µs long train.
Figure 4: The transverse normalized rms emittance vs fo-cusing magnet current for laser size of 3 mm (left) and4 mm (right).
though the discrepancy is still under investigation, it couldbe related to the limited resolution of the optical system ora saturation effect. The transverse emittance and the min-imum spot size are scaling with the laser spot size as ex-pected. Since the stability of the beam parameters along along pulse train is very important for CTF3, the beam sizehas been measured as a function of time along the train byusing a gated camera. The measurement was done withthe steps of 100 ns. The gentle increase of the spot sizecould be explained with an imperfect beam loading com-pensation during the measurement. The result can be seenon Fig. 3 for different magnet settings. Emittance mea-surements have been performed over wide a range of fo-cusing magnet current and laser spot size. The emittancescan at energy of 5.7 MeV and 5.2 MeV for the laser spotsizes of 3 mm and 4 mm can be seen in Fig. 4 and comparedwith the PARMELA simulation. It has been shown that thetransverse emittance scales with the laser spot size with thevalues of around 7 mm mrad at 3 mm and 12 mm mrad for4 mm laser spot sizes at the focusing region.
The reconstructed phase space can be compared to thePARMELA simulations in Fig. 5. This phase space hasbeen measured as the laser spot size was 3 mm and withthe 1.28 nC charge per bunch at 5.2 MeV. The RMS nor-malized transverse emittance has been measured as 7.3mm mrad for this given single shot measurement. Time re-solved energy of the beam was measured by using a seg-mented dump. The energy spread was not reliably measur-able since a fixed screen in front of the dump caused elec-tron scattering which lead to a factor of 9 widening in the
Proceedings of DIPAC09, Basel, Switzerland MOPD25
01 Overview and Commissioning
105
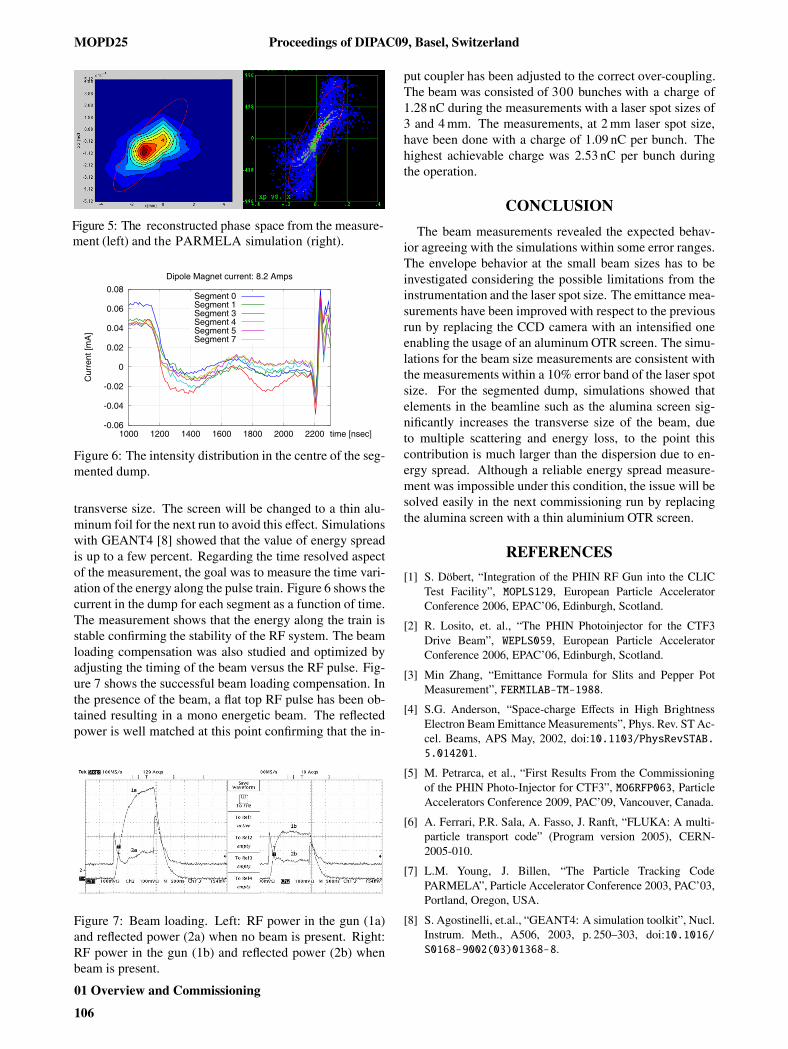
Figure 5: The reconstructed phase space from the measure
-0.06
-0.04
-0.02
0
0.02
0.04
0.06
0.08
1000 1200 1400 1600 1800 2000 2200
Cur
rent
[mA
]
time [nsec]
Dipole Magnet current: 8.2 Amps
Segment 0Segment 1Segment 3Segment 4Segment 5Segment 7
Figure 6: The intensity distribution in the centre of the seg-mented dump.
transverse size. The screen will be changed to a thin alu-minum foil for the next run to avoid this effect. Simulationswith GEANT4 [8] showed that the value of energy spreadis up to a few percent. Regarding the time resolved aspectof the measurement, the goal was to measure the time vari-ation of the energy along the pulse train. Figure 6 shows thecurrent in the dump for each segment as a function of time.The measurement shows that the energy along the train isstable confirming the stability of the RF system. The beamloading compensation was also studied and optimized byadjusting the timing of the beam versus the RF pulse. Fig-ure 7 shows the successful beam loading compensation. Inthe presence of the beam, a flat top RF pulse has been ob-tained resulting in a mono energetic beam. The reflectedpower is well matched at this point confirming that the in-
Figure 7: Beam loading. Left: RF power in the gun (1a)and reflected power (2a) when no beam is present. Right:RF power in the gun (1b) and reflected power (2b) whenbeam is present.
put coupler has been adjusted to the correct over-coupling.The beam was consisted of 300 bunches with a charge of1.28 nC during the measurements with a laser spot sizes of3 and 4 mm. The measurements, at 2 mm laser spot size,have been done with a charge of 1.09 nC per bunch. Thehighest achievable charge was 2.53 nC per bunch duringthe operation.
CONCLUSION
The beam measurements revealed the expected behav-ior agreeing with the simulations within some error ranges.The envelope behavior at the small beam sizes has to beinvestigated considering the possible limitations from theinstrumentation and the laser spot size. The emittance mea-surements have been improved with respect to the previousrun by replacing the CCD camera with an intensified oneenabling the usage of an aluminum OTR screen. The simu-lations for the beam size measurements are consistent withthe measurements within a 10% error band of the laser spotsize. For the segmented dump, simulations showed thatelements in the beamline such as the alumina screen sig-nificantly increases the transverse size of the beam, dueto multiple scattering and energy loss, to the point thiscontribution is much larger than the dispersion due to en-ergy spread. Although a reliable energy spread measure-ment was impossible under this condition, the issue will besolved easily in the next commissioning run by replacingthe alumina screen with a thin aluminium OTR screen.
REFERENCES
[1] S. Döbert, “Integration of the PHIN RF Gun into the CLICTest Facility”, MOPLS129, European Particle AcceleratorConference 2006, EPAC’06, Edinburgh, Scotland.
[2] R. Losito, et. al., “The PHIN Photoinjector for the CTF3Drive Beam”, WEPLS059, European Particle AcceleratorConference 2006, EPAC’06, Edinburgh, Scotland.
[3] Min Zhang, “Emittance Formula for Slits and Pepper PotMeasurement”, FERMILAB-TM-1988.
[4] S.G. Anderson, “Space-charge Effects in High BrightnessElectron Beam Emittance Measurements”, Phys. Rev. ST Ac-cel. Beams, APS May, 2002, doi:10.1103/PhysRevSTAB.5.014201.
[5] M. Petrarca, et al., “First Results From the Commissioningof the PHIN Photo-Injector for CTF3”, MO6RFP063, ParticleAccelerators Conference 2009, PAC’09, Vancouver, Canada.
[6] A. Ferrari, P.R. Sala, A. Fasso, J. Ranft, “FLUKA: A multi-particle transport code” (Program version 2005), CERN-2005-010.
[7] L.M. Young, J. Billen, “The Particle Tracking CodePARMELA”, Particle Accelerator Conference 2003, PAC’03,Portland, Oregon, USA.
[8] S. Agostinelli, et.al., “GEANT4: A simulation toolkit”, Nucl.Instrum. Meth., A506, 2003, p. 250–303, doi:10.1016/S0168-9002(03)01368-8.
-ment (left) and the PARMELA simulation (right).
MOPD25 Proceedings of DIPAC09, Basel, Switzerland
01 Overview and Commissioning
106