theta phase segregation of input-specific gamma patterns
TRANSCRIPT

Neuron
Article
Theta Phase Segregationof Input-Specific Gamma Patternsin Entorhinal-Hippocampal NetworksErik W. Schomburg,1,2,6 Antonio Fernandez-Ruiz,1,3,6 Kenji Mizuseki,1,4 Antal Berenyi,1,5 Costas A. Anastassiou,2,4
Christof Koch,2,4 and Gyorgy Buzsaki1,*1New York University Neuroscience Institute and Center for Neural Science, New York University, New York, NY 10016, USA2Department of Physics and Division of Biology, California Institute of Technology, Pasadena, CA 91125, USA3School of Physics, Complutense University of Madrid, 28040 Madrid, Spain4Allen Institute for Brain Science, Seattle, WA 98103, USA5MTA-SZTE ‘‘Momentum’’ Oscillatory Neuronal Networks Research Group, Department of Physiology, University of Szeged, Szeged 6720,
Hungary6Co-first author
*Correspondence: [email protected]
http://dx.doi.org/10.1016/j.neuron.2014.08.051
SUMMARY
Precisely how rhythms support neuronal commu-nication remains obscure. We investigated interre-gional coordination of gamma oscillations usinghigh-density electrophysiological recordings in therat hippocampus and entorhinal cortex. We foundthat 30–80 Hz gamma dominated CA1 local field po-tentials (LFPs) on the descending phase of CA1 thetawaves during navigation, with 60–120 Hz gamma atthe theta peak. These signals corresponded to CA3and entorhinal input, respectively. Above 50 Hz,interregional phase-synchronization of principal cellspikes occurred mostly for LFPs in the axonal targetdomain. CA1 pyramidal cells were phase-lockedmainly to fast gamma (>100 Hz) LFP patternsrestricted to CA1, which were strongest at the thetatrough. While theta phase coordination of spikingacross entorhinal-hippocampal regions dependedon memory demands, LFP gamma patterns below100 Hz in the hippocampus were consistently layerspecific and largely reflected afferent activity.Gamma synchronization as a mechanism for interre-gional communication thus rapidly loses efficacy athigher frequencies.
INTRODUCTION
The hippocampal-entorhinal system is characterized by a num-
ber of distinct oscillations, including the prominent theta and
gamma rhythms (Buzsaki et al., 1983; Bragin et al., 1995; Csics-
vari et al., 2003; Colgin et al., 2009; Tort et al., 2009; Canolty and
Knight, 2010; Fell and Axmacher, 2011; Buzsaki and Wang,
2012; Belluscio et al., 2012; Lisman and Jensen, 2013; Cabral
et al., 2014; Bieri et al., 2014; Igarashi et al., 2014; Yamamoto
et al., 2014). An important goal of such investigations is to under-
stand how the rate and timing of spikes in neurons of a down-
470 Neuron 84, 470–485, October 22, 2014 ª2014 Elsevier Inc.
stream network are governed by upstream regions and local
interactions and how such interactions support spatial naviga-
tion and memory (O’Keefe and Recce, 1993; Hasselmo et al.,
2002; Montgomery and Buzsaki, 2007; Mizuseki et al., 2009;
Bieri et al., 2014). The local field potential (LFP) can be helpful
in this process, provided that its components can be related to
individual synaptic sources and the output spiking of specific
neuronal populations (Buzsaki et al., 2012; Fernandez-Ruiz and
Herreras, 2013).
Area CA1 in the hippocampus is under the control of two major
upstream regions: area CA3 and the direct entorhinal input from
layer 3 (EC3; Witter et al., 1989; Amaral and Witter, 1989). The
layer-segregated axon terminals of these inputs mediate both
dendritic excitation and feedforward inhibition (Buzsaki, 1984).
To determine the theta-gamma timing relationships between
the entorhinal and CA3 inputs to the CA1 region, and their impact
on the CA1 output, we used high-density extracellular recordings,
combined with source separation techniques and unbiased
spike-LFP coherence methods, while rats performed different
maze tasks and slept in their home cages. We report that CA1
gamma-bandLFPpatterns and the spike timing of pyramidal cells
and interneurons within the theta cycle depended on the relative
strengths of the CA3 and EC3 inputs and associated gamma pat-
terns in their target dendritic layers. EC3 input was strongest at
the peak of the theta cycle, referenced to the LFP in CA1 stratum
pyramidale, and was reflected by a mid-frequency (60–120 Hz)
gamma oscillation in the LFP, followed one quarter cycle later
by the CA3 input on the descending phase in the form of a tran-
sient 30–80 Hz gamma pattern. The relative strength of these
signals was strongly influenced by brain state and behavior.
Rhythmic input at medium to fast gamma frequencies, however,
poorly entrained pyramidal cell spiking. Instead, the output of the
CA1 pyramidal cell population was dominated by fast (>100 Hz)
oscillations that arose within the CA1 network.
RESULTS
Experiments were carried out while animals ran on a linear track
(250 cm long), a Tmaze, or open field (Mizuseki et al., 2009,2012;
5
10
15
20
25
30
elec
trod
e #
elec
trod
e #
shank #
LFP rad IC lm ICCA1pyr IC
2 4 61 3 5 7 2 4 61 3 5 7 2 4 61 3 5 7
sink
0
source
- V
0
+ V
5
10
15
20
25
30
CSD
Wideband Filtered > 30 Hz
100 ms 0.5
mV
CA1pyr IC
rad IC
lm IC
str. pyr. LFP
str. rad. LFP
str. l.m. LFP
100 ms 1 m
V
V loads CSD loads
+1 0 -1 +1 0 -1
CA1 ICs from LFP
CA1pyrradlm
sink
0
source
SPW Theta
50 ms 1 m
V
CA1
DG
D
BA
C
str. pyr. LFP
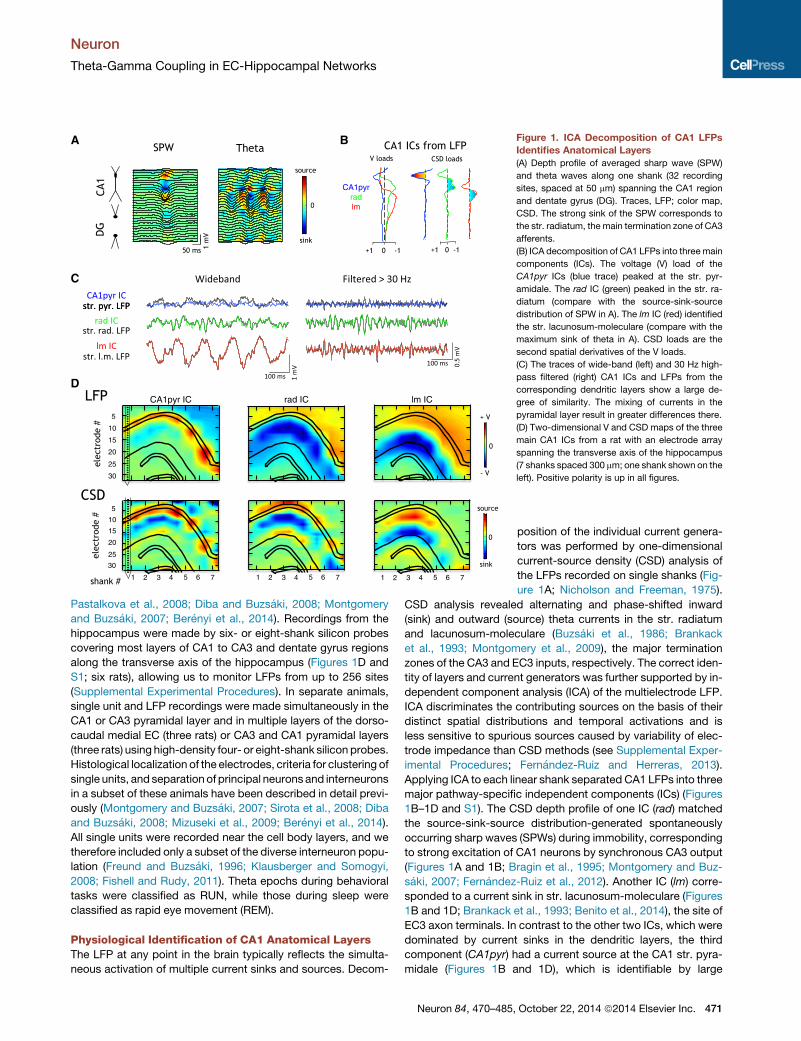
Figure 1. ICA Decomposition of CA1 LFPs
Identifies Anatomical Layers
(A) Depth profile of averaged sharp wave (SPW)
and theta waves along one shank (32 recording
sites, spaced at 50 mm) spanning the CA1 region
and dentate gyrus (DG). Traces, LFP; color map,
CSD. The strong sink of the SPW corresponds to
the str. radiatum, the main termination zone of CA3
afferents.
(B) ICA decomposition of CA1 LFPs into threemain
components (ICs). The voltage (V) load of the
CA1pyr ICs (blue trace) peaked at the str. pyr-
amidale. The rad IC (green) peaked in the str. ra-
diatum (compare with the source-sink-source
distribution of SPW in A). The lm IC (red) identified
the str. lacunosum-moleculare (compare with the
maximum sink of theta in A). CSD loads are the
second spatial derivatives of the V loads.
(C) The traces of wide-band (left) and 30 Hz high-
pass filtered (right) CA1 ICs and LFPs from the
corresponding dendritic layers show a large de-
gree of similarity. The mixing of currents in the
pyramidal layer result in greater differences there.
(D) Two-dimensional V and CSD maps of the three
main CA1 ICs from a rat with an electrode array
spanning the transverse axis of the hippocampus
(7 shanks spaced 300 mm; one shank shown on the
left). Positive polarity is up in all figures.
Neuron
Theta-Gamma Coupling in EC-Hippocampal Networks
Pastalkova et al., 2008; Diba and Buzsaki, 2008; Montgomery
and Buzsaki, 2007; Berenyi et al., 2014). Recordings from the
hippocampus were made by six- or eight-shank silicon probes
covering most layers of CA1 to CA3 and dentate gyrus regions
along the transverse axis of the hippocampus (Figures 1D and
S1; six rats), allowing us to monitor LFPs from up to 256 sites
(Supplemental Experimental Procedures). In separate animals,
single unit and LFP recordings were made simultaneously in the
CA1 or CA3 pyramidal layer and in multiple layers of the dorso-
caudal medial EC (three rats) or CA3 and CA1 pyramidal layers
(three rats) using high-density four- or eight-shank silicon probes.
Histological localization of the electrodes, criteria for clustering of
single units, and separation of principal neurons and interneurons
in a subset of these animals have been described in detail previ-
ously (Montgomery and Buzsaki, 2007; Sirota et al., 2008; Diba
and Buzsaki, 2008; Mizuseki et al., 2009; Berenyi et al., 2014).
All single units were recorded near the cell body layers, and we
therefore included only a subset of the diverse interneuron popu-
lation (Freund and Buzsaki, 1996; Klausberger and Somogyi,
2008; Fishell and Rudy, 2011). Theta epochs during behavioral
tasks were classified as RUN, while those during sleep were
classified as rapid eye movement (REM).
Physiological Identification of CA1 Anatomical LayersThe LFP at any point in the brain typically reflects the simulta-
neous activation of multiple current sinks and sources. Decom-
Neuron 84, 470–485,
position of the individual current genera-
tors was performed by one-dimensional
current-source density (CSD) analysis of
the LFPs recorded on single shanks (Fig-
ure 1A; Nicholson and Freeman, 1975).
CSD analysis revealed alternating and phase-shifted inward
(sink) and outward (source) theta currents in the str. radiatum
and lacunosum-moleculare (Buzsaki et al., 1986; Brankack
et al., 1993; Montgomery et al., 2009), the major termination
zones of the CA3 and EC3 inputs, respectively. The correct iden-
tity of layers and current generators was further supported by in-
dependent component analysis (ICA) of the multielectrode LFP.
ICA discriminates the contributing sources on the basis of their
distinct spatial distributions and temporal activations and is
less sensitive to spurious sources caused by variability of elec-
trode impedance than CSD methods (see Supplemental Exper-
imental Procedures; Fernandez-Ruiz and Herreras, 2013).
Applying ICA to each linear shank separated CA1 LFPs into three
major pathway-specific independent components (ICs) (Figures
1B–1D and S1). The CSD depth profile of one IC (rad) matched
the source-sink-source distribution-generated spontaneously
occurring sharp waves (SPWs) during immobility, corresponding
to strong excitation of CA1 neurons by synchronous CA3 output
(Figures 1A and 1B; Bragin et al., 1995; Montgomery and Buz-
saki, 2007; Fernandez-Ruiz et al., 2012). Another IC (lm) corre-
sponded to a current sink in str. lacunosum-moleculare (Figures
1B and 1D; Brankack et al., 1993; Benito et al., 2014), the site of
EC3 axon terminals. In contrast to the other two ICs, which were
dominated by current sinks in the dendritic layers, the third
component (CA1pyr) had a current source at the CA1 str. pyra-
midale (Figures 1B and 1D), which is identifiable by large
October 22, 2014 ª2014 Elsevier Inc. 471

5 10 15 20 5 10 15 20 5 10 15 20 5 10 15 20 5 10 15 20
50
100
150
200
250
300
5 10 15 20
50
100
150
200
250
300
5 10 15 20 5 10 15 20 5 10 15 20 5 10 15 20 5 10 15 20 5 10 15 20
RUN CA3pyr ICCA1 str. pyr.
LFP CA1pyr IC rad IC lm IC EC3 LFPA
REM
Ampl
itud
efr
eque
ncy
(Hz)
Ampl
itud
efr
eque
ncy
(Hz)
Phase frequency (Hz)
Mod. index(x10-3)B 0 0.8 0 3 0 5 0 2 0 3
C D E F
0
1
2
3
4
CA1pyrIC
radIC
lmIC
EC3LFP
CA3pyrIC
MI R
EM/R
UN **
***
***
**
**
0
0.1
0.2
0.3
0.4
CA1pyrIC
radIC
lmIC
RUNREM
Rela
tive
pow
er ***
***
0
50
100
150
CA1pyrIC
radIC
lmIC
EC3LFP
CA3pyrIC
RUNREM
freq
uenc
y (H
z)
0 0.5
−0.2
0
0.2
CA1F
R r
atio
(REM−RUN)/(REM+RUN)
CA3 EC3
pyramidal interneurons
Figure 2. Spectral Separation of Pathway-Specific Gamma Sub-Bands in CA1
(A) Gamma amplitude-theta frequency (GA-TF) comodulogram of LFP in the CA1 pyramidal layer (CA1 str. pyr. LFP) showed strong theta phase modulation of
three gamma sub-bands during RUN (gammaS, gammaM, and gammaF/epsilon; white arrows). Each ICA-derived LFP component (IC) in CA1 displayed mod-
ulation in one dominant sub-band. White arrows indicate the frequency of peak power. Note similar gamma frequencies in the rad and CA3pyr ICs, and the lm IC
and EC3 LFP, respectively. Color code: strength of GA-TF coupling (modulation index, MI).
(B) Same as in (A) during REM sleep.
(C) Group data of peak frequencies (six rats for CA1 and CA3 ICs, four rats for EC3 LFP).
(D and E) REM/RUN MI ratio (D) and relative power (30–300 Hz) in different layers (E). (*/**/***p < 0.05/0.01/0.001; t test).
(F) Mean ± SEM of firing rate (FR) ratios of single units between REM and RUN ([REM � RUN]/[REM + RUN]).
Neuron
Theta-Gamma Coupling in EC-Hippocampal Networks
amplitude ripples and unit firing (Mizuseki et al., 2011). Concat-
enating and smoothing the one-dimensional IC voltage loadings
across shanks resulted in 2D maps showing the layer specificity
of each component (Figure 1D; similar layer specificity was found
in all six rats). The spectral characteristics of the example traces
shown for each component (Figures 1A and S1C) were
conserved across entire sessions (Figure S1D).
Layer Distribution and Theta Phase Relationship ofGamma OscillationsNeural activity is often coordinated on multiple timescales, with
interactions between oscillatory processes manifested in
cross-frequency coupling (Bragin et al., 1995; Canolty and
Knight, 2010; Belluscio et al., 2012; but see Aru et al., 2014).
Measuring the modulation of LFP power at higher frequencies
(30–300 Hz) by the phase of lower frequency (2–20 Hz) compo-
nents revealed gamma amplitude-theta frequency (GA-TF)
coupling (Tort et al., 2010) in the CA1 pyramidal layer. We
472 Neuron 84, 470–485, October 22, 2014 ª2014 Elsevier Inc.
identified three relatively distinct, but overlapping, gamma sub-
bands during RUN (Figure 2A; Belluscio et al., 2012), corre-
sponding to slow gamma (gammaS, 30–80 Hz), midfrequency
gamma (gammaM, 60–120 Hz), and fast gamma (gammaF, or
epsilon band, > 100 Hz). Because LFP gamma currents in the py-
ramidal layer reflect a combination (in unknown proportions) of
active inhibitory currents, passive return currents from the den-
dritic layers, and spikes (Csicsvari et al., 2003; Glickfeld et al.,
2009; Schomburg et al., 2012), we also examined the layer-spe-
cific distribution of theta-gamma coupling using ICA. GA-TF
analysis of the LFP ICs (Figure 2) revealed significantly theta-
modulated gamma bands in all animals (p < 0.001 for each IC/
LFP, surrogate test; 12 rats). In the CA1pyr IC, theta oscillations
most strongly modulated gammaF frequencies (Figures 2A and
2C; mean ± SEM, 149.4 ± 4.3 Hz). In the rad IC, the dominant
theta-modulated gamma frequencies were between 30 and
80 Hz (Figures 2A and 2C; 47.3 ± 0.6 Hz), in agreement with a
similar gamma band modulation (p > 0.05, t test between
RUN CA3pyr ICCA1pyr IC rad IC lm IC EC3 LFP
AAm
plit
ude
freq
uenc
y (H
z)Am
plit
ude
freq
uenc
y (H
z)
B
0 180 360 540 7200 180 360 540 7200 180 360 540 7200 180 360 540 7200 180 360 540 720 0 180 360 540 720
REM
E
CA3Str. pyr.
Str. rad.
Str. lac-mol.
EC3
1 m
V
50 ms
0. 2
m
V
40
60
80
100
120
140
CA1 str. pyr.LFP
40
60
80
100
120
140
z-sc
ored
wav
elet
pow
er
-0.3
0
0.3
z-sc
ored
wav
elet
pow
er
-0.3
0
0.3
CA1 theta phase (degrees)
0
90
180
270
360
CA1pyrIC
radIC
lmIC
EC3LFP
CA3pyrIC
RUNREM
Thet
a-ph
ase
(deg
rees
)
C
0
0.1
0.2
0.3
0.4
CA1pyrIC
radIC
lmIC
EC3LFP
CA3pyrIC
z-sc
ored
wav
elet
pow
er
***
******
**
DEC3 CA3 CA1
0 180 360 540 7200 180 360 540 7200 180 360 540 7200 180 360 540 7200 180 360 540 720 0 180 360 540 720
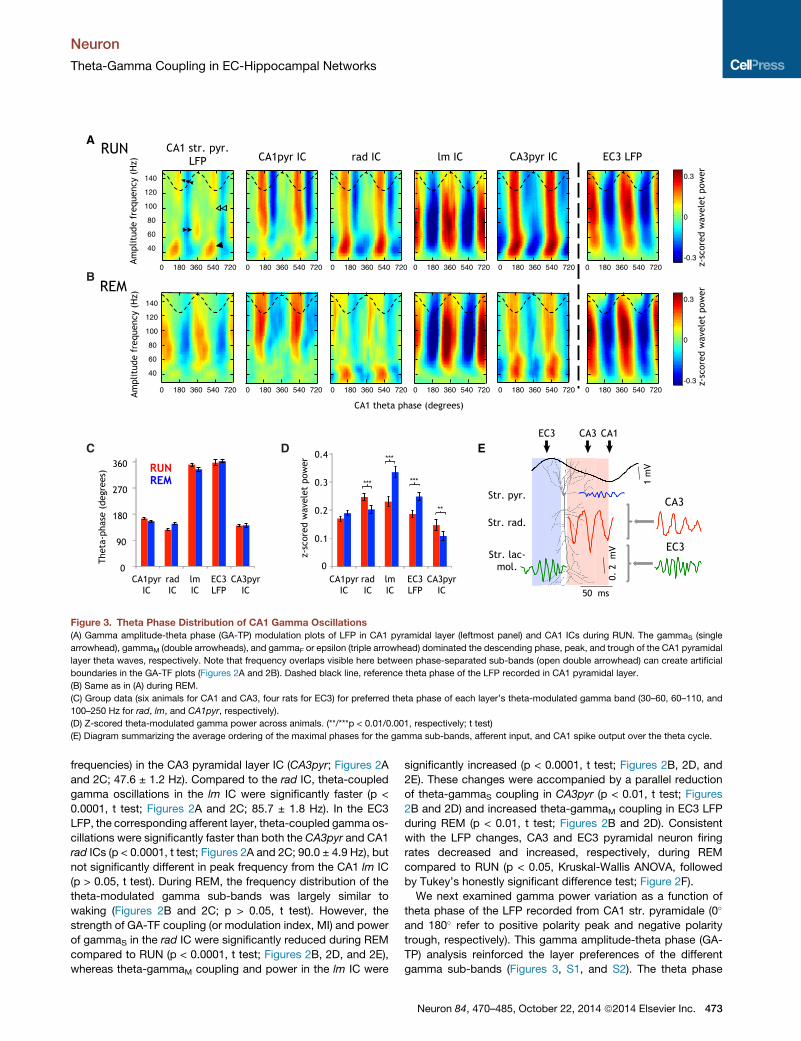
Figure 3. Theta Phase Distribution of CA1 Gamma Oscillations
(A) Gamma amplitude-theta phase (GA-TP) modulation plots of LFP in CA1 pyramidal layer (leftmost panel) and CA1 ICs during RUN. The gammaS (single
arrowhead), gammaM (double arrowheads), and gammaF or epsilon (triple arrowhead) dominated the descending phase, peak, and trough of the CA1 pyramidal
layer theta waves, respectively. Note that frequency overlaps visible here between phase-separated sub-bands (open double arrowhead) can create artificial
boundaries in the GA-TF plots (Figures 2A and 2B). Dashed black line, reference theta phase of the LFP recorded in CA1 pyramidal layer.
(B) Same as in (A) during REM.
(C) Group data (six animals for CA1 and CA3, four rats for EC3) for preferred theta phase of each layer’s theta-modulated gamma band (30–60, 60–110, and
100–250 Hz for rad, lm, and CA1pyr, respectively).
(D) Z-scored theta-modulated gamma power across animals. (**/***p < 0.01/0.001, respectively; t test)
(E) Diagram summarizing the average ordering of the maximal phases for the gamma sub-bands, afferent input, and CA1 spike output over the theta cycle.
Neuron
Theta-Gamma Coupling in EC-Hippocampal Networks
frequencies) in the CA3 pyramidal layer IC (CA3pyr; Figures 2A
and 2C; 47.6 ± 1.2 Hz). Compared to the rad IC, theta-coupled
gamma oscillations in the lm IC were significantly faster (p <
0.0001, t test; Figures 2A and 2C; 85.7 ± 1.8 Hz). In the EC3
LFP, the corresponding afferent layer, theta-coupled gamma os-
cillations were significantly faster than both the CA3pyr and CA1
rad ICs (p < 0.0001, t test; Figures 2A and 2C; 90.0 ± 4.9 Hz), but
not significantly different in peak frequency from the CA1 lm IC
(p > 0.05, t test). During REM, the frequency distribution of the
theta-modulated gamma sub-bands was largely similar to
waking (Figures 2B and 2C; p > 0.05, t test). However, the
strength of GA-TF coupling (or modulation index, MI) and power
of gammaS in the rad IC were significantly reduced during REM
compared to RUN (p < 0.0001, t test; Figures 2B, 2D, and 2E),
whereas theta-gammaM coupling and power in the lm IC were
significantly increased (p < 0.0001, t test; Figures 2B, 2D, and
2E). These changes were accompanied by a parallel reduction
of theta-gammaS coupling in CA3pyr (p < 0.01, t test; Figures
2B and 2D) and increased theta-gammaM coupling in EC3 LFP
during REM (p < 0.01, t test; Figures 2B and 2D). Consistent
with the LFP changes, CA3 and EC3 pyramidal neuron firing
rates decreased and increased, respectively, during REM
compared to RUN (p < 0.05, Kruskal-Wallis ANOVA, followed
by Tukey’s honestly significant difference test; Figure 2F).
We next examined gamma power variation as a function of
theta phase of the LFP recorded from CA1 str. pyramidale (0�
and 180� refer to positive polarity peak and negative polarity
trough, respectively). This gamma amplitude-theta phase (GA-
TP) analysis reinforced the layer preferences of the different
gamma sub-bands (Figures 3, S1, and S2). The theta phase
Neuron 84, 470–485, October 22, 2014 ª2014 Elsevier Inc. 473

A
BREM
Proximal CA1 Distal CA1RUN Proximal
IntermediateDistal
Rela
tive
MI
0
1
2
CA1pyrIC
radIC
lmIC
150
100
50
150
100
50
150
100
50
200
250
Ampl
itud
e fr
eque
ncy
(Hz)
Phase frequency (Hz)
5 10 15
5 10 15
Phase frequency (Hz)
Ampl
itud
e fr
eque
ncy
(Hz)
Proximal CA1 Distal CA1
150
100
50
150
100
50
150
100
50
200
250
Mod. index (x10-3)
Mod. index (x10-3)
1
3
5
1
3
50
1
2
CA1pyrIC
radIC
lmIC
Rela
tive
MI
z-sc
ored
gam
ma F p
ower
RUN
0 180 360 540 720theta phase (degrees)
0 18 36 5 72000 180180 360360 54040 72020
REMProximalIntermediateDistal0.2
0.1
0
−0.1
−0.2
theta phase (degrees)0 180 360 540 720
theta phase (degrees)
0.2
0.1
−0.1
−0.2
0 180 360 540 720theta phase (degrees)
C
***
******
***
******
Figure 4. Distribution of Theta-Coupled
Gamma Oscillations along the CA1 Trans-
verse Axis of the CA1 Region
(A) Two-dimensional distribution of the theta-
coupled gamma oscillations during RUN. Each set
of three panels was constructed from the GA-TF
coupling of the ICA components (ICs) on each
recording shank. The rad IC’s gammaS became
less theta-modulated along the proximo-distal
(i.e., CA3-subicular) axis, whereas lm gammaMincreased in coupling strength. CA1pyr gammaFlargely followed the rad IC gradient. The bar plot on
the right shows group data of MIs, normalized by
the average across all shanks (six rats). Each
comparison showed significant variation from
proximal to distal sites (p < 0.001; ANOVA).
(B) Similar display during REM. Note the opposite
trend of CA1pyr theta-gammaF coupling along the
proximo-distal axis compared to RUN.
(C) Theta phase distribution of CA1pyr gammaFpower in RUN and REM at three segments along
the proximo-distal axis of CA1. Note increased
bimodality of the gammaF power distribution (ar-
rowheads) toward the distal (subicular) end
compared to the CA3 end (p < 0.001 for mean
phases both in RUN and REM, ANOVA tests, six
rats) and stronger overall bimodality during REM.
Neuron
Theta-Gamma Coupling in EC-Hippocampal Networks
ordering of gamma patterns (Figures 3A–3C and S2) and the pre-
dominant phases of input and output spiking (Mizuseki et al.,
2009) during RUN are summarized in Figure 3E (see also the
Discussion). GammaF power (>100 Hz) in the CA1pyr IC
was maximal near the trough of the theta cycle (174.8� ± 3.3�;Figures 3A and 3C), coincident with the highest probability of
spikes of the CA1 pyramidal neurons at this phase (Buzsaki
et al., 1983; Csicsvari et al., 1999; Mizuseki et al., 2009).
GammaS (30–80 Hz) was most prominent in the rad IC, occurring
predominantly on the descending phase of theta (mean across
animals, 128.3� ± 2.0�; Figures 3A and 3C), which coincides
with the gamma oscillations in the CA3pyr IC (138.9� ± 4.5�; Fig-ures 3A and 3C) and most CA3 spiking (Csicsvari et al., 2003;
474 Neuron 84, 470–485, October 22, 2014 ª2014 Elsevier Inc.
Mizuseki et al., 2009). The gammaM (60–
120 Hz) that dominated the lm IC was
phase-locked to the peak of the reference
theta waves (348.8� ± 5.3�; Figures 3A
and 3C), coincident with maximal EC3
gamma LFPs (355.8� ± 14.8�; Figures 3A
and 3C) and pyramidal cell firing (Mizu-
seki et al., 2009).
During REM sleep, the theta phase and
layer distributions of slow and mid-
gamma activity were qualitatively similar
to RUN (nonsignificant differences in
theta phases of maximal gamma power,
p > 0.05, t test; Figures 3B and 3C),
but theta-modulated gamma power de-
creased in the rad and CA3pyr ICs (p <
0.001, t test) while it increased in the lm
IC and EC3 LFP (p < 0.0001, t test) during
REM (Figures 3B and 3D). GammaF (epsilon) power became
bimodal in the CA1 pyramidal layer IC and LFP, with power in-
creases at both the trough and peak of CA1 theta cycle (see
below, Figure 4), similar to the phase-shifted firing of many
CA1 neurons during REM (Mizuseki et al., 2011).
In addition to theta phase and layer differences, the gamma fre-
quency bands were also distinct in their promixo-distal distribu-
tion (Figure 4). Rad ICs closer to the CA3 region (proximal CA1)
showed stronger theta-gammaS coupling than at sites near the
subicular border of the CA1 region (distal CA1), whereas the
opposite relationship was observed for the gammaM band in
the lm ICs (p < 0.001; ANOVA tests; six rats; Figure 4A). Their
frequencies remained constant along the entire transverse

Neuron
Theta-Gamma Coupling in EC-Hippocampal Networks
hippocampal axis (Figure S3). During RUN, the CA1pyr IC theta-
gammaF couplingwas stronger at sites closer toCA3,while it was
stronger near the subicular end during REM (p < 0.001, ANOVA
tests; Figures 4A and 4B). The changes in CA1pyr theta-gammaFcoupling along the proximo-distal axis and between RUN and
REM mostly reflected changes in its theta phase distribution. A
bimodal phase distribution, exhibiting increased power at both
the trough and peak, emerged on the distal end during RUN
and at all sites during REM (Figure 4C). The altered phase distri-
butions were limited to the CA1pyr ICs; quantifying the phase
distribution with the ‘‘center of mass’’ of gamma power showed
significant variation for CA1pyr from the proximal to distal ends
during both RUN and REM (p < 0.001, ANOVA tests; Figure S3),
but not for the other components (p > 0.05, ANOVA tests).
Layer-Specific Gamma Rhythms Reflect Distinct Inputand Output PatternsThe next level of analysis examinedwithin-layer, cross-layer, and
cross-regional interactions among the various gamma oscilla-
tions. As a first step, coherence maps in the gamma frequency
band were constructed using gammaS,M coherence between
LFPs at reference sites in different layers and the remaining
255 channels. This procedure reliably outlined the anatomical
layer boundaries in CA1 (Figure 5A). Gamma-band coherence
of the ICA components extracted from each shank similarly
separated the CA1 layers (Figure 5B; six rats). Gamma coher-
ence remained relatively high (>0.4) for ICs from different shanks
but in the same layer, even up to 1.8 mm away, whereas gamma
coherence between ICs from different layers was consistently
lower, even at the same shank (Figure 5C). Coherence between
LFPs recorded from the CA3 andCA1 pyramidal layers showed a
peak in the gammaS band during both RUN and REM (Figure 5D;
three rats). LFP coherence between EC3 and the CA1 pyramidal
layer was low (<0.1 in each of the three rats) above�60Hz during
both RUN and REM. By using wavelet phase coherence, which
allows for time-resolved spectral component estimates, we
found that the weak but significant coherence between CA1
and EC3 in the gammaM band was concentrated around the
peak of the CA1 str. pyramidale theta LFP.
In several RUN sessions, but not during REM, interregional
pairs of LFP signals showed increasing coherence above
100 Hz (Figure 5D). However, additional analyses showed that
this long-distance, high-frequency coherence corresponded to
a highly synchronous artifact of volume-conducted muscle
activity (Figure S4).
In summary, theta-modulated gamma power in the respective
dendritic domains of CA1 pyramidal cells mainly reflects the
gamma band activity in their respective afferent regions and
varied as a function of brain state.
Interneuron Spike to Gamma LFP Phase-Locking Withinand Between RegionsThe theta phase separation and low cross-layer and cross-
regional coherence of LFP gamma waves suggested that afferent
gammapatternsarriving toCA1pyramidal cell dendritesarepoorly
expressed in the str. pyramidale. We next examined howwell LFP
oscillations recorded from different locations were reflected in the
spike timingof interneurons andpyramidal cells. Toprovide an un-
biasedmeasure of spike phase-lockingwithout arbitrarily prefilter-
ing the LFP, we introduced a wide-band, high-resolution method
by calculating the wavelet phase at the time of each spike from
20 to 240 Hz (in logarithmic intervals). Modulation indices were
calculated using themean resulting length of the spike phase vec-
tors, and thesignificanceofphase-lockingwasassessedusing the
Rayleigh test on the spike phase distribution with a p < 0.01
threshold (see Supplemental Experimental Procedures).
We examined three types of correlations: (1) intraregional
spike-LFP coupling, (2) coupling between spikes in CA3 and
EC3 and LFP gamma phases in CA1 (i.e., upstream spikes to
downstream LFP), and (3) coupling between the gamma phases
of LFPs in CA3 and EC3 and spikes in CA1 (upstream LFP to
downstream spikes). To avoid contamination of LFP phase by
a unit’s spike waveform (Zanos et al., 2011), we measured
gamma phases using the LFP recorded 0.4 mm from the unit
detection site (i.e., a two-shank gap) in the pyramidal layer (see
Figure S6), except in the case of EC3, for which only 0.2mm sep-
arations were available. We first examined the relationship be-
tween spikes of putative interneurons in CA1 and LFP at CA1
str. pyramidale, because interneurons, in general, show more
reliable phase-locking to afferent patterns than pyramidal cells
(Buzsaki et al., 1983; Csicsvari et al., 2003; Brunet et al., 2014).
At all frequencies, a large fraction of putative interneurons ex-
hibited significant spike-LFP coupling, but three relatively
segregated groups of interneurons emerged during RUN, corre-
sponding approximately to gammaS, gammaM, and gammaF/
epsilon bands (Figure 6A). Because individual interneurons could
bemodulated atmultiple gamma frequencies, we report both the
fraction of neurons with p values < 0.01 at each frequency band
(lines in Figures 6A–6D) and the frequencies with the strongest
coupling (‘‘preferred frequency’’) for those units crossing the
p < 0.01 threshold for at least one frequency (bar histograms in
Figures 6A–6D). CA3 and EC3 interneurons were also broadly
tuned, though EC3 interneurons, preferring mostly high fre-
quencies, were less heterogeneous in their frequency prefer-
ences than CA1 or CA3 interneurons. When LFPs were instead
taken from CA1 str. radiatum (Figure 6D, first panel), the stron-
gest phase-locking of CA1 interneurons during RUN occurred
in the gammaS band. Similarly, the strongest phase-locking
and frequency preferences of CA3 interneurons with CA1 str.
radiatum LFP were confined to < 60 Hz (Figure S5). On the other
hand, coupling between CA1 interneurons and CA3 pyramidal
layer LFP (Figure 6D, second panel) or CA3 interneurons and
CA1 pyramidal layer LFP (Figure S5) had a broader distribution
of frequency preferences. CA1 interneurons were also phase-
locked to gamma frequencies in the EC3 LFP (Figure 6D, third
panel) and, in the reverse direction, EC3 interneurons were
phase-locked to CA1 LFP gamma (Figure S5), although in signif-
icantly lower proportions than betweenCA3 andCA1 (Figures 6D
andS5). Unfortunately, we did not obtain recordingswith enough
simultaneous single units and str. lacunosum-moleculare LFP for
comparable statistics linking them.
The gamma frequency preferences of CA1 interneurons
were also related to their theta phase preferences (Figure 6E).
Interneurons with gammaS frequency preferences fired mainly
on the descending phase of the theta cycle, whereas both
gammaM- and gammaF-preferring units fired most around the
Neuron 84, 470–485, October 22, 2014 ª2014 Elsevier Inc. 475
0
0.2
0.4
0.6
0.8
1
0 300 600 900 1200 1500 1800
CA1pyrradlm
CA1pyr-radCA1pyr-lmrad-lm
distance (μm)
Cohe
renc
e (3
0-10
0 Hz
)
1 2 3 4 5 6 7 1 2 3 4 5 6 7 1 2 3 4 5 6
12345671234567123456
CA1p
yr IC
CA1pyr ICra
d IC
rad IClm
IClm IC
0.9
0.1
cohe
renc
e(3
0-10
0 Hz
)
CA1 IC coherence matrix
0
1
30-90 Hz LFP coherence(� reference)
CA1str. pyr.
CA1str. rad.
CA1str. l.-m.
Hz
Hz
CA1−CA3 LFP CA1−EC3 LFP
CA1 theta phase CA1 theta phase0 180 360 540 720 0 180 360 540 720
RUN
REM
40
60
80
100
120
140
40
60
80
100
120
140
40
60
80
100
120
140
40
60
80
100
120
140
0
0.4 wavelet coherence
20 50 100 150 2000
0.1
0.2
0.3 CA1−EC3 LFP
Hz
FF
T c
oher
ence
(mea
n +
/− s
.d.
20 50 100 150 2000
0.1
0.2
0.3
FF
T c
oher
ence
(mea
n +
/− s
.d.
CA1−CA3 LFP
RUNREM
A B C
D E
IC pairs
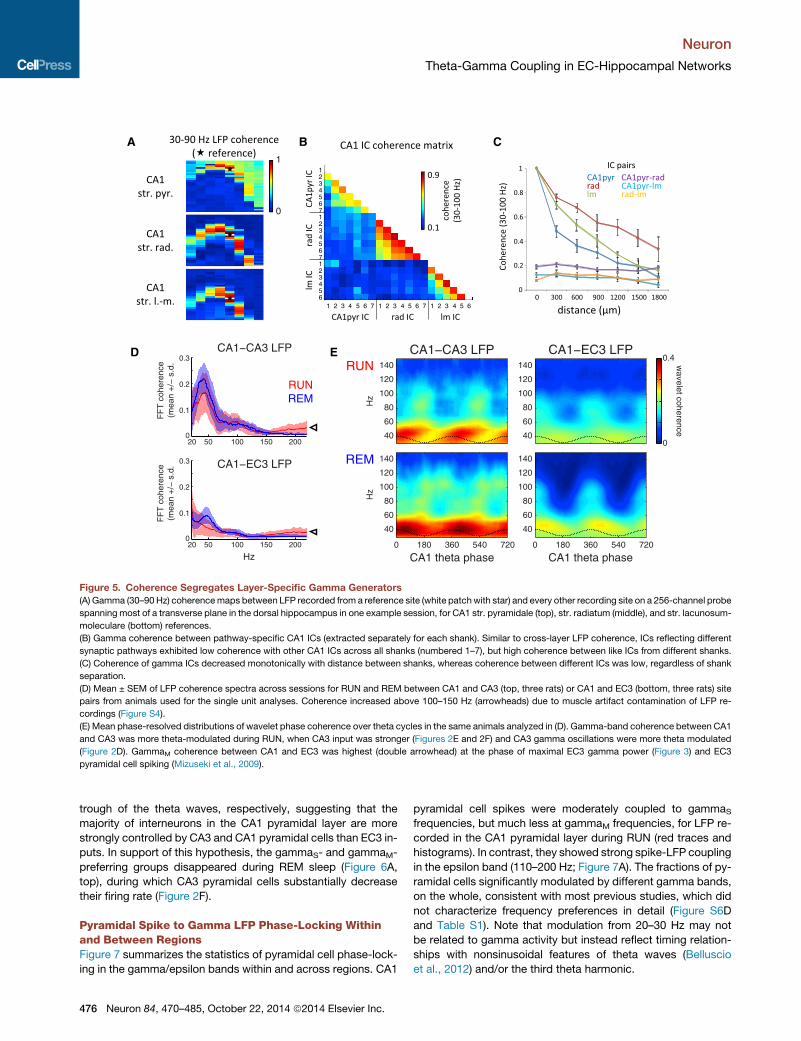
Figure 5. Coherence Segregates Layer-Specific Gamma Generators
(A) Gamma (30–90 Hz) coherencemaps between LFP recorded from a reference site (white patchwith star) and every other recording site on a 256-channel probe
spanning most of a transverse plane in the dorsal hippocampus in one example session, for CA1 str. pyramidale (top), str. radiatum (middle), and str. lacunosum-
moleculare (bottom) references.
(B) Gamma coherence between pathway-specific CA1 ICs (extracted separately for each shank). Similar to cross-layer LFP coherence, ICs reflecting different
synaptic pathways exhibited low coherence with other CA1 ICs across all shanks (numbered 1–7), but high coherence between like ICs from different shanks.
(C) Coherence of gamma ICs decreased monotonically with distance between shanks, whereas coherence between different ICs was low, regardless of shank
separation.
(D) Mean ± SEM of LFP coherence spectra across sessions for RUN and REM between CA1 and CA3 (top, three rats) or CA1 and EC3 (bottom, three rats) site
pairs from animals used for the single unit analyses. Coherence increased above 100–150 Hz (arrowheads) due to muscle artifact contamination of LFP re-
cordings (Figure S4).
(E) Mean phase-resolved distributions of wavelet phase coherence over theta cycles in the same animals analyzed in (D). Gamma-band coherence between CA1
and CA3 was more theta-modulated during RUN, when CA3 input was stronger (Figures 2E and 2F) and CA3 gamma oscillations were more theta modulated
(Figure 2D). GammaM coherence between CA1 and EC3 was highest (double arrowhead) at the phase of maximal EC3 gamma power (Figure 3) and EC3
pyramidal cell spiking (Mizuseki et al., 2009).
Neuron
Theta-Gamma Coupling in EC-Hippocampal Networks
trough of the theta waves, respectively, suggesting that the
majority of interneurons in the CA1 pyramidal layer are more
strongly controlled by CA3 and CA1 pyramidal cells than EC3 in-
puts. In support of this hypothesis, the gammaS- and gammaM-
preferring groups disappeared during REM sleep (Figure 6A,
top), during which CA3 pyramidal cells substantially decrease
their firing rate (Figure 2F).
Pyramidal Spike to Gamma LFP Phase-Locking Withinand Between RegionsFigure 7 summarizes the statistics of pyramidal cell phase-lock-
ing in the gamma/epsilon bands within and across regions. CA1
476 Neuron 84, 470–485, October 22, 2014 ª2014 Elsevier Inc.
pyramidal cell spikes were moderately coupled to gammaSfrequencies, but much less at gammaM frequencies, for LFP re-
corded in the CA1 pyramidal layer during RUN (red traces and
histograms). In contrast, they showed strong spike-LFP coupling
in the epsilon band (110–200 Hz; Figure 7A). The fractions of py-
ramidal cells significantly modulated by different gamma bands,
on the whole, consistent with most previous studies, which did
not characterize frequency preferences in detail (Figure S6D
and Table S1). Note that modulation from 20–30 Hz may not
be related to gamma activity but instead reflect timing relation-
ships with nonsinusoidal features of theta waves (Belluscio
et al., 2012) and/or the third theta harmonic.
A D
EB
C
20 30 50 90 150 2400
0.5
1
Hz
(92%)36
(90%)35
EC3
20 30 50 90 150 2400
0.5
1 (93%)127
(97%)132
CA3
0
0.5
1
(84%)268
(86%)276 CA1
Hz
norm
. mod
ulat
ion
stre
ngth
20 30 50 90 150 240
RUN
CA1 theta phase
0 180 360 540 7200
0.03
0.06
0
0.13
0.26
pool
ed s
pike
pha
ses
preferred theta phases
RUN
0 180 360 540 7200
0.03
0.06
0
0.13
0.26 preferred theta phasespool
ed s
pike
pha
ses
REM
60-90 100-200 Hz30-50Preferred gamma frequency
20 30 50 90 150 2400
0.5
1
(67%)203
(79%)237 CA1
EC3
20 30 50 90 150 2400
0.5
1
(46%)11
(100%)24
CA1
CA3
20 30 50 90 150 2400
0.5
1 (85%)123
(90%)129 CA1
str.rad.
Hz
REMRUN
2x freq. prefs. of signif. unitsfraction with p < 0.01
/
RUN & REM
CA1 intCA3 LFP
> CA1 intEC3 LFP
p < 0.05/0.01
/ p < 0.05/0.01
REM
CA1 intEC3 LFP
> CA1 intCA3 LFP
/ p < 0.05/0.01RUN > REM
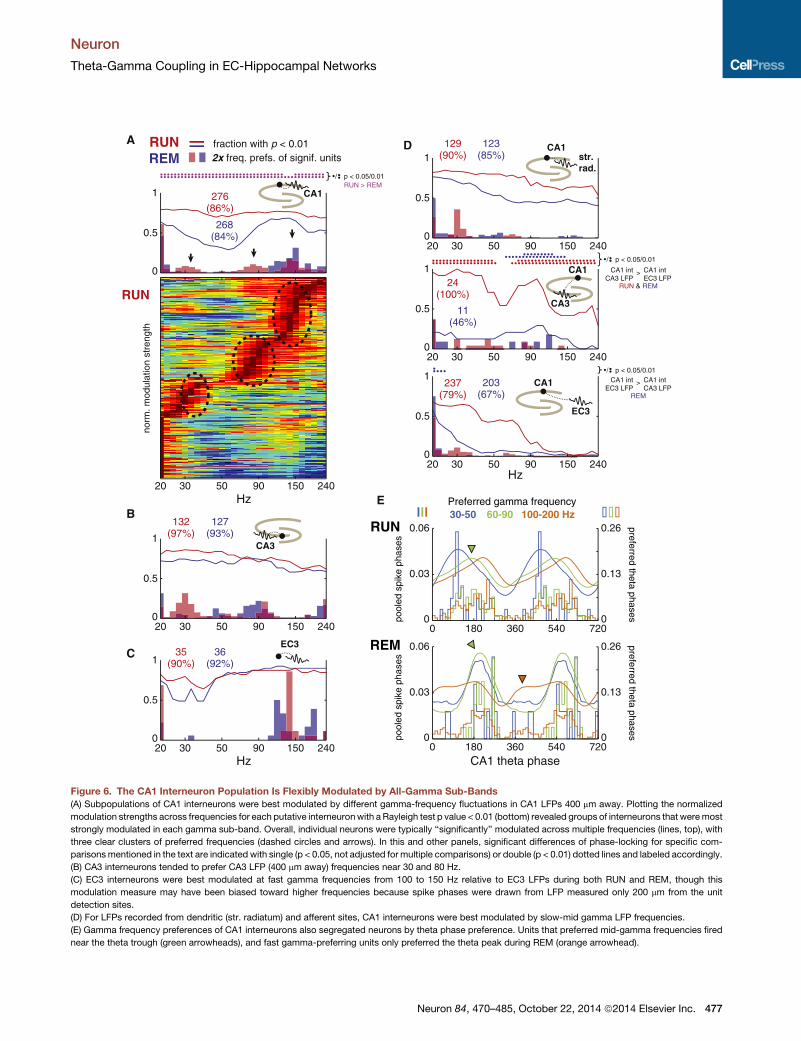
Figure 6. The CA1 Interneuron Population Is Flexibly Modulated by All-Gamma Sub-Bands
(A) Subpopulations of CA1 interneurons were best modulated by different gamma-frequency fluctuations in CA1 LFPs 400 mm away. Plotting the normalized
modulation strengths across frequencies for each putative interneuronwith a Rayleigh test p value < 0.01 (bottom) revealed groups of interneurons that weremost
strongly modulated in each gamma sub-band. Overall, individual neurons were typically ‘‘significantly’’ modulated across multiple frequencies (lines, top), with
three clear clusters of preferred frequencies (dashed circles and arrows). In this and other panels, significant differences of phase-locking for specific com-
parisonsmentioned in the text are indicated with single (p < 0.05, not adjusted for multiple comparisons) or double (p < 0.01) dotted lines and labeled accordingly.
(B) CA3 interneurons tended to prefer CA3 LFP (400 mm away) frequencies near 30 and 80 Hz.
(C) EC3 interneurons were best modulated at fast gamma frequencies from 100 to 150 Hz relative to EC3 LFPs during both RUN and REM, though this
modulation measure may have been biased toward higher frequencies because spike phases were drawn from LFP measured only 200 mm from the unit
detection sites.
(D) For LFPs recorded from dendritic (str. radiatum) and afferent sites, CA1 interneurons were best modulated by slow-mid gamma LFP frequencies.
(E) Gamma frequency preferences of CA1 interneurons also segregated neurons by theta phase preference. Units that preferred mid-gamma frequencies fired
near the theta trough (green arrowheads), and fast gamma-preferring units only preferred the theta peak during REM (orange arrowhead).
Neuron
Theta-Gamma Coupling in EC-Hippocampal Networks
Neuron 84, 470–485, October 22, 2014 ª2014 Elsevier Inc. 477

A
B
C
D
E
F 30-50 Hz 50-70 Hz 70-100 Hz 100-150 Hz 150-240 Hz
gamma phase preference
prob
abili
typr
obab
ility
0
0.1
0.2
0.3
0
0.1
0.2
0.3
0 180 360 540 720
RUN
0 180 360 540 720
REM
Pyrs. – CA1 str. rad. LFPs
Hz
20 30 50 90 150 2400
0.25
0.5
(44%)580
(57%)765 CA1
str.rad.
20 30 50 90 150 2400
0.25
0.5
(25%)28
(61%)69
CA3
CA1str. rad.
CA1 pyrs. – Afferent LFP
Hz20 30 50 90 150 240
0
0.25
0.5
(25%)511
(42%)841 CA1
EC3
20 30 50 90 150 2400
0.25
0.5(20%)
26(47%)
61CA1
CA3
Afferent pyrs. – CA1 LFP
Hz20 30 50 90 150 240
0
0.25
0.5
(41%)131
(53%)170
CA1
EC3
20 30 50 90 150 2400
0.25
0.5
(13%)19
(48%)69 CA1
CA3
Hz20 30 50 90 150 240
0
0.5
1(90%)
38(90%)
38EC3
20 30 50 90 150 2400
0.25
0.5(46%)330
(69%)501
CA3
Hz
norm
. mod
ulat
ion
stre
ngth
20 30 50 90 150 240
RUN
0
0.25
0.5
(58%)1381
(64%)1539 CA1
REMRUN
freq. prefs. of signif. unitsfraction with p < 0.01
/ p < 0.05/0.01RUN > REM
/ p < 0.05/0.01RUN > REM
/ p < 0.05/0.01
RUN & REM
EC3 pyrCA1 LFP
> CA1 pyrEC3 LFP
/ p < 0.05/0.01RUN > REM
/ p < 0.05/0.01RUN > REM
Figure 7. CA1 Pyramidal Cell Spike TimingWas Related to Slow and Fast GammaOscillations, butWasWeakly Affected byMid-Gamma LFP
Features.
(A) CA1 pyramidal cells were dominated by fast gamma LFP features (black arrow and dashed circle), even for LFPs 400 mmaway (see also Figure S6). Modulation
below 30Hz (gray arrow)may reflect some thetawave asymmetry/harmonic effects.Mid-gammamodulation fell to near chance levels (�1% for p < 0.01 threshold)
during REM. Significant differences in phase-locking for specific comparisons mentioned in the text are indicated with dotted lines and labeled accordingly.
(B) Intraregional CA3 (top) and EC3 (bottom) pyramidal cell phase-locking was dominated by the gamma frequencies characteristic of each region (Figure 2).
(C) Spike timing of pyramidal cells in CA3 (top) and EC3 (bottom) was modulated by gamma-band LFP features in CA1.
(D) CA1 pyramidal cell spike timing, however, was substantially influenced by LFPs in afferent regions (CA3, top; EC3, bottom) only at slow gamma frequencies.
(E) CA1 (top) and CA3 (bottom) pyramidal cell phase modulation shifted toward slow gamma when LFP was measured in str. radiatum, suggesting that mid-
gamma phase locking of these units in str. pyramidale was due to CA3-driven interneurons in CA1 (see Figures 6 and S5).
(F) Gamma phase preferences (LFP 400 mm away, as in A) of CA1 pyramidal cells shifted from the rising phase to the trough as the gamma frequency preference
increased. The slow gamma-like phase distributions present at mid-gamma frequencies during RUN (top) disappeared in REM (bottom).
Neuron
Theta-Gamma Coupling in EC-Hippocampal Networks
The distribution of CA1 spike-LFP coupling strengths and fre-
quency preferences was conspicuously different from those that
characterized spike-LFP coupling in the CA3 (<75 Hz) and EC3
(70–140 Hz) regions (Figure 7B), reflecting the gammaS and
gammaM dominance of LFP patterns in each of those regions.
When CA1 pyramidal cells were related to LFP recorded in
CA3 pyramidal layer or CA1 str. radiatum, the band preferences
decreased to mostly below 100 Hz (Figures 7D and 7E), as was
the case with interneurons. Likewise, while CA3 pyramidal neu-
rons were preferentially locked to gammaS in CA1 str. radiatum
(Figure 7E), these units were most phase-locked near 80 Hz in
CA1 str. pyramidale (Figure 7C), possibly reflecting CA3-driven
feedforward perisomatic IPSCs (Figure S5D). Spike-LFP
coupling was much stronger in the EC3-to-CA1 direction (Fig-
478 Neuron 84, 470–485, October 22, 2014 ª2014 Elsevier Inc.
ure 7C) than in the reverse direction (Figure 7D), especially at
gammaM frequencies, with the percentage of CA1 pyramidal
cells locked to EC3 LFPs at frequencies above 80 Hz being
less than 3% (i.e., near chance levels).
During REM (Figure 7, blue traces and histograms), CA3 pyra-
midal cell spike coupling to CA1 LFP gamma oscillation was
significantly decreased, congruent with the decreased gamma
power in CA1 str. radiatum (Figure 2E) and reduced firing rates
of CA3 pyramidal cells (Figure 2F). CA1 pyramidal cells also
became significantly less modulated at gammaM frequencies
during REM, consistent with similar changes in the CA1 inter-
neuron population (Figure 6A) and phase-locking between CA3
and CA1 (Figures 6D, 7C, and 7E). This suggests that, despite
EC3 input generating gammaM LFP signals (Figures 2, 3, and

Neuron
Theta-Gamma Coupling in EC-Hippocampal Networks
7C), phase-locking of CA1 units to mid-gamma frequencies is
dominated by the CA3 input. In support of this hypothesis, the
reduction of CA3 input during REM was accompanied by a shift
in the preferred gammaM phases of CA1 pyramidal cell spikes
from a gammaS-like distribution to a gammaF-like distribution
(Figure 7F).
As an alternate measure of gamma modulation strength
across the population, we pooled spike phases across units re-
corded in all analyzed RUN or REM epochs and calculated the
modulation strength and p value (Rayleigh test) for the resulting
phase distributions. This method gave qualitatively similar re-
sults to those presented above (Figures S6E–S6G). While the
pooled spike phases across CA1 pyramidal cells did reach the
significance threshold (p < 0.01, not corrected for multiple com-
parisons) for phase locking to EC3 LFP up to 90–95 Hz during
RUN and �140 Hz during REM, it was much weaker than at
slow-mid frequencies, or in the reverse direction of EC3 pyrami-
dal cell spikes and CA1 LFP (which was maximal at �95 Hz).
Furthermore, including only spikes occurring when the wavelet
power of the LFP was > 2 SD above the mean yielded no notice-
able improvement in phase-locking in either the single or pooled
unit case (data not shown).
A potential explanation for the relatively weak EC3-CA1
coupling could be that the electrodes in these respective regions
were not placed in anatomically connected sites. Our finding of
monosynaptic-latency excitation of EC5 interneurons following
CA1 pyramidal cell spikes (Figure S5), however, argues against
this possibility (Naber et al., 2001). In summary, while spiking in
upstream structures was coupled to LFP gamma phase in their
target regions, the phase-locking CA1 pyramidal cells to LFP os-
cillations in afferent regions was typically low and mostly limited
to gammaS frequencies.
Reorganization of CA1 Activity during Memory-GuidedNavigationBrain rhythms are thought to reflect dynamical processes that are
functionally related to the cognitive demands of behavior. While
we focused here on characterizing the general dynamics of the
entorhinal-hippocampal circuit during multiple navigational
tasks,wealsomorespecifically examined theta-gammacoupling
and unit firing in a hippocampus-dependent delayed-alternation
T maze task (Ainge et al., 2007; Montgomery and Buzsaki,
2007;Pastalkovaet al., 2008). In this task, rats learned toalternate
between turns to the left or right arms on successive trials for
water reward (Figures 8Aand8D),with thecentral armassociated
withmemory recall (Wood et al., 2000;Montgomery and Buzsaki,
2007). We first compared LFPs in the central and side arms using
ICA (Figure 8A; three rats). Both gamma power (Figure S7) and
theta-gamma coupling (Figure 8B) were significantly stronger
for each CA1 IC during center arm running compared to the
side arm, with the largest changes present in CA1 str. radiatum
(p<0.001, t test). Thesebehavior-relatedchangeswerestrongest
in the gamma sub-bands that dominate the respective ICs during
theta (Figure 8C).Similar to the thetaphasedistribution shifts from
RUN to REM (Figure 4C), the ‘‘center of mass’’ of gammaF power
in the CA1pyr IC shifted toward the theta peak in the sides
compared to the center arms (Figure S7C), in conjunction with
shifted CA1 spiking activity (see below).
We analyzed single unit activity in three additional animals with
high-density probes in the hippocampus and entorhinal cortex.
We aggregated spikes from each neuron type within each ses-
sion to compare overall firing rates, because place-specific firing
of hippocampal pyramidal cells (O’Keefe andNadel, 1978) would
confound single unit comparisons of firing rates between arms.
CA3 pyramidal cell and CA1 interneuron firing rates were signif-
icantly greater during center arm running compared to side arms
(p < 0.01 for CA3 pyramidal cells, p < 0.05 for CA1 interneurons, t
test on center/side ratios; Figure 8E). As in REM sleep (Figure 2F;
Mizuseki et al., 2011), aggregate CA1 pyramidal cell firing rates
were not significantly different between maze arms (p = 0.17;
Figure 8E), but the theta phase distribution of their spikes
changed, with more spikes occurring near the peak of CA1 str.
pyramidale theta in the side arms compared to in the center
arm (Figure 8F), leading to significantly greater theta-modulation
of spikes in the center arm compared to the side arms (p < 0.001,
t test on single unit modulation indices and Wilcoxon rank-sum
test on angular dispersion of all spikes). The center-side differ-
ence in theta-modulation of EC3 pyramidal cell spikes (Figure 8F)
was less stark, only becoming significant (p < 0.01) when all
spike phases were aggregated together. Theta-modulation
scores for single CA3 pyramidal cells showed significantly
greater theta modulation in the center arm (when referenced to
local theta phase; p < 0.01, t test), though the aggregated spike
phase distributionwas not significantly moremodulated. Overall,
these experiments demonstrate that the changing balance of
CA3 and EC3 inputs during different phases of a hippocam-
pus-dependent memory task can affect the theta organization
of both gamma activity and spiking in CA1.
DISCUSSION
Pathway-Specific Gamma Rhythms ArePhase-Coordinated by Theta OscillationsOur findings support previous observations that gammaS oscilla-
tions occur on the descending phase of theta in the CA1 pyrami-
dal layer (Figure 3), brought about by the gamma-timed spiking
of CA3 pyramidal cells and CA1 interneurons (Figures 6A and
7C; Bragin et al., 1995; Csicsvari et al., 2003; Mizuseki et al.,
2009; Colgin et al., 2009; Zemankovics et al., 2013), and that
this CA3-CA1 gamma coupling is strongest duringmemory recall
(Figure 8;Montgomery and Buzsaki, 2007). A distinct and higher-
frequency gammaM pattern is dominant in the LFP near the peak
of the theta cycle (Figure 3; Belluscio et al., 2012), coincident with
increased firing of EC3 pyramidal neurons and their excitation of
the distal apical dendrites of CA1 pyramidal cells (current sink)
(Figure 7C; Mizuseki et al., 2009; Buzsaki et al., 1986). The
CA1 output is signaled by increased power above 100 Hz in
str. pyramidale (Colgin et al., 2009; Belluscio et al., 2012;
Scheffer-Teixeira et al., 2013), and a large fraction of pyramidal
neurons are phase-locked to gammaF patterns in a band-
limited manner across several hundred micrometers (Figure 7A).
Gamma coherence is highwithin the same dendritic layer but low
across layers (Figure 5; Csicsvari et al., 2003; Montgomery and
Buzsaki, 2007).
While the phase and frequency separations between the
EC3 and CA3 inputs are consistent with previous reports, our
Neuron 84, 470–485, October 22, 2014 ª2014 Elsevier Inc. 479

CE
NT
ER
Runningwheel
SIDE SIDE
Waterport
Waterport
Waterport
Waterport
CE
NT
ER
Delay
SIDESIDE
50
250
200
150
100
5 10
50
250
200
150
100
5 10
50
250
200
150
100
5 100
Δ MI
CE
NT
ER
− S
IDE
7×10⁻³
phase freq. (Hz)phase freq. (Hz)phase freq. (Hz)
ampl
itude
freq
. (H
z)
CA1pyr IC rad IC lm IC
**
***
***
lmradCA1pyr
1
3
5
MI r
atio
CE
NT
ER
/SID
E
0
1
CA1pyr.
EC3pyr.
CA1int.
* **
CA3pyr.
firin
g ra
te r
atio
CE
NT
ER
/SID
E
0 180 360 540 720
0.06
0.08
0.1
0.012
prob
abili
ty
0 180 360 540 720
0.06
0.1
0.14
prob
abili
ty
0 180 360 540 720
0.08
0.09
0.1
prob
abili
ty
CENTERSIDEmean across units
+/– s.e.m.
sum across units
EC3 theta phase
CA3pyr.
EC3pyr.
CA1pyr.
C
D
E
F
***
CA1 ICs
unit type
A B Figure 8. Task-Dependent Changes in CA3-
EC3 Input Balance Are Reflected in Theta-
Gamma LFP Coupling and CA1 Spiking.
(A) Example running trajectories during one
session of a hippocampus-dependent delayed
alternation T maze task. We used ICA to compare
CA1 LFP components (ICs) during center arm
running (CENTER, red) to running in side arms
(SIDE, blue).
(B) The theta modulation indices (MI) for CA1 ICs
were significantly greater during CENTER running
compared to SIDE (t test).
(C) Differences in the theta modulation of the
gamma spectra of each IC showed that the
strongest changes were at the gamma frequencies
characteristic of each afferent pathway (compare
Figure 2A).
(D) Example trajectories during one session of a
similar delayed alternation task with wheel running
during the delay period (Pastalkova et al., 2008),
which was performed by the animals used in the
unit analyses.
(E) Population firing rate ratios within individual
sessions revealed that the CA3 pyramidal cells
were significantly more active during CENTER
running compared to SIDE (t test). CA1 in-
terneurons also fired at significantly greater rates in
CENTER. Across sessions, the measured CA1 and
EC3 pyramidal cell population rates were not
consistently different in CENTER versus SIDE
running (p > 0.05).
(F) Theta phase (EC3 phase reference) distribu-
tion of spiking in CA1 (top), CA3 (middle), and
EC3 (bottom) pyramidal cell populations during
CENTER to SIDE running. Lines show the distri-
bution when spike phases were summed across
all clustered pyramidal cells, dashed lines
(shading) show mean (±SEM) across single units
firing > 30 spikes during CENTER and SIDE
epochs. Significance thresholds: */**/***p < 0.05/
0.01/0.001.
Neuron
Theta-Gamma Coupling in EC-Hippocampal Networks
findings are at variance with the postulated theta phase assign-
ment of EC3-mediated gamma bursts by Colgin et al. (2009). In
the latter study, the authors suggested that the CA3-driven
gammaS is followed by an EC input-driven faster gamma burst
in the 65–140 Hz range at the trough of the theta cycle. One po-
tential source of the conflicting results is the use of single site
recordings in the Colgin et al. study, which is not sufficient to
decompose the spatial origin of the respective gamma genera-
tors (Buzsaki et al., 2012; Einevoll et al., 2013; Fernandez-Ruiz
and Herreras, 2013; Lasztoczi and Klausberger, 2014). While
we also found significant phase coupling between entorhinal
LFPs and unit spiking and gammaM LFPs in CA1 (Figures 5D,
480 Neuron 84, 470–485, October 22, 2014 ª2014 Elsevier Inc.
5E, and 7C), our analysis revealed that
such coupling reflected synaptic cur-
rents in the dendritic layers but without
effectively entraining spikes of pyramidal
cells (Figure 7D; see also Lasztoczi and
Klausberger, 2014; Yamamoto et al.,
2014).
In contrast to the framework put forward by Colgin et al.
(2009), we find that the maximal firing of EC3 pyramidal cells
and the associated gammaM-band synaptic currents in the
CA1 str. lacunosum-moleculare occur, on average, at the peak
of the theta cycle (Buzsaki et al., 1986; Brankack et al., 1993; Ka-
mondi et al., 1998; Montgomery et al., 2009; Mizuseki et al.,
2009; Benito et al., 2014), before the dominant CA3-mediated
gammaS on the descending phase of theta (Figure 3E). Further-
more, the theta phase separation of EC3 spiking (Mizuseki et al.,
2009) and gamma oscillations (Figure 3) at the theta peak and the
CA1 spiking (Mizuseki et al., 2009) and perisomatic fast-gamma
patterns (Figure 3) at the theta trough (Colgin et al., 2009;

Neuron
Theta-Gamma Coupling in EC-Hippocampal Networks
Belluscio et al., 2012) imply that fast gamma activity may not be
used effectively as a mechanism of communication between
CA1 and its afferent regions. Even during REM, when a substan-
tial amount of CA1 spiking (Figure 6E; Mizuseki et al., 2011) and
gamma activity (Figure 3B; Belluscio et al., 2012) coincides with
EC3 input at the theta peak (Mizuseki et al., 2011), spiking in CA1
was still not coherent with EC3 gamma oscillations (Figure 7D).
Lasztoczi and Klausberger (2014) also implicated EC input to
CA1 in generating dendritic (but not perisomatic) synaptic cur-
rents, but in the slow gamma band. Their results, however,
were obtained under urethane anesthesia, which has been
shown to alter EC input to CA1 (Stewart et al., 1992; Buzsaki,
2002). Their recordings in awake mice showed theta-modulated
gamma in str. lacunosum-moleculare with similar frequencies to
those we found (see also Yamamoto et al., 2014).
Cooperative-Competitive Influence of EC and CA3 onCA1 OutputThe firing rate changes of CA3 and EC3 principal cells can at
least partially account for the CA1 firing patterns and gamma
oscillations we observed both across brain states and in the
T maze task. These two major inputs can either cooperate or
compete, depending on the nature of the task (Dvorak-Carbone
and Schuman, 1999a, 1999b; Remondes and Schuman, 2002;
Golding et al., 2002; Dudman et al., 2007; Han and Heinemann,
2013). During the recall phase (center arm) of the T maze task,
the CA3 and EC3 inputs may cooperatively increase their influ-
ence on CA1 (Montgomery and Buzsaki, 2007; Yamamoto
et al., 2014). Properly timed CA3 and EC3 input can also become
more effective through suppression of feedforward inhibition
(Buzsaki et al., 1995; Yeckel and Berger, 1990; Leao et al.,
2012; Basu et al., 2013) or facilitation of mechanisms that can
overcome inhibition (Remondes and Schuman, 2002; Jarsky
et al., 2005; Takahashi and Magee, 2009).
The competition between the two major pathways was illus-
trated here during REM sleep and in the T maze side arms,
when firing rates of CA3 pyramidal neurons decreased (Fig-
ure 2F; Montgomery et al., 2008) in parallel with reductions in
the power of gammaS in CA1 str. radiatum and spike-LFP
phase-locking between CA3 pyramidal cells and CA1 LFP (Fig-
ures 2, 7C, and 7E). This reduced CA3 output coincides with
increased firing of EC3 neurons and elevated gammaM power
in the str. lacunosum-moleculare (Figure 2) and shifted theta
phase preferences of a significant fraction of CA1 pyramidal neu-
rons from the trough to the peak (Poe et al., 2000; Mizuseki et al.,
2011). Similar mechanisms may also be involved during explora-
tion of a novel environment (Manns et al., 2007; Lever et al.,
2010). Additional experiments are required to disentangle the
roles of the medial and lateral entorhinal cortical inputs (Har-
greaves et al., 2005; Igarashi et al., 2014), as well as working
memory-related links to the medial prefrontal cortex through
the thalamic nucleus reuniens (Vertes et al., 2007), all of which
target str. lacunosum-moleculare.
The increased response of CA1 neurons to the direct EC3
input when CA3 input is diminished can explain why, after lesion
of the CA3 input, place-related firing of CA1 pyramidal cells can
persist (Brun et al., 2008). The shift in influence can also explain
why spatial information encoded by CA1 pyramidal cells varies
as a function of their position in the proximo-distal axis (Figure 4;
Henriksen et al., 2010). One potential substrate of the CA3-EC3
competition is the O-LM to bistratified interneuron inhibitory
connection. Increased firing of O-LM interneurons near the theta
trough (Klausberger and Somogyi, 2008; Varga et al., 2012) sup-
presses inputs to the distal dendrites, whereas it indirectly disin-
hibits dendritic segments in str. oriens and radiatum (Leao et al.,
2012), thereby facilitating the effectiveness of the CA3 input on
CA1 pyramidal cells.
Directionality and Frequency Dependence ofSpike-LFP CouplingThe term ‘‘spike-LFP coupling’’ has at least two implied physio-
logical mechanisms: spikes of an upstream network can ge-
nerate coherent LFP patterns in their target dendritic domains,
or, in the reverse direction, oscillations in the upstream network
(reflected in the LFP) can be phase-locked to the spikes of the
downstream population (Figures 6 and 7). While the former rela-
tionship can be strong, we found that the latter is typically weak
for pyramidal cells, especially at high frequencies. LFP gamma
oscillations in the dendritic layers poorly reflected the timing of
the CA1 pyramidal cell spikes (Figure 7), consistent with attenu-
ation and low-pass filtering of distal dendritic currents (Golding
et al., 2005; Vaidya and Johnston, 2013), combined with inter-
fering contributions from other excitatory inputs, inhibitory cur-
rents, and volume-conducted signals. Additionally, network
mechanisms that prevent spike entrainment by incoming
gamma bursts may be at work (Pouille and Scanziani, 2001).
This is in line with previous in vivo observations showing that
even synchronous fast gamma outputs from CA3 often fail to
entrain CA1 neurons (Csicsvari et al., 2000; Sullivan et al.,
2011; Carr et al., 2012).
While principal cells in the superficial layers of neocortex are
more electrotonically compact (Zador et al., 1995), which could
perhaps enable cortical circuits to more effectively employ
gamma synchronization as a mechanism for selective interre-
gional communication (Singer, 1993; Fries, 2005), this hypothe-
sis remains hotly debated (Shadlen and Movshon, 1999; Kopell
et al., 2000; Fries, 2009; Ray and Maunsell, 2010; Fell and Ax-
macher, 2011; Bosman et al., 2012; Akam and Kullmann, 2012;
Jia et al., 2013; Srinath and Ray, 2014). In our analysis, LFP-spike
coupling between CA1 units and CA3 or EC3 LFP was mostly
attributable to phase-locking of interneurons (Figure 6). Feedfor-
ward connections to interneurons (Buzsaki, 1984; Isaacson and
Scanziani, 2011), combined with their strong synchronization
mechanisms (Galarreta and Hestrin, 2001; Bartos et al., 2007;
Hu et al., 2010), could potentially underlie much of the bidirec-
tional gamma synchronization reported across cortical regions
(Gregoriou et al., 2009, 2012; Brunet et al., 2014). While we do
not rule out that such synchronization may be useful for
enhancing synaptic communication, our results do not provide
support for fast gamma spike-spike synchronization between
principal cells mediating communication between regions.
Yet, a fraction of CA1 pyramidal cells was significantly locked
to the phase of str. radiatum gamma rhythms, typically in the
slow gamma band (Figure 7E). Such transient coupling is likely
to be conveyed primarily by perisomatic interneurons, which
have extensive dendritic arbors in the str. radiatum (Freund
Neuron 84, 470–485, October 22, 2014 ª2014 Elsevier Inc. 481
Neuron
Theta-Gamma Coupling in EC-Hippocampal Networks
and Buzsaki, 1996) and fire preferentially on the descending
slope of the theta oscillation (Klausberger and Somogyi, 2008).
A potential conduit of gamma coupling between EC3 and CA1
pyramidal cells is the axo-axonic (chandelier) interneuron, since
the majority of its dendrites arborize in str. lacunosum-molecu-
lare, and they fire preferentially on the peak of the theta cycle
(Klausberger and Somogyi, 2008), coincident with the timing of
the EC3 input and emergence of gammaM. Such mechanisms
may underlie the weak but significant modulation of multiunit
spiking at gammaM frequencies (Figure S6).
Although interregional transfer of rhythms at high frequencies
was poor, a surprisingly large number of CA1 pyramidal cells
were phase-locked to the local gammaF/epsilon band. Power in-
creases in this band may reflect a true network oscillation or un-
coordinated spiking (Ray and Maunsell, 2011; Belluscio et al.,
2012; Schomburg et al., 2012). Spike contamination being the
exclusive source of all fast LFP is unlikely, because spike-LFP
coupling in the epsilon band was present when LFP was
sampled 200–600 mm from the spike detection site (Figure S6).
Additional contributions may arrive from concerted IPSCs in
the perisomatic region of pyramidal cells, triggered by pyramidal
cell spikes (Csicsvari et al., 1998). However, neither spike
contamination nor the disynaptic explanation hypothesis ex-
plains why local phase locking of spikes in the gammaF/epsilon
band is most prominent in the CA1 region during both theta (pre-
sent findings) and sharp wave ripples (Sullivan et al., 2011;
Schomburg et al., 2012). The ripple-frequency synchronization
of CA1 pyramidal cells may be a reflection of high-frequency
resonance properties of the CA1 circuit (Sullivan et al., 2011;
Csicsvari et al., 2000; Brunel andWang, 2003; Stark et al., 2014).
Overall, our experiments demonstrate that layer-specific
gamma oscillations in the hippocampus reliably identify the tem-
poral dynamics of the afferent inputs (spike-LFP coupling). LFP
features may therefore aid in identifying processes related to
specific memory processes (Montgomery and Buzsaki, 2007;
Bieri et al., 2014), but they are poor predictors of interregional
coupling of pyramidal cell spikes. Our results instead suggest
that temporal coordination (spike-spike coupling) in the entorhi-
nal-hippocampal system is mainly supported by theta and low-
mid frequency gamma oscillations, but much less so by fast
gamma coherence.
EXPERIMENTAL PROCEDURES
Nine male Long-Evans rats and three male Sprague-Dawley rats (250–400 g,
3–6 months old) were trained in a variety of testing environments and tasks
and implanted with movable, multiple-site silicon probes in the dorsal hippo-
campus, with three of these rats having an additional probe in the dorsocaudal
medial entorhinal cortex (EC). Data were recorded while animals performed
maze tasks and slept in their home cages. The surgeries, probes, behavioral
training, and spike-sorting procedures were described in detail previously
(Montgomery and Buzsaki, 2007; Montgomery et al., 2008; Diba and Buzsaki,
2008; Pastalkova et al., 2008; Mizuseki et al., 2009; Berenyi et al., 2014). All
protocols were approved by the Institutional Animal Care and Use Committee
of New York University.
Synaptic current generators were decomposed using CSD and ICA of the
LFPs (Fernandez-Ruiz et al., 2012). Spectro-temporal analyses of the activa-
tion strengths of IC extracted from LFPs are indicated by their IC labels
(e.g., CA1pyr, rad, lm), and analyses on LFPs are labeled by their anatomical
location (CA1 str. pyr., str. rad., etc.). Epochs of high theta (4–10 Hz) power
482 Neuron 84, 470–485, October 22, 2014 ª2014 Elsevier Inc.
during locomotion were classified as RUN. Theta episodes during sleep
were classified as REM. Time-resolved spectral decomposition of time series
data was performed using wavelet analysis. Theta phase analyses of wavelet
spectra and unit spiking used the phase extracted from the Hilbert transform
of the 4–12 Hz filtered CA1 str. pyramidale LFP. Subsets of the 32- to 64-elec-
trode recordings are available in the hc-3 data set at http://crcns.org (Mizuseki
et al., 2014). Further details and discussion of the recordings and data ana-
lyses are available as Supplemental Experimental Procedures.
SUPPLEMENTAL INFORMATION
Supplemental Information includes Supplemental Experimental Procedures,
seven figures, and one table and can be found with this article online at
http://dx.doi.org/10.1016/j.neuron.2014.08.051.
AUTHOR CONTRIBUTIONS
E.W.S., A.F.-R., and G.B. designed the analysis of data collected by K.M. and
A.B., with input fromC.A.A. and C.K.; E.W.S., A.F.-R., and K.M. analyzed data;
G.B., E.W.S., and A.F.-R. wrote the manuscript with contributions from all
authors.
ACKNOWLEDGMENTS
This work was supported by the National Institute of Health Grants NS34994
andMH54671 (G.B.) and NS074015 (C.K.), National Science Foundation Grant
SBE 0542013, the Human Frontier Science Program (C.K., G.B.), the James S.
McDonnell Foundation (G.B.), G. Harold and Leila Y. Mathers Charitable Foun-
dation (C.K.), the European Molecular Biology Organization and Fundancion
‘‘La Caixa’’ (A.F.-R.), EU-FP7-ERC-2013-Starting grant (No. 337075; A.B.),
the ‘‘Momentum’’ program of the Hungarian Academy of Sciences (A.B.),
and the Swiss National Science Foundation (C.A.A.). Results consistent with
the present findings have been reported earlier (Sirota et al., 2009, Soc.
Neurosci., abstract). We thank Anton Sirota for many useful discussions and
advice, Azahara Oliva for assistance with LFP analysis, Pilar Garces for
providing code for cross-frequency analysis, Kamran Diba for providing simul-
taneous CA1 and CA3 recordings, John Long and Andres Grosmark for
providing the recording with EMG electrodes, and Jagdish Patel for comments
on the manuscript.
Accepted: August 22, 2014
Published: September 25, 2014
REFERENCES
Ainge, J.A., van der Meer, M.A.A., Langston, R.F., and Wood, E.R. (2007).
Exploring the role of context-dependent hippocampal activity in spatial alter-
nation behavior. Hippocampus 17, 988–1002.
Akam, T.E., and Kullmann, D.M. (2012). Efficient ‘‘communication through
coherence’’ requires oscillations structured to minimize interference between
signals. PLoS Comput. Biol. 8, e1002760.
Amaral, D.G., and Witter, M.P. (1989). The three-dimensional organization of
the hippocampal formation: a review of anatomical data. Neuroscience 31,
571–591.
Aru, J., Aru, J., Priesemann, V., Wibral, M., Lana, L., Pipa, G., Singer, W., and
Vicente, R. (2014) Untangling cross-frequency coupling in neuroscience. arXiv,
arXiv:1405.7965, http://arxiv.org/abs/1405.7965.
Bartos, M., Vida, I., and Jonas, P. (2007). Synaptic mechanisms of synchro-
nized gamma oscillations in inhibitory interneuron networks. Nat. Rev.
Neurosci. 8, 45–56.
Basu, J., Srinivas, K.V., Cheung, S.K., Taniguchi, H., Huang, Z.J., and
Siegelbaum, S.A. (2013). A cortico-hippocampal learning rule shapes inhibi-
tory microcircuit activity to enhance hippocampal information flow. Neuron
79, 1208–1221.

Neuron
Theta-Gamma Coupling in EC-Hippocampal Networks
Belluscio, M.A., Mizuseki, K., Schmidt, R., Kempter, R., and Buzsaki, G.
(2012). Cross-frequency phase-phase coupling between q and g oscillations
in the hippocampus. J. Neurosci. 32, 423–435.
Benito, N., Fernandez-Ruiz, A., Makarov, V.A., Makarova, J., Korovaichuk, A.,
and Herreras, O. (2014). Spatial modules of coherent activity in pathway-spe-
cific LFPs in the hippocampus reflect topology and different modes of presyn-
aptic synchronization. Cereb. Cortex 24, 1738–1752.
Berenyi, A., Somogyvari, Z., Nagy, A.J., Roux, L., Long, J.D., Fujisawa, S.,
Stark, E., Leonardo, A., Harris, T.D., and Buzsaki, G. (2014). Large-scale,
high-density (up to 512 channels) recording of local circuits in behaving ani-
mals. J. Neurophysiol. 111, 1132–1149.
Bieri, K.W., Bobbitt, K.N., and Colgin, L.L. (2014). Slow and fast g rhythms
coordinate different spatial coding modes in hippocampal place cells.
Neuron 82, 670–681.
Bosman, C.A., Schoffelen, J.-M., Brunet, N., Oostenveld, R., Bastos, A.M.,
Womelsdorf, T., Rubehn, B., Stieglitz, T., De Weerd, P., and Fries, P. (2012).
Attentional stimulus selection through selective synchronization between
monkey visual areas. Neuron 75, 875–888.
Bragin, A., Jando, G., Nadasdy, Z., Hetke, J., Wise, K., and Buzsaki, G. (1995).
Gamma (40-100 Hz) oscillation in the hippocampus of the behaving rat.
J. Neurosci. 15, 47–60.
Brankack, J., Stewart, M., and Fox, S.E. (1993). Current source density anal-
ysis of the hippocampal theta rhythm: associated sustained potentials and
candidate synaptic generators. Brain Res. 615, 310–327.
Brun, V.H., Leutgeb, S., Wu, H.-Q., Schwarcz, R., Witter, M.P., Moser, E.I., and
Moser, M.-B. (2008). Impaired spatial representation in CA1 after lesion of
direct input from entorhinal cortex. Neuron 57, 290–302.
Brunel, N., and Wang, X.J. (2003). What determines the frequency of fast
network oscillations with irregular neural discharges? I. Synaptic dynamics
and excitation-inhibition balance. J. Neurophysiol. 90, 415–430.
Brunet, N.M., Bosman, C.A., Vinck, M., Roberts, M., Oostenveld, R.,
Desimone, R., De Weerd, P., and Fries, P. (2014). Stimulus repetition modu-
lates gamma-band synchronization in primate visual cortex. Proc. Natl.
Acad. Sci. USA 111, 3626–3631.
Buzsaki, G. (1984). Feed-forward inhibition in the hippocampal formation.
Prog. Neurobiol. 22, 131–153.
Buzsaki, G. (2002). Theta oscillations in the hippocampus. Neuron 33,
325–340.
Buzsaki, G., and Wang, X.-J. (2012). Mechanisms of gamma oscillations.
Annu. Rev. Neurosci. 35, 203–225.
Buzsaki, G., Leung, L.W., and Vanderwolf, C.H. (1983). Cellular bases of hip-
pocampal EEG in the behaving rat. Brain Res. 287, 139–171.
Buzsaki, G., Czopf, J., Kondakor, I., and Kellenyi, L. (1986). Laminar distribu-
tion of hippocampal rhythmic slow activity (RSA) in the behaving rat: cur-
rent-source density analysis, effects of urethane and atropine. Brain Res.
365, 125–137.
Buzsaki, G., Penttonen, M., Bragin, A., Nadasdy, Z., and Chrobak, J.J. (1995).
Possible physiological role of the perforant path-CA1 projection. Hippocampus
5, 141–146.
Buzsaki, G., Anastassiou, C.A., and Koch, C. (2012). The origin of extracellular
fields and currents—EEG, ECoG, LFP and spikes. Nat. Rev. Neurosci. 13,
407–420.
Cabral, H.O., Vinck, M., Fouquet, C., Pennartz, C.M.A., Rondi-Reig, L., and
Battaglia, F.P. (2014). Oscillatory dynamics and place field maps reflect hippo-
campal ensemble processing of sequence and placememory under NMDA re-
ceptor control. Neuron 81, 402–415.
Canolty, R.T., and Knight, R.T. (2010). The functional role of cross-frequency
coupling. Trends Cogn. Sci. 14, 506–515.
Carr, M.F., Karlsson, M.P., and Frank, L.M. (2012). Transient slow gamma syn-
chrony underlies hippocampal memory replay. Neuron 75, 700–713.
Colgin, L.L., Denninger, T., Fyhn, M., Hafting, T., Bonnevie, T., Jensen, O.,
Moser, M.-B., and Moser, E.I. (2009). Frequency of gamma oscillations routes
flow of information in the hippocampus. Nature 462, 353–357.
Csicsvari, J., Hirase, H., Czurko, A., and Buzsaki, G. (1998). Reliability and
state dependence of pyramidal cell–interneuron synapses in the hippocam-
pus: an ensemble approach in the behaving rat. Neuron 21, 179–189.
Csicsvari, J., Hirase, H., Czurko, A., Mamiya, A., and Buzsaki, G. (1999).
Oscillatory coupling of hippocampal pyramidal cells and interneurons in the
behaving Rat. J. Neurosci. 19, 274–287.
Csicsvari, J., Hirase, H., Mamiya, A., and Buzsaki, G. (2000). Ensemble pat-
terns of hippocampal CA3-CA1 neurons during sharp wave-associated popu-
lation events. Neuron 28, 585–594.
Csicsvari, J., Jamieson, B., Wise, K.D., and Buzsaki, G. (2003). Mechanisms of
gamma oscillations in the hippocampus of the behaving rat. Neuron 37,
311–322.
Diba, K., and Buzsaki, G. (2008). Hippocampal network dynamics constrain
the time lag between pyramidal cells across modified environments.
J. Neurosci. 28, 13448–13456.
Dudman, J.T., Tsay, D., and Siegelbaum, S.A. (2007). A role for synaptic inputs
at distal dendrites: instructive signals for hippocampal long-term plasticity.
Neuron 56, 866–879.
Dvorak-Carbone, H., and Schuman, E.M. (1999a). Long-term depression of
temporoammonic-CA1 hippocampal synaptic transmission. J. Neurophysiol.
81, 1036–1044.
Dvorak-Carbone, H., and Schuman, E.M. (1999b). Patterned activity in stratum
lacunosum moleculare inhibits CA1 pyramidal neuron firing. J. Neurophysiol.
82, 3213–3222.
Einevoll, G.T., Kayser, C., Logothetis, N.K., and Panzeri, S. (2013). Modelling
and analysis of local field potentials for studying the function of cortical cir-
cuits. Nat. Rev. Neurosci. 14, 770–785.
Fell, J., and Axmacher, N. (2011). The role of phase synchronization in memory
processes. Nat. Rev. Neurosci. 12, 105–118.
Fernandez-Ruiz, A., and Herreras, O. (2013). Identifying the synaptic origin of
ongoing neuronal oscillations through spatial discrimination of electric fields.
Front Comput Neurosci 7, 5.
Fernandez-Ruiz, A., Makarov, V.A., Benito, N., and Herreras, O. (2012).
Schaffer-specific local field potentials reflect discrete excitatory events at
gamma frequency that may fire postsynaptic hippocampal CA1 units.
J. Neurosci. 32, 5165–5176.
Fishell, G., and Rudy, B. (2011). Mechanisms of inhibition within the telenceph-
alon: ‘‘where the wild things are’’. Ann. Rev. Neurosci. 34, 535–567.
Freund, T.F., and Buzsaki, G. (1996). Interneurons of the hippocampus.
Hippocampus 6, 347–470.
Fries, P. (2005). A mechanism for cognitive dynamics: neuronal communica-
tion through neuronal coherence. Trends Cogn. Sci. 9, 474–480.
Fries, P. (2009). Neuronal gamma-band synchronization as a fundamental pro-
cess in cortical computation. Annu. Rev. Neurosci. 32, 209–224.
Galarreta, M., and Hestrin, S. (2001). Spike transmission and synchrony detec-
tion in networks of GABAergic interneurons. Science 292, 2295–2299.
Glickfeld, L.L., Roberts, J.D., Somogyi, P., and Scanziani, M. (2009).
Interneurons hyperpolarize pyramidal cells along their entire somatodendritic
axis. Nat. Neurosci. 12, 21–23.
Golding, N.L., Staff, N.P., and Spruston, N. (2002). Dendritic spikes as amech-
anism for cooperative long-term potentiation. Nature 418, 326–331.
Golding, N.L., Mickus, T.J., Katz, Y., Kath, W.L., and Spruston, N. (2005).
Factors mediating powerful voltage attenuation along CA1 pyramidal neuron
dendrites. J. Physiol. 568, 69–82.
Gregoriou, G.G., Gotts, S.J., Zhou, H., and Desimone, R. (2009). High-fre-
quency, long-range coupling between prefrontal and visual cortex during
attention. Science 324, 1207–1210.
Neuron 84, 470–485, October 22, 2014 ª2014 Elsevier Inc. 483

Neuron
Theta-Gamma Coupling in EC-Hippocampal Networks
Gregoriou, G.G., Gotts, S.J., and Desimone, R. (2012). Cell-type-specific syn-
chronization of neural activity in FEF with V4 during attention. Neuron 73,
581–594.
Han, E.B., and Heinemann, S.F. (2013). Distal dendritic inputs control neuronal
activity by heterosynaptic potentiation of proximal inputs. J. Neurosci. 33,
1314–1325.
Hargreaves, E.L., Rao, G., Lee, I., and Knierim, J.J. (2005). Major dissociation
between medial and lateral entorhinal input to dorsal hippocampus. Science
308, 1792–1794.
Hasselmo, M.E., Bodelon, C., and Wyble, B.P. (2002). A proposed function for
hippocampal theta rhythm: separate phases of encoding and retrieval
enhance reversal of prior learning. Neural Comput. 14, 793–817.
Henriksen, E.J., Colgin, L.L., Barnes, C.A., Witter, M.P., Moser, M.-B., and
Moser, E.I. (2010). Spatial representation along the proximodistal axis of
CA1. Neuron 68, 127–137.
Hu, H., Martina, M., and Jonas, P. (2010). Dendritic mechanisms underlying
rapid synaptic activation of fast-spiking hippocampal interneurons. Science
327, 52–58.
Igarashi, K.M., Lu, L., Colgin, L.L., Moser, M.-B., and Moser, E.I. (2014).
Coordination of entorhinal-hippocampal ensemble activity during associative
learning. Nature 510, 143–147.
Isaacson, J.S., and Scanziani, M. (2011). How inhibition shapes cortical activ-
ity. Neuron 72, 231–243.
Jarsky, T., Roxin, A., Kath, W.L., and Spruston, N. (2005). Conditional dendritic
spike propagation following distal synaptic activation of hippocampal CA1 py-
ramidal neurons. Nat. Neurosci. 8, 1667–1676.
Jia, X., Tanabe, S., and Kohn, A. (2013). g and the coordination of spiking ac-
tivity in early visual cortex. Neuron 77, 762–774.
Kamondi, A., Acsady, L., Wang, X.J., and Buzsaki, G. (1998). Theta oscillations
in somata and dendrites of hippocampal pyramidal cells in vivo: activity-
dependent phase-precession of action potentials. Hippocampus 8, 244–261.
Klausberger, T., and Somogyi, P. (2008). Neuronal diversity and temporal dy-
namics: the unity of hippocampal circuit operations. Science 321, 53–57.
Kopell, N., Ermentrout, G.B., Whittington, M.A., and Traub, R.D. (2000).
Gamma rhythms and beta rhythms have different synchronization properties.
Proc. Natl. Acad. Sci. USA 97, 1867–1872.
Lasztoczi, B., and Klausberger, T. (2014). Layer-specific GABAergic control of
distinct gamma oscillations in the CA1 hippocampus. Neuron 81, 1126–1139.
Leao, R.N., Mikulovic, S., Leao, K.E., Munguba, H., Gezelius, H., Enjin, A.,
Patra, K., Eriksson, A., Loew, L.M., Tort, A.B.L., and Kullander, K. (2012).
OLM interneurons differentially modulate CA3 and entorhinal inputs to hippo-
campal CA1 neurons. Nat. Neurosci. 15, 1524–1530.
Lever, C., Burton, S., Jeewajee, A., Wills, T.J., Cacucci, F., Burgess, N., and
O’Keefe, J. (2010). Environmental novelty elicits a later theta phase of firing
in CA1 but not subiculum. Hippocampus 20, 229–234.
Lisman, J.E., and Jensen, O. (2013). The q-g neural code. Neuron 77, 1002–
1016.
Manns, J.R., Zilli, E.A., Ong, K.C., Hasselmo,M.E., and Eichenbaum, H. (2007).
Hippocampal CA1 spiking during encoding and retrieval: relation to theta
phase. Neurobiol. Learn. Mem. 87, 9–20.
Mizuseki, K., Sirota, A., Pastalkova, E., and Buzsaki, G. (2009). Theta oscilla-
tions provide temporal windows for local circuit computation in the entorhi-
nal-hippocampal loop. Neuron 64, 267–280.
Mizuseki, K., Diba, K., Pastalkova, E., and Buzsaki, G. (2011). Hippocampal
CA1 pyramidal cells form functionally distinct sublayers. Nat. Neurosci. 14,
1174–1181.
Mizuseki, K., Royer, S., Diba, K., and Buzsaki, G. (2012). Activity dynamics and
behavioral correlates of CA3 and CA1 hippocampal pyramidal neurons.
Hippocampus 22, 1659–1680.
Mizuseki, K., Diba, K., Pastalkova, E., Teeters, J., Sirota, A., and Buzsaki, G.
(2014). Neurosharing: large-scale data sets (spike, LFP) recorded from the hip-
pocampal-entorhinal system in behaving rats. F1000Res 3, 98.
484 Neuron 84, 470–485, October 22, 2014 ª2014 Elsevier Inc.
Montgomery, S.M., and Buzsaki, G. (2007). Gamma oscillations dynamically
couple hippocampal CA3 and CA1 regions during memory task performance.
Proc. Natl. Acad. Sci. USA 104, 14495–14500.
Montgomery, S.M., Sirota, A., and Buzsaki, G. (2008). Theta and gamma coor-
dination of hippocampal networks during waking and rapid eye movement
sleep. J. Neurosci. 28, 6731–6741.
Montgomery, S.M., Betancur, M.I., and Buzsaki, G. (2009). Behavior-depen-
dent coordination of multiple theta dipoles in the hippocampus. J. Neurosci.
29, 1381–1394.
Naber, P.A., Lopes da Silva, F.H., and Witter, M.P. (2001). Reciprocal connec-
tions between the entorhinal cortex and hippocampal fields CA1 and the sub-
iculum are in register with the projections from CA1 to the subiculum.
Hippocampus 11, 99–104.
Nicholson, C., and Freeman, J.A. (1975). Theory of current source-density
analysis and determination of conductivity tensor for anuran cerebellum.
J. Neurophysiol. 38, 356–368.
O’Keefe, J., and Nadel, L. (1978). The Hippocampus as a Cognitive Map.
(Oxford: Clarendon Press).
O’Keefe, J., and Recce, M.L. (1993). Phase relationship between hippocampal
place units and the EEG theta rhythm. Hippocampus 3, 317–330.
Pastalkova, E., Itskov, V., Amarasingham, A., and Buzsaki, G. (2008). Internally
generated cell assembly sequences in the rat hippocampus. Science 321,
1322–1327.
Poe, G.R., Nitz, D.A., McNaughton, B.L., and Barnes, C.A. (2000). Experience-
dependent phase-reversal of hippocampal neuron firing during REM sleep.
Brain Res. 855, 176–180.
Pouille, F., and Scanziani, M. (2001). Enforcement of temporal fidelity in pyra-
midal cells by somatic feed-forward inhibition. Science 293, 1159–1163.
Ray, S., andMaunsell, J.H.R. (2010). Differences in gamma frequencies across
visual cortex restrict their possible use in computation. Neuron 67, 885–896.
Ray, S., and Maunsell, J.H.R. (2011). Different origins of gamma rhythm and
high-gamma activity in macaque visual cortex. PLoS Biol. 9, e1000610.
Remondes, M., and Schuman, E.M. (2002). Direct cortical input modulates
plasticity and spiking in CA1 pyramidal neurons. Nature 416, 736–740.
Scheffer-Teixeira, R., Belchior, H., Leao, R.N., Ribeiro, S., and Tort, A.B.L.
(2013). On high-frequency field oscillations (>100 Hz) and the spectral leakage
of spiking activity. J. Neurosci. 33, 1535–1539.
Schomburg, E.W., Anastassiou, C.A., Buzsaki, G., and Koch, C. (2012). The
spiking component of oscillatory extracellular potentials in the rat hippocam-
pus. J. Neurosci. 32, 11798–11811.
Shadlen, M.N., and Movshon, J.A. (1999). Synchrony unbound: a critical eval-
uation of the temporal binding hypothesis. Neuron 24, 67–77, 111–125.
Singer, W. (1993). Synchronization of cortical activity and its putative role in in-
formation processing and learning. Annu. Rev. Physiol. 55, 349–374.
Sirota, A., Montgomery, S., Fujisawa, S., Isomura, Y., Zugaro, M., and Buzsaki,
G. (2008). Entrainment of neocortical neurons and gamma oscillations by the
hippocampal theta rhythm. Neuron 60, 683–697.
Srinath, R., andRay, S. (2014). Effect of amplitude correlations on coherence in
the local field potential. J. Neurophysiol. 112, 741–751.
Stark, E., Roux, L., Eichler, R., Senzai, Y., Royer, S., and Buzsaki, G. (2014).
Pyramidal cell-interneuron interactions underlie hippocampal ripple oscilla-
tions. Neuron 83, 467–480.
Stewart, M., Quirk, G.J., Barry, M., and Fox, S.E. (1992). Firing relations of
medial entorhinal neurons to the hippocampal theta rhythm in urethane anes-
thetized and walking rats. Exp. Brain Res. 90, 21–28.
Sullivan, D., Csicsvari, J., Mizuseki, K., Montgomery, S., Diba, K., and Buzsaki,
G. (2011). Relationships between hippocampal sharp waves, ripples, and fast
gamma oscillation: influence of dentate and entorhinal cortical activity.
J. Neurosci. 31, 8605–8616.
Takahashi, H., and Magee, J.C. (2009). Pathway interactions and synaptic
plasticity in the dendritic tuft regions of CA1 pyramidal neurons. Neuron 62,
102–111.

Neuron
Theta-Gamma Coupling in EC-Hippocampal Networks
Tort, A.B.L., Komorowski, R.W., Manns, J.R., Kopell, N.J., and Eichenbaum,
H. (2009). Theta-gamma coupling increases during the learning of item-
context associations. Proc. Natl. Acad. Sci. USA 106, 20942–20947.
Tort, A.B.L., Komorowski, R., Eichenbaum, H., and Kopell, N. (2010).
Measuring phase-amplitude coupling between neuronal oscillations of
different frequencies. J. Neurophysiol. 104, 1195–1210.
Vaidya, S.P., and Johnston, D. (2013). Temporal synchrony and gamma-to-
theta power conversion in the dendrites of CA1 pyramidal neurons. Nat.
Neurosci. 16, 1812–1820.
Varga, C., Golshani, P., and Soltesz, I. (2012). Frequency-invariant temporal
ordering of interneuronal discharges during hippocampal oscillations in awake
mice. Proc. Natl. Acad. Sci. USA 109, E2726–E2734.
Vertes, R.P., Hoover, W.B., Szigeti-Buck, K., and Leranth, C. (2007). Nucleus
reuniens of themidline thalamus: link between themedial prefrontal cortex and
the hippocampus. Brain Res. Bull. 71, 601–609.
Witter, M.P., Groenewegen, H.J., Lopes da Silva, F.H., and Lohman, A.H.
(1989). Functional organization of the extrinsic and intrinsic circuitry of the par-
ahippocampal region. Prog. Neurobiol. 33, 161–253.
Wood, E.R., Dudchenko, P.A., Robitsek, R.J., and Eichenbaum, H. (2000).
Hippocampal neurons encode information about different types of memory
episodes occurring in the same location. Neuron 27, 623–633.
Yamamoto, J., Suh, J., Takeuchi, D., and Tonegawa, S. (2014). Successful
execution of working memory linked to synchronized high-frequency gamma
oscillations. Cell 157, 845–857.
Yeckel, M.F., and Berger, T.W. (1990). Feedforward excitation of the
hippocampus by afferents from the entorhinal cortex: redefinition of
the role of the trisynaptic pathway. Proc. Natl. Acad. Sci. USA 87,
5832–5836.
Zador, A.M., Agmon-Snir, H., and Segev, I. (1995). The morphoelectrotonic
transform: a graphical approach to dendritic function. J. Neurosci. 15, 1669–
1682.
Zanos, T.P., Mineault, P.J., and Pack, C.C. (2011). Removal of spurious corre-
lations between spikes and local field potentials. J. Neurophysiol. 105,
474–486.
Zemankovics, R., Veres, J.M., Oren, I., and Hajos, N. (2013). Feedforward
inhibition underlies the propagation of cholinergically induced gamma
oscillations from hippocampal CA3 to CA1. J. Neurosci. 33, 12337–
12351.
Neuron 84, 470–485, October 22, 2014 ª2014 Elsevier Inc. 485