thespatial-temporaldynamicsofchina’schanging
TRANSCRIPT
Hindawi Publishing CorporationUrban Studies ResearchVolume 2012, Article ID 162965, 13 pagesdoi:10.1155/2012/162965
Research Article
The Spatial-Temporal Dynamics of China’s ChangingUrban Hierarchy (1950–2005)
Xuwei Chen and Richard Greene
Department of Geography, Northern Illinois University, Dekalb, IL 60115, USA
Correspondence should be addressed to Xuwei Chen, [email protected]
Received 17 July 2012; Revised 24 September 2012; Accepted 3 October 2012
Academic Editor: Bo-Sin Tang
Copyright © 2012 X. Chen and R. Greene. This is an open access article distributed under the Creative Commons AttributionLicense, which permits unrestricted use, distribution, and reproduction in any medium, provided the original work is properlycited.
This paper examines the dynamic spatial and temporal patterns of China’s urban hierarchy from 1950 to 2005. We limit thestudy to mainland China’s 137 urban agglomerations of 750,000 or more population as of 2005. The paper improves upon aclassic approach to measuring shifting ranks within an urban hierarchy by applying advanced spatial analysis techniques. We usea Getis-Ord G∗i , a space-time Moran scatter plot, and dynamic LISA paths to examine the regional difference and change for theseurban agglomerations. Our study revealed a north-south divide in the changing urban hierarchy of China after 1990. The analysisdemonstrated that the spatial and temporal shift of urban dominance in China was closely associated with policy and economicfactors. The paper concludes with a discussion of the differences across the six different time periods of change from 1950 to 2005.
1. Introduction
The United Nations estimates on urban population show thatChina has urbanized rapidly between 1985 and 2005 with a23 percent urban population in 1985 that had grown to 40percent by 2005 [1]. This is even more remarkable when con-sidering newer 2011 estimates that show 311,760,000 peopleliving in China’s 237 urban agglomerations with 500,000or more population [2]. This makes China the countrywith the world’s largest population living in large urbanagglomerations. A number of warnings often accompanysuch world urban comparisons, especially when Chinesecities are involved as they are often overbounded—that is,referring to a larger territory, which may include a substantialrural population [3]. The use of an urban agglomerationdefinition by the United Nations lessens these concerns asit is a more standardized measure. An urban agglomerationis composed of a contiguous territory of a built-up areawith urban density levels regardless of the placement ofadministrative boundaries [4]. Therefore, it is safe to saythat China’s recent urban growth is spectacular in bothcontemporary and historical contexts.
Under this background, our study aims to examine thedynamic spatial and temporal patterns of China’s urban
hierarchy from 1950 to 2005. We limit the study to mainlandChina’s 137 urban agglomerations of 750,000 or morepopulation as of 2005. Since 1950, China’s population hasexperienced steady growth. Although the urban populationgrew dramatically particularly after the 1990s, there was aconsiderable variation in growth rates among these urbanagglomerations. As a result, China’s urban agglomerationhierarchy has changed significantly in this period as someurban agglomerations have ascended while others havedescended.
Mapping population change for these urban agglomera-tions is dismissed at the outset of this paper as populationchange is not necessarily related to rank changes as anurban agglomeration can actually decrease in rank eventhough it has increased in population, for instance, thelatter can happen if an urban agglomeration lower in rankhas increased its population at a faster rate. To overcomethe shortcoming of mapping population change as a wayto visualize change in urban dominance, this study uses arank mobility index (RMI) for analyzing the rank changesfor China’s urban agglomerations [5, 6]. An RMI comparesthe change in rank of cities within a city system betweentwo points of time instead of strictly comparing populationchange. Therefore, the RMI can capture the dynamics

2 Urban Studies Research
of urban ranks in relation to population changes. Pleaserefer to Section 3 for details on the computation of RMIvalues. Based on the urban population of the 137 urbanagglomerations from 1950 to 2005, we mapped the RMIvalues and examined the rank change dynamics using localspatial autocorrelation techniques—Getis-Ord G∗i , space-time Moran scatter plot, and LISA path. The results helpedreveal regional differences in the changing picture of China’surban hierarchy. They also demonstrated the great potentialof using the RMI to explore China’s urban hierarchy in thepath of this spectacular urbanization process.
The remainder of the paper is organized as follows. Thesecond section reviews other studies on China’s urbanizationand its urban hierarchy. The third section describes ourresearch methods. The fourth section discusses our resultsand findings. The last section concludes the paper with adiscussion of the significance of our findings and futurework.
2. Background and Related Work
2.1. China’s Urbanization. The United Nations PopulationFund (UNFPA) noted that for the first time in humanhistory, the world’s urban population had surpassed therural population in 2008 [7]. On this news, China’s rapidurbanization rate began to attract the world attention as itwas clearly a large player in the global trend. When Chinawas established in 1949, there were only 132 cities (definedby local administrative and jurisdictional entities) with atotal of about 39.49 million urban population, about 7.3%of the country’s population [8]. Owing to economic reformsand globalization, China’s urbanization started to acceleratesince the 1980s. In 1980, only 51 cities had half a millioninhabitants in China. Another 50 cities joined this groupbetween 1980 and 1995 and 134 cities were added between1995 and 2010 [9]. Although the overall population growthhas slowed down, China’s 2010 census revealed that nearlyhalf of the country’s population, 49.7%, now lived in itsurban areas compared to just 19% in 1980 [10].
While the rapid pace of urban development in China waswidely understood to be a result of economic development,economic factors were not the sole determinant in China’surbanization process. Based on a decade of research onChinese urbanism, Kirkby argued that Chinese urbanismwas more of an ideological result than one of economicconsiderations in the early stages and such a situationchanged after the open-door policy, which emphasizedeconomic growth that started to be implemented in late1978 [11]. Still, as pointed out by Fan, compared toWestern countries, China’s city system has been shapedmore by institutional factors than by economic factors.Urban and regional development policies, changes in theurban administrative system, and state and local governmentinterests together all played an important role in China’scity system today [12]. Lin also noted that as the centersfor economic and social transformation, the developmentof cities in China was largely attributed to both growth andnongrowth considerations [13].
Starting from a planned economy and migrating to amarket economy with Chinese characteristics, the Chinesegovernment played an important role in its urbanizationprocess. Zhao divided the course of urbanization in Chinainto four stages: (1) Recovery Phase (1949–1957); (2) Capri-cious Phase (1958–1965); (3) Stagnant Phase (1966–1982);and (4) Rapid Development Phase (1983–now) [14]. In thefirst three stages, the central government dominated theurbanization plans and policies. Local governments had verylimited power in the decisions of their development. Seekinga fast industrialization of the economy, the first five-yearplan (1953–1957) pushed the urbanization process mainlyby incentivizing peasant immigration to cities in the recoveryphase. During the capricious stage, the Great Leap Forwardplan created a chaotic urbanization process. During the firstthree years (1958–1961), millions of people flushed to citiesunder the flag of economic expansion and later on wereordered to go back to the country as a consequence of famine.Yet the 10-year Cultural Revolution from 1966–1976 heavilydestroyed the economy. The urbanization level was broughtdown to about 8.5% in the third stage [1]. In the fourthstage the economic reform empowered local governmentsin their economic development. The implementation of theopen-door policy in 1978 and thereafter the publication ofthe regulations on temporal urban residents brought moreopportunities to cities. These policies triggered and pushedwaves of peasant immigrants to seek jobs in cities. China’surbanization then accelerated at a pace and scale never seenbefore in world history.
The fast movement of urbanization in China sparkedexcitement and interest among urban scholars on theunderlying factors, patterns, and implications of urbanchange, as well as inquiring into the impacts, ranging frompolitical, social, and economic issues, to environmental,housing, migration, and other urban land use challenges,and so forth [15, 16]. It is worth noting that in studyingChina’s urbanization, scholars have called into questionthe reliability of the data. Lin pointed out that while theofficial data are subject to error and discrepancy, they doserve as a useful source for understanding the overall trendspatterns, and changes of Chinese cities [17]. Concerning theinconsistency of urban definition and urban population datain China, Shen has done extensive work on clarifying andestimating the urban population of China [18–21]. Basedon the concept of dual-track urbanization, he proposed anapproach to estimating urban agricultural and nonagricul-tural population separately. He argued that because of themixed character of development from a planned economyto a market economy in China, a comprehensive dual-track urbanization approach would provide a more realisticestimation of urban population in the transition. His studiesprovide valuable insights on determining urban populationmore consistently.
Lin analyzed changes in nonagricultural land as a resultof China’s urbanization between 1984 and 1996 [17]. Hefound that in most cases, small- and medium-sized citiesexperienced higher growth rates and claimed more landfor urban expansion than did larger cities. In particular, hefound that about two-thirds of urban land increases were
Urban Studies Research 3
concentrated in East China. Among the superlarge cities(with a population over 2 million), there was a clear patternof change that could be discerned moving from east to west.Cities in the east had the highest increase of land area,followed by the cities in the central, and the smallest gainsin land area were within the cites of the western regions.In a very recent study, Ding examined the overall urbangrowth pattern in China [22]. It provided a comprehensiveassessment of emerging urban forms and their impacts onurban sustainability. He suggested that to promote smartgrowth, mixed land use development may not be appropriatein the case of Chinese cities.
Focusing on the Yangtze River Delta megapolitan region,Tian et al. investigated the spatial and temporal dynamicpattern of urbanization process in five urban areas (Shang-hai, Nanjing, Suzhou, Wuxi, and Changzhou) from 1990 to2005 [23]. Their findings suggest that policy and economicdevelopment in that megapolitan region shaped the urbangrowth pattern and pace within the region’s individual urbanareas. In a study of another fast growing megapolitan region,the Pearl River Delta, Ouyang et al. analyzed the relation-ships between cropland, population, GDP, and urbanization[24]. They argued that urbanization in that area boostedthe agglomeration advantages found in the national andinternational economy.
Focusing on urban influence, Liang applied the gravitymodel to examine the geometric characteristics of urbaninfluence domains of 670 cities in China [25]. The studyidentified unbalanced regional patterns of China’s urbandevelopment as a result of differences in national conditionsand economic development. Based on the urban influence ofthe cities, this study further attempted to divide China into13 economic regions. In a recent study, Ho and Li analyzedthe change of urban output per capita from 1984 to 2003[26]. They found that cities with comparable output percapita tend to be in the same region. Their findings suggestthat if the current economic development pattern continues,the regional difference is unlikely to change.
2.2. Studies on Global Urban Hierarchies and China’s UrbanHierarchy. One of the well-known tools used to study urbanhierarchies is Zipf ’s law, first proposed by Harvard’s linguistGeorge Kingsley Zipf, which states that a city’s populationsize and rank are closely related and that city rank-sizedistributions can be represented by a log-normal distribution[27]. Zipf ’s law has been applied extensively to the analysis ofurban hierarchies in many countries [28–31]. While Zipf ’slaw was supported by some empirical evidence in city rank-size distributions throughout the world, there were alsoviolations [32, 33]. Autocorrelation in city growth ratescould cause deviation from the linearity in the log-normaldistribution, thus violating Zipf ’s law [33]. Although Zipf ’slaw has been used to analyze the evolution of city sizedistribution, it did not address rank changes in an urbansystem over time. In order to account for the variability inthe movement of city ranks, Markov’s chain models havegained wide popularity and have been applied to analyze theevolution of city size distributions [34–38].
A Markov chain model is a discrete process model. Themodel assigns cities into a set of initial states (or classes)based on their sizes. Then it defines a transition probabilitymatrix to estimate the evolution of city sizes over time. Basedon the relative frequencies of the changing of classes betweenconsecutive time periods, the model can estimate the numberof cities in each size class over time. Therefore, the transitionprobability matrix is essential to characterize the dynamicsof city rank changes [33]. In the simplest Markov model,the change of a city’s state at the next time period dependssolely on its current state. Some research has attemptedto incorporate the influences from neighbors, for example,integrating with cellular automata models [39]. Based onstate changes, Markov’s chain models can suggest the upand down in the movement of city ranks, in other words,the trajectories of individual cities. Upon examining thelocations of the cities that changed their states, it is possibleto investigate if there are any spatial/regional patterns of suchchanges [38]. In addition, to reveal the evolution of city statesin the past, Markov’s chain models help suggest possiblelong-run tendencies in city hierarchies.
Examining China’s changing urban hierarchy could helpshed light on urban and regional development policiesinfluencing urban growth. While there is an increasinginterest among urban scholars on China’s urbanization,studies on its urban hierarchy are limited. In the 1980s,an early study by Zhou and Tang divided China’s citiesand towns into 17 classes and examined their territorialsizes from 1964 to 1980 [40]. Their study suggested thatwhile medium and small size cities grew more rapidly,the government controlled the growth of large cities. Theyalso found that there was no direct connection betweenurban territory size and urbanization level. The latter studyprovided some insights into the factors that affected theurban size before the economic revolution started. In alater study, Chen investigated China’s city hierarchy, urbanpolicy, and development in the 1980s [41]. Chen’s studynoted the growing discrepancy in socioeconomic develop-ment between inland and the coastal region due to policypreferences.
Using city-level data from 1991 and 1998, Song andZhang examined China’s city size and the evolution of thecity system [42]. Based on the Pareto law or the rank-size rule, they analyzed city size relative to city hierarchy.Their study suggested that China’s cities became moreevenly distributed among size groups in 1998. They alsofound that larger Chinese cities tended to be more evenlydistributed in size than smaller cities. Although their studydemonstrated that the distribution of China’s city sizes canbe well explained by the Pareto law, it did not seek toexamine the dynamics of the changing urban hierarchy. Ina more recent study, Zhou and Yu analyzed China’s citypopulation based on 2000 Census counts and attempted tobuild an urban hierarchy of China’s cities [43]. To examinethe competiveness among Chinese cities in 2000, Jiang andShen built a four-level indicator system to compare thecompetitiveness of 253 Chinese cities at the prefecture levelor above [44]. The findings showed the sharp gap betweenthe east and west. Most of top 20 cities are located in eastern

4 Urban Studies Research
China while the bottom 20 cities are mainly in westernChina.
Furthermore, to assess the spread and backwash effectsin the Chinese urban hierarchy, Chen and Partridge appliedcentral place theory to examine the heterogeneity in urbangrowth [45]. They found that at the cost of smaller citiesand rural communities, the megacities of China grew fastest,while positive spread effects were identified in the growthof medium-sized cities. A recent study by Chan pointedout the lack of spatial agglomeration in China’s urbansystem [46]. From the perspective of economic efficiency, hesuggested that a freer migration policy could help developan urban system with fewer but larger-size cities. Such asystem could likely better fit the diversity in regional and localdevelopment.
Among these studies, territory size, economic indica-tors, and population were the typical variables used todetermine urban size and growth. Few of them examinedthe spatial and temporal dynamics of urban rank changesin China. Most of these studies also focused on citiesinstead of urban agglomerations. Because city boundariesare often determined by political factors, the definitionof urban agglomeration is more precise [8]. Based onthe extended area of cities, particularly in China, urbanagglomerations provide a more objective and standard wayto represent urban dimensions. Furthermore, as discussedearlier, population change does not necessarily suggest arank change as an urban agglomeration can actually decreasein rank even though it has increased in population. Anurban agglomeration lower in rank could have increasedits population at a faster rate. RMIs have the advantageof revealing such hidden facts. This quality is not usuallycaptured by Zipf ’s law and Markov’s chains. It is worthnoting that it is possible to integrate RMI with Markov’schains to investigate the changes though. However, it isbeyond the discussion here. In this study, we will only focuson exploring the spatial and temporal pattern of RMIs. Basedon the RMI values from 1950 to 2005, our study wouldprovide a better picture of the changing dominance of urbanareas and also reveal the regional pattern in both historicaland contemporary contexts.
3. Methodology
3.1. Data. Our study is based on the 2007 United Nation(UN) population database [1]. The database provides pop-ulation size in 5-year increments for urban agglomerationswith 750,000 inhabitants or more in 2007 from 1950 to2025. We limit our study to mainland China by excludingHong Kong and Macau. In total, 137 urban agglomerationswere included in this study. Although much has beenwritten on the problem of city definitions in China, weprefer the current UN urban agglomeration list even thoughwe recognize its limitations as highlighted by Chan [47].We hope by only analyzing these urban agglomerationswithin China that we minimize the problem as we arenot comparing across countries where no internationalstandard exists. The UN defines urban agglomeration as the“population contained within the contours of a contiguous
territory in-habited at urban density levels without regardto administrative boundaries” [4]. Under this definition, anurban agglomeration includes both the city and its adjacentsuburbs. It is worth noting that in order to provide consistentpopulation estimates over historical time periods, the UNmay adjust the historical population to conform to thecurrent definition [48]. In addition, when only populationfor metropolitan area or city proper is reported by a country,the UN may adjust the data to conform to the urban agglom-eration concept [9]. Therefore, using urban agglomerationscould help lessen the concerns of inappropriate inclusion ofnonurbanized area when comparing the urban hierarchy inChina. Nevertheless, it is not to say that using the UN’s datafrees one of these known problems. The dual-track approachproposed by Shen could help improve the data, but such anintensive exercise applied to the entire urban system of Chinais beyond the scope of this paper [20].
3.2. Rank Mobility Index (RMI). Rank mobility index (RMI)is a measure of a city’s change in population rank among agroup of cities [5, 6], as in
M = R1 − R2
R1 + R2, (1)
where M is the RMI, R1 is the city’s rank at the beginningtime—time 1—, and R2 is the city’s rank at the end of atime period—time 2. An RMI value can range from −1.0to +1.0. A negative RMI value indicates a decrease in rank,whereas a positive RMI value reflects an increase in rank.An RMI value of 0 indicates no change in rank. Based onthe RMI definition, we can see that a city’s population maybe growing, but the RMI of the city may be negative asother cities can grow faster and overtake the rank of the city.Therefore, the RMI is a good measure for representing thechange of state in an urban hierarchy.
To calculate RMI values, we first ranked the 137 urbanagglomerations by their populations for different years from1950 to 2005. Then we computed the RMI values forthe urban agglomerations from 1950 to 2005 in 10-yearincrements with the exception of the time period from2000 to 2005. In summary, we obtained RMI values forsix time periods: 1950–1960, 1960–1970, 1970–1980, 1980–1990, 1990–2000, and 2000–2005.
3.3. Getis-Ord G∗i . Mapping the RMI values of the urbanagglomerations for the six time periods could show thespatial variations of urban rank changes. However, it doesnot shed light on any possible trends or clustering of the RMIvalues over time. Therefore, we further used Getis-Ord G∗i toexplore the spatial and temporal pattern of RMIs [49]. Getis-Ord G∗i is a local spatial autocorrelation measure defined as
G∗i =∑
j wi jx j∑
j x j. (2)
The G∗i is standardized as
Z(Gi) = Gi − E(Gi)SE(Gi)
, (3)

Urban Studies Research 5
where xi is the attribute value of an observation i, i = 1, . . . ,n;wij is the spatial weight between observation i and j; E(Gi)is the expected value of Gi; SE(Gi) represents the standarddeviation ofGi; Z(Gi) is the Z-score ofG∗i . There are differentways to define spatial weights. Given that the western mostcity (Urumqi) is separated far from the others, we set thedistance from Urumqi to the closest city as the thresholdto search for neighbors. All urban agglomerations locatedwithin such a distance are weighted equally.
Different from LISA statistics, Getis-Ord G∗i is betterat suggesting the clusters of high RMI/low RMI values.Although LISA statistics can also be used to reveal hot/coldspots, it is based on the difference between the value of anobservation with the average value. Because we are moreinterested in identifying the pattern of increase or decline inurban ranks in different regions in China, we chose Getis-Ord G∗i to perform the analyses. A positive high Z-scoreindicates clustering of high values, whereas a negative lowZ-score indicates clustering of low values. We calculatedGetis-Ord G∗i statistics of the RMIs for the six time periods,respectively. Based on the results, we expect to identify anyregional effects on the change of urban dominance over time.
3.4. Space-Time Moran Scatter Plot and LISA Path. Recentdevelopment in exploratory space-time data analysis pro-vides some other tools that could help further investigatethe temporal dynamics of China’s changing urban hierarchy[50]. Space-time Moran scatter plot, built upon the conceptof spatial Moran’s I scatter plot, is used in this study tocompare the difference in the temporal changes of RMIvalues of the 137 urban agglomerations. Moran scatter plot,originally introduced by Anselin [51], is commonly usedto plot the relationship between a location’s value and itsneighboring values. The scatter plot plots the variable ofinterest on the X-axis. The Y-axis represents the weightedaverage (or spatial lag) of the corresponding neighboringvalues. Therefore, the scatter plot can indicate how similaran observation is to its neighbor’s. Based on the conceptof Moran scatter plot, we can create a space-time Moranscatter plot based on the RMI values of one time period andtheir spatial lags at the previous time period. We selected1990–2000 and 1980–1990 to compare because the G∗ mapssuggest that a dramatic turn of urbanization occurred duringthe 1990s. The RMI values of 1990–2000 are plotted onthe X-axis. Then instead of plotting the spatial lags ofthe neighboring values in the same time period, we plotthe spatial lags of the RMIs of 1980–1990 on the Y-axis(Figure 6). Therefore, the plot would reveal how the ranks ofurban agglomerations changed compared to their neighborsfrom a temporal perspective. The slope of the regression linein the plot indicates the overall strength of such a relationshipin general.
The four quadrants in the scatter plot would suggest thedifference in the temporal paths of RMIs for each urbanagglomeration. For example, the first quadrant includes allurban agglomerations that experienced the increase of ranksfrom 1990 to 2000 while their neighbors all had growth in theprevious time period. This could suggest a regional spillovereffect and an overall growing pattern. The second quadrant
represents the urban agglomerations that had a decrease intheir ranks from 1990–2000, but their neighbors all achievedpromotion in their ranks from 1980–1990. This couldsuggest a shift of urban dominance regionally. The urbanagglomerations in the third quadrant all experienced rankdeclines, coupling with the rank decline of their neighborsfrom 1980 to 1990. Therefore, it may suggest an overall downpath of urbanization of these urban agglomerations. Theurban agglomerations in the fourth quadrant represent thosethat gained rank with dramatic growth in the 1990s againstthe declining ranks of their neighbors in the 1980s. Theurban agglomerations in the second and fourth quadrants,therefore, represent two opposite paths in the urbanizationprocess and are worthy of extra attention.
The regional effect would be further revealed by com-bining the space-time scatter plot with a map showing therelationship between the RMIs of the 1990–2000 period andthe spatial lags of the 1980–1990 period (Figure 7). Please seethe detailed discussions of these results in the next section.
In addition to the space-time Moran scatter plot, tem-poral LISA paths are also used to illustrate the dynamicsof rank change for selected cities from 1950 to 2005. Reyand Janikas provided detailed discussions on LISA path intheir work on the STARS (Space–Time Analysis of RegionalSystems) project [50]. In the LISA path graph, the X-axis represents the values of a selected observation duringdifferent time periods. The Y-axis represents the spatial lagsof the observation corresponding to the same set of timeperiods. Therefore, the LISA path can reveal the changeof urban ranks of an urban agglomeration related to itsneighbors across time. It can also help suggest a possibleregional regime in the urbanization process.
4. Results
4.1. RMI Results. Figure 1 shows the overall RMI values from1950 to 2005 while Figure 2 shows the RMI values for 1950–1960, 1960-1970, 1970-1980, 1980-1990, 1990-2000, and2000–2005, respectively. These maps suggest considerablespatial variation in rank changes across these time periods.We can see that the top-ranked large cities, for exam-ple, Beijing, Shanghai, Chongqin, did not experience anyrank changes in these time periods (except that Chongqinexperienced a decrease between 1960 and 1970). Based onFigure 1 and Table 1, 34 out of the 137 urban agglomerationsmaintained their ranks from 1950 to 1960. The first ten-year period coincided with a relatively slow process ofurbanization as China just started to reorganize and developits economy after the Chinese Revolution.
After 1960, more cities experienced rank changes. As aresult of the Cultural Revolution, less rank changes happenedin the 1970s compared to the previous 10 years. We cansee that the ranks changed more dramatically after 1980.This suggests that China’s urbanization occurred along amore rapid pace and on a larger scale after 1980. Over85% of the urban agglomerations experienced up or downmovement in their ranks. This was especially pronouncedfrom 1990 to 2000. Only five urban agglomerations did notexperience changes in their ranks during the latter time

6 Urban Studies Research
BeijingTianjin
Shanghai
Chongqing
Guangzhou
Shenzhen
RMI 1950–2005DecreaseNo changeIncrease
0 500 1000(Kilometers)
Figure 1: RMI values from 1950 to 2005.
period. Four of them were among the ten largest cities,including Beijing, Shanghai, Chongqing, and Chengdu. Itis worth noting that in recent years, public media hasreported Chongqing as the world’s largest city after itwas separated from Sichuan province and created as amunicipality in 1997 [52]. In China, municipalities havean equivalent administrative status to that of a province.Chan pointed out that the large geographic coverage ofChongqing incorporated substantial rural populations [46].Although claimed to have a population of 31.39 million,Chongqing only has about 36 percent urban population [46].Using urban agglomerations helped us examine the changingurban dominance in China in a consistent way.
Maps in Figures 1 and 2 demonstrated the strength ofusing the RMI index. They show that the RMI is an excellentindex for capturing the changing dominance of urbanagglomerations in China. We especially like the property ofthe RMI value that rewards the taking over of an agglomer-ation formerly at the top end of the urban hierarchy. Thismeans that the larger the urban agglomeration, the moredifficult it is to overtake, as shown in the cases of Beijingand Shanghai. Consider another example, Guangzhou whichin 1950 was the 6th ranking urban agglomeration of China.By 2005, Guangzhou had climbed to the 3rd ranked urbanagglomeration in China, resulting in an RMI value of 0.33.Also consider Zhuhai, which moved up 41 positions, startingat rank 137 in 1950 and ended in rank 96 by 2005 for an RMIvalue of 0.18. Zhuhai increased its rank more than 10 timesthat of Guangzhou, but its rank mobility index reflects thatit was not over taking urban agglomerations at the top of theurban hierarchy.
4.2. Getis-Ord G∗i Results. It is possible to observe spatialtendencies of the positive RMI values from a simple visual
Table 1: Number of cities with rank changes.
Time periods Decrease No change Increase
1950–1960 56 34 47
1960–1970 64 16 57
1970–1980 58 22 57
1980–1990 83 11 43
1990–2000 85 5 47
2000–2005 55 18 64
1950–2000 62 7 68
inspection of Figure 1 and 2. However, it is difficult toidentify any regional patterns of the RMI values, up or down.The results from the Getis-Ord G∗i analyses, on the otherhand, can help address this weakness.
Figure 3 provides an overview of the change of urbanhierarchy in China from 1950 to 2005. It is quite evidentthat there is a clear “north-south divide” of the RMIs. Themajority of the cities with positive Z-scores are located inthe south. On the contrary, almost all cities in the northexperienced small or negative changes in their RMIs. Inthe south, clearly two groups of cities stand out well aboveothers in their RMIs during this entire time span. One is inthe southwest around Chongqing and Chengdu. The otheris in Central China around Wuhan. The development islargely attributed to the resources (southwest) and trans-portation advantages (Wuhan). Although not all cities inthese two areas experienced RMI increases (see Figure 1), itdemonstrates a regional effect in the urbanization process.Ke and Feser also reported these spread-backwash effects ina recent study of nonagricultural gross domestic productand employment growth in Central China between 2000 and2005 [53].
Although Figure 3 provides an overall picture of thechange in urban dominance, it fails to visualize any dynamicsin this long time path. Can the patterns observed fromFigure 3 explain the changing urban dominance for theentire time span? Were there different stages of such changes?The maps in Figure 4 can help address these questions.Comparing the G∗ values for the six time periods side byside, we can clearly identify different patterns over the fifty-five years. There is an obvious shift of urban dominancefrom north to south from 1950 to 2005, notably after 1990.During the early stages of China’s industrialization, it was thenorth and northeast region that grew faster than the south(Figure 4(a)). Heavy industries, particularly steel industries,were largely located in this northern region. From the 1960sto the 1970s, northeast China continued to serve as a majorbase for heavy industries. At the same time, concerning thepossible consequences of the cold war, a significant numberof factories moved from east to west and to southwestChina in order to protect the country’s backbone industry.Millions of people moved inland to build new factories andinfrastructure. That is why most cities in the east experienceddeclines in their RMIs. Meanwhile, this shift provided ahistoric opportunity for the cities in the southwest to grow(Figure 4(b) and Figure 4(c)).

Urban Studies Research 7
Beijing
Shanghai
Guangzhou
Tianjin
Chongqing
Shenzhen
RMI 1950–1960DecreaseNo changeIncrease
0 1000500(Kilometers)
(a)
Beijing
Shanghai
Guangzhou
Tianjin
Chongqing
Shenzhen
RMI 1960–1970DecreaseNo changeIncrease
0 1000500(Kilometers)
(b)
0 1000500(Kilometers)
Beijing
Shanghai
Guangzhou
Tianjin
Chongqing
Shenzhen
RMI 1970–1980
DecreaseNo changeIncrease
(c)
0 1000500(Kilometers)
Beijing
Shanghai
Guangzhou
Tianjin
Chongqing
Shenzhen
RMI 1980–1990DecreaseNo changeIncrease
(d)
Beijing
Shanghai
Guangzhou
Tianjin
Chongqing
Shenzhen
RMI 1990–20000 1000500
(Kilometers)
DecreaseNo changeIncrease
(e)
Beijing
Shanghai
Guangzhou
Tianjin
Chongqing
Shenzhen
RMI 2000–20050 1000500
(Kilometers)DecreaseNo changeIncrease
(f)
Figure 2: RMI values for six time periods from 1950–2005.

8 Urban Studies Research
!
Shenzhen
Haerbin
Changchun
ChengduChongqing
Guangzhou
Wuhan
Getis-Ord Z-score
−2.52
Shanghai
BeijingTianjin
−1.64–00.01–11.01–1.48
0 1000500
(Kilometers)−2.51 to −1.96
−1.95 to −1.65
G∗i
Figure 3: Overview of the hot spots and cold spots of the changingurban hierarchy: 1950–2005.
During the first thirty years, the policies based on aplanned economy played a very important role in the urbanhierarchy and urban configuration. Yet the 10-year CulturalRevolution slowed down the entire urbanization process.The RMI changes stepped into a highly dynamic phase after1980. The open door policy and market reform were intro-duced after 1978. Coastal cities received policy incentivesto develop their economies. The central government alsostarted to grant more power to local governments. Duringthe transitional time from 1980 to 1990, we can observe adeclining pattern of the RMI values in the west (Figure 4(d)).That was just the beginning of the movement of migrantworkers from the west to the east. The cities in the middle andlower Chang Jiang Valley experienced relatively faster growththan the others, owing much to the booming of townshipfactories.
The southern phenomenon bumped up after the1990s (Figure 4(e) and Figure 4(f)). The north-south dividebecame evident since then. A major factor that triggered thismovement was the reform of the housing market. As shownby Shen, the migration from 1995 to 2000 increased muchmore than the period from 1985 to 1990 [54]. The early 1990swas just the start. The real phenomenal boom happenedafter 1998. The abolishment of welfare housing and theopening of the private housing market soon rattled China’surban hierarchy. Cities in the middle and lower ChangJiang valley maintained steady growth. Cities in the south,particularly those along the coast attracted a tremendousamount of investment as well as waves of migrant workers.Income was a major pull factor in this mass movement.Urbanization accelerated at a startling pace in these places.A very good example is Shenzhen. Shenzhen had enormousgrowth during the 1980–2005 period. It was ranked as the117th urban agglomeration in 1980 and soared up to the
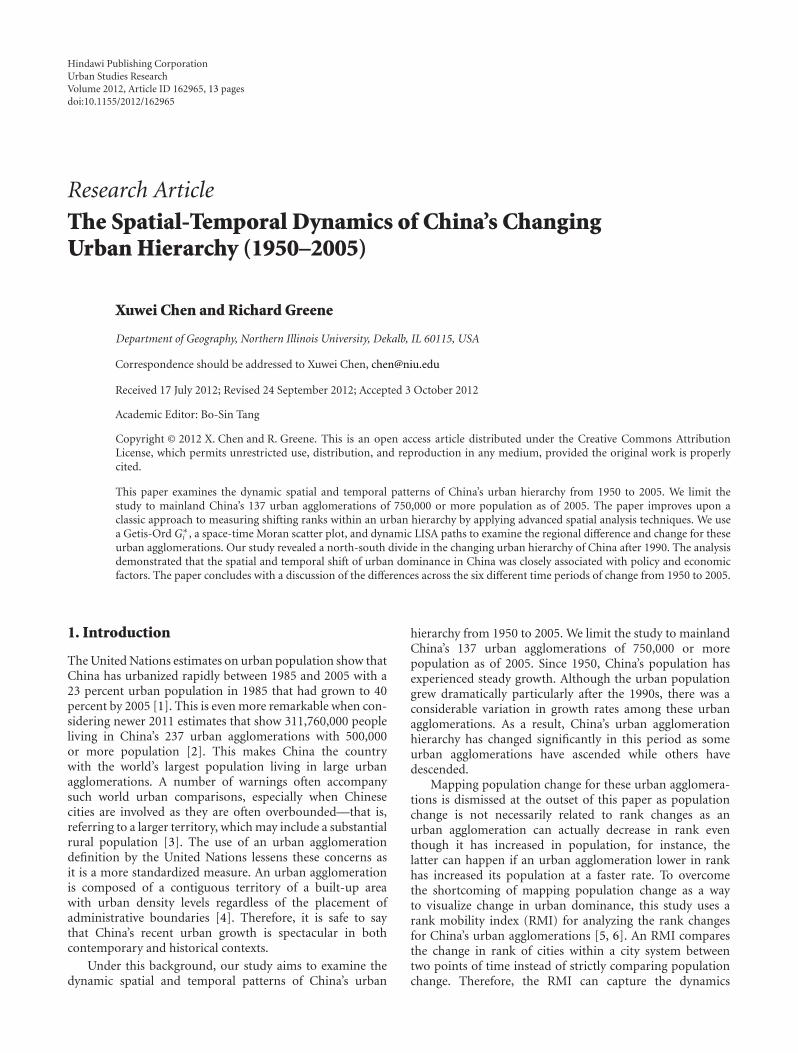
4th ranked urban agglomeration by 2005, largely owingto its status as one of the four early established specialeconomic zones. We further plotted the G∗ Z scores ofShenzhen along with that of two other cities, Wuhan andChangchun (Figure 5). Wuhuan is located in Central Chinaand Changchun is located in northern China. The figureclearly presents the temporal shift of urban ranks for thesethree cities. While both Shenzhen and Wuhan climbed upthe hierarchy after 1980, Changchun on the other handexperienced a sharp decline in its rank between 1980 and1990.
Figure 4(f) also revealed some effects of the so-called“Go West” policy. Beginning in 2000, China started itswestern development program to reduce the gap betweenthe west and east. Although still far from reaching this goal,the program more or less boosted the economy throughinfrastructure projects. We can see that several cities inthe southwest moved up in their ranks after 2000. From aregional perspective, Figure 4(e) and Figure 4(f) also indicatethat the urban system was more balanced in the souththan in the north. As one of the strategies to reduce thepressure on these superlarge cities, such as Beijing, Shanghai,and Guangzhou, developing medium-size cities and townsstarted to show hierarchical effects in the south. More suchdevelopment policy effort is still seen by some as necessary inNorth China.
In summary, our observations suggest that althoughurbanization happened in China on a broad scale, its extentin the south is truly remarkable. While the gap between thewest and the east in China is well known, this study reveals aclear divide in the urbanization process between the northand south. Over the last two decades, East and SoutheastChina has undergone much more rapid development thanChina’s other regions. The ongoing high-speed rail projectsin China are likely to bring profound implications to thispattern.
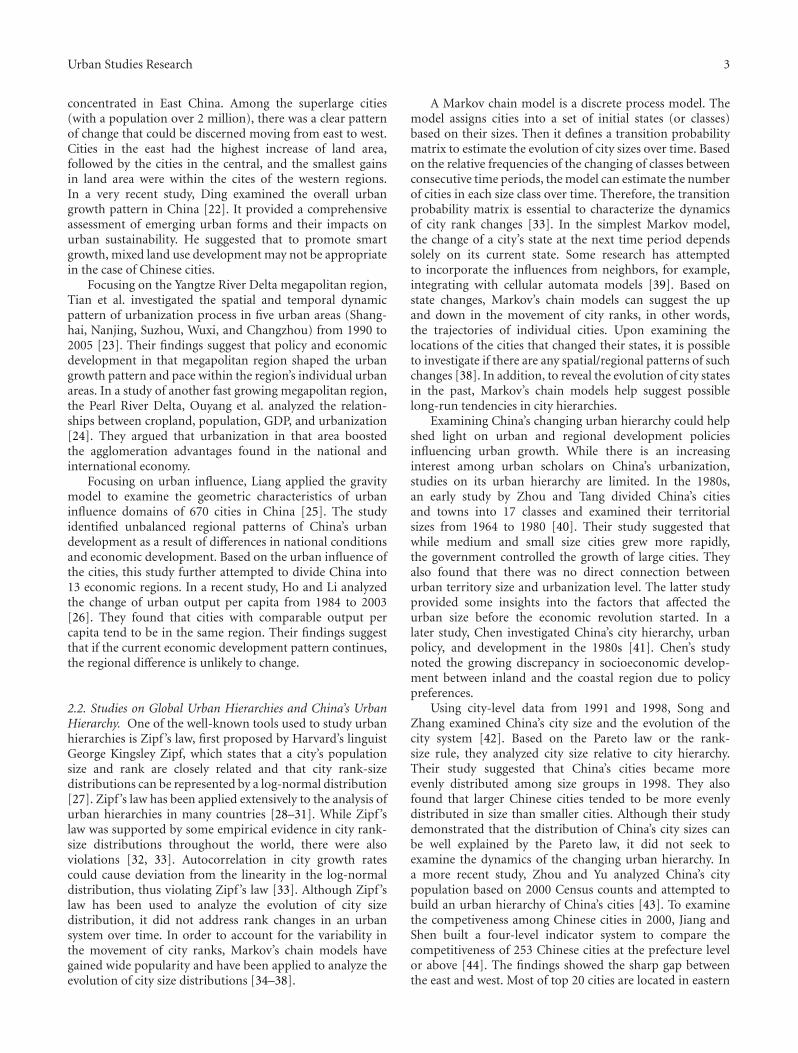
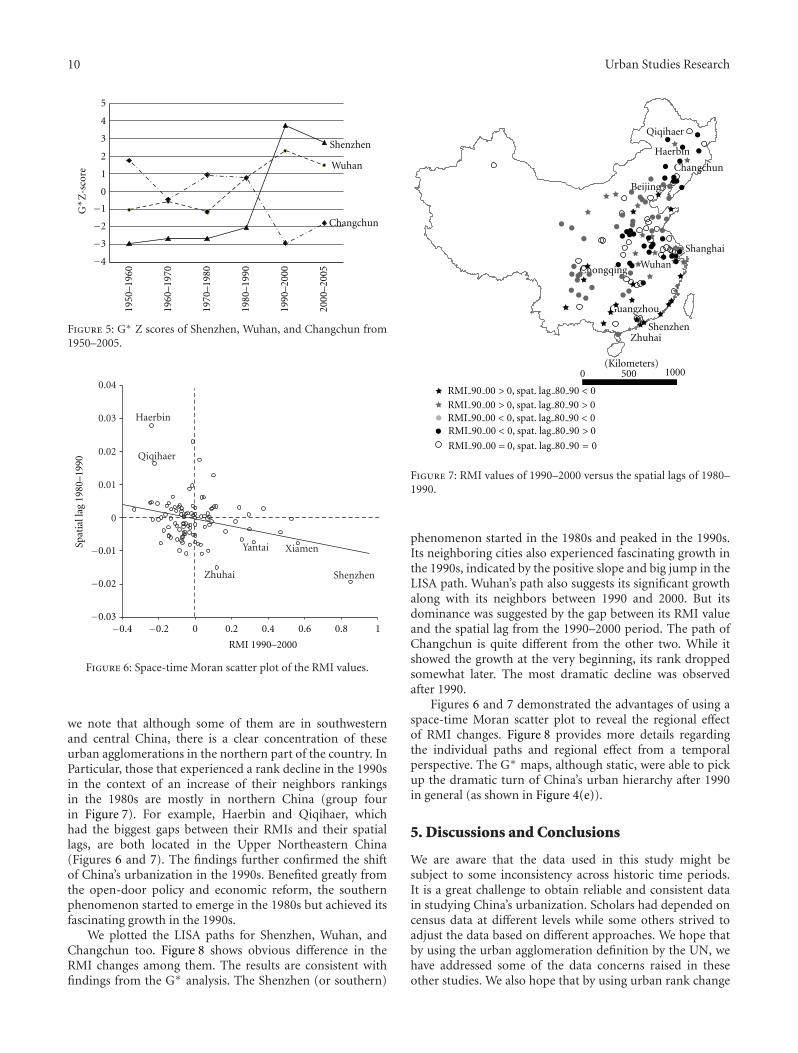
4.3. Space-Time Moran Scatter Plot and LISA Path. Figure 6shows the 1990–2000 RMI values of each urban agglomera-tion versus their spatial lags of 1980–1990. Figure 7 mappedthe urban agglomerations into five groups based on therelationship between the RMIs of 1990–2000 and their spatiallags of 1980–1990. The observations of Figures 6 and 7 alsoconfirmed our findings based on the G∗ maps. In Figure 7,the first group appearing as dark stars includes all urbanagglomerations in the fourth quadrant of the scatter plot.Figure 7 suggests that the majority of them are located inthe southern part of China. Clearly, Shenzhen stands out wellabove the others, leading the increase of RMIs from all otherurban agglomerations. Among the urban agglomerationslabeled in Figure 6, Zhuhai and Xiamen are coastal cities insouthern China. Yantai, although located in Northern China,is a coastal city too. The urban agglomerations in the secondgroup in Figure 7 correspond to those in the first quadrantof the scatter plot. They are spatially scattered in bothsouthern and northern China. These urban agglomerationsmaintained their pace of growth with regional support. Uponexamining those located in the second and third quadrants ofthe scatter plot and the third and fourth groups in Figure 7,

Urban Studies Research 9
Haerbin
Changchun
Beijing
Tianjin
WuhanChongqingChengdu
Guangzhou
Shanghai
Shenzhen
Getis-Ord Z-score(1950–1960) 0 1000500
−1.64–0
0.01–1.32
1.33–1.961.97–2.06
−3.10 to −2.58−2.75 to −1.96−1.95 to −1.65
(Kilometers)G∗i
(a)
Getis-Ord Z-score(1960–1970)
0 1000500
Changchun
Beijing
Tianjin
WuhanChongqing
Chengdu
Guangzhou
Shanghai
Shenzhen
Haerbin
(Kilometers)
−1.64–00.01–1.5
−3.18 to −2.58−2.57 to −1.96−1.95 to −1.65
G∗i
(b)
Haerbin
Changchun
BeijingTianjin
Chengdu
Shanghai
Shenzhen
Chongqing
Guangzhou
Wuhan
Getis-Ord Z-score(1970–1980)
0 1000500(Kilometers)
−1.64–00.01–1.22
−2.68 to −2.58−2.57 to −1.96−1.95 to −1.65
G∗i
(c)
Getis-Ord Z-score(1980–1990)
0 1000500
Changchun
Beijing
Tianjin
WuhanChongqingChengdu
Guangzhou
Shanghai
Shenzhen
Haerbin
(Kilometers)
−1.64–0
0.01–1.651.66–1.961.97–2.1
−2.02 to −1.96−1.95 to −1.65
G∗i
(d)
BeijingTianjin
WuhanChongqingChengdu
Guangzhou
Shanghai
Shenzhen
Haerbin
Changchun
Getis-Ord Z-score(1990–2000)
0 1000500(Kilometers)
−1.64–0
0.01–1.651.66–1.961.97–2.582.59–3.92
−3.7 to −2.58−2.57 to −1.96−1.95 to −1.65
G∗i
(e)
Getis-Ord Z-score(2000–2005)
0 1000500(Kilometers)
BeijingTianjin
WuhanChongqingChengdu
Guangzhou
Shanghai
Shenzhen
Haerbin
Changchun
0.01–1.651.66–1.96
1.97–2.582.59–2.81−1.64–0
−1.95 to −1.65
−3.30 to −2.58−2.57 to −1.96
G∗i
(f)
Figure 4: The spatial and temporal dynamics of urban hierarchy for the six time periods.
10 Urban Studies Research
Shenzhen
Wuhan
Changchun
0
1
2
3
4
5
1950
–196
0
1960
–197
0
1970
–198
0
1980
–199
0
1990
–200
0
2000
–200
5
−1
−2
−3
−4
G∗ Z
-sco
re
Figure 5: G∗ Z scores of Shenzhen, Wuhan, and Changchun from1950–2005.
0
0.01
0.02
0.03
0.04
Shenzhen
Xiamen
Zhuhai
Yantai
Haerbin
Qiqihaer
−0.4
−0.01
−0.02
−0.03−0.2 0 0.2 0.4 0.6 0.8 1
Spat
ial l
ag 1
980–
1990
RMI 1990–2000
Figure 6: Space-time Moran scatter plot of the RMI values.
we note that although some of them are in southwesternand central China, there is a clear concentration of theseurban agglomerations in the northern part of the country. InParticular, those that experienced a rank decline in the 1990sin the context of an increase of their neighbors rankingsin the 1980s are mostly in northern China (group fourin Figure 7). For example, Haerbin and Qiqihaer, whichhad the biggest gaps between their RMIs and their spatiallags, are both located in the Upper Northeastern China(Figures 6 and 7). The findings further confirmed the shiftof China’s urbanization in the 1990s. Benefited greatly fromthe open-door policy and economic reform, the southernphenomenon started to emerge in the 1980s but achieved itsfascinating growth in the 1990s.
We plotted the LISA paths for Shenzhen, Wuhan, andChangchun too. Figure 8 shows obvious difference in theRMI changes among them. The results are consistent withfindings from the G∗ analysis. The Shenzhen (or southern)
Qiqihaer
Haerbin
Beijing
WuhanChongqing
Guangzhou
Shanghai
Shenzhen
Changchun
Zhuhai
RMI 90 00 0, spat. lag 80 90 == 0
RMI 90 00 < 0, spat. lag 80 90 > 0RMI 90 00 < 0, spat. lag 80 90 < 0RMI 90 00 > 0, spat. lag 80 90 > 0
RMI 90 00 > 0, spat. lag 80 90 < 0
0 1000500(Kilometers)
Figure 7: RMI values of 1990–2000 versus the spatial lags of 1980–1990.
phenomenon started in the 1980s and peaked in the 1990s.Its neighboring cities also experienced fascinating growth inthe 1990s, indicated by the positive slope and big jump in theLISA path. Wuhan’s path also suggests its significant growthalong with its neighbors between 1990 and 2000. But itsdominance was suggested by the gap between its RMI valueand the spatial lag from the 1990–2000 period. The path ofChangchun is quite different from the other two. While itshowed the growth at the very beginning, its rank droppedsomewhat later. The most dramatic decline was observedafter 1990.
Figures 6 and 7 demonstrated the advantages of using aspace-time Moran scatter plot to reveal the regional effectof RMI changes. Figure 8 provides more details regardingthe individual paths and regional effect from a temporalperspective. The G∗ maps, although static, were able to pickup the dramatic turn of China’s urban hierarchy after 1990in general (as shown in Figure 4(e)).
5. Discussions and Conclusions
We are aware that the data used in this study might besubject to some inconsistency across historic time periods.It is a great challenge to obtain reliable and consistent datain studying China’s urbanization. Scholars had depended oncensus data at different levels while some others strived toadjust the data based on different approaches. We hope thatby using the urban agglomeration definition by the UN, wehave addressed some of the data concerns raised in theseother studies. We also hope that by using urban rank change

Urban Studies Research 11
0
0.01
0.02
0.03
0.04Spatial lag
RMI
2000–2005
1990–2000
1950–19601980–1990
−0.2−0.03
−0.02
−0.01
0 0.2 0.4 0.6 0.8 1
(a) Shenzhen
0
0.002
0.004
0.006
0.008Spatial lag
RMI
−0.1−0.004
−0.002
−0.05 0 0.05 0.1
1990–2000
2000–2005
1950–1960
1980–1990
(b) Wuhan
0
0.01
0.02
0 0.1 0.2 0.3
Spatial lag
RMI
1980–1990 1950–1960
2000–2005
1990–2000
−0.01
−0.02
−0.03
−0.04
−0.05
−0.06−0.2 −0.1
(c) Changchun
Figure 8: LISA paths of selected urban agglomerations: (a) Shenzhen, (b) Wuhan, and (c) Changchun.
instead of urban population growth that the concerns arefurther lessened.
Using a rank mobility index, we explored and visualizedthe spatial and temporal dynamics of the urban hierarchyin China from 1950 to 2005. This study demonstratedthat the RMI is an excellent index for capturing thechanging dominance of urban agglomerations in China.The findings suggest that China’s urban hierarchy expe-rienced considerable changes over time. Policy and eco-nomic factors played a significant role in shaping thispath. There were clear regional patterns in the dynamicsof China’s urban hierarchy. We identified a north-southdivide in the urbanization process after 1990. The southand southeast has dominated this process since economicreform.
For historical and political reasons, cities in Chinapresent and convene opportunities and wealth. The unprece-dented urbanization process has put a tremendous amountof pressure on urban infrastructure and the environment inthese superlarge cities. As suggested by Chen and Partridge’study [45], China’s urban-centric development process needs
to be reevaluated so that the growth of megacities canprovide positive spread effects rather than reduce growthelsewhere. Our study provides some important policy impli-cations on the development of a more balanced urban systemin China. China’s urbanization in recent years was largelyassociated with the growth of coastal cities and dominantregional centers. Migrant workers undoubtedly have servedas a major force underpinning this process. However, toachieve sustainable and harmony development of the econ-omy and society, more policy support should be provided tothe inland and less-developed rural areas. Creating job andeconomic opportunities in these places would certainly helpreduce the regional and societal disparities in the long run,contributing to a balanced urbanization process across thecountry.
References
[1] United Nations, “World Urbanization Prospects: The 2007Revision,” 2008, http://www.un.org/esa/population/publica-tions/wup2007/2007WUP Highlights web.pdf.

12 Urban Studies Research
[2] Demographia, “Demographia World Urban Areas: 7th An-nual Edition,” 2011, http://www.demographia.com/db-worl-dua.pdf.
[3] R. L. Forstall, R. P. Greene, and J. B. Pick, “Which are thelargest? Why lists of major urban areas vary so greatly,”Tijdschrift voor Economische en Sociale Geografie, vol. 100, no.3, pp. 277–297, 2009.
[4] United Nations (UN), “Glossary of Demographic Terms,”2011, http://esa.un.org/wpp/Documentation/glossary.htm.
[5] J. U. Marshall, The Structure of Urban Systems, University ofToronto Press, Toronto, Canada, 1989.
[6] R. Greene and J. Pick, Exploring the Urban Community: A GISApproach, Prentice Hall, Upper Saddle River, NJ, USA, 2ndedition, 2012.
[7] United Nation Population Fund (UNFPA), “State of worldpopulation 2007: Unleashing the potential of urban growth,”http://www.unfpa.org/swp/2007/english/introduction.html .
[8] G. Anderson and Y. Ge, “Intercity income inequality, growthand convergence in China,” Journal of Income Distribution, vol.18, no. 1, pp. 70–89, 2009.
[9] United Nations, “World Urbanization Prospects: The 2009Revision,” 2010, http://esa.un.org/unpd/wup/Documents/WUP2009 Highlights Final.pdf.
[10] National Bureau of Statistics of China, 2010 Census DataBulletin, Beijing, China, 2011.
[11] R. Kirkby, Urbanization in China: Town and Country ina Developing Economy 1949–2000 AD, Columbia UniversityPress, New York, NY, USA, 1985.
[12] C. C. Fan, “The vertical and horizontal expansions of China’scity system,” Urban Geography, vol. 20, no. 6, pp. 493–515,1999.
[13] G. C. S. Lin, “The growth and structural change of Chinesecities: a contextual and geographic analysis,” Cities, vol. 19, no.5, pp. 299–316, 2002.
[14] L. Zhao, “The role of the government on the way to China’surbanization,” Harvard China Review, vol. 5, no. 2, pp. 26–32,2005.
[15] Y. Feng, J. Kugler, and P. J. Zak, “Population growth, urbanisa-tion and the role of government in China: a political economicmodel of demographic change,” Urban Studies, vol. 39, no. 12,pp. 2329–2343, 2002.
[16] J. Chen, F. Guo, and Y. Wu, “One decade of urban housingreform in China: urban housing price dynamics and therole of migration and urbanization, 1995–2005,” HabitatInternational, vol. 35, no. 1, pp. 1–8, 2011.
[17] G. C. S. Lin, “Reproducing spaces of Chinese urbanisation:new city-based and land-centred urban transformation,”Urban Studies, vol. 44, no. 9, pp. 1827–1855, 2007.
[18] J. Shen, “Analysis of the trends of urbanization levels inChinese provinces since 1982,” Acta Geographica Sinica, vol.60, no. 4, pp. 607–614, 2005.
[19] J. Shen, “Counting urban population in Chinese censuses1953–2000: changing definitions, problems and solutions,”Population, Space and Place, vol. 11, no. 5, pp. 381–400, 2005.
[20] J. Shen, “Understanding dual-track urbanisation in post-reform China: conceptual framework and empirical analysis,”Population, Space and Place, vol. 12, no. 6, pp. 497–516, 2006.
[21] J. Shen, Z. Feng, and K. Y. Wong, “Dual-track urbanizationin a transitional economy: the case of Pearl River Delta inSouth China,” Habitat International, vol. 30, no. 3, pp. 690–705, 2006.
[22] C. Ding and X. Zhao, “Assessment of urban spatial-growthpatterns in China during rapid urbanization,” Chinese Econ-omy, vol. 44, no. 1, pp. 46–71, 2011.
[23] G. Tian, J. Jiang, Z. Yang, and Y. Zhang, “The urban growth,size distribution and spatio-temporal dynamic pattern of theYangtze River Delta megalopolitan region, China,” EcologicalModelling, vol. 222, no. 3, pp. 865–878, 2011.
[24] T. Ouyang, Y. Kuang, Z. Hu, and B. Sun, “Urbanization inthe Pearl River Delta Economic Zone, China,” InternationalJournal of Sustainable Development and World Ecology, vol. 12,no. 1, pp. 48–54, 2005.
[25] S. Liang, “Research on the urban influence domains in China,”International Journal of Geographical Information Science, vol.23, no. 12, pp. 1527–1539, 2009.
[26] C. Y. Ho and D. Li, “Spatial dependence and divergence acrossChinese cities,” Review of Development Economics, vol. 14, no.2, pp. 386–403, 2010.
[27] F. G. K. Zipf, Human Behavior and the Principle of Least Effort,Addison-Wesley, Cambridge, Mass, USA, 1949.
[28] X. Gabaix, “Zipf ’s law for cities: an explanation,” QuarterlyJournal of Economics, vol. 114, no. 3, pp. 739–767, 1999.
[29] M. Batty and P. A. Longley, Fractal Cities: A Geometry of Formand Function, Academic Press, London, UK, 1994.
[30] M. Batty, “Rank clocks,” Nature, vol. 444, no. 7119, pp. 592–596, 2006.
[31] Y. Chen and Y. Zhou, “The rank-size rule and fractal hierar-chies of cities: mathematical models and empirical analyses,”Environment and Planning B, vol. 30, no. 6, pp. 799–818, 2003.
[32] K. T. Soo, “Zipf ’s Law for cities: a cross-country investigation,”Regional Science and Urban Economics, vol. 35, no. 3, pp. 239–263, 2005.
[33] A. P. Delgado and I. M. Godinho, “Long term evolution ofthe size distribution of Portuguese cities,” Working Paper 230,Faculty of Economics, University of Porto, 2006.
[34] D. Quah, “Empirical cross-section dynamics in economicgrowth,” European Economic Review, vol. 37, no. 2-3, pp. 426–434, 1993.
[35] J. Eaton and Z. Eckstein, “Cities and growth: theory andevidence from France and Japan,” Regional Science and UrbanEconomics, vol. 27, no. 4-5, pp. 443–474, 1997.
[36] L. H. Dobkins and Y. M. Ioannides, “Dynamic evolution ofthe size distribution of U.S. cities,” in Economics of Cities, J.M. Huriot and J. F. Thisse, Eds., pp. 217–260, CambridgeUniversity Press, New York, NY, USA, 2000.
[37] D. Black and V. Henderson, “Urban evolution in the USA,”Journal of Economic Geography, vol. 3, no. 4, pp. 343–372,2003.
[38] L. Lanaspa, F. Pueyo, and F. Sanz, “The evolution of Spanishurban structure during the twentieth century,” Urban Studies,vol. 40, no. 3, pp. 567–580, 2003.
[39] J. J. Arsanjani, “Integration of logistic regression, Markovchain and cellular automata models to simulate urban expan-sion,” International Journal of Applied Earth Observations andGeoinformation, 2012.
[40] Z. Yixing and Y. Qi, “A review on the urban-size hierarchy ofChina and the territorial types of the hierarchy on provinciallevel,” Acta Geographica Sinica, vol. 41, no. 2, pp. 97–111, 1986.
[41] X. Chen, “China’s city hierarchy, urban policy and spatialdevelopment in the 1980s,” Urban Studies, vol. 28, no. 3, pp.341–367, 1991.
[42] S. Song and K. H. Zhang, “Urbanisation and city sizedistribution in China,” Urban Studies, vol. 39, no. 12, pp.2317–2327, 2002.
[43] Y. Zhou and H. Yu, “Reconstructing city population sizehierarchy of china based on the fifth population census (I),”Urban Studies, vol. 28, no. 6, pp. 49–55, 2001.

Urban Studies Research 13
[44] Y. Jiang and J. Shen, “Measuring the urban competitiveness ofChinese cities in 2000,” Cities, vol. 27, no. 5, pp. 307–314, 2010.
[45] A. Chen and M. D. Partridge, “When are cities engines ofgrowth? Spread and backwash effects across the Chinese urbanhierarchy,” Regional Studies, 2011.
[46] K. W. Chan, “Fundamentals of China’s urbanization andpolicy,” China Review, vol. 10, no. 1, pp. 63–94, 2010.
[47] K. W. Chan, “Misconceptions and complexities in the studyof China’s cities: definitions, statistics, and implications,”Eurasian Geography and Economics, vol. 48, no. 4, pp. 383–412,2007.
[48] United Nations (UN), “World Urbanization Prospects, the2011 Revision: methodology: definition Problems,” 2011,http://esa.un.org/unup/Documentation/Definition-Problems1.htm.
[49] A. Getis and J. Ord, “The analysis of spatial association by useof distance statistics,” Geographical Analysis, vol. 24, pp. 189–206, 1992.
[50] S. J. Rey and M. V. Janikas, “STARS: space-time analysis ofregional systems,” Geographical Analysis, vol. 38, no. 1, pp. 67–86, 2006.
[51] L. Anselin, “The moran scatterplot as an ESDA tool to assesslocal instability in spatial association,” in Spatial AnalyticalPerspectives on GIS, M. Fischer, H. Scholten, and D. Unwin,Eds., pp. 111–125, Taylor and Francis, London, UK, 1996.
[52] Davidson and Spencer, “The World’s Largest City, Time,”2005, http://www.time.com/time/magazine/0,9171,1050477,00.html.
[53] S. Ke and E. Feser, “Count on the growth pole strategy forregional economic growth? Spread-backwash effects in greatercentral China,” Regional Studies, vol. 44, no. 9, pp. 1131–1147,2010.
[54] J. Shen, “Changing Patterns and Determinants of Interprovin-cial Migration in China 1985–2000,” Population, Space andPlace, vol. 18, no. 3, pp. 384–402, 2012.