thesis write up 6
TRANSCRIPT

1
The Regulation of the Serotonin Transporter and Na+/K
+
ATPase Pump by Thrombin in Rat Brain Synaptosomes
Neur 40060
Marie Sheehan – 10308687
Supervisor: Dr. Jana Haase
Submitted in part fulfilment of the requirements for the B.Sc (Honours)
Degree in Neuroscience
UCD School of Biomedical and Biomolecular Science

2
Summary:
The serotonin transporter is a member of the SLC6 gene family, a group of plasma
membrane transporters. The serotonin transporter is responsible for the reuptake of the
transmitter serotonin into neurons, after its release from presynaptic terminals. The
serotonin transporter functions through the active transport coupled to Na+ /Cl
- and K
+
ion gradients across the plasma membrane. This uptake helps terminate signal
transmission and is the first step in neurotransmitter recycling from the synaptic cleft.
Studies have shown that thrombin reduces the level of SERT activity in platelets and
brain tissue, most likely through interactions with PAR receptors. This study was aimed
at investigating the effect of thrombin on the uptake activity of serotonin in rat brain
synaptosomes, and whether the inhibitory effect of thrombin is linked to the Na+/K
+
ATPase pump. To do this, synaptosomes were prepared from rat brains. Synaptosomal
uptake of [3H] - 5HT was measured by 5-HT uptake assays using freshly prepared
synaptosomes. From these tests, it was found that thrombin had an inhibitory effect on
the 5-HT uptake in purified synaptosomes. Lipid rafts were isolated through the
centrifugation of crude synaptosomes through a discontinuous sucrose gradient.
Following lipid raft fractionation and isolation, these samples were then analysed by
Western blot techniques, using an array of antibody probes. Further studies were carried
out on both crude and purified synaptosomes, namely the investigation of Na+/K
+
ATPase pump activity, which was measured through a colorimetric ATPase assay. The
activity of the Na+/K
+ ATPase pump was shown to be reduced also in both crude and
purified synaptosomes in the presence of thrombin. This suggests that thrombin may
affect SERT activity by inhibiting the Na+/K
+ ATPase pump and hence diminishing the
Na+ gradient required for SERT-mediated 5-HT transport.
3
Table of Contents
Summary
Introduction
1.1: The serotonin transporter 1
1.2: Na+/K
+ ATPase pump 3
1.3: Thrombin 4
1.4: Project aims 4
Materials and Methods
2.1: Materials 6
2.2: Methods 8
2.2.1: Synaptosomal preparations and treatments 8
2.2.2: Synaptosomal 5-HT uptake assay 9
2.2.3: Lipid raft fractionation 9
2.2.4: Western blot 9
2.2.5: Colorimetric ATPase activity assay 10
Results
3.1: Synaptosomal 5-HT uptake assay 12
3.2: Western blot 14
3.3: Colorimetric ATPase activity assay 16
Discussion
4.1: Effect of thrombin on 5-HT uptake 24
4.2: Thrombin and lipid raft fractionation 24
4.3: Thrombin effect on Na+/K
+ ATPase pump 25
Acknowledgements 26
References
Abbreviations
Appendices
4
Figures and Tables
Figure 1: 5-HT uptake plate layout
Figure 2: 5-HT uptake in crude synaptosomes
Figure 3: 5-HT uptake in purified synaptosomes
Figure 4: Western blot examining thrombin treated lipid raft fractionation, using SERT,
flotillin, α3 and β1 ATPase antibodies
Figure 5: Western blot examining the effect of MβCD treatment on lipid raft fractions
Figure 6A: ATPase assay examining buffer absorbance
Figure 6B: ATPase assay examining fresh versus frozen ATP hydrolysis
Figure 7: 96 well plate assay using ATPase buffer and 34% sodium citrate
Figure 8: Crude protein concentration range in 96 well plate
Figure 9: Purified protein concentration in 96 well plate
Figure 10A: Crude versus purified synaptosomes in 96 well plates
Figure 10B: Comparison between crude and purified synaptosomes oubain sensitive
ATPase activity
Figure 11A: Effect of thrombin treatment on Na+/K
+ ATPase activity in crude
synaptosomes
Figure 11B: Examination of the effect of MβCD on crude synaptosomes oubain
sensitive ATPase activity in ATPase buffer, carried out in 96 well assay format
Figure 12: Examining the effect of thrombin treatment on Na+/K
+ ATPase activity in
purified synaptosomes
Table 1: Components of polyacrylamide gel for western blot
Table 2: Western blot antibody type and concentration
Table 3: ATPase activity assay vial layout and composition
Table 4: Pi standard curve vial composition and concentrations

5
Introduction:
1.1: The serotonin transporter
The seotonin transporter is a key psycho-stimulant and antidepressant target in the brain,
and is responsible for the re-uptake of the neurotransmitter serotonin in neurons as well
as in a number of peripheral cells. The serotonin transporter is a monoamine plasma
membrane transmitter belonging to the SLC6 gene family, similar to dopamine and
noradrenalin transporters.1 SERT functions by trafficking serotonin into the nerve cell
with Na+ and Cl
-, and transporting K
+ out of the nerve in the same reaction. It represents
the first step in transmitter recycling, as it is responsible for the reuptake of exocytosed
transmitters in the synaptic cleft. 5-HT is stored in serotonergic neurons in the brain, but
it is also stored in blood platelets in the periphery. It is believed to play a vital role in
platelet activation, aggregation and shape change during blood coagulation.2 To explain
the serotonin transport mechanism, an understanding of the alternative access model is
required.3 This model involves the binding of a substrate on both the cytoplasmic and
extracellular side of the plasma membrane. This model allows the difference in a
substrate’s transmembrane concentration to be the driving force behind the exchange. In
5-HT transport, a conformational change can only occur once a 1:1:1 stoichiometry
binding of Na+, Cl
-, and 5-HT occurs. Once this binding has occurred, an alteration in the
transporter conformation results in the translocation of these molecules from the
extracellular space to the cytoplasm. These substrates then dissociate to the cytoplasm.
Then, the transporter binds cytoplasmic K+ ions, and reverts back to its original
conformation, releasing the K+ into the extracellular space.
1 The transporter is composed
of 12 transmembrane domains, connected by hydrophilic loops. In recent years, SERT
has been exploited as a therapeutic drug target in the treatment of neurological disorders,
predominantly depression. SSRIs, such as citalopram, paroxetine and flouxetine, operate
6
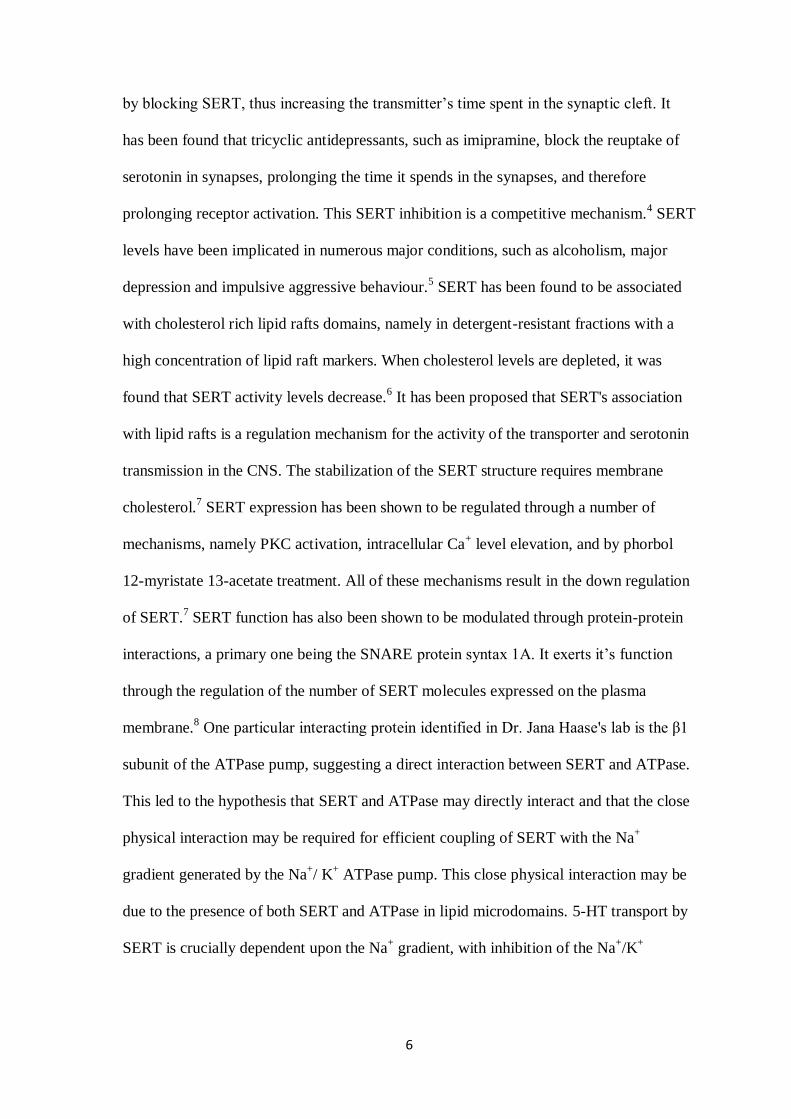
by blocking SERT, thus increasing the transmitter’s time spent in the synaptic cleft. It
has been found that tricyclic antidepressants, such as imipramine, block the reuptake of
serotonin in synapses, prolonging the time it spends in the synapses, and therefore
prolonging receptor activation. This SERT inhibition is a competitive mechanism.4 SERT
levels have been implicated in numerous major conditions, such as alcoholism, major
depression and impulsive aggressive behaviour.5 SERT has been found to be associated
with cholesterol rich lipid rafts domains, namely in detergent-resistant fractions with a
high concentration of lipid raft markers. When cholesterol levels are depleted, it was
found that SERT activity levels decrease.6 It has been proposed that SERT's association
with lipid rafts is a regulation mechanism for the activity of the transporter and serotonin
transmission in the CNS. The stabilization of the SERT structure requires membrane
cholesterol.7 SERT expression has been shown to be regulated through a number of
mechanisms, namely PKC activation, intracellular Ca+ level elevation, and by phorbol
12-myristate 13-acetate treatment. All of these mechanisms result in the down regulation
of SERT.7 SERT function has also been shown to be modulated through protein-protein
interactions, a primary one being the SNARE protein syntax 1A. It exerts it’s function
through the regulation of the number of SERT molecules expressed on the plasma
membrane.8 One particular interacting protein identified in Dr. Jana Haase's lab is the β1
subunit of the ATPase pump, suggesting a direct interaction between SERT and ATPase.
This led to the hypothesis that SERT and ATPase may directly interact and that the close
physical interaction may be required for efficient coupling of SERT with the Na+
gradient generated by the Na+/ K
+ ATPase pump. This close physical interaction may be
due to the presence of both SERT and ATPase in lipid microdomains. 5-HT transport by
SERT is crucially dependent upon the Na+ gradient, with inhibition of the Na
+/K
+

7
ATPase pump causing a reduction in SERT activity. This is due to the phosphorylation of
ATP being dependent upon sodium.9
1.2: Na+/K
+ ATPase pump
Na+/ K
+ ATPase pump is an important cellular component of the plasma membrane. It
functions to transport Na+ and K
+ ions across the plasma membrane using the hydrolysis
of ATP as the driving force.9 This process typically involves the translocation of 3 Na
+
ions out of the cell, with 2 K+ ions moving into the cell. This transfer generates both an
electrical and chemical gradient across the membrane. The pump is responsible for the
maintenance of the cell’s osmotic balance, the resting membrane potential, as well as the
excitability of muscle and nerve cells.10
The Na+/ K
+ ATPase pump is unique in that it is
specifically inhibited by cardiac glycosides, such as oubain. These inhibitors function by
binding to the enzyme’s extracellular side, thus inhibiting it. The pump is composed of 2
subunits, the α and β subunits respectively.11
Isoforms of both exist, with emphasis being
placed on the α3 and β1 subunits in this study. The α subunit typically has a mass of
around 113 kDa, while a mass of between 35 and 55 kDa is associated with the β subunit.
The α3 isoform is found solely in neural and cardiac tissue, with the β1 isoform being
ubiquitously expressed. It is the α subunit that is believed to contain the ATP binding and
phosphorylation sites, as well as being the location for the amino acids that are known to
be crucial for the binding of cardiac glycosides. The α cation selective gate is believed to
be due to the α1 subunit’s lysine rich NH2 terminus.12
The β subunit thus far appears to
play a role localising the ATPase to the plasma membrane, as well as ensuring normal
enzymatic activity.9

8
1.3: Thrombin
Thrombin is a member of the serine protease family and may play a role in the
development and pathology of the nervous system. Although found extensively in the
periphery, where it has a major role in the coagulation cascade, recent studies are
focusing more on thrombin’s activities in the CNS.13
It has been widely implicated in
signalling cascades during ischemia and stroke, but the mechanisms of action in these
situations are still yet to be fully elucidated. The serine protease family is a diverse group
of enzymes that rely on a serine residue for nucleophilic catalysis.14
Thrombin is a
protein composed of 2 chains, A and B, which are linked via a disulfide bond. The A
chain is composed of 36 amino acid residues, while the B chain has 259 residues, within
which lies the serine protease domain.14
Studies are beginning to highlight the presence
of thrombin not only on platelets but also within the nervous system. It has been shown
previously that thrombin has the ability to enhance neuronal activity.15
This spontaneous
activity is believed to be linked to the onset of seizures through the activation of PAR1.16
It has been shown that under normal physiological conditions several cell types express
receptors to thrombin. Expression of thrombin receptors has been shown in both cultured
neuronal cells, as well as in rat brains. Receptor localization in the brain and the spinal
cord has also been achieved, with specific areas on neurons and glia highlighted. This
receptor is being linked to an increase in intracellular calcium levels due to its influence
on the hydrolysis of inositol phospholipid. Proteases such as thrombin are believed to
regulate cells through the cleaving of PARs, with thrombin having a specific effect on
PAR1.17
PAR1 has been shown to have a modulatory role in the brain, with an effect on
the plasticity and transmission of synapses. PAR1 belongs to a group of G-protein
coupled receptors, and activation of this receptor required the cleavage of a peptide
bound on the extracellular N-terminus.18

9
1.4: Project aims
The aim of this project was to investigate the role of thrombin in the regulation of the
serotonin transporter and Na+/K
+ ATPase pump in rat brain synaptosomes. Synaptosomes
are isolated nerve terminals, formed through the homogenisation and centrifugation of
neural tissues. It has been recently shown that activation of PAR receptors by thrombin
results in the inhibition of SERT activity in platelets, but also in cultured mammalian
cells and rat brain synaptosomes.19
The aim of this project was to study the mechanism of
action of thrombin in rat brain synaptosomes in greater detail. A particular focus was on
the potential effects on the activity of the Na+/K
+ ATPase pump, which is responsible for
the maintenance of ion gradients across the neuronal membrane, and is also critical in
providing the driving force for the Na+-dependent transport of serotonin.

10
Materials and Methods:
2.1: Materials
[3H]-5-HT PerkinElmer
Acrylamide National Diagnostics
Adenosine triphosphate Sigma
Ammonium molybdate Sigma
APS Sigma
Ascorbic acid Sigma
BCA assay kit Pierce
Brij-58 Sigma
CaCl2 Sigma
DTT Sigma
ECL Pierce
EDTA Sigma
Escitalopram Sigma
Glucose Sigma
Glycine Fisher
HEPES Sigma
Horse serum Sigma
KCl Sigma
Malachite green Sigma
Methanol Sigma
MgCl2 Sigma
NaCl Sigma
Nitrocellulose membrane Sigma
11
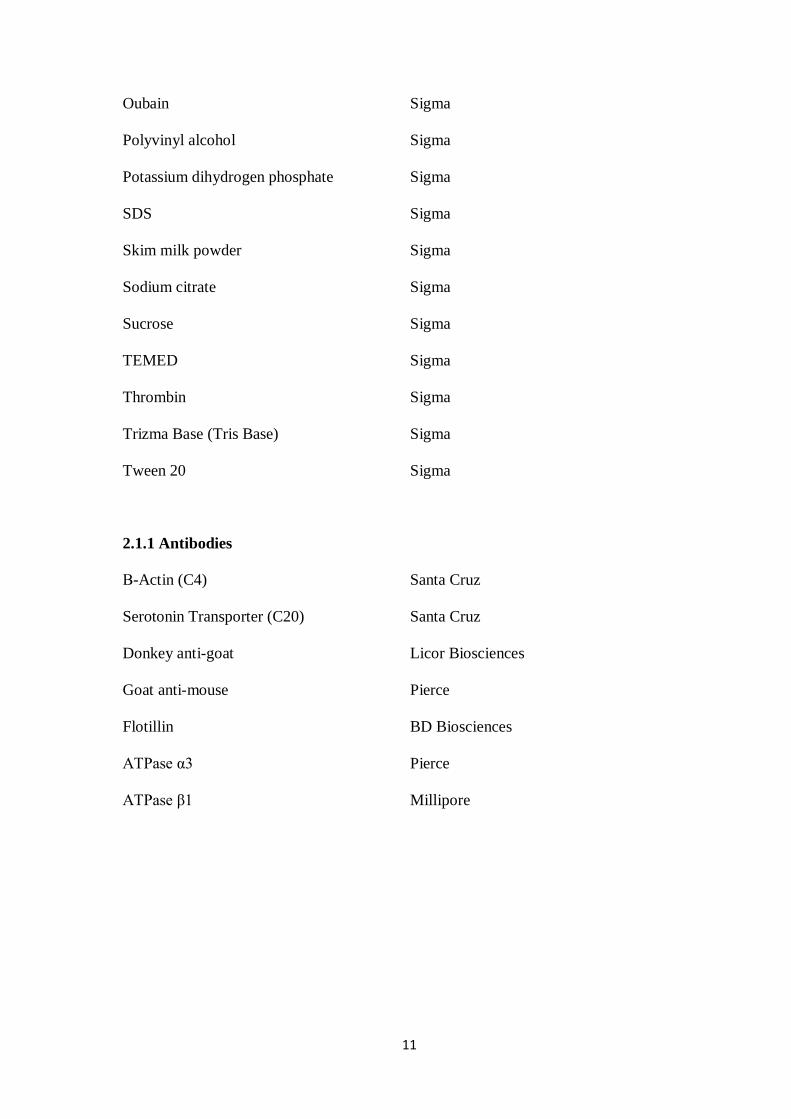
Oubain Sigma
Polyvinyl alcohol Sigma
Potassium dihydrogen phosphate Sigma
SDS Sigma
Skim milk powder Sigma
Sodium citrate Sigma
Sucrose Sigma
TEMED Sigma
Thrombin Sigma
Trizma Base (Tris Base) Sigma
Tween 20 Sigma
2.1.1 Antibodies
Β-Actin (C4) Santa Cruz
Serotonin Transporter (C20) Santa Cruz
Donkey anti-goat Licor Biosciences
Goat anti-mouse Pierce
Flotillin BD Biosciences
ATPase α3 Pierce
ATPase β1 Millipore
12
2.2: Methods:
2.2.1: Synaptosome preparation and treatments
Crude synaptosome:
The entire protocol was carried out on ice, and all centrifugation steps were carried out at
4°C to slow protein degradation. On ice, the brain was removed and dissected; with the
cerebellum removed (this is due to the low SERT content in the cerebellum). The tissue
was weighed and then placed in 9X volume homogenisation buffer (O.32 M sucrose).
The brain was then quartered before homogenisation commenced. Homogenisation was
carried out by hand using a potter-elvehjem homogenizer. Initially a 10 mL potter was
used, but was swapped to a 5 mL potter. The homogenate was transferred to two 15 mL
centrifugation vials. The homogenate was then centrifuged at 1,300 X g for 10 min in a
centrifuge. Pellet P1 was discarded, and the supernatant S1 was transferred to a fresh
15 mL centrifugation vial. Supernatant was then centrifuged at 17,000 X g for 10min.
Supernatant S2 was discarded and pellet P2 was washed in 1 mL homogenisation buffer.
The resuspended P2 pellet was centrifuged at 17,000 X g for 10 min. The resulting
supernatant was removed and the pellet resuspended in either homogenisation buffer or
transport buffer (10 mM HEPES, 150 mM NaCl, 2 mM KCl, 1mM CaCl2, 10 mM
glucose, pH 7.4) to be used in further experiments.
Purified synaptosomes:
After washing the P2 pellet (above) and centrifugated, the pellet was resuspended in
homogenisation buffer. Next the homogenised pellet was layered on a discontinuous
sucrose gradient. This gradient was composed of 1.2 M, 1 M and 0.85 M sucrose, with
the homogenate layered on top. Two gradients can be made per rat brain. Beckman
13
centrifuge tubes (no: 355631 tubes) were used, with 0.32 M sucrose used to balance the
contents before centrifugation. Centrifugation was carried out at 82,500 X g for 2 hr at
4 °C, with acceleration and deceleration set to slow. After centrifugation, the top layers
were removed, with synaptosomes being recovered from between 1 M and 1.2 M layers.
Synaptosomes were washed with 10 mL of 0.32 M sucrose, and centrifuged at 17,000 X
g for 15 min. The resulting pellet was resuspended in transport buffer, with a BCA assay
being carried out to determine protein concentration. Volume was adjusted as necessary,
and synaptosomes were then treated or frozen and stored at -80 °C.
Treatments:
Thrombin:
Synaptosomes were prepared as per protocol, with protein concentration determined by
BCA assay. Synaptosomes were diluted to 1 mg/mL in transport buffer for lipid raft
fractionation or ATPase buffer (5 mM MgCl2, 80 mM NaCl, 20 mM KCl, 40 mM Tris-
HCl, pH 7.4) for ATPase assay, and were then divided into 0.2 mL aliquots. Aliquots
were preheated to 37 °C for 10 min. 2 µl of 100 U/mL (final concentration 1 U/µL)
thrombin was added and samples were incubated at 37 °C for 10 min exactly. These were
then snap frozen using liquid nitrogen, and samples were stored at -80 °C until needed.
Controls were treated in parallel, with no thrombin being added.
MβCD:
Synaptosomes were prepared as per protocol, with the protein concentration being
determined by BCA assay. Synaptosomes were diluted to 1 mg/mL in transport buffer or
ATPase buffer. 0.5 mL sample and 0.5 mL control were vortexed at 17,000 X g for 10
min. The supernatant was removed and pellets were resuspended in the appropriate

14
medium. Control was resuspended in the appropriate buffer, while the MβCD sample
was resuspended in 1 mL buffer containing 10 μg/mL MβCD. The samples were
incubated at 37 °C for 10 min, and then centrifuged for 10 min at 17,000 X g. Pellets
were resuspended in 0.5 mL of the suitable buffer.
2.2.2: Synaptosomal 5-HT uptake
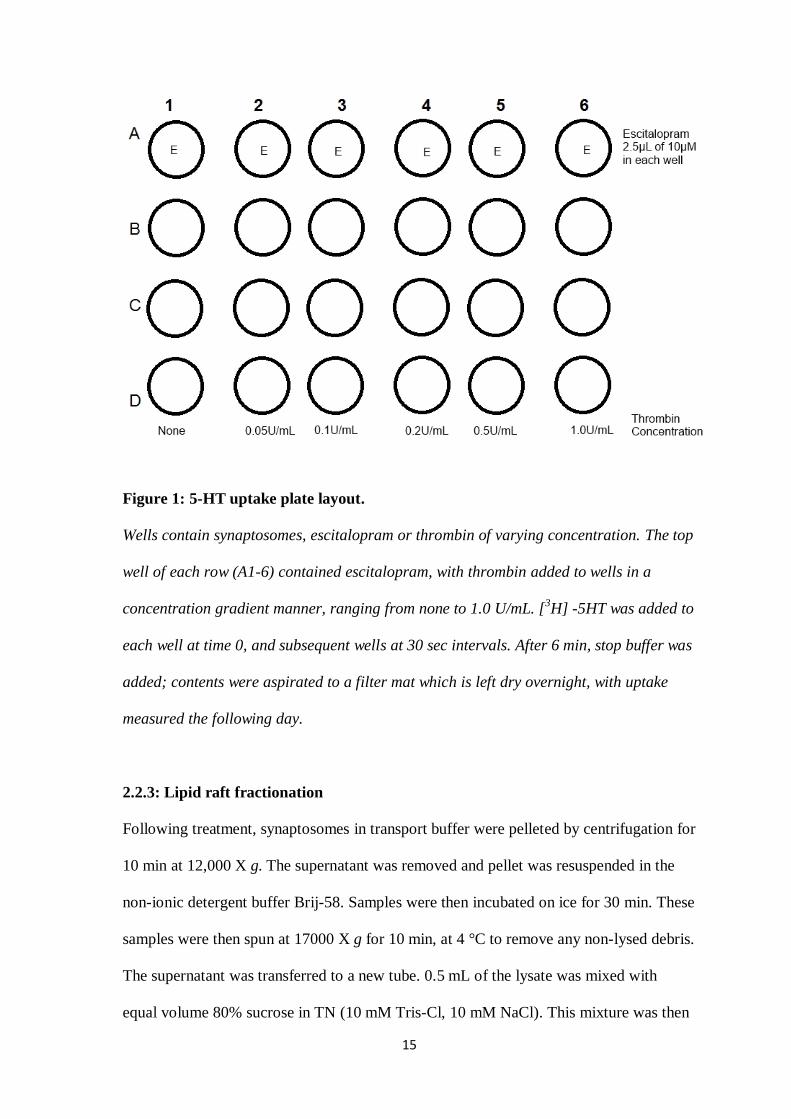
For 5-HT uptake a 24 well plate was used, with plate layout as follows. 50 µg of
synaptosomes were added to each well to a total volume of 200 µl. Rows 2-6 contained
2.5 µL of thrombin of varying concentration, ranging from 0.05-1 U/mL. The top well of
each row (A1-6) contained 2.5 µl escitalopram. The plate was then pre-incubated in the
water bath for 10 min exactly. At time 0 min, 50 µL of the 5-HT solution (transport
buffer with glucose, 500 µM ascetic acid, 250 nM 5-HT) was added to each well in row 1
and to subsequent rows at 30 second intervals. At 6 min, 0.8 mL ice cold stop buffer
(transport buffer, no glucose, 1 µM escitalopram) was added to each well in row 1, and
subsequent rows at 30 second intervals. Plate contents were then aspirated onto a filter
mat and left dry in fume hood overnight. Filter mats were placed in sample bags before 4
mL scintillation fluid was added and samples were counted using the microbeta counter.
15
Figure 1: 5-HT uptake plate layout.
Wells contain synaptosomes, escitalopram or thrombin of varying concentration. The top
well of each row (A1-6) contained escitalopram, with thrombin added to wells in a
concentration gradient manner, ranging from none to 1.0 U/mL. [3H] -5HT was added to
each well at time 0, and subsequent wells at 30 sec intervals. After 6 min, stop buffer was
added; contents were aspirated to a filter mat which is left dry overnight, with uptake
measured the following day.
2.2.3: Lipid raft fractionation
Following treatment, synaptosomes in transport buffer were pelleted by centrifugation for
10 min at 12,000 X g. The supernatant was removed and pellet was resuspended in the
non-ionic detergent buffer Brij-58. Samples were then incubated on ice for 30 min. These
samples were then spun at 17000 X g for 10 min, at 4 °C to remove any non-lysed debris.
The supernatant was transferred to a new tube. 0.5 mL of the lysate was mixed with
equal volume 80% sucrose in TN (10 mM Tris-Cl, 10 mM NaCl). This mixture was then

16
transferred to SW55Ti ultracentrifuge tubes. Samples were overlaid with 1 mL of 30%
sucrose in TN, followed by 0.5 mL of 5% sucrose in TN, forming a discontinuous
sucrose gradient. Tubes were balanced as required with 5% sucrose in TN before being
centrifuged for 17 hr at 134,000 X g at 4 °C. 8 fractions of 312 µL were isolated from the
top of the gradient. 150 µL of each fraction was mixed with 6X sample buffer (0.375 M
Tris pH 6.8, 12% SDS, 60% glycerol, 0.6 M DTT, 0.06% bromophenol blue), and then
stored at -20 °C. Fractions were then diluted further to reduce sucrose content before
being analysed by Western blot.
2.2.4: Western blot
Samples were mixed with the appropriate volume of 6X sample buffer and incubated at
37 °C for 10-15 min. Samples, with a protein marker on either side, were loaded onto a
polyacrylamide gel (4% stacking gel, 10% resolving gel, table 1) and run at 80 mV for 2
hr, and 100 mV for one hr, and then 120 mV until the sample dye had cleared the
resolving gel. Using wet transfer, the protein was transferred to a nitrocellulose
membrane at 160 mA for 1 gel, or 320mA for 2 gels. This transfer ran for 90 min. The
membrane was then blocked for an hour in approximately 20 mL of 5% milk in TBST
(50 mM Tris, 150 mM NaCl, 0.05% Tween 20). After this, the membrane was rinsed
three times in TBST for 15 min and once in TBS (50 mM Tris, 150 mM NaCl), then
incubated for 1 hr with the primary antibody in horse serum + TBST solution. The
membrane was then washed 3 times in TBST for 15 min each and once in TBS for 15
min also. The membrane was then incubated for 1 hr with the secondary antibody in 3%
horse serum in TBST/HRP. Following this, the membrane was washed 3 times for 15
17
min in TBST and once in TBS. The membrane was incubated in ECL for 1 min before
being allowed to expose photographic film for suitable exposure times.
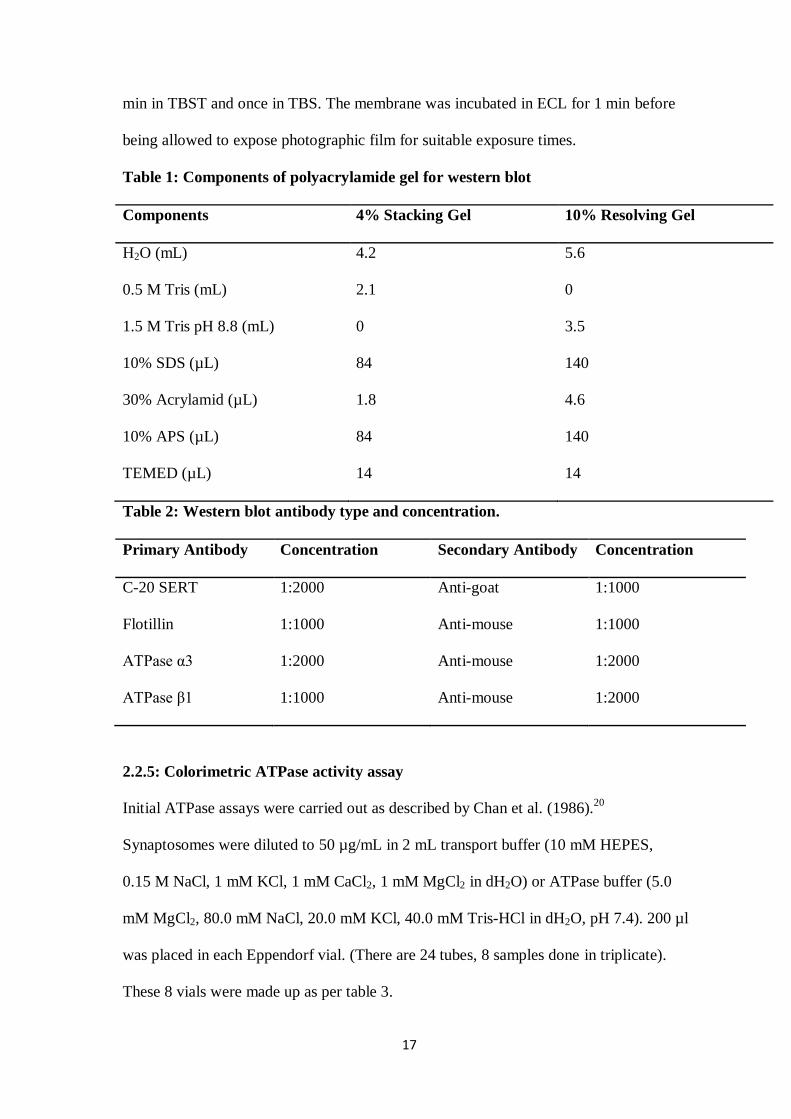
Table 1: Components of polyacrylamide gel for western blot
Components 4% Stacking Gel 10% Resolving Gel
H2O (mL) 4.2 5.6
0.5 M Tris (mL) 2.1 0
1.5 M Tris pH 8.8 (mL) 0 3.5
10% SDS (µL) 84 140
30% Acrylamid (µL) 1.8 4.6
10% APS (µL) 84 140
TEMED (µL) 14 14
Table 2: Western blot antibody type and concentration.
Primary Antibody Concentration Secondary Antibody Concentration
C-20 SERT 1:2000 Anti-goat 1:1000
Flotillin 1:1000 Anti-mouse 1:1000
ATPase α3 1:2000 Anti-mouse 1:2000
ATPase β1 1:1000 Anti-mouse 1:2000
2.2.5: Colorimetric ATPase activity assay
Initial ATPase assays were carried out as described by Chan et al. (1986).20
Synaptosomes were diluted to 50 µg/mL in 2 mL transport buffer (10 mM HEPES,
0.15 M NaCl, 1 mM KCl, 1 mM CaCl2, 1 mM MgCl2 in dH2O) or ATPase buffer (5.0
mM MgCl2, 80.0 mM NaCl, 20.0 mM KCl, 40.0 mM Tris-HCl in dH2O, pH 7.4). 200 µl
was placed in each Eppendorf vial. (There are 24 tubes, 8 samples done in triplicate).
These 8 vials were made up as per table 3.

18
Table 3: ATPase activity assay vial layout and composition
Sample Synaptosomes Buffer ATP Oubain
1 10 µg TB None None
2 10 µg TB 2 mM None
3 10 µg TB 2 mM 1 mM
4 None TB 2 mM None
5 10 µg ATPase None None
6 10 µg ATPase 2 mM None
7 10 µg ATPase 2 mM 1 mM
8 None ATPase 2 mM None
For both the vial and 96 well assay, Pi mixed reagent was made up containing 1 part
ammonium molybdate dissolved in 6N HCl, 1 part polyvinyl alcohol dissolved in boiling
H2O, 2 parts H2O and 2 parts malachite green dye dissolved in H2O. Pi mixed reagent
was allowed stand at room temperature for 30 min, or until a golden brown colour had
developed, before use.
Once vials were made up according to the table (with no ATP added) they were
incubated for 15 min at 37 °C. After this incubation period, 2 mM ATP was added and
the samples were incubated once more for 5 min exactly at 37 °C. 1 mL of Pi mixed
reagent was added to each vial and the samples were centrifuged at 17,000 X g for 5 min.
1 mL of each sample was transferred to fresh cuvettes and the absorbance was read at
630 nm.

19
96 well plate protocol:
Synaptosomes were diluted in ATPase buffer to a concentration of 250 µg/mL. 50 mM
stock of oubain was prepared by dissolving oubain in heated H20, around 60 °C, and
stored in 50 µL aliquots until needed, protected from sunlight. These aliquots were
preheated to 70 °C before use. Synaptosomes were incubated for 15 min at 37 °C. After
incubation, 10 µL of 2 mM ATP was to each well. This was then incubated for 5 min
exactly. After incubation, 200 µL of Pi reagent was added to each well, followed
immediately by 25 µL of 1.16 M sodium citrate solution. The absorbance was read at 630
nm right away.
Pi standard curve:
Using potassium dihydrogen phosphate (MW 136.09,) 100 mM stock was made. From
this a working stock of 0.1 mM was prepared.
Table 4: Pi standard curve vial composition and concentrations
Tube 0.1 mM working stock (µl) H2O (µl) Pi concentration (µM)
1 0 1000 0
2 10 990 1
3 20 980 2
4 30 970 3
5 40 960 4
6 50 950 5
7 100 900 10
8 150 850 15
20
9 200 800 20
10 300 700 30
11 400 600 40
12 500 500 50
250 µl of each of the above solutions was used. These were incubated for 10 min at
37 °C. 1 mL of mixed Pi reagent was added, and solutions were vortexed and read at
630 nm. For 96 well plate assay, 50 µl of each concentration was used and the protocol
was followed as normal. After incubation, 200 µl of reagent was added to each well,
followed by 25 µl 1.16 M sodium citrate. Absorbance was read immediately.
Results:
3.1: Synaptosomal 5-HT uptake assay
To examine the effect of thrombin on synaptosomal serotonin uptake, fresh
synaptosomes were prepared, and a series of uptake assays were carried out using a
concentration gradient of thrombin. These uptakes were carried out using both crude and
purified synaptosomes, with the controls of each taken to be 100% uptake. Thrombin is
believed to decrease the uptake of 5-HT in synaptosomes due to it’s activation of PAR
receptors. Thrombin’s effect on PAR receptors is known to be concentration dependent,
requiring a low concentration. Initial experiments focussed on the effect of thrombin on
5-HT uptake in crude synaptosomes. From these experiments it was found that thrombin
did not significantly decrease the 5-HT uptake in crude synaptosomes. No statistically
significant results were obtained over the thrombin concentration gradient. Results of the
5-HT uptake can be seen in figure 2.
21
Contr
ol
0.05 0.
10.
20.
51.
0
0
50
100
150
Thrombin Concentration U/mL
5H
T U
pta
ke %
of
Co
ntr
ol
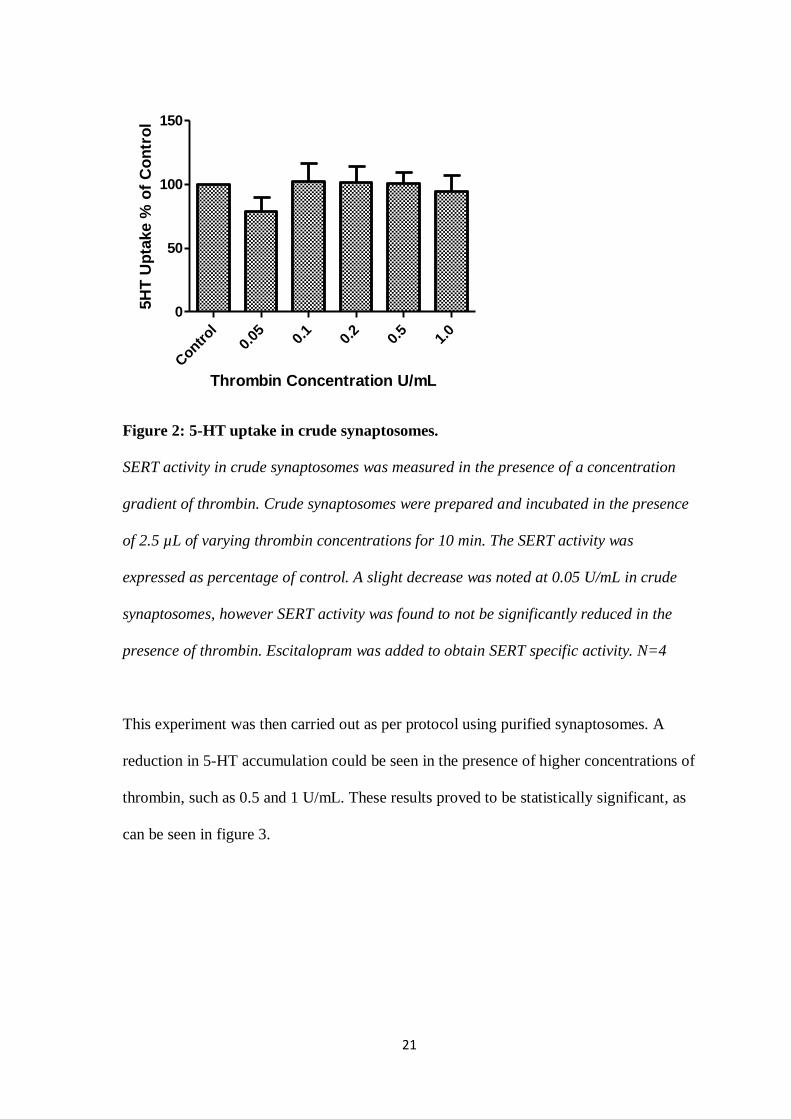
Figure 2: 5-HT uptake in crude synaptosomes.
SERT activity in crude synaptosomes was measured in the presence of a concentration
gradient of thrombin. Crude synaptosomes were prepared and incubated in the presence
of 2.5 µL of varying thrombin concentrations for 10 min. The SERT activity was
expressed as percentage of control. A slight decrease was noted at 0.05 U/mL in crude
synaptosomes, however SERT activity was found to not be significantly reduced in the
presence of thrombin. Escitalopram was added to obtain SERT specific activity. N=4
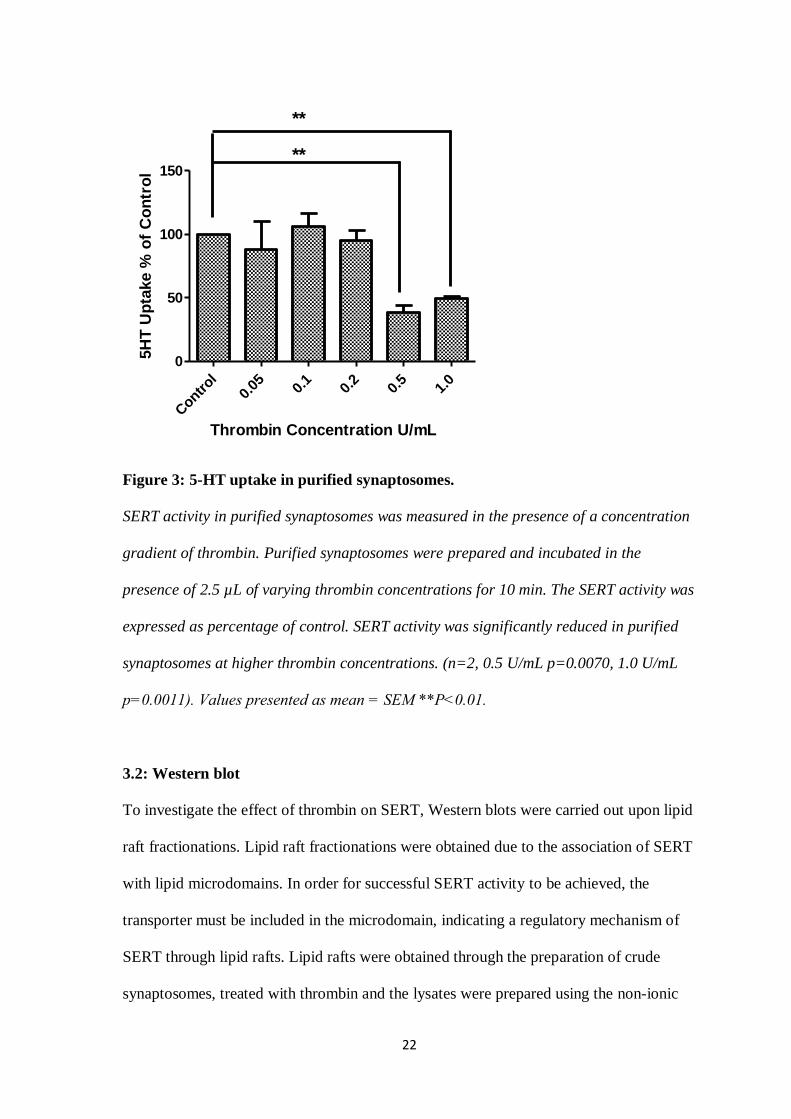
This experiment was then carried out as per protocol using purified synaptosomes. A
reduction in 5-HT accumulation could be seen in the presence of higher concentrations of
thrombin, such as 0.5 and 1 U/mL. These results proved to be statistically significant, as
can be seen in figure 3.
22
Contr
ol
0.05 0.
10.
20.
51.
0
0
50
100
150**
**
Thrombin Concentration U/mL
5H
T U
pta
ke %
of
Co
ntr
ol
Figure 3: 5-HT uptake in purified synaptosomes.
SERT activity in purified synaptosomes was measured in the presence of a concentration
gradient of thrombin. Purified synaptosomes were prepared and incubated in the
presence of 2.5 µL of varying thrombin concentrations for 10 min. The SERT activity was
expressed as percentage of control. SERT activity was significantly reduced in purified
synaptosomes at higher thrombin concentrations. (n=2, 0.5 U/mL p=0.0070, 1.0 U/mL
p=0.0011). Values presented as mean = SEM **P˂0.01.
3.2: Western blot
To investigate the effect of thrombin on SERT, Western blots were carried out upon lipid
raft fractionations. Lipid raft fractionations were obtained due to the association of SERT
with lipid microdomains. In order for successful SERT activity to be achieved, the
transporter must be included in the microdomain, indicating a regulatory mechanism of
SERT through lipid rafts. Lipid rafts were obtained through the preparation of crude
synaptosomes, treated with thrombin and the lysates were prepared using the non-ionic
23
detergent Brij-58. Lysates were then layered on a discontinuous sucrose gradient and
centrifuged. Once the lipid raft fractions were collected, diluted and mixed with sample
buffer, they were loaded onto a Western blot gel. The gel was run according to the
protocol, with various antibody probes used, and the blots were then developed. The
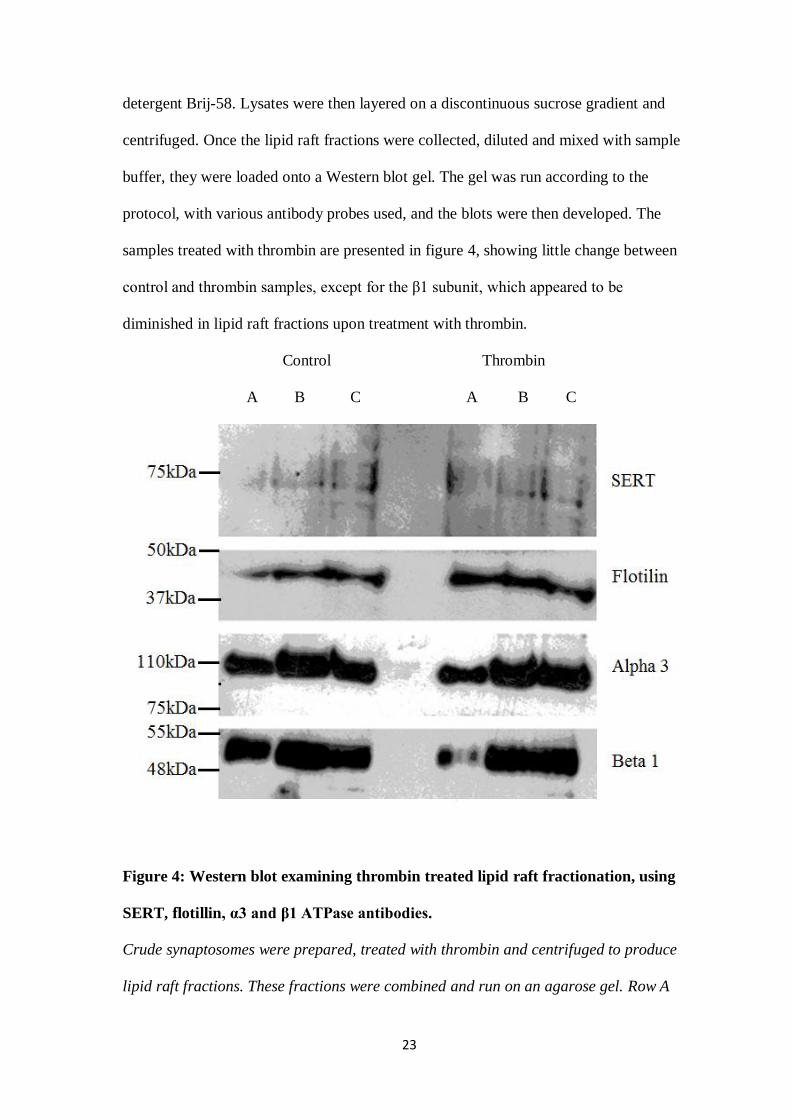
samples treated with thrombin are presented in figure 4, showing little change between
control and thrombin samples, except for the β1 subunit, which appeared to be
diminished in lipid raft fractions upon treatment with thrombin.
Control Thrombin
A B C A B C
Figure 4: Western blot examining thrombin treated lipid raft fractionation, using
SERT, flotillin, α3 and β1 ATPase antibodies.
Crude synaptosomes were prepared, treated with thrombin and centrifuged to produce
lipid raft fractions. These fractions were combined and run on an agarose gel. Row A
24
contains the top 3 fractions, row B contains fractions 4-6, and row C of each column
contains fractions 7 and 8. Gel was run as per protocol. Bands appeared at expected
sizes, as indicated, with little difference between control and thrombin treated, save for a
shift in the β1 subunit band.
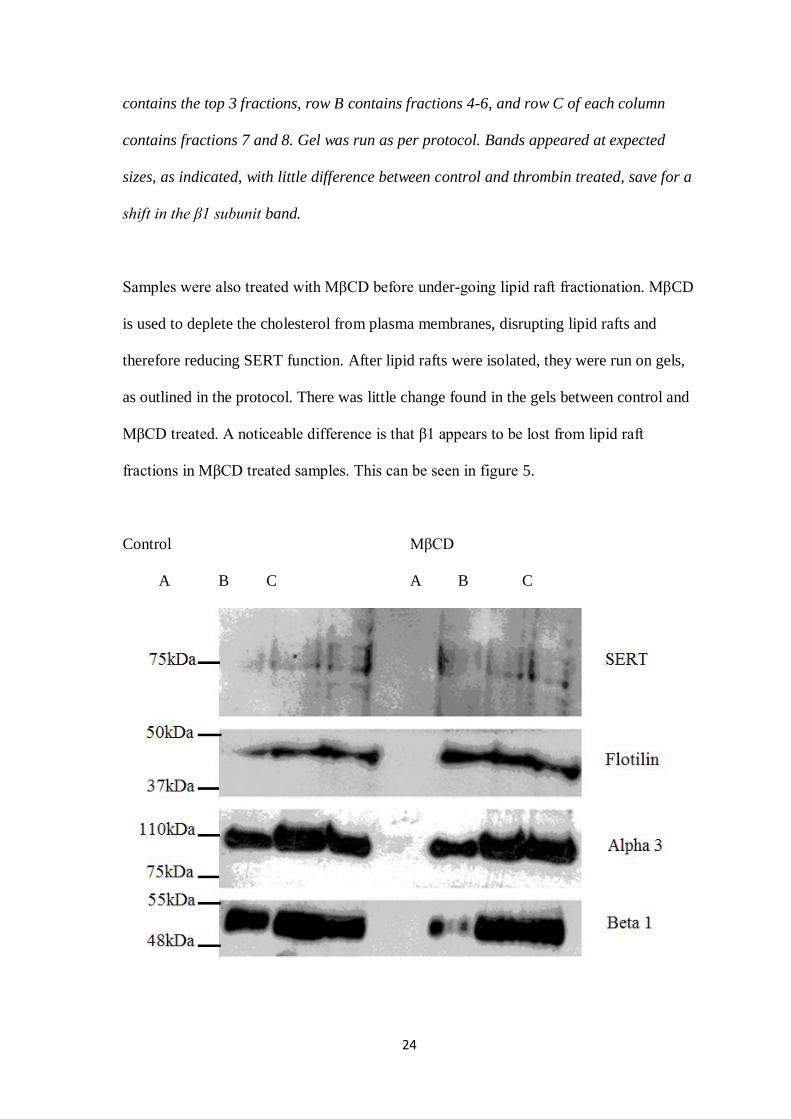
Samples were also treated with MβCD before under-going lipid raft fractionation. MβCD
is used to deplete the cholesterol from plasma membranes, disrupting lipid rafts and
therefore reducing SERT function. After lipid rafts were isolated, they were run on gels,
as outlined in the protocol. There was little change found in the gels between control and
MβCD treated. A noticeable difference is that β1 appears to be lost from lipid raft
fractions in MβCD treated samples. This can be seen in figure 5.
Control MβCD
A B C A B C
25
Figure 5: Western blot examining the effect of MβCD treatment on lipid raft
fractions.
Crude synaptosomes were prepared, treated with MβCD and centrifuged to produce lipid
raft fractions. These fractions were combined and run on an agarose gel. Row A contains
the top 3 fractions, row B contains fractions 4-6, and row C of each column contains
fractions 7 and 8. Most bands appeared at expected sizes, save for MβCD treated
samples at the β1 fraction. It appears as though a shift has occurred from the higher to
the lower fractions, with little β1 being found in fractions 1-3.
3.3: Colorimetric ATPase activity assay
Initially, the ATPase assay was carried using vials to determine the ATPase activity in
synaptosomes. However, using this methodology produced results with high ATP
hydrolysis in the buffer solutions, as can be seen in figure 7A. This high background
made it difficult to distinguish between the background hydrolysis of ATP, and the
specific hydrolysis of ATPase synaptosomes. High background can be caused by a
number of factors, such as free Pi contamination. To reduce the background hydrolysis,
the experiment protocol was modified in a number of ways. First, the volumes were
reduced from 1 mL of solution absorbance being read, down to 275 µl, which allowed the
experiment to be carried out in a 96 well plate. Next, a colour stabilizer was added, in
this case sodium citrate. A number of experiments were carried out, in which the
percentage of sodium citrate was altered, as well as the time before reading of absorbance
was also manipulated. Through these experiments it was found that 34% sodium citrate,
added immediately after reaction was stopped and absorbance read immediately, gave the
most consistent results. Another factor that was considered in order to reduce background
hydrolysis was whether the ATP used was fresh or had been frozen. Experiments were

26
carried out to determine if this was a factor in the high buffer absorbance of reaction
buffer containing ATP. As can be seen in figure 6B, there was little distinguishable
difference between fresh and frozen ATP, with high buffer absorbance present in control
samples. Fresh ATP however gave higher absorbance values in samples when measuring
ATPase activity in synaptosomes, and was used throughout the following experiments.
These modifications resulted in the reduction of ATP hydrolysis in the buffer solutions
containing no synaptosomes. Once the protocol had been optimized, the assay could then
be used to calculate oubain sensitive ATPase activity in both crude and purified
synaptosomes.
Buff
er
Buff
er +
ATP
0.0
0.2
0.4
0.6TB Buffer
ATPase Buffer
Ab
so
rban
ce (
630n
m)
Figure 6A: ATPase assay examining buffer absorbance.
ATPase assay carried out as per initial protocol, using vials. Transport buffer and
ATPase buffer were used to determine optimum buffer. Vials contained either buffer, or
buffer with 2 mM ATP. Vials were incubated for 5 min exactly at 37 °C. After this time,
1 mL of Pi mixed reagent was added to each vial to halt the reaction. High background
absorbance was seen due to the high ATP hydrolysis in both buffer solutions containing

27
ATP. ATPase buffer shown to be the optimum buffer and was therefore used in further
experiments.
To determine the cause of the high background ATP hydrolysis in buffer solutions, ATP
was made up fresh on day of experiment, and aliquots were prepared, frozen and
defrosted on day of experiment, to determine if it was a factor.
Syn
apto
som
es +
Buff
er
Syn
apto
som
es +
Buff
er +
ATP
Syn
apto
som
es +
Buff
er +
Oubai
n + A
TP
Buff
er +
ATP
0.0
0.5
1.0
1.5
2.0
Purified, fresh ATP
Purified, frozen ATP
Crude, fresh ATP
Crude, frozen ATP
Ab
so
rban
ce (
630n
m)
Figure 6B: ATPase assay examining fresh versus frozen ATP hydrolysis.
Vials were made up as per table 3. High background hydrolysis was observed regardless
of fresh or frozen ATP used in buffer with ATP solutions. Fresh and frozen ATP was
tested on both crude and purified samples. Fresh ATP was used after this experiment
due to better hydrolysis in both crude and purified samples. However it was determined
to not be a major factor in the high background absorbance.

28
In order to reduce the high background absorbance in buffer solutions, the protocol was
adjusted. ATPase buffer was the buffer chosen, with fresh ATP. 34% sodium citrate was
incorporated after the addition of the Pi mixed reagent, with absorbance read
immediately afterwards. Volumes were reduced from vials to a 96 well plate assay.
These adjustments let to the reduction in background absorbance due to reduced
hydrolysis of ATP in buffer solutions. Specific hydrolysis in synaptosome containing
solutions did not appear reduced.
Buff
er
Buff
er +
ATP
Cru
de Syn
ap +
ATP
0.0
0.5
1.0
1.5
Ab
so
rban
ce (
630n
m)
Figure 7: 96 well plate assay using ATPase buffer and 34% sodium citrate.
Protocol was optimized to reduce high ATP hydrolysis in buffer solutions. Protocol was
reduced to 96 well plate, with the inclusion of 34% sodium citrate, and absorbance read
immediately after addition. These alterations produced a reduction is in the background
ATP hydrolysis of the buffer sample.
29
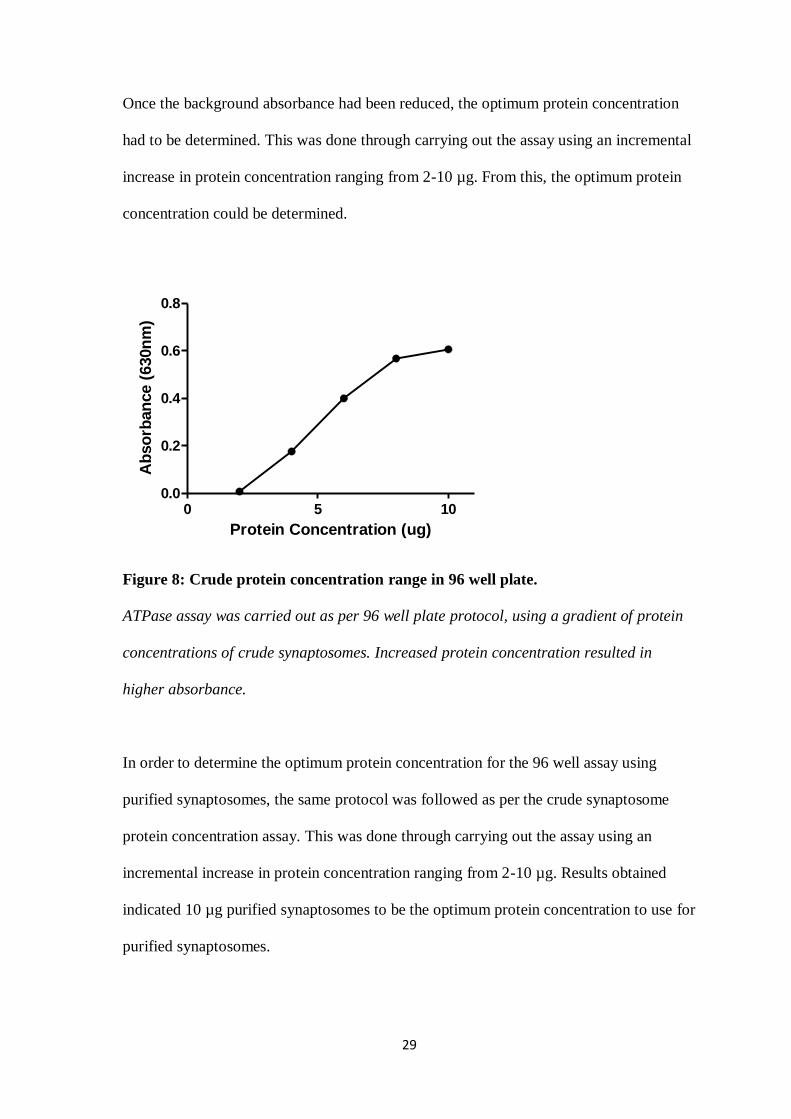
Once the background absorbance had been reduced, the optimum protein concentration
had to be determined. This was done through carrying out the assay using an incremental
increase in protein concentration ranging from 2-10 µg. From this, the optimum protein
concentration could be determined.
0 5 100.0
0.2
0.4
0.6
0.8
Protein Concentration (ug)
Ab
so
rban
ce (
630n
m)
Figure 8: Crude protein concentration range in 96 well plate.
ATPase assay was carried out as per 96 well plate protocol, using a gradient of protein
concentrations of crude synaptosomes. Increased protein concentration resulted in
higher absorbance.
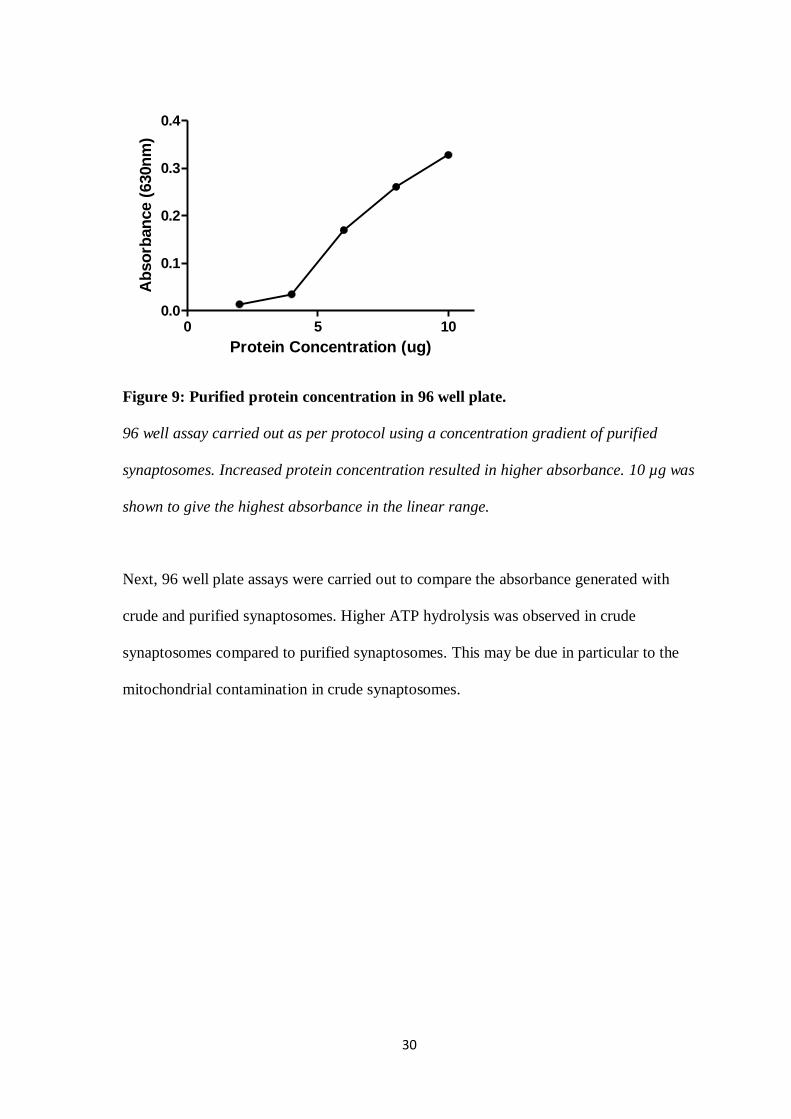
In order to determine the optimum protein concentration for the 96 well assay using
purified synaptosomes, the same protocol was followed as per the crude synaptosome
protein concentration assay. This was done through carrying out the assay using an
incremental increase in protein concentration ranging from 2-10 µg. Results obtained
indicated 10 µg purified synaptosomes to be the optimum protein concentration to use for
purified synaptosomes.
30
0 5 100.0
0.1
0.2
0.3
0.4
Protein Concentration (ug)
Ab
so
rban
ce (
630n
m)
Figure 9: Purified protein concentration in 96 well plate.
96 well assay carried out as per protocol using a concentration gradient of purified
synaptosomes. Increased protein concentration resulted in higher absorbance. 10 µg was
shown to give the highest absorbance in the linear range.
Next, 96 well plate assays were carried out to compare the absorbance generated with
crude and purified synaptosomes. Higher ATP hydrolysis was observed in crude
synaptosomes compared to purified synaptosomes. This may be due in particular to the
mitochondrial contamination in crude synaptosomes.

31
Bla
nk +
ATP
Cru
de ATP
Cru
de ATP
Oubai
n
Puri
fied A
TP
Puri
fied A
TP O
ubain
0.0
0.2
0.4
0.6
0.8
1.0
Ab
so
rban
ce (
630n
m)
Figure 10A: Crude versus purified synaptosomes in 96 well plates.
Fresh ATP and ATPase buffer were used to compare crude and purified synaptosome
absorbance. 96 well plate assay was carried out using10 µg crude and purified
synaptosomes. Higher absorbance values were obtained for crude synaptosomes
compared with purified. Background absorbance was much reduced using the optimized
protocol.
To further analyse the activity within the samples, the oubain sensitive ATPase activity
was examined. Higher activity was seen in crude samples compared to purified
synaptosomes. To isolate oubain sensitive ATPase activity, the assay was carried out
with some wells containing the cardiac glycoside oubain. Oubain is a known inhibitor of
the Na+/K
+ ATPase pump. Results from oubain containing wells were subtracted from
wells without (total ATPase), giving the final oubain sensitive activity, which
corresponds to the activity of the Na+/K
+ ATPase pump. Higher oubain sensitive activity
was observed in crude samples, illustrated in figure 11B.

32
Cru
de
Puri
fied
0
50
100
150
200
Ou
bain
Sen
sit
ive A
TP
ase A
cti
vit
y
(nm
ol
Pi/
mg
/min
)
Figure 10B: Comparison between crude and purified synaptosomes oubain sensitive
ATPase activity.
96 well plate assay carried out using crude and purified synaptosomes, with the cardiac
glycoside oubain present in some wells. Oubain inhibited the Na+/K
+ ATPase pump.
When results from oubain containing wells were subtracted from those without, oubain
sensitive ATPase activity could be seen. Crude synaptosomes exhibit higher oubain
sensitive activity compared to purified synaptosomes.
Following this, the effect of thrombin on the oubain sensitive ATPase activity was
examined. To examine the effect of thrombin, crude synaptosomes were treated with
thrombin. After treatment, a 96 well plate assay was carried out. Oubain sensitive activity
was calculated, and showed a slight decrease in activity in those synaptosomes treated
with thrombin, shown in figure 11A. However this difference was not found to be
substantial and additional experiments should be carried out to ascertain any effect.

33
Contr
ol Thro
mbin
Throm
bin
0
100
200
300
400O
ub
ain
Sen
sit
ive A
TP
ase A
cti
vit
y
(nm
ol
Pi/
mg
/min
)
Figure 11A: Effect of thrombin treatment on Na+/K
+ ATPase activity in crude
synaptosomes.
96 well plate carried out examining the effect of thrombin treatment on the activity of the
Na+/K
+ ATPase pump in crude synaptosomes. A slight reduction of oubain sensitive
ATPase activity can be seen in the presence of thrombin treated crude synaptosomes.
However, this reduction does not appear substantial.

34
Contr
ol MBCD
MBCD
0
200
400
600
800O
ub
ain
Sen
sit
ive A
TP
ase A
cti
vit
y
(nm
ol
Pi/
mg
/min
)
Figure 11B: Examination of the effect of MβCD on crude synaptosomes oubain
sensitive ATPase activity in ATPase buffer, carried out in 96 well assay format.
96 well plate assay was carried out using MβCD treated crude synaptosomes and control
crude synaptosomes. Oubain is used inhibited the Na+/K
+ ATPase pump. When results
from oubain containing wells were subtracted from those without, oubain sensitive
ATPase activity could be seen. A substantial reduction in oubain sensitive activity can be
seen in the presence of MβCD treated crude synaptosomes.
In this experiment MβCD was used as a positive control for lipid raft disruption. It has
been shown previously18
that thrombin inhibits SERT activity and lipid raft association.
It was hypothesized that this could be due to the disruption of the association between
SERT and ATPase, which may be functionally, and possibly physically, linked within
lipid rafts. Thus, MβCD was used to test whether lipid raft disruption would have an
effect on ATPase activity. This disruption affects the activity of the Na+/K
+ ATPase
pump, showing a substantial decrease in pump activity. This can be seen clearly in figure
35
11B, however, this experiment was carried out once and so would need to be replicated
to determine significance.
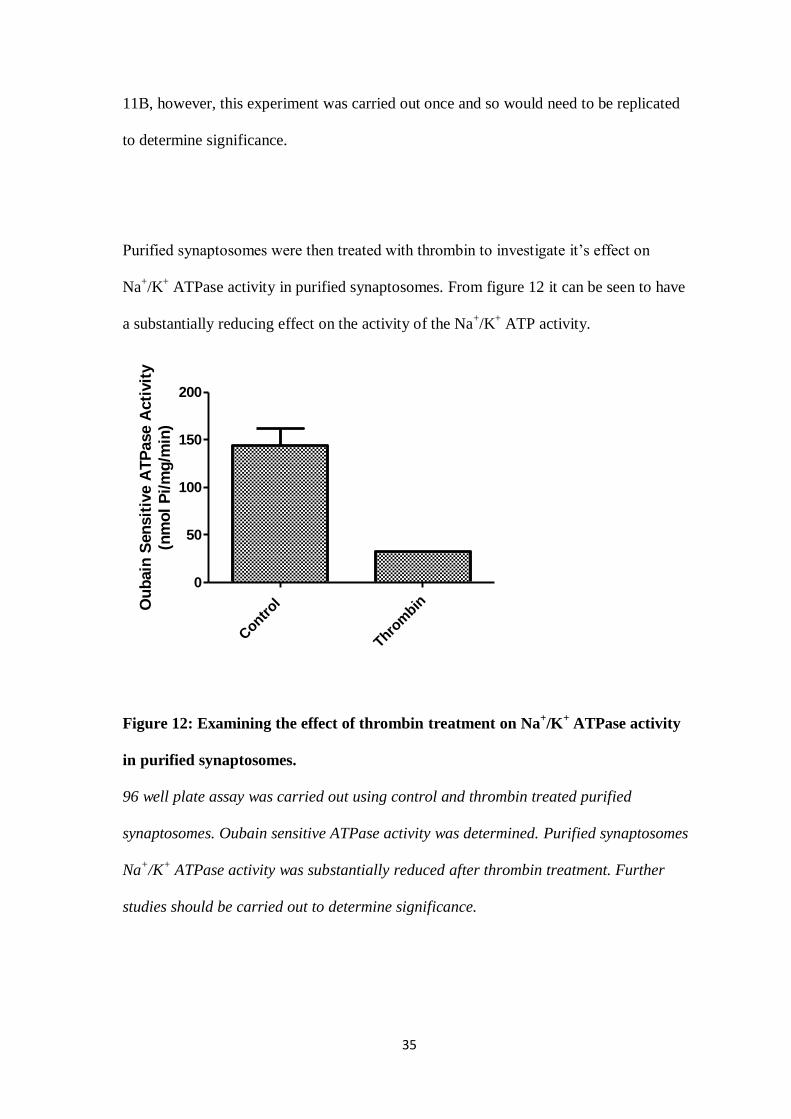
Purified synaptosomes were then treated with thrombin to investigate it’s effect on
Na+/K
+ ATPase activity in purified synaptosomes. From figure 12 it can be seen to have
a substantially reducing effect on the activity of the Na+/K
+ ATP activity.
Contr
ol
Throm
bin
0
50
100
150
200
Ou
bain
Sen
sit
ive A
TP
ase A
cti
vit
y
(nm
ol
Pi/
mg
/min
)
Figure 12: Examining the effect of thrombin treatment on Na+/K
+ ATPase activity
in purified synaptosomes.
96 well plate assay was carried out using control and thrombin treated purified
synaptosomes. Oubain sensitive ATPase activity was determined. Purified synaptosomes
Na+/K
+ ATPase activity was substantially reduced after thrombin treatment. Further
studies should be carried out to determine significance.

36
Discussion:
4.1: Effect of thrombin on 5-HT uptake
5-HT uptakes were carried out on both crude and purified synaptosomes, to examine the
effect of thrombin on 5-HT uptake. At varying concentrations, thrombin was shown to
have a reducing effect on the uptake of both crude and purified synaptosomes; however
in crude synaptosomes this result was not significant. Specific uptake levels were very
low compared to typical 5-HT uptakes. This may be due to the synaptosome preparation
method. In other uptakes the [3H] -5HT accumulation numbers are much higher than
what was achieved in the uptakes shown here (figures 2 and 3). This may be due to the
preparation method not resulting in highly active synaptosomes. In purified
synaptosomes, thrombin inhibited the 5-HT uptake significantly, as can be seen in figure
3. Overall the synaptosome preparation seems not to be optimal. An alteration in
synaptosome preparation may increase 5-HT uptake activity. However overall, even with
low 5-HT accumulation, an inhibitory effect of thrombin was still seen observed, in
particular in purified synaptosomes. This experiment would need to be replicated in order
to determine conclusively the significance of this reduction.
4.2: Thrombin and lipid raft fractionation
Crude synaptosomes were used in lipid raft fractionation. After the synaptosomes were
prepared and treated, with either thrombin or MβCD, lipid raft fractions were isolated.
Brij-58 was used as the detergent to lyse the synaptosomes before centrifugation. After
centrifugation, fractions were combined and ran on an agarose gel. Little difference was
observed between the control and treated samples. Thrombin appears to have no effect on
lipid raft formation; however in previous studies18
a change was seen. A similar result
was observed in samples treated with MβCD. A change is expected, as MβCD is a known
37
lipid raft disruptor, due to its removal of cholesterol from the plasma membrane.
Because of this, the results from the Western blot are inconclusive regarding the effect of
thrombin on lipid raft fractionation. It would be expected that MβCD, and to some
extend thrombin, would result in the disruption of lipid rafts. Only a slight change was
observed in the fractions analysed through Western blot. In both thrombin and MβCD a
shift in the β1 subunit observed. This indicates a disruption to the lipid raft association
with the β1 subunit. However, this experiment needs to be replicated in order to
determine the significance of this result and to quantify the shift in order to draw final
conclusions. This shift may be due to the disruption between the β1 subunit of the Na+/K
+
ATPase pump and lipid rafts in the synaptosomes. The β1 subunit has been previously
identified in Dr. Haase’s lab as a potential SERT- interacting protein, which led to the
hypothesis that SERT and the ATPase pump may directly interact. This may occur
through a close physical association, which may be required for the efficient coupling of
SERT with the Na+ gradient generated by the Na
+/K
+ ATPase pump. Previous work
19 in
platelets showed that thrombin causes a dissociation of SERT from lipid rafts, possibly
also disrupting the coupling to the ATPase pump.
4.3: Thrombin effect on Na+/K
+ ATPase pump
In order to analyse the activity of Na+/K
+ ATPase pump in synaptosomes, the initial
protocol had to be adjusted in order to reduce the background hydrolysis of ATP in
buffer solutions. The type of buffer and the freshness of ATP were shown to not be the
cause of the high absorbance. The reduction in volume, the addition of sodium citrate,
and the optimization of timing were essential in order to examine the accurate activities
of the Na+/K
+ ATPase pump, particularly in the presence of thrombin. The high
hydrolysis of ATP in buffer solutions was a major challenge faced initially, as this high
38
background masked the actual activity of synaptosome containing samples. The high
background made it impossible to accurately examine the oubain sensitive ATPase
activity in synaptosomes, also inhibiting the examination of the effect of thrombin on this
process. Once this challenge was overcome through the optimization of the protocol as
explained previously, thrombin was shown to reduce the activity of the Na+/K
+ ATPase
pump in the 96 well plate assays. This reduction was observed in both crude and purified
synaptosomes. To accurately examine the ATPase activities, the optimum protein
concentration of both crude and purified synaptosomes had to be determined. Once
again, the less than optimum crude preparation may have had a detrimental effect upon
these results, but it was uncovered that in purified synaptosomes, 10 µg of protein
produced the best results. In crude synaptosomes, a lower protein concentration, within
the linear range, would have been more suitable. Further experiments showed that
ATPase buffer and fresh ATP produced the best results in assays. One of the most
difficult aspects of this assay was the use of oubain. In order to function properly, oubain
must be heated to 70 °C before being pipetted, in order to ensure the oubain is in
solution. Considering the time constraints in the protocol, the handling challenges of
oubain may have had an effect on results. However, even with this challenge, thrombin
still exerted an effect on activity, yet the full extent of its effect may be masked by
oubain difficulties. Further experimentation should be carried out with a particular focus
on oubain handling which may produce more significant results. Further experiments
should also be carried out to determine fully the significance of the results illustrated in
figures 11A and 12, which show a reduction in oubain sensitive activity in the presence
of thrombin.

39
These results support the hypothesis that thrombin has an inhibitory effect upon the
serotonin transporter within rat brain synaptosomes, and decreases the activity of the
Na+/K
+ ATPase pump. Further research is required to establish the full extent of this
inhibitory effect, as well as determining through what mechanism this inhibition is
carried out. Further optimization of protocols is recommended in order to fully examine
the inhibitory effect of thrombin in synaptosomes, with a particular focus to be paid to
lipid raft fractions, due to the difficulty in obtaining conclusive results. However,
regardless of the challenges faced in regards to Western blot, conclusive results may also
be obtained through 5-HT uptake and ATPase activity assays regarding the effect of
thrombin in rat brain synaptosomes.
Word count:
Acknowledgements:
References:
1: Rudnick, G. (2006). Serotonin transporters–structure and function. The Journal of
membrane biology, 213(2), 101-110.
2: Worrall, D. M., & Williams, D. C. (1994). Sodium ion-dependent transporters for
neurotransmitters: a review of recent developments. Biochemical Journal,297(Pt 3), 425.
3: Jardetzky, O. (1966). Simple allosteric model for membrane pumps.
4: Krishnamurthy, H., Piscitelli, C. L., & Gouaux, E. (2009). Unlocking the molecular
secrets of sodium-coupled transporters. Nature, 459(7245), 347-355.
5: Torres, G. E., Gainetdinov, R. R., & Caron, M. G. (2003). Plasma membrane
monoamine transporters: structure, regulation and function. Nature Reviews
Neuroscience, 4(1), 13-25.
40
6: Steiner, J. A., Carneiro, A. M. D., & Blakely, R. D. (2008). Going with the Flow:
Trafficking‐Dependent and‐Independent Regulation of Serotonin Transport.Traffic, 9(9),
1393-1402.
7: Magnani, F., Tate, C. G., Wynne, S., Williams, C., & Haase, J. (2004). Partitioning of
the serotonin transporter into lipid microdomains modulates transport of
serotonin. Journal of Biological Chemistry, 279(37), 38770-38778.
8: Haase, J., Killian, A. M., Magnani, F., & Williams, C. (2001). Regulation of the
serotonin transporter by interacting proteins. Biochemical Society Transactions,29(Pt 6),
722-728.
9: Lingrel, J. B., & Kuntzweiler, T. (1994). Na+, K (+)-ATPase. Journal of Biological
Chemistry, 269(31), 19659-19662.
10: Blanco, G., & Mercer, R. W. (1998). Isozymes of the Na-K-ATPase: heterogeneity in
structure, diversity in function. American Journal of Physiology-Renal
Physiology, 275(5), F633-F650.
11: McDONOUGH, A. A., Geering, K., & Farley, R. A. (1990). The sodium pump needs
its beta subunit. The FASEB Journal, 4(6), 1598-1605.
12: Ayako Takeuchi, Nicolás Reyes, Pablo Artigas & David C. Gadsby (2008). The ion
pathway through the opened Na+,K
+-ATPase pump. Nature 456, 413-416
13: Donovan, F. M., Pike, C. J., Cotman, C. W., & Cunningham, D. D. (1997). Thrombin
induces apoptosis in cultured neurons and astrocytes via a pathway requiring tyrosine
kinase and RhoA activities. The Journal of neuroscience,17(14), 5316-5326.
14: Turgeon, V. L., & Houenou, L. J. (1997). The role of thrombin-like (serine) proteases
in the development, plasticity and pathology of the nervous system.Brain research
reviews, 25(1), 85-95.
41
15: Lee, C.J., Mannaioni, G., Yuan, H., Woo, D.H., Gingrich, M.B., Traynelis, S.F.,
2007. Astrocytic control of synaptic NMDA receptors. J. Physiol. 581, 1057–1081.
16: Maggio, N., Shavit, E., Chapman, J., & Segal, M. (2008). Thrombin induces long-
term potentiation of reactivity to afferent stimulation and facilitates epileptic seizures in
rat hippocampal slices: toward understanding the functional consequences of
cerebrovascular insults. The Journal of Neuroscience, 28(3), 732-736.
17: Choi, M. S., Kim, Y. E., Lee, W. J., Choi, J. W., Park, G. H., Kim, S. D., … Ko, K.
H. (2008). Activation of protease-activated receptor1 mediates induction of matrix
metalloproteinase-9 by thrombin in rat primary astrocytes. Brain Research Bulletin,
76(4), 368–75.
18: Maggio, N., Itsekson, Z., Dominissini, D., Blatt, I., Amariglio, N., Rechavi, G. &
Chapman, J. (2013). Thrombin regulation of synaptic plasticity: Implications for
physiology and pathology. Experimental neurology, 247, 595-604.
19: Elysian Chow 2014, PhD thesis, University College Dublin
20: Chan, K. M., Delfert, D., & Junger, K. D. (1986). A direct colorimetric assay for
Ca2+ -stimulated ATPase activity. Analytical Biochemistry, 157(2), 375–80
21: Vaughan, P. J., Pike, C. J., Cotman, C. W., & Cunningham, D. D. (1995). Thrombin
receptor activation protects neurons and astrocytes from cell death produced by
environmental insults. The Journal of neuroscience, 15(7), 5389-5401.
Abbreviations
APS Ammonium persulfate
DTT Dithiothreitol
SERT Serotonin transporter
PAR Protease activated receptor

42
DTT Dithiothreitol
ECL Enhanced chemiluminescence
EDTA Ethylenediaminetetraacetic acid
PBS Phosphate buffered saline
PKC Protein kinase C
SSRI Selective serotonin reuptake inhibitor
TBS Tris buffered saline
TBST Tris buffered saline with Tween 20
Appendices