thesis the - open...
TRANSCRIPT

Solar evaporation of saline water under vacuum
Item Type Thesis-Reproduction (electronic); text
Authors Shaheen, Esber I.
Publisher The University of Arizona.
Rights Copyright © is held by the author. Digital access to this materialis made possible by the University Libraries, University of Arizona.Further transmission, reproduction or presentation (such aspublic display or performance) of protected items is prohibitedexcept with permission of the author.
Download date 04/07/2018 23:54:32
Link to Item http://hdl.handle.net/10150/191447

SOLAR EVAPORATION OF
SALINE WATER UNDER VACUUM
by
Esber Ibrahim Shaheen
A Thesis Submitted to the Faculty of the
DEPARTMENT OF CHEMICAL ENGINEERING
In Partial Fulfillment of the RequirementsFor the Degree of
MASTER OF SCIENCE
In the Graduate College
THE UNIVERSITY OF ARIZONA
1964

This thesis has been submitted in partial fulfill-ment of requirements for an advanced degree at The Univer-sity of Arizona and is deposited in The University Libraryto be made available to borrowers under rules of theLibrary.
Brief quotations from this thesis are allowablewithout special permission, provided that accurate ac-knowledgement of source is made. Requests for permissionfor extended quotation from or reproduction of this manu-script in whole or in part may be granted by the head ofthe major department or the Dean of the Graduate Collegewhen in their judgment the proposed use of the material isin the interests of scholarship. In all other instances,,however, permission must be obtained from the author.
SIGNED : -r
APPROVAL BY THESIS DIRECTOR
This thesis has been approved on the date shownbelow:
STATEMENT Y AUTHOR
H. WHITE, Hed - DateDepartment of Chemical Engineering
i

TABLE OF CONTENTSPAGE
LIST OF ILLUSTRATIONS iv
LIST OF TABLES viiABSTRACT viii
I. INTRODUCTION 1
II. OBJECTIVE 4
III. SURVEY OF LITERATURE 6
Solar Distillers using collectorswith optical concentration ofsolar energy. 10Stationary solar distillers, ordistillers without solar energyconcentrating devices. 12
IV. PROPOSED SOLAR EVAPORATION PROCESS FORSALINE WATER IN ARID REGIONS 31
Description of Process. 31General Calculations and Assump-tions. 33Calculated Cases. 41
V. DESCRIPTION OF APPARATUS 48
Evaporator 51Condenser 53
Pumps 53
Feed Column 55Air Blower 55
Electric System 55
ii

TABLE OF CONTENTS(Continued)
iii
PAGE
G. Thermocouples 56
H. Air-Meter 58
I. Epply Radiation Pyrheliometer 60J. Flow System 60
VI. PROCEDURE 62
A. Calibrations 62B. Air Leak Prevention 64
C. Plexiglas Transmission andIncident Radiation 65
D. Operation 66
VII. PRESENTATION OF EXPERIMENTAL DATA 68
VIII. DISCUSSION OF RESULTS 73
A. Heat and Mass Balances 73
B. Analysis of Results 83
IX. SUMMARY 93
X. RECOMMENDATIONS 95
XI. ACKNOWLEDGEMENTS 97
XII. LITERATURE CITED 98
XIII. APPENDIX 102
A. Data from Test Runs 103
B. General Approach for Heat and MassBalance Around a Regular Deep-Basin Solar Still. 110
c. Nomenclature 116

LIST OF ILLUSTRATIONS
FIGURE
Schematic Flow Diagram of a Standard
Greenhouse-type Solar Still.
Inflatable Type Solar Distiller.
Schematic Cross Section of a Flat
Tilted Solar Still.
Diagram of a Multiple-Effect Solar
still.
Approximate Schematic Flow Diagram
for a Humidification Process.
Schematic Diagram of a Portable
Solar Still.
Flow Diagram for a Vacuum Desalin-
ator of Solar Heater Type.
Schematic Flow Diagram for the
Proposed Process.
Schematic Flow Diagram of Experi-
mental Process.
PAGE
21
23
25
27
29
32
49
13
19

LIST OF ILLUSTRATIONS(Continued)
FIGURE PAGE
Photograph of Apparatus. 50
Sketch of the Inner Cylinder (Evap-
orator). 52
Sketch of the Outer Cylinder Section. 54
Photograph of the Infrared Lamp and
its Reflector. 57
Distribution of Thermocouples Around
the Evaporator. 59
Thermocouple Calibration for Thermo-
couple Number 0. 63
Heat Available for Water Evaporation
Versus Pressure Applied Inside the
Evaporator. 84
Rate of Heat Loss by Conduction
Through the Walls as a Function of
the Pressure Inside the Evaporator. 85
Rate of Water Collected from the
Condenser Chamber as a Function of
the Applied Pressure Inside the Evap-
orator. 88
V

LIST OF ILLUSTRATIONS(Continued)
FIGURE PAGE
Water Basin Temperature as a
Function of the Pressure Applied
Inside the Evaporator. 89
Average Wall Temperature of the
Evaporator as a Function of the
Pressure Inside the Evaporator. 91
Temperature of the Underside of the
Plexiglas Cover Versus the Pressure
Inside the Evaporator. 92
vi

LIST OF TABLES
TABLE PAGE
Approximate Distribution of Solar
Radiation Reaching Deep-Basin Still
(Based on a 3-day energy balance
run in October). 17
Estimation of the Average Glass Cover
Temperature for the Proposed Process. 43
Pressure Inside the Evaporator for
each Run, and Basin Water Temperature
at Steady-State. 70
Iv. Heat Available for Water Evaporation
in the Respective Runs. 70
Actual Heat Distribution for the
Respective Runs. 71
Percentage Distribution of the
Incident Radiation. 72
Data From Test Runs at Steady-State. 103
Data From Run Number 3. 106
vii

ABSTRACT
The basic objective of this research was the de-
salination of sea or brackish water using solar energy and
vacuum techniques. A process using the vacuum technique
was devised for the desalination of sea or brackish water
under desert conditions, and calculations were made to
show the advantages of this process. To simulate a section
of this overall process, an evaporator which may be oper-
ated at pressures ranging from relatively low vacuum to
one atmosphere was designed. This evaporator was used to
convert saline water into fresh water. Solar energy was
simulated by using artifical lamps for the conversion
process, and fresh water was used experimentally in place
of saline water. The purpose was to obtain data on the
relationship between the applied vacuum inside the evap-
orator, the fresh water yield, and the heat distribution
in the system.
The evaporator consisted of a hollow cylinder made
of K-Monel with the bottom made of the same metal and painted
viii

ix
black on the inside. Radiant energy from an infrared art-
ificial lamp was transmitted through clear methyl-methacry...
late (Plexiglas) which was fitted on the top of the cylinder.
The vapor was drawn to a coil and shell condenser where it
was condensed and collected. The vacuum applied on the
system was controlled manually.
Six runs were made with a constant batch feed of
water, and each run was continued until the system reached
a steady-state.
A heat balance was made for each run, and the
amount of heat available for water evaporation was com-
pared to the weight of water evaporated and collected in
the condenser chamber. Due to the application of vacuum
and due to the absorptivity of the Plexiglas top, radia-
tion always occurred from th Plexiglas top to the water
basin
The fresh water yield increased with a decrease in
the pressure applied inside the evaporator. For a press-
of 0.46 lb/in2 inside the evaporator, the rate of
fresh water production was 72 g/hr while for a pressure
of 1.28 lb/in2 inside the evaporator, the rate of water

x
production ws 55 g/hr. The heat available for evaporation
increased with a decrease in the pressure applied on the
2system. When the applied pressure was 5 lb/in , 37.4
per cent of the incident radiation was available for water
2production; and when the pressure decreased to 0.46 lb/in
the heat available for water evaporation was 52.6 per cent
of the incident radiation.
This investigation revealed the applicability of
using vacuum techniques in saline water conveision. Re-
commended further research consisted mainly of investigat-
ing the productivity of the still when it is used under
the sun in a desert site. Once these investigations are
accomplished a main application of this process may be
to furnish municipal water to communities. It may be
also possible to develop a household desalting unit which
could compete economically with the best household de-
salting units on the market today.

I. INTRODUCTION
Water is a vital ingredient of life. A growing
demand for fresh water as communities and industry grow
and new industry develops has produced shortages in many
areas around the world. For this reason, there is much
interest today in the problem of converting sea water to
fresh water. Since the cost of energy plays a decisive
role in distillation processes, it is attractive to attempt
to harness the power from the sun for this purpose. One
major disadvantage of solar energy use in saline water
conversion is the low production rate attributed to solar
stills. This research was directed toward the development
of a process which would directly contribute to the in-
crease in fresh water yield by decreasing radiant and
convective heat losses, and would contribute, indirectly,
to the lowering of the costs of saline water conversion.
The process of solar evaporation of saline water
under vacuwn was chosen. The background leading to this
1

2
selection was that in 1961, D. H. White originated the
basic idea of desert evaporation under vacuum, utilizing
cooling tower water to achieve the lower temperature neces-
sary to condense the evaporator vapors. The work on this
process was initiated in the summer of 1962 under the
direction of D. H. -White.
The effects of operating pressure and applied watt-
age on the fresh water yield, and the operational character-
istics, reliability and faults of the newly-designed appar-
atus were investigated. Calculations were made for the
purpose of presenting the heat distribution in the experi-
mental research and helping in the design of a process for
saline water conversion in arid regions. Solar energy was
simulated by using artifical lamps, and distilled water,
instead of saline water, was used in this research. Sea
water concentration is usually three and a half per cent
in salts, and if sea water is concentrated to. seven per
cent salt content the boiling point elevation is 1.2 °F (1).
If sea water were used in this research, the salt concen-
tration in the unevaporated water would not exceed seven
per cent due to the considerably small amount of water
evaporated. Thus, the influence of the boiling point

3
elevation on the net results of the research is negligible.

II. OBJECTIVE
The primary objective of this research was to pro-.
vide information pertinent to the development and design
of an economical process for saline water conversion in
arid regions. The process of interest consisted of saline
water conversion using vacuum, solar energy, and the low
temperatures in a cooling tower. The application of vacu-
um decreased the boiling point of water and, thus, de-
creased radiation and convection losses to the atmosphere.
A cooling tower would provide low temperature cooling
water for water vapor condensation under vacuum.
The data pertinent to the development of the
process were sought from two directions of investigation;
1. Calculations for the experimental equipment
and for some arid region cases. The purpose of the cal-
culations for the arid region cases was to demonstrate
the superiority of this process compared with other pro-
cesses using solar energy for saline water conversion.
4

5
2. Experimental research simulating a section of
the process and demonstrating the advantages of vacuum
application.

III. SURVEY OF L.ITERATURE
Salt water oceans occupy nearly three-quarters of
the earth's surface, arid sixty per cent of the remaining
quarter is arid land (29*). In these arid lands, the dry
season may last for several months, during which the energy
of the sun is abundant and represents a potentially large
fuel resource. Thus, much interest has materialized in
the problem of converting sea water to fresh water using
solar energy. This interest stems from the growing real-
ization of the possibility of acute shortages of naturally
available potable water. Industrial growth in some normally
semi-arid regions has contributed to the urgency of this
situation. Moreover, the economical conversion of sea
water or saline water into fresh water may open for use
large areas of the above-mentioned arid lands.
The United States of America has taken a special
interest in saline water conversion research. The orginal
* Numbers in parentheses refer to Literature cited.
6

7
concept of the saline water program included major effort
in stimulating private scientific interest and activity in
development of processes. A special department called The
Office of Saline Water (05w) was established within the
United States Department of the Interior. A large number
of research projects were carried out under the sponsorship
of the Office of Saline Water. The better processes were
then further developed by building various demonstration
plants of large capacities to test the suitability of each
type of plant in operation and to explore their economic
aspects. The following projects have been adopted by the
Office of Saline Water (12);
A sea. water conversion solar research station
was established at Daytona Beach, Florida. A
deep-basin, glass-covered solar still was used
covering an area of 2500 square feet with an
average fresh water production of five hundred
gallons per day.
In Freeport, Texas,, a plant with a capacity of
one million gallons per day was built using the
long-tube vertical multiple-effect evaporation
process.
In San Diego, California, the multistage-

8
flash distillation process was used, and the
plant was built with a capacity of one million
gallons per day.
In Roswell, New Mexico, a plant using the
process of forced circulation vapor-compres-
sion was built with a capacity of one million
gallons per day.
In Wrightsville Beach, North Carolina, a
freezing process was used, and the plant was
built with a capacity of two hundred and fifty
thousand gallons per day.
In Webster, South Dakota, a plant using the
process of electrodialysis (membrane process)
was built with a fresh water production rate
of two hundred and fifty thousand gallons per
day.
Around the world, the saline water conversion re-
search has been most active in the European countries. The
Organization for European Economic Cooperation (O.E.E.C.4,
which is an organization founded by the free European
countries, created Group Number Eight for the study of
methods for desalting sea and brackish waters and for

9
coordinating the research in the following countries:
Belgium, Denmark, France, Germany, Great Britain, Holland,
and Sweden. The Soviet Union is doing extensive research
in saline water conversion, but the United States is by
far the most active country of the world in the saline
water conversion research.
Of the various methods of desalination, the one
that has been in use the longest is solar distillation.
This method may perform an important function in supply-
ing fresh water to areas rich in sunshine and relatively
poor in fuel (21).
Solar distillers can be divided into two groups
depending on the type of collector used. The collector is
that part of the solar still which accumulates the solar
energy in order to raise the temperature of the salt water
contained in the collector. Collectors are classified
into two groups, those with optical concentration of solar
energy such as lenses or reflectors, and those without op-
tical concentration of solar energy. The latter are usually
stationary installations which receive solar energy directly
(2, 8, 11, 35).

10
A. So)ar distillers using collectors with o tica]. con-
centration of solar energy
Lenses,, as concentrating devices for solar energy,
can be used in very small units. In all other cases, vari-
ous kinds of mirrors and mirror assemblies are used. Para-
bolic reflectors were used centuries ago to concentrate
solar energy to a boiler. The vapor produced was condensed
by conventional means (2, 11, 35). In 1770, Lavojsier, the
French scientist, concentrated solar rays by using a large
lens supported in an elaborate mounting.
Abbot's solar distiller consisted of a cylindrical
parabolic reflector. The surface of the reflector was made
of aluminum foil. Solar rays were concentrated to a vacuum-
Jacketed tube located at the focus of the parabolic mirror.
The reflector, intercepting 11 square feet of solar radi-
ation, was used in Florida in 1938, producing two to three
gallons of fresh water per day (11, 35). This solar dis-
stiller typifies in weight and construction most of the
concentrating devices. In general, a reliable moving mech-
anism is attached to such devices to permit the concentrator
to follow the sun. This is done within close limits to
permit keeping the boiler in the focus of the concentrating

11
device. Back-silvered glass reflectors or polished and
anodized aluminum reflectors may concentrate 80 to 90 per
cent of the direct part of the incident solar radiation.
Cost estimates have indicated that none of the
concentrating devices could produce water at a cost lower
than $3.25 per 1000 gallons of fresh water (2). It has
been stated that additional research could decrease this
cost figure to $2.20 per 1000 gallons of water. According
to these cost figures, it appears that concentrating de-
vices are not the answer to the water problem. The major
problems faced in solar energy concentrating stills are:
Only the direct part of the solar beam
can be concentrated and the diffuse solar energy represents
a loss which is as high as ten per cent of the total energy
on clear days and appreciably higher on cloudy days. This
loss is an inherent disadvantage of this type of solar still.
Precise movement of the reflectors is re-
quired to permit the coincidence of the image formation and
the boiler. The continuous requirement of this movement,
even in high winds, complicates the design and contributes
to increasing the water production cost.

12
(c) Single-effect stills operating with concen-
trating devices could not be economical due to the high cost
of equipment and labor. Multiple-effect stills require a
complication of design which raises the cost of water pro-
duction.
Collecting and concentrating solar energy is re-
ceiving a limited treatment in this survey, because con-
centrating devices have proved too expensive for salt water
purification (2). For this reason0 more attention is given
to solar distillers without solar energy concentrating de-
vices.
B. Stationary solar distillers, or distillers without
solar energy concentrating devices
Numerous devices of this type have been reviewed
in a Symposium on Saline Water Conversion (1957), publi-
cation 568, Office of Saline Water, U. S. Department of the
Interior (ref. 21, pp. 117-176). The types which seem to
be economically promising are as follows:
1. Greenhouse-tyPe-SimPle solar still. A shal-
low basin, painted black to absorb the rays of the sun, is
filled with saline water (see Figure 1). Heat from the sun
is transmitted through a transparent inclined cover and

Figure 1: Schematic Flow Diagram of a Standard
Greenhouse-type Solar Still.
13

14
causes the water to evaporate. The saturated vapor inside
the still condenses on the inside of the transparent surface,
owing to the lower temperature of the transparent surface
compared with the water basin temperature. When the inner
surface of the transparent medium is clean, the condensed
droplets move along the inclination owing to the adhesion
between the water and the transparent surface. The conden-
sate flows into collecting troughs placed on each side of
the still (1, 2, 8, 13, 21, 25, 26, 27, 30, 31, 33, 35).
In such a still, water does not boil but vaporizes slowly
and the vapors reach the cooler surface by convection.
The largest and oldest solar distillation still
of this type was built in 1872 by Charles Wilson, near the
harbor of Antofagasta at Las Salinas in Chile (35). The
brine feed contained 14 per cent salts and was pumped from
nearby wells. Water basins were made of black painted wood.
The total occupied area was 51000 square feet, and the high-
est water yield was 6000 gallonS per day or approximately
one pound of fresh water per day per square foot of hor-
izontal area. On hot days, the maximum temperature of the
water in the basin was 150°F, and the surrounding air temp-

15
erature was 80°F, around noon. The total cost of the jnstal-
lation including all accessories was $250,000 (2). The
efficiency of this still was about 35 per cent, and it
operated up to 1908, with 36 years of operation to prove
the durability of glass (11).
A roof-type solar still was designed by Dr. Maria
Telkes, and it was operated during the surruner of 1951. The
tray rested on an insulating support. The base area was
200 square feet with a maximum daily production of 1.2
pounds of fresh water per square foot (2).
Today, there are two major greenhouse-type solar
stills:
(a) Plastic-covered stills. The basins of the
plastic-covered stills are maintained relatively shallow in
water depth. Insulation is provided under the water-tight
basins. Covers of the stills are made of plastic materials
instead of glass. The covers are supported by a slight
pressure of air supplied from a small fan. Except for con-
crete curbs, the basin is also constructed of plastic
materials. Plastic stills were built by E. I. duPont de
Nemours and Company. Small stills were covered by du Pont
polyvinyl fluoride Teslar film, and larger stills had a

16
cover of Polyethylene teraphthalate Mylar film (1, 2).
(b) "Deep Basin" qlass-covered stills consist
of basins which are constructed on level ground and are
covered by gias plates. This type of still was designed
originally by Dr. Löf, (21, 25, 26) who modified the design
of the simple solar still. The large single basin is sub-
divided into smaller basins by means of curbings which
serve as glass supports. The glass plates make an angle
of 15 degrees with the bottom of the basin for the purpose
of having better solar reception and to minimize the amount
of air circulating inside the still. The main principle
of the "Deep Basin" still is to make use of the heat
storage capacity of the water in the basin to provide con-
tinuous distillation even during the night. In the exper-
imental process, the basin is placed directly on the ground
and insulation is used only for the side walls. The water
level in the basin may be as high as one foot. A heat ex-
changer is used to preheat the sea water feed by the leav-
ing condensate and the residue streams (1). The average
monthly efficiencies for this kind of still varied between
26 to 35 per cent based on the mean values of solar radia-
tion and atmospheric temperature for each day. The energy

17
distribution in a Deep-Basin still is best described by the
following table taken from Reference (l) page l71
TABLE I
Approximate Distribution of Solar Radiation Reachinq Deep-
Basin Still Based on 3-da ener' balance run in October.
1959)
Distribution
Evaporation
Brine leakage and vapor loss
Ground and edge heat lees
% of SolarRad i at 0a
32
0
2
Solar radiation absorbed by cover 10
Solar radiation reflected by still 12
Radiation from water in basin 25
Internal convection 7
Re-evaporation of distillate and
unaccounted-for losses 12
Total 100
alncident solar radiation averaged 1400 Btu/Sq.ft/day
over a 3-day period.

18
2. Xnflatablefloatjn9so1ardjstil1er During
World War II, flyers forced down at sea were equipped with
inflatable rubber life rafts, but these life rafts could
carry only a limited amount of fresh water. Thus, the
need for a floating solar distiller developed, since most
flying was over oceans in tropical regions where solar
energy is most available (see Figure 2). The floating
solar still is made of Vinylite (polyvinyl chloride acetate)
or similar plastic materials (11). A black porous pad is
saturated with sea water and supported by the inflatable
envelope. The plastic envelope transmits solar rays, which,
in turn, heats the sea water in the black pad. The result-
ing vapor condenses and trickles along the envelope inclina-
tion. Fresh water is received in a water-collecting
chamber situated at the bottom of the elliptic-shaped plastic
envelope. A plug attached to the water-collecting chamber
permits fresh water withdrawal when needed. At the end of
the day, the salt in the black pad is flushed out, and the
process might be repeated over and over every day. The
maximum temperature reached by the black pad is 150°F, and
the still efficiency ranged from 50 to 60 per cent.

Figure 2: Inflatable Type Solar Distiller.
19

20
3. Sinqle-effec flat tilted solar still. At
various latitudes, the energy reception by a tilted surface
is higher than that received by a horizontal surface. At
latitude 35 degrees, fixed tilting could increase the ann-
ual solar energy received over a horizontal surface by 24
per cent. This consideration resulted in a new solar still
design by Dr. Tel]ces (see Figure 3). Saline water is fed
to a porous pad, instead of a horizontal tray. A supporting
wooden frame is covered on its top by a transparent glass
surface. it is essential to avoid dropwise condensation,
since droplets reflect considerable solar radiation.
Because clean glass produces film-type condensation, it
is chosen instead of non-wettable plastics, which always
produce drop-type condensation (21). The lower part of the
frame is closed with transparent panes of glass or any
suitable water-proof material. In the middle of the frame,
a black porous evaporator frame is supported. Salt water
is fed at the upper edge of the evaporator where it is
distributed evenly. At the bottom end of the porous pad,
the concentrated brine was collected in a drip catch°'
channel and discharged through an outlet pipe. The inner

Brinechannel
Brine
DistillateDistillate
Frame Feed/
Feeddistributor
Porousevaporator
Glass condenser
Figure 3: Schematic Cross Section of a
Flat Tilted Solar Still.
21

22
surface of the glass top and the inner back of the still
served respectively as the front and back condensers.
A comparison between the respective efficiencies
of the roof-type and tilted solar stills showed that the
yield of the tilted solar still was 26 to 48 per cent
greater than that of the horizontal still (2, 35).
4. Multiple-effect solar still. In the simple,
roof-type still, the heat of condensation of the vapor on
the glass cover is wasted, being carried away by the air
and by radiation to the atmosphere. In a multiple effect
still, solar radiation is reused to distill additional
amounts of sea water. The incident radiation strikes a
black absorber impervious to water vapor, below which
there is a fabric acting as a wick, wetted slowly and con-
tinuously with sea water (see Figure 4). The vapors cannot
rise through the impervious black absorber but move down-
ward across a narrow air space and condense on a porous
layer collecting the distillate, which is continuously
withdrawn. A thin water-proof film made of coated sheet
aluminum or Mylar serves as a transmitting medium for the
heat of condensation. This heat of condensation serves to
distill an additional amount of sea water from a second wick

Frame
Solar energy
Transparent coverAir spaceBlack absorberEvaporator wickAir SpacePorous condenserWaterproof film2nd stage evap-\orator wickAir space
orous condenserWaterproof film3rd stage evap-orator wick
o 4th stage etc
Figure 4: Diagram of a Multiple -Effect Solar Still
23

24
placed on the other side of the aluminum film. Several
stages can be fixed in this manner and a temperature gra-
dient is established in each stage. The temperature of
the wicks is lower in each subsequent stage than in the
one before. A three-effect multiple still produced 1.9
times more water than a single-effect tilted still of the
same area (21).
5. Multiple-effect humidification process. This
process differs from conventional distillation processes
in that water vapor was first carried by dry air and then
released by condensing on a cool surface. The source of
energy may be solar or waste steam. The air used may be
recirculated or fresh air could be introduced. Energy and
mass transfer occur at temperatures below the normal boil-
ing point of water,
Two major research programs are being conducted
in this field: the first by Dr. Werner Grune at Georgia
Institute of Technology, and the second by Hodges and
Kassander at the University of Arizona (see Figure 5). Dr.
Grunes research has been concerned mainly with a multiple-
effect system which utilizes a collector-evaporator unit
similar to the traditional solar still with air being

water
Saline water
discharge
Fresh water
VA
V U4
U
Fresh
Saline water
water product
Air
Figure 5: Approximate Schematic Flow Diagram
for a Humidification Process.
Saline
ater
Saline1
water
Blower
AirCool-
ing
tower
se xv-
ing as
a
heat
Sink
Air
Long duct
Plastic or
glass cover
.4Jf
l
(JL) -
A
a)
Collector
V
7Saline
" Y
Black bottom
Fres
water

26
blown over the still to create forced convection. An
external condenser was used to permit the operation of the
multiple-effect unit.
At the University of Arizona, the research con-
ducted has stressed the separation of the collector, the
evaporator, and the condenser. In principle, solar energy
is received in the collector where heat is given to the
salt water feed. The sea water from the collector is fed
to a long duct, where relatively dry air is blown over the
sea water. The air picks up moisture and the air and
moisture are received by a condenser0 The air gives up
its moisture by condensation. The intake sea water coming
from a cooling tower exchanges heat with the fresh water
from the condenser where the condensate is cooled and the
sea water is preheated. The air and sea water flow in a
counter-current fashion (13, 31).
6. Portable solar still. A portable solar still
has been described by the Russian scientist, Zaitsev (37),
and it has the following features: The top of the still is
a blackened metal surface (see Figure 6). A layer of fabric
is attached along the inside of the metal surface. The
still is tilted, and the sea water is fed to the fabric

Figure 6: Schematic Diagram of a Portable
Solar Still.
27

28
from a small tank located at the top of the inside of the
still. An outside fabric layer is located along the bottom
of the still, and this layer is fed from a small tank loca-
ted at the outside of the still. Solar energy is received
by the black surface, and the fabric is heated. The water
vapor condenses along the bottom incline of the still,
where it is directed to an outlet (37).
7. Vacuum desalinator of solar heater type.
Solar vacuum desalination is not discussed to any detail
in the literature. The Russian scientist, Zaitsev, pro-
posed a solar vacuum desalinator (37), where saline water
is preheated to 60°C in a hot-house type solar water
heater (see Figure 7). Hot water is fed to a moderately
exhausted vacuum chamber where evaporation occurs. The
vapor is condensed in a surface condenser. Fresh water is
pumped to a storage tank, and the brine from the evaporator
is directed to the sewer.
It is of interest to note that the above-mentioned
processes have two common characteristics: low water yield
and low efficiency. This research is conducted to improve
the solar still efficiency and to increase the fresh water
yield. The interest in this research is generated due to

Solarrays
Solarheater
Steam
Vacuumevap-orator
V
Discharge
0Condenser
-c Salinewater
StorageDistillate tank
Freshwater pump
Figure 7: Flow Diagram for a Vacuum Desalinator
of Solar Heater Type.
29

the scarcity of literature related to solar vacuum de-
salination.
30

IV. PROPOSED SOLAR EVAPORATION PROCESS
FOR SALINE WATER IN ARID REGIONS
A. Description of process
The proposed process of saline water conversion us-
ing solar energy and vacuum techniques is a new process in
desalination research. Extended investigations of this
process may render valuable contributions to the desalina-
tion problem as a whole. To be able to show the advantages
of such a process, a generalized description is needed.
The theoretical development is concerned with a
solar still of the 'green-house type in a desert location,
The description of the greenhouse" type solar still was
presented in the Survey of Literature section. In all pro-
bability the solar still for the proposed process will lie
flat on the ground or sand in order to have support for
withstanding the necessary vacuum(see Figure 8). Solar
energy is transmitted through the transparent glass. This
solar energy is absorbed by the black bottom of the still
and directly released to the salt water in the basin. The
water vapors formed are drawn to a separate condenser.
The Inerts in the system will be removed by a steam-jet
or similar system.
31

1
67°F
67°F
66°F
'--' 6
4°F
('6
6°F
Fres
hw
ater
Exc
hang
er
1vap
or(o
ptio
nal)
Sola
r ra
ysjB
5OF
I
6k°F
Rec
ye
I66
°F
Fres
h w
ater
cond
ensa
te ta
nk
66'F
(A
vg.)
Vac
uum
pum
p60
°F
Con
dens
er
Bri
ne o
utle
tFi
gure
8:
Sche
mat
Ic F
low
Dia
gram
for
the
prop
osed
pro
cess
(C
ase
II).
Salin
ew
ater
Coo
l-In
g
tow
er
60°F
Salin
e w
ater
pum
p

33
The desired pressure (the vacuum) will correspond to the
condensing temperature as supplied by the cooling tower
water. Saline water and air may be in contact counter-
currently in a standard cooling tower. There is a possibility
that the water vapors can be condensed In coils placed in the
bottom of the cooling tower, assuming that the physical lo-
cation is not so distant as to give excessive pressure drop.
B. General calculations and assumptions
The mathematical developtuent of the theory involved
Is simplified in this section. A detailed mathematical
analysis for different cases is shown in the Discussion and
the Appendix. The following simplificatlons and assumptions
could be modified to meet special needs of a research program
using solar energy and vacuum techniques for saline water
conversion.
To account for the energy distrIbution in a solar
still similar to the one described above,.the average glass
cover temperature should be first estimated. In general ta
and tb could be assumed and tg could be estimated.
Where,
ta = Temperature of the air surrounding the still
(0F ).

In order to estimate tgl a heat balance around the glass
cover of the still may be considered. The glass cover
receives heat by radiation and convection from the sur-
rounding atmosphere and also by absorption of a fraction
of the incident solar energy. The glass cover transmits
heat by radiation and convection to the inside of the still.
The heat balance around the glass cover may then be written
as follows.
Glass cover
Salt -Bottom ofwater the still
(1)
34
tb = Equilibrium temperature of the water in the
basin (°F.).
tg = Average glass cover temperature (°F.).
surroundings atta

Where,
Pair
/Salt water
--This is due tothe incident
radiationGlasscover
Net rate of radiation interchange from ther
air to the glass cover (Btu/ft2-hr).
q' = Net rate of heat transfer by convection fromC
the air to the glass cover (Btu/ft2-hr).
= Rate of heat absorbed by the cover from the
incident solar energy (Btu/ft2-hr).
= Net rate of radiation interchange from the
glass cover to the water basin (Btu/ft2-hr).
= Net rate of natural convection heat transfer
from glass cover to the vapor inside the
still (Btu/ft2-hr).
35
It is now necessary to find the values of the different
components of Equation (1). Heat transfer rates by radia-

tion may be calculated as follows:
((Tg4-
Wh,
Stefan-.130].tzmann constant = 0.1713 x io8
(Btu/ft2-.hr- (OR)4)
e = Emissivity of glass.
Tg Average absolute temperature of the glass cover
(°R).
Ta = Absolute temperature of the surrounding air (°R).
The net rate of heat transfer by convection may be calculated
as follows:
q' = h' (t - tc c g a
Where,
h = Convection heat trnasfer coefficient from the
surrounding air to the glass cover (Btu/ft2-hr-
°F).
To find h9 the following equation was taken from Symposium
on Saline Water Conversion, 1957, reference 21 pages 140
and 142.
= 0.99 + 0.21V under practical conditions
subject to wind (4)
(3)
36
(2)

0.937 Glass emissivitY from reference (l),page 162.
= Absolute temperature of the water basin (°R).
37
Where,
V = Wind velocity (ft/sec).
This is an empirical relation which is fitted by the data
taken from Table Number two of the above mentioned reference.
Since in this proposed process the temperature gradient
between the air and the glass cover is small, the heat trans-
fered from the air to the glass cover is relatively small.
Thus, the error introduced by using Equation (4) is very
small. The rate of heat absorbed by the cover from the
incident solar energy was found by the following relation;
(qj) (o()(5)
Where,
= Incident radiation on the glass cover (Btu/ft2-
hr).
= Absorptivity of the glass cover.
The net radiation interchange between the glass cover and
the water in the basin is:
= (0.1713 x i0) (0.937) (Tg4 Tb) (6)
Where,

-0.162
0.162
rn 4 Pa 4
-
(io -
hc(tg - ta) + =
¼+ 0.256(tg tb) (tgtb) (8)
38
It is assumed that there is a slow rate of mass transfer
inside the still. Thus, the rate of natural convection
heat transfer from the glass cover to the water in the
basin is approximated by the equation:
0.256 (tg - tb) (tg - tb) (7)
This equation is taken from reference (1) page 162. This
energy is transferred to the water in the basin, and its
magnitude may be slightly larger in the case of forced
convection. Thus, the value given by equation (7) is on
the safe side. If the dimensions of the apparatus are
well defined, may be calculated by using trie appropriate
heat transfer coefficient. In this case more heat from the
glass cover may be added to the total amount of heat avail-
able for water evaporation, and this provides more contribu-
tion toward the advantages of the basic process. After
replacing °' qc' and in Equation (1) by their
corresponding values, the following equation may be obtained:

39
Equation (8) may be solved by trial and error to find the
average temperature of the glass cover.
The heat loss or gain by conduction from the water
basin and the walls of the still to the surrounding atmos-
phere may be found by the general relation:
QkmAmt (9)
Where,
o = Heat loss or gain by conduction (Btu/hr)
km = Mean thermal conductivity of the insulation
(Btu/ft-hr-°F).
Am = Logarithmic mean cross-sectional area of in-
sulation perpendicular to the direction of
flow heat (ft2).
= Temperature gradient (°F.).
= Insulation thickness (ft).
Two different cases are considered. The following
is assumed for the first case:
The basin water temperature is tb = 84°F,
0The air temperature iS ta = 85 F.
In the second case, the following assumptions were made:
tb = 65°?,

ta 85°F.
The mathematical equations in the previous pages
were used to estimate the average temperature of the glass
cover. To determine the energy distribution within the
solar still the following assumptions are made:
The cover of the still is made of plate glass.
The area of the cover of the still is equal to
the area of the bottom of the water basin.
The basin is large and the operation is performed
at steady-state.
The heat loss or gain by conduction from the walls
of the still to the surrounding atmosphere is
neglected.
The temperature of the cover is an average tempera-
ture based on neglecting the temperature drop
through the thickness of the glass.
The absorptivity of the glass cover is 0.11.
The transmission of the glass cover is assumed to
be 77 per cent.
The average solar radiation is 1800 (Btu/ft2-
12 hr. day).
40

41
The wind velocity is one mile per hour, and h° =
1.30 (Btu/ft2-hr-°F).
The basis for calculation is one square foot of
basin area.
C. Calculated cases
Case 1. For this case tb = 84°F and ta = 85°F. Solve for
tg by using Equation (8).
First assumption: Assume tg = 88°F
Tg = 88 + 460 = 548°R
?
146.1 - 142.9 + 3.9 + 146.1 - 141.8 1.45 16.5
297.55 - 284.7 16.5
12.85 16.5
The number to the right represents the heat absorbed by the
glass cover and it is equal to the product of the incident
radiation and the absorptiVity of the glass.
Second assumption: Assume tg = 90°F
T = 90 + 460 = 550°R
148.2 - 142.9 6.5 = 148.2 - 141.8 + 2.4 16.5
Tb = 84 + 460 = 544°R
Ta = 85 + 460 = 545°R

305.3 - 284.7 = 16.5
20.6 16.5
Third Assumption: Assume tg 89°F
T = 549°R
147.2 - 142.9 + 5.2 = 147.2 - 141.8 + 1.9 16.5
305.5 - 284.7 16.5
16.8 = 16.5
Thus, for the first case tg = 89°F. The results of these
trials are shown in Table II on the following page.
The solution for the rate of heat transfer by
radiation from the cover to the basin is then:
q (Tg4 Tb4)
'= 0.1713 x io_8
E= 0.937
0.162(549)4 (543)4
0.162 (908 - 866) = 0.162 (42)
= 6.8 (Btu/ft2-hr).
The heat transfer by convection from the glass cover is:
0.256 (tg - tb)(tg - tb)
= 0.256 (89 - 84)¼(89 - 84)
= 0.256 (5)¼(5) = 1.9 (Btu/ft2-hr).
Since the incident radiation is assumed to be 1800
42

TABLE II
ESTI?4ATION OF THE AVERAGE
GLASS COVER TEMPERATURE FOR THE
PROPOSED PROCESS
ta = 85°F tb = 84°F
Trial tg q*ab
Number (op.)
* All q's have the units of (Btu/ft2-hr).
43
1 88 3.20 3.90 16.5 4,30 1.45
2 90 5.30 650 16.5 6.40 2.40
3 89 4.30 5.20 16.5 5.40 1.90

(Btu/ft2-l2 hrs), the energy transmitted is:
1800 x 1389 (Btu/l2 hrs)
Energy reflected from the still:
1800 x 215 (Btu/12 hrs)
Energy absorbed by the glass cover:
1800 x 0.11 = 198 (Btu/12 hrs)
The total amount of energy available for evaporation is:
= (1389)(1.9) (l2)+(6.8) (12) = 1389 + 22.8 +81.6
1493.4 (Btu/12 hrs)
or,
1493.4 x 100 = 83.0%1800
The energy distribution for the incident radiation is as
44
For the deep basin solar still described in reference (1)
pages 166-172, the heat available for water evaporation
was 32%.
follows:
Distribution % of Solar Radiation
Evaporation 83.0
Solar radiation reflected by still 12.0
Radiation and convection lossesfrom the glass cover to theatmosphere 5.0
100.0

45
A process using the basic principle of this re-
search will have 2.6 times more heat available for water
evaporation than the most promising distillation unit in
existence.
Case 2.
Tb = 65 + 460 = 525°R
Ta 85 + 460 = 545°R
Solve for tg by trial and error from Equation (8).
Assume t = 81°Fg
or,
Tg 81 + 460 = 541°R
Replace, tas tbf and tg by their values in Equation (8)
and check to see if both sides of the equation are equal:
Tg = 81 + 460 541°R, tb 525°R, ta = 545°R
-0.162 (5.4i) - (5.45)1 - 1.30(81 - 85) + 16.5
4=0.162 [(5.41) - (5.45) j + 0.256(81 - 65)(8l-65)
or,
-138.8 + 142.9 + 5.2 + 16.5 138.8 - 123.0 + 8.2
25.8 24.0
This result was reached after applying a series of trials.
Thus, for this case tg is 81°F.
= 0.162 js.41)4 - (5.25)4J

or,
0.162 (860 - 760)
= 16.2 (Btu/ft2-hr)
and,
= (0.256) (81 - 65)¼(81 - 65)
(0.256) (l6)¼(16) 8.2 (Btu/ft2-hr)
+ = 16.2 + 8.2 = 24.4 (Btu/ft2-hr)
For a 12 hour period:
+ = 24.4 x 12 293 (Btu/12 hrs)
The total amount of energy available for water evaporation
is:
1389 + 293 = 1682 (Btu/12 hrs)
46
1682ioo x 100 = 93.5% of the incident radiation.
This amount of heat available for water evaporation is higher
than the previc-us case, due to convection and radiation gains
from the surroundings. Although conduction gains are neg-
lected, under these conditions a process applying the basic
principle of this research will produce 2.92 times more
fresh water than the best promising solar distillation unit.
The scarcity of literature in the field of saline
water conversion using solar energy and vacuum techniques,
makes the proposed process in this section very attractive

47
for further research. This proposed process produces on
the average 2.76 times more fresh water than the most
promising solar distillation unit.

V. DESCRIPTION OF APPARATUS
The apparatus used for the investigation of saline
water conversion by the application of vacuum and solar
energy is described in detail in this section. The evap-
oration vessel was covered with a transparent Plexiglas
surface. A graduated column was attached to the main vessel
(see Figures 9 and 10). When water was fed into the main
vessel, the application of light by using an infrared lamp
and the application of vacuum by using a vacuum pump caused
evaporation. Water vapor leaving the evaporator entered a
condenser where it was condensed and collected in a receiv-
ing chamber. An air blower served to blow air across the
top of the Plexiglas cover at an average speed of one and a
half miles per hour. An air meter was used to measure the
air velocity, and the average radiation on the top Plexiglas
surface was obtained by using an Eppley radiation pyrhelio-
meter. Thermocouples were used to determine the temperatures
of interest in the system, and a pump was used to discharge
48

The
rmoc
oupl
es to
diff
eren
tlocations
in th
e ev
apor
ato
I
Pot
entio
met
erThe
rmo
-co
uple
dial S V
anac
Met
al s
tand
f<i
Thermocouple with
shield to top of
plexiglas
Pyrometer
Pow
erlin
e
Figure 9.
Schematic Flow Diagram of
Experimental Process
Brine outletpu
mp
Lev
elC
onde
nsed
gage
Coo
ling
wat
eroutlet
/PowerL
stat
*
/\
Wat
erV
acuu
m
wat
er
Coo
ling
wat
er -
sani
pi e
Stea
mlin
e
pum
p
r
Air inlet
Wat
er f
eed
colu
mn
Infrared lamp
Coo
ling
wab
eW
ater
vap
orin
let
Ieflector
to c
onde
nser

snddy jo01 e..inçj

51
the fresh water collected.
A detailed description of the respective sections
of the apparatus is presented in the following pages.
A. Evaporator
The vessel constituted an evaporator with no heat
transfer surface inside. Energy in the form of infrared
radiation was transmitted through the Plexiglas cover.
The evaporation of water was carried out in a
vessel made of K-Monel, 1/10-inch thick (see Figure 11).
Extending around the top of the vessel was a metal flange.
The upper part of this flange was K-Nonel 1/10-inch thick,
and it was welded to the vessel along the inner side, The
lower part of the flange was a ring support which was
welded to the Monel flange in eight points equally spaced.
On top of this flange, a rubber gasket was placed. A
circular piece of Plexiglas II UVA (ultraviolet absorbing)
was laid on top of the rubber gasket. The Plexiglas served
as a cover on the top of the evaporator. The Plexiglas disk
was ½-inch thick and 17-inches in diameter. The Plexiglas
was fastened to the flange by eight "C"-clarnps equally
spaced. This arrangement with the aid of nonhardening Per-
matex between the cover and the gasket and between the

half-couplingSchedule 140
'
thicknees 12 gage
FRONT VIEW
12"
34
H234'
T234'
1"half-couplingSchedule 140
1" half-couplingSchedule 140
j_J 12 gage
1 3/8"
thickne8s = 12 gage
Figurell: Sketch of The Innei Cylinder (Evaporator)
TOP VIEW
M. 3. ThESIS Si
1963
TIlE UNIVERSITY OF ARIZONADept. of Chemical Engineering
Title: Main Inner Cylinder(Evaporator)
Drawn By: Eaber I. Shaheen
Scale: Four inches are equivalent
to one inch on the graph
Date: July 214, 1963
334"half-couplingSchedule 1+0

53
gasket and the flange prevented air leakage. Microlite or
glass wool insulation, 3-inches thick, was wrapped around
the cylinder. This insulation fitted between the inner
cylinder and an outer cylinder. The density of this in-
sulation was 0.75 lb/ft3. and its thermal conductivity as
a function of temperature was found in reference (16).
The outer cylinder was made of 22 gauge galvanized steel
and served to contain the insulation and thermocouple
assembly (see Figure 12).
Condenser
The condenser used was manufactured by Buflovak
Equipment Division of Blaw-Knox Company. This was a copper
coil condenser consisting of a copper coil, ¼-inch in diarn-
eter, mounted in a sheet steel tank with the lower part
forming the receiver. There were approximately five square
feet of surface in the coil, and the receiver held approx-
imately four gallons. The condenser was 3-feet long and
10-inches in diameter,
Pumps
The vacuum in the system was established using
Number 927 vacuum pump, manufactured by Nelson Vacuum Pump
Company. Cooling water was used when the unit was operated

3" LJ_
16
3"
8
8
thickness = 22 gage
Figurej2: Sketch of The Outer Cylinder Section
THE UNIVERSITY OF ARIZONADept. of Chemical Engineering
Title; Outer Cylinder(Insulation cover)
Drawn By: Esber I Shahoen
Scale: Four inches are equivalentto one inch on the graph
Date: July 2k, 1963
FRONT VIEW TOP VIEW
51'M. S. THESIS
1963

55
with high surrounding temperatures.
The fresh water collected in the collection chamber
of the condenser was taken out by using a pump with 1/8-
inch fittings made by Cole Parmer Instrument and Equip-
ment Company. This pump was a 7025 Roll-Flex pump with an
electronic speed controller. The powerstat, which had a
scale of 0-100 divisions permitted the control of flow rate
from 90 to 500 milliliters per minute.
Feed Column
Plexiglas tubing 2-inches in diameter and five and
a half feet long was used as a feed column. It was cali-
brated by attaching along the length of the cylinder a
length of graph paper. The equivalent of each division on
the graph paper was determined in milliliters of fresh water.
Air Blower
A piece of 2-inch pipe was connected to the 40
pounds per square inch air supply in the laboratory. Start-
ing at four inches from the end of the pipe nine small holes
were drilled. This arrangement was used to blow the air
along the top of the cylinder, thus simulating wind which
might be encountered in the case of an outdoor still.
Electric System

56
A General Electric Infrared Lamp 1M/T40/3, 1000-
watts, was used, with a voltage range of 115-125 volts..
The light center length of the lamp was 3 and 1/16-inches,
and the overall length was 7 and ¼-inches.
A 17½-inch number 3050A Steber reflector was used
(see Figure 13). Different lamps could be fitted into an
exchangeable socket located at the top of the reflector.
The reflector was fitted to a post in such a way that the
distance between the reflector and the top of the evap-
orator could be varied as desired. The voltage of the in-
frared lamp used was controlled by a Variac which had a
voltage scale with a range of zero to 130 volts, and the
voltage scale was divided into ten-volt increments with
each division being equivalent to two volts.
G. Thermocouples
Temperatures at several points in the evaporator
were measured by using copper-constantan thermocouples.
The wires of the thermocouples, number 24-55-1, were manu-
factured by Leeds and Northrup Company and were attached
to a selector switch. Each number on the selector switch
corresponded to a specific thermocouple in the system.

Figure 13. Photograph of the Infrared Lampand its Reflector
57

58
The locations of the various thermocouples are shown in
Figure 14. A Leeds and Northrup potentiometer was used
for determining the potential difference developed by the
respective thermocouples.
H. Air-Meter
The wind velocity across the Plexiglas cover was
measured by an air draft indicator1 Model R-2, manufactured
by Hastings-Raydist. Inc.
The Hastings Model R-2 air draft indicator consisted
of two basic units, the indicating unit and the velocity
pickup, generally referred to as the probe.
The air-meter consisted of a noble metal thermopile
placed in the air stream. The hot junctions of the thermo-
pile were heated by an alternating current, while the cold
junctions were insulated by heavy mounting studs of low
thermal conductivity. A d-c voltage was thereby generated
between the hot and cold junctions.
Thermal difference was a measure of the velocity
of the air stream into which the thermopile was inserted.
Flow of air past the thermopile tended to reduce the tempera-
ture of the hot junctions and thereby reduced the d-c volt-

L
Scale:
= 4"
Under neathPlexiglas
Movable thermocouple
Onto. of Plexi.las
0
Figure 14: Distribution of ThermocouplesAround the Evaporator.
59
Outs ide
ofmetalshell
On theoutsideskin of
theinsu la-
tion

60
age output. This output voltage was calibrated to indi-
cate air velocity.
Epply radiation pyrheijometer
The sensitive elements in this radiation pyrhelio-
meter were copper-constantan thermocouples, faced with a
blackened non-selectively absorbing disk. The electromag-
netic force (averaging approximately two millivolts gen-
erated per gram calorie of radiation) in all cases was mea-
sured by a recording potentiometer. This pyrheliometer is
owned by the Solar Laboratory of the University of Arizona,
and it was made by Eppley laboratory, Newport, Rhode Island.
Flow system
All piping in the system was made of galvanized
steel. Cooling water to the condenser entered through a
½-inch pipe (see Figure 9). A ¼-inch hoke valve was in-
stalled between the condenser and the vacuum pump, and it
was used to control the pressure inside the system. In
order to prevent vapor-lock, steam was used for start-up
operation.
Water vapor from the evaporator flowed through a
½-inch pipe. A 36-inch U-tube manometer was installed in
this line for the purpose of measuring pressure. A ¼-inch

61
valve was installed between the collecting chamber of the
condenser and the withdrawal pump.
Rubber tubing was used to connect the cooling water
line to the water fittings on the vacuum pump arid to connect
the withdrawal pump to the condenser collecting chamber.
The air flow to the "blower" was controlled by a
½-inch hoke valve.

VI. PROCEDURE
A. Calibrations
Copper-constantan thermocouples were used for
temperature measurements in the system. The thermocouples
were calibrated by using the following procedure. About
500 milliliters of water were placed in a 1000-milliliter
beaker. The temperature of the water bath was increased
at different time intervals. A thermometer was placed in
the beaker, and the thermocouples were placed near the
mercury reservoir of the thermometer. Corresponding to each
increase in temperature, the thermometer reading and the
potentiometer reading for each thermocouple were recorded.
The thermometer used in the calibration procedure was
checked against a standardized thermometer. A graph of
the correct thermometer temperature readings versus
potentiometer readings in millivolts was prepared separately
for each of the ten thermocouples, (see Figure 15 for an
example).
62

2 3 4 5
Potential Difference (millivolts)
Figure 15: Thermocouple Calibration.
Thermocouple Number 0.
63

64
The feed column was calibrated by attaching against
its length a graph paper with ten divisions in each square.
An amount of 3000 milliliter of distilled water was fed to
the column and the total number of divisions corresponding
to the height of water was found. Each division corresponded
to approximately 5.16 milliliters.
The voltage readings on the variac used were checked
against the readings given by an amprobe, Model RS-3, AC.
Volt. Ammeter, Ohmmeter #D 54599, Pyramid Instrument Corp-
oration, New York.
B. Air leak prevention
To check for air leakage in the system the follow-
ing approaches were used:
1. An air pressure of seven lb/in2 was applied to the
system, and it was observed that the pressure decreased
rapidly. The reason for this rapid decrease was a leak
from the top of the evaporator along the flange. This
leak was prevented by using nonhardening Permatex which
was applied between the Plexiglas top and the rubber gas-
ket. Although Permatex was used, a slow drop in the press-
ure applied to the system continued to exist. The remain-
ing leaks proved to be too small for detection by a soap

65
solution technique.
2. The system was dismantled at the different joints.
A vacuum gage was attached to the end of each section, and
the vacuum pump was turned on until practically complete
vacuum was reached in the Section under test. The vacuum
pump was then turned off. When the gage showed any increase
in pressure more tightening was applied, and the operation
was repeated until the applied vacuum remained constant.
This test was repeated for each major section in
the system until the system, under high vacuum, proved to
be leak proof to air.
C. Plexiqias transmission and incident radiation
The transmissivity of Plexiglas was determined by
using an Eppley radiation pyrheliometer. The energy source
was the IN/T40/3 infrared, G. E. Lamp. The lamp was placed
at a known distance from the sensitive element of the
pyrheliorneter. After placing a piece of the Plexiglas used
in the research on top of the pyrheliometer, the lamp was
turned on, and a reading was recorded. Another reading
was taken after removing the Plexiglas and keeping the lamp
turned on. Each reading was taken after a steady-state had
been reached. The transmissivity of the Plexiglas was de-

66
fined as the ratio of the pyrheijometer reading with the
Plexiglas cover being atop of it, to the pyrheliometer
reading without the Plexiglas cover.
The average incident radiation with the infrared
lamp being used at full capacity was also determined with
the radiation pyrheliometer.
D. Operation
The evaporator was warmed up for a short period of
time with the infrared iamp operating at a low power input;
simultaneously, steam was used to purge the system. Purg-
ing with steam replaced the air in the evaporator and pre-
vented "vapor lock" during the actual experimental test
The steam was admitted to the system through the receiving
chamber of the condenser. At the end of the pruging opera-
tion, both the inlet and outlet steam valves were turned
off at the same time. The vacuum pump was started, and the
condenser cooling water was turned on. The steam in the
system was drawn to the condenser and collected in the re-
ceiver. When the desired vacuum was established, the valve
connecting the water feed colurnm to the evaporator was
turned on, and a known quantity of water was admitted to
the evaporator. The air blower was turned on, and the in-

67
frared lamp was used at full capacity. The starting time
was recorded, and the level gage in the receiver chamber
was marked.
The vacuum in the system was kept constant by
using a control valve. The cooling water flow rate was
measured.
The temperatures of interest in the system were
measured by using thermocouples placed at different loca-
tions inside and around the evaporator (see Figure 14).
This procedure was repeated at different time intervals
until steady-state operation was reached. The steady-
state operation was reached when the temperatures measured
for the different points in the system were constant for a
certain length of time. The water level in the receiver
chamber was marked, and the experiment was continued for a
certain length of time; this time was called "elapsed
steady-state time." The water collected during the elapsed
steady-state time was pumped out and weighed. The unevap-
orated water wasweighed at the end of the experiment.

VII. PRESENTATION OF EXPERIMENTAL DATA
Six runs were made, and the data were recorded in
Table VII in the Appendix. The data taken from run number
three were recorded in detail in Table VIII. The detailed
account of the data from run nurrtber three illustrates the
general method followed in taking the data from the respec-
tive runs.
Runs were made at five different pressures inside
the evaporator, while the other parameters were held as
nearly constant as the characteristics of the apparatus
would permit.
Run number one was made when the pressure inside
the evaporator was kept constant at two lb/in2. Due to
excessive heat losses by radiation and convection from the
flange, most of the condensation occured along the upper
edges of the evaporator. In run number two the pressure
inside the evaporator was five lb/in2, and at steady-state
the average rate of water condensation inside the evaporator
68

69
was about 22 droplets/minute, These droplets always started
to form at the very upper edges of the evaporator where the
welding seam of the flange was located. Condensation occur-
red in the form of very small spheres of water. Later,
these small droplets would adhere together to form a larger
droplet and finally stream down to the water basin. The
following runs three, four, and five were made after insulat-
ing the flange with glass wool. Runs three and four were
duplicate runs; that is, approximately the same conditions
existed in both runs. At steady-state the pressure inside
the evaporator was 0.46 lb/in2 in each of the two runs.
Runs five and six were made respectively at 0.7 lb/in2 and
1.28 lb/in2 pressure inside the evaporator. In runs three,
four, five, and six condensation appeared to occur only in
the condenser (see Table III). The tabulated results for
the amount of heat available for water evaporation in each
run, are shown in Table IV. The distribution of the in-
cident radiation on the Plexiglas surface was calculated,
and the results are shown in Tables V and VI.

Run Number Heat Available forWater Evaporation(Btu/hr)
129.5
115.45
162.42
162.42
156.51
143.24
70
TABLE III
PRESSURE INSIDE THE EVAPORATOR FOR EACH
RUN, AND HASIN WATER TEMPERATURE AT STEADY STATE
Run Total Vacuum Pressure In- Basin waterNumber Applied Inside side the Equilibrium
the Evaporator Evaportor Temperature(inches Hg) (lb/in ) (°F.)
1 23.45 2.00 126
2 17.36 5.00 141
3 26.60 0.46 78
4 26.60 0.46 78
5 26.13 0.70 90
6 24.86 1.28 110
TABLE IV
HEAT AVAILABLE FOR WATER
EVAPORATION IN THE RESPECTIVE RUNS

TABLE V
ACTUAL HEAT DISTRIBUTION FOR THE
RESPECTIVE RULS
71
*Duplicate runs.
Run Number 1. 2 3* 4* 5 6
37.55 44.20 21.02 21.02 24.70 23.54
1.66 2.22 0.23 0.23 0.53 0.45
1.35 1.91 1.91 1.36 1.63Q3 2
110.45 100.12 132.44 132.44 128.18 120.19
22.12 26.04 23.30 23.30 24.53 24.75
40.40 46.66 40.00 40.00 45.06 44.72
Q 19.52 16.20 27.84 27.84 27.00 21.871- 2
0refl, 11.83 11.83 11.83 11.83 11.83 11.83
Qg
21.42 15.23 39.00 39.00 36.22 25.90
42.36 44.63 11.60 11.60 3.59 28.62
Qj(total) 308.50 308.50 308.50 308.50 308.50 308.50

TABLE VI
PERCENTAGE DISTRBUTI0N
OF THE INCIDENT RADIATION
72
RunNuxnber 1 2 3 4 5 6
12.17 14.32 6.81 6.81 8.00 9.25
0.37 0.43 0.61 0.61 0.60 0.52
35.85 32.50 43.00 43.00 41.60 39.00
7.17 8.44 7.55 7.55 7.95 8.02
13.09 15.12 12.96 12.96 14.60 14.49
Q 6.32 5.25 9.02 9.02 8.75 7.08,
0refl. 3.84 3.84 3.84 3.84 3.84 3.84
Qg
7.00 5.00 12.60 12.60 11,70 8.40
Qu 14.19 15.10 3.61 3.61 2.96 9.40
TOTAL 100.00 100.00 100.00 100.00 100.00 100.00

Wh,
VIII. DISCUSSION OF RESULTS
A. Heat and mass balances
A heat balance for the evaporator unit was ac-
complished by using the following assumption and approach.
1. Heat loss by conduction from the basin and the
evaporator walls.
The evaporator wall was divided into two sections
along its height, and the average temperature of the outside
wall was measured for each section; the temperatures of the
outer skin of the wall insulation were measured for each
section. It was assumed for all the runs that the direction
of flow of heat by conduction was at all points radial and
perpendicular to the axis of the cylinder. The heat loss
by conduction was calculated by using the following equation:
(9)
= Steady rate of heat transfer by conduction
from the evaporator walls to the surroundings
73

(Btu/hr).
k - Mean thermal conductivity of the insulation
(Btu/hr-ft-°F).
Am Logarithmic mean area through which heat flows
at right angles to the insulation surface (ft2).
At = Temperature difference across the insulation
(°F.).
AX Thickness of insulation (ft).
Am, t, and x were measured and km was found in the litera-
ture (16).
2. Convection losses.
To determine the convection heat transfer coeffici-
ent for the flange before insulation, the following procedure
was followed;
Using Figure eight on page 468 of Chemical Engineers'
Handbook Reference (32), x was defined by the relation,
x = L Voofo/.A
Wh,x = Dimensionless abcisSa.
L Length of heat transfer surface, heated length,
(ft).
74

h = Convection heat transfer coefficient from the
75
V Approach velocity of stream (ft/hr).
= Density of stream of great depth (lbm/ft3).
Absolute viscosity of stream at bulk tempera-
ture (lbm/ft_h1).
Calculating x, and using the curve denoted by (ELF), j was
found. The expression j was defined by the relation,
j = (h/cvf.) (C A/k) 2/3
Where,
j = Dimensionless ordinate.
h = Local coefficient of heat transfer (Btu/hr-ft2-.-
°F).
= Specific heat of stream at constant pressure
(Btu/lb-°F).
k Thermal conductivity of fluid (Btu/ft-hr-°F).
Once j was found, the convection heat transfer coefficient
from the bare flange to the surroundings could be deter-
mined. The amount of heat lost by convection in the case
of a bare flange would be:
= h At (10)
Where,

76
bare flange to the surroundings (Btu/hr-ft2-°F).
Rate of heat lost by convection from the bare
flange (Btu/hr).
A = Surface area of the exposed flange (ft2).
The heat loss by convection from the Plexiglas top
was determined as follows:
To find h the equation (Reference (21) page 140),
h0 = 0.99 + 0.21 V (4)
was used.
Where,
h = Convection heat transfer coefficient from theC
outside Plexiglas surface to the surrounding
atmosphere (Btu/hr-ft2-°F).
V Wind velocity (ft/see).
Once h0 was found, the rate of heat loss by convection from
the Plexiglas was simply found by using equation (10) in
the form,
= hcAt (11)
Where
Oc = Rate of heat lost by convection from the Plexi-
glas surface to the surroundings (Btu/hr).

Surface (3) Surface (2)
77
3. Radiation heat transfer.
In order to make a balance on the radiant energy,
the evaporator was divided into three surfaces..
Surface (1)
The following terms were defined:
= Rate of heat loss by conduction from the evap-
orator walls (Btu/hr).
Surface (1) = The underside surface of the Plexiglas.
Surface (2) = Surface of the water in the basin.
Surface (3) = Surface of the evaporator walls.

78
= Rate of heat loss by conduction through theBt uwater basin
= Rate of incident radiation on the Plexiglas
cover (Btu/hr-O.785 ft2).
= (Rate of available heat for evaporation trans-
mitted through the Plexiglas) + (Rate of heat
gain to the water basin by conduction from
the evaporator walls), (Btu/hr).
= Rate of heat loss to the walls by convection
from the heat transmitted to the inside of the
evaporator (Btu/hr).
Q - Net rate of radiation heat interchange between1+-._
surfaces(l) and (3), (Btu/hr).
Net rate of radiation heat interchange between
surfaces (1) and (2), (Btu/hr).
= Net rate of radiation heat interchange between
surfaces (3) and (2), (Btu/hr).
refl. = Rate of heat reflected from the outside surface
of the Plexiglas cover (Btu/hr).
= Net radiation interchange between the Plexiglas
cover and the surrounding atmosphere (J3tu/hr).
The following equation may be written:

= + (12)
To find Q consider the view factor relation-14_-_
ships: the black-surface over-all interchange factor F12
is defined as the fraction of the radiation leaving black
surface A1 in all directions which reaches and is absorbed
by surface A2, directly and by aid of reflection and/or re-
radiation.
Where,
A1 = Area of surface (1) (ft2).
A2 = Area of surface (2) (ft2).
The equations for the interchange factors can be written as
F12 = F21 (13)
F13 = F23 (14)
A1 P'12 = A2 F21 and A1 F13 = A2 P'23
and since,A1A2
also,
79
l2 +F13 = 1 (15)
The interchange factor F12 was found from Reference (22) and
F13 was found from equation (15). Assuming a gray enclosure,

was found by the equation:
A1 7'13 (T T3) (16)
Where,
A1 = Area of surface (1).
= Overall interchange factor, representing the
radiation reaching surface A3 due to orginal
emission from A1 only, but including assis-
tance given by reflection at other source -
sinks.
r = Stefan-Botzmann constant = 0.1713 x l0
(Btu/ft2-hr- (°R)4).
Absolute temperature of surface (1), (°R).
= Absolute temperature of surface (2), (°R).
13was found by the equation:
1 1 (1 - 1) + 1 - 1) + 1 (17)
A1fj3 A1 1A3 63 A1P13
Where,
A1 and A3 = Respectively1 the areas of surfaces
(1) and (3) , (ft2)
Ernissivity of surface 1.
Emissivity of surface 3.
Exnissivity is defined as the ratio of the actual
80

81
emissive power of a surface at a given temperature to the
ernissive power of a black body at the same temperature.
Emissivity values were found in the literature (22, 32) and
when normal emissivity was reported, it was corrected to
give total hemispherical emissivity.
is fçund in a procedure similar to that
used to find When Q was found from Equation (l2).
will be:
Qs - (18)
Where,
= Rate of radiation transmitted through the
Plexiglas cover (Btu/hr).
Since the transmissivity of the Plexiglas was
determined experimentally, Q will be:
Q5 'TQj (19)
Where,
= TransmiSsiVity.
The amount of heat, reflected from the Plexiglas
surface is:
ref1./Q (20)
I = Plexiglas reflectivity.

The relation between T1!1 and the Plexiglas
absorptivity is:
/ ++7= 1 (21)
Where,
bsorptivity of Plexiglas.
Finally, the incident radiation, at the Plexiglas cover,
was balanced against the respective values for the heat
distribution.
Qj t + 0c +
refl. + 0u + 0g (22)
Where,
= Rate of heat losses due to vapor absorption
by radiation, and other unaccounted for heat
losses, (Btu/hr).
0g = Rate of heat transferred to the vapors passing
along the underside of the Plexiglas surface
(Btu/hr).
The heat available for water evaporation was approximately:
Where,
(23)
82
= Rate of heat available for evaporation (Btu/hr).

83
is positive when it is a gain from the sur-
roundings to the basin of water and negative when it is a
loss from the basin of water to the surroundings, (Btu/hr).
The rate of water evaporated and collected was checked
against the amount of heat available for evaporation.
A full analysis of the results obtained from these
calculations is shown in the following section.
B. Analysis of results.
The heat available for water evaporation increased
with a decrease in the pressure applied inside the evaporator.
This relationship is shown in Figure sixteen and Table IV.
It was not possible to check the amount of heat available in
the first and second runs against the weight of water evap-
orated and collected because condensation in these two runs
occurred at the upper edge of the evaporator, where heat
losses by convection and radiation from the flange were high.
In the following runs, the flange was insulated and since
lower pressures were applied inside the evaporator, conden-
sation occurred in the condenser and none in the evaporator.
Table III shows the pressure inside the evaporator and the
basin water equilibrium temperature in each run. The ac-
curacy of basin temperature determinations was checked and

165
160
150
110
8k
1.0 2.0 3.0 k.0 5.0Pressure Inside the Evaporator (lb/in2)
Figure 16: Heat Available for Water Evaporation
Versus Pressure Applied Inside the
Evaporator.

45
40
35
430
25
20
85
1.0 2,0 3.0 4.0
Pressure Inside the Evaporator (lb/in2)
5.0
Figure 17: Rate of Heat Loss by Conduction Through
the Walls as a Function of the Pressure
Inside the Evaporator.

86
proved to be very satisfactory. For example, under a pres-
sure of two lb/in2 absolute, the temperature of saturated
steam is 126.08°F. (32), and the reported basin temperature
by thermocouple number zero was 126°F. Thus the reliability
of the calibration of thermocouples was established and
thermocouple temperature measurements were considered to
be fairly accurate. In run number three the rate of water
evaporated and collected at steady state was 72 g/hr. This
value checks well with the amount of water which could have
resulted from the calculated heat available for water evap-
oration. The per cent deviation was 2.6%. The per cent
deviation, between the weight of water evaporated and col-
lected in each of the two runs three and four was 4.64%.
The difference between the experimental and calculated
values could be attributed to minor changes in the applied
conditions and to visual error in determining the water
level.
The actual and per cent heat distribution is shown
respectively in Tables V and VI. The heat loss due to ab-
sorption by the vapor and other unaccounted for heat losses
were 3.61, 2.96, and 9.4 per cent respectively in runs
number four, five, and six.

87
The rate of water evaporated and collected from the
condenser chamber increased as expected with a decrease in
the pressure applied inside the evaporator; this is shown
in Figure 18.
Figure 19 shows the equilibrium basin temperatures
as a function of the applied pressure inside the system.
When the pressure was five lb/in2, the maximum attainable
temperature by the water basin was approximately 141°F.,
while the boiling point of water under the given pressure
is about 162°F. This behavior was due directly to the high
rate of heat loss by convection and radiation from the Plexi-
glas cover. Since the Plexiglas transmissivity was 43.8 per
cent for the infrared lamp used, these high losses were ex-
pected. It should be noted that the transmissivity of Plexi-
glas for solar energy is 85 per cent as determined in the
Solar Laboratory of the University of Arizona.
As it appears in Table VIII, the evaporator wall
temperature decreased with an increase in the distance be-
tween the lamp and a point on the wall.
The incident radiation at the Plexiglas surface
was measured accurately by a standardized radiation pyrhelio-
meter. The pressure inside the vessel was measured with a

75
C)
70
00a)
65
4-4
a)
o 60a)'-4r40
C.)
C).-)
::'- 55
OC)
501.0 2.0
Pressure Inside the Evaporator(lb/in2)
Figure 18: Rate of Water Collected from the
Condenser Chamber as a Function
of the Applied Pressure Inside
the Evaporator.
88
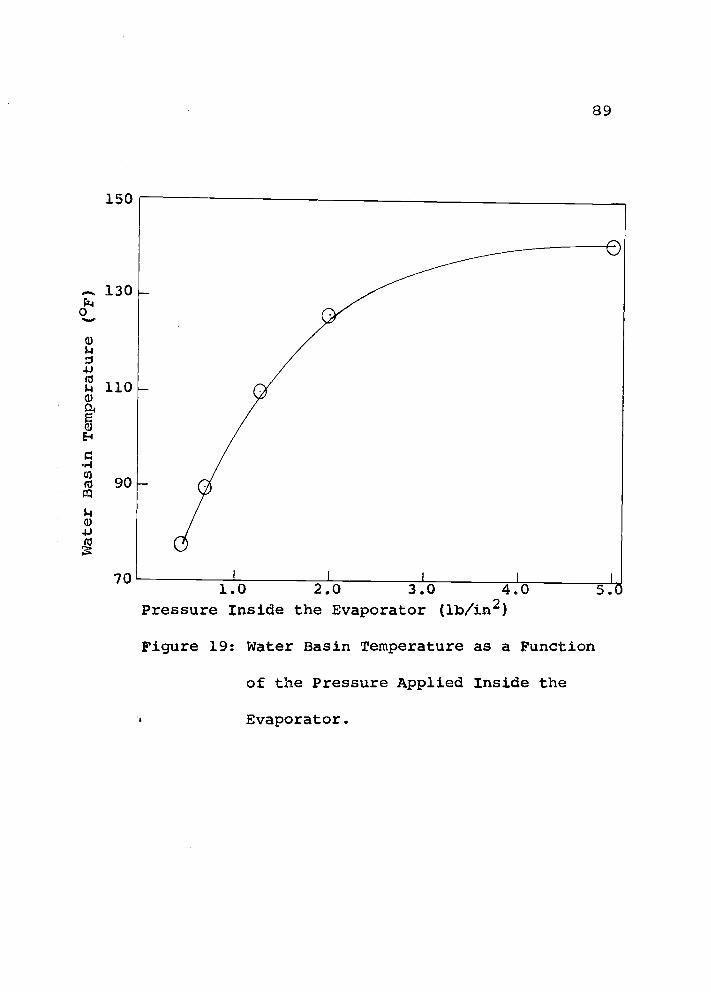
150
130cz4
0
Figure 19: Water Basin Temperature as a Function
of the Pressure Applied Inside the
Evaporator.
89
701.0 2.0 3.0 4.0
Pressure Inside the Evaporator (lb/in2)

90
mercury manometer. The barometric reading was used to
correct this value obtained from the manometer.
Finally, it should be noted that conduction losses
would have been greatly reduced if the walls of the evap-
orator had not been as long and if the evaporator had been
made of concrete. If salt water were used in this experi-
ment it would be expected not to have any signficant scale
formation when the system was used at high vacuum. This
prediction was mainly due to the inverted solubility curve
of calcium sulfate, which was a major scale forming in de-
salination processes using distillation.
It should be noted further that the net radiation
always occurred from the cover to the basin, and this
would hold true if solar energy were used and low pressure
were applied to the system.

0160
91
1.0
2.0
3.0
4.0
5.0
Pressure
Inside
the
Evaporator
(lb/in2)
Figure
20:
Average
Wall
Temperature
of
the
Evaporator
as
a Function
of
the
Pressure
Inside
the
Evaporator.

185
180
0
a)ra9.4
175a)
rcs
4J
;44 a)170
0
C) 165
160
92
1.0 2.0 3.0 4.0
Pressure Inside the Evaporator (lb/in2)
Figure 21: Temperature of the Underside
of the Plexiglas Cover Versus
the pressure Inside the Evap-
orator.
5.0

IX. SUMI4ARY
This research was a preliminary study of the pos-
sibility of developing a new process for saline water con-
version, using vacuum and the low temperatures in a cooling
tower. The low temperatures in a cooling tower were needed
to furnish the cooling water necessary for vapor condensa-
tion when evaporation would occur under high vacuum. The
experimental data showed a sensible increase in the rate of
water exaporated when the pressure in the system was de-
creased. The theoretical accounting for the heat available
for water evaporation, checked satisfactorily with the
weight of water evaporated and collected.
Radiation losses from basin to cover, which usually
occur in conventional solar stills, did not exist under the
conditions of this research. In fact the net radiation
always occurred from the cover to the basin. Under the
principle used, convection losses were nonexistent, and the
sensible heat necessary to bring the water basin to equiL-
93

94
ibrium was less than that of the regular solar stills.
Under the temperatures prevailing in low vacuum, oxidation
and scale formation were almost entirely prevented.

X. RECOMMENDATIONS
Since this work represents a preliminary step to-
ward the major research project of economical conversion
of sea water using vacuum and solar energy, the following
recommendations are made:
Further study of the basic principle of the pro-
cess by investigating the productivity of the
still when it is used under the sun in a desert
site.
The walls of the desert unit should be made of
concrete and the distance between the still cover
and the basin should be kept to a minimum.
A plate glass cover should be usedD instead of
Plexiglas. Glass is more durable and its surface
does not scratch as easily as Plexiglas.
These recommendations are based on the experimental
data and the calculated desert cases which all proved that
the solar vacuum technique S promising and should be fur-
95

ther investigated.
96

XI. ACKNOWLEDGEIIENTS
The author wishes to express his sincere apprecia-
tion to Dr. Donald H. White, the director of this study,
whose patient guidance, encouragement, and inspiration
were invaluable.
I am greatly indebted to Mr. Richard M. Edwards
and Mr. Thomas Breen for their assistance in the building
of the equipment and particularly for their patience with
me. Sincere thanks are due to Professors: Neil D. Cox,
Raymond C. Richardson, and Edward J. Freeh for their
support, advice, and constructive criticism.
The appreciation of the author to his wife Shirley
Ann for her encouragement, hard work, and the typing of
this thesis is beyond expression.
97

XII. LITERATURE CITED
American Chemical Society, Advances In Chemistry Series#27, "Saline Water Conversion", Washington, D. C. (1960).
Association for Applied Solar Energy-Stanford ResearchInstitute, Proceedings of the "World Symposium on AppliedSolar Energy", Phoenix, Arizona (November 1-5, 1955),Jorgenson & Company, San Francisco, California.
Bird1 R. B., W. E., Stewart, and E. N. Lightfoot, "Trans-port Phenomena", John Wiley and S0ns, Inc., New York,London, 2nd Printing (January, 1961).
Bixier, G. H., Saline Water Conversion: How it's prog-ressing, where it's heading, "J. Chemical and Engineer-ing News", Vol. 41 #23 pp. 46-52 (June 10, 1963).
Brown, G. G., "Unit Operations", John Wiley and SonsInc., New York (1950).
Brownell, L. E., and E. H. Young, "Process EquipmentDesign", John Wiley and Sons, Inc., New York, Chapmanand Hall Limited, London (1959).
Cadwallader, E. A., "md. and Engineering Chem.", Vol.54 #3, pp. 26-33 (March, 1962).
Centre Nationale De La Recherche Scientifique, "Appli-cations Thermiques Dc L'Energy Solarie Dans Le DomairDe La Recherc1Et De L'industrie", Colloques Inter-nationaux Du Centre Nationale De La Recherche Scienti-fique, #LXXXV, Mont Louis 23-28 June 1958, 15, QuaiAnatole, France, Paris (VIle), (1961).
Clarke, L., "Manuel for Process Engineering Calcula-tions", McGraw-Hill Book Co., Inc., New York and London,1st Edition (1947).
98

99
Corning Glass Works, "Properties of Selected Commer-cial Glasses", Corning, New York (April 1961).
Daniels, F., and S. A. Duffey, eds.., "Solar EnergyResearch", University of Wisconsin Press, Madison,(1955).
Faust, R. 5,, Desalinization and Future Water Supplyin the United States, "Journal American Water WorksAssociation", Vol. 54 #5, pp. 519-525 (May 1962).
Hodges, C. N., and Richard Kassander Jr., "Distilla-tion of Saline Water Utilizing Solar Energy", in amultiple effect system consisting of separate Collec-tor, Evaporator, and Condenser; Introductory Report,The University of Arizona, Solar Energy Laboratoryof the Institute of Atmospheric Physics (April 1, 1962).
Hodgman, C. D., "Handbook of Chemistry and Physics",Chemical Rubber Publishing Co., Cleveland, Ohio, 39thEdition (1958).
Jenkins, D. S., Director, "A Standardized Procedurefor Estimating Costs of Saline Water Conversion:, officeof Saline Water, U. S. Dept. of the Interior (March,1956).
Johns - Manville, "Industrial Insulations Catalog",Copyright by Johns-Manville Corp., (1959).
Ketola, N. H., "The Application of Thermoelectric Ener-gy Conversion to the Design of a Saline Water Distilla-tion Unit", Thesis, The University of Arizona Library(1961).
Kutchinski, H. P. Jr., "Performance of a Flat-PlateSolar Energy Collector Using a Low-Emissivity GlassCover", Thesis, The University of Arizona Library (1961).
Loebel, F. A., "Brackish Water Conversion in theUnited States", paper presented at the Dsa1inationResearch Conference (june 22, 1961), Woods Hole,

100
Massachusetts (June 19-July 14, 1961), Aqua-Chem. Inc.,Waukesha, Wisconsin.
Maron, S. H., and C. F. Prutton, :Principles of Phy-sical Chemistry", The Macmillan Co., New York, 2ndPrinting (1959).
Mason, M. A., Office of Saline Water, U. S. Dept. ofthe Interior, "Symposium on Saline Water Conversion",proceedings of a symposium, 4-6 November 1957, pub-lication 568, Washington, D. C. (1958).
Mcadams, W. H., "Heat Transmission", McGraw-Hill BookCo., Inc., New York, Toronto, London, 3rd Edition(1954).
McCabe, W. 1., and J. C. Smith, "Unit Operation ofChemical Engineering", McGraw-Hill Book Co., Inc., NewYork, Toronto, London (1956).
Merriman, T., and T. H. Wiggin, "Civil Engineers' Hand-book", John Wiley and Sons, Inc., New York, Chapmanand Hall Ltd., London, 5th Edition (1950).
Office of Saline Water, U. S. Dept. of the Interior,"Third Annual Report of the Secretary of the Interior",on Saline water conversion, Washington 25, D. C.
(January 1955).
Office of Saline Water, U. S. Dept. of the Interior,
"Saline Water Conversion Report for 1960", Washington
25, D. C. (January 1961).
Office of Saline Water, U. S. Dept. of the Interior,
"Saline Water Conversion Report for 1961", Washington
25, D. C. (January 1962).
Office of Saline Water, U. S. Dept. of the Interior,
"Desalination Research and the Water Problem", Report
of the Desalination Research Conference convened by
the NS-NRC, at Woods Hole, Massachusetts June 19-
July 14, 1961, Publication 941, Washington, D. C. (1963).

101
Office of Saline Water, U. S. Dept. of the Interiorand The National Science Foundation, "DesalinationResearch Conference", Procedings of the Conferenceon Desalination Research, organized and convened bythe NAS-NRc, at Woods Hole, Massachusetts June 19-July 14, 1961, Publication 942, Washington, D. C.(1963).
Office of Saline Water, U. S. Dept. of the Interior,"Saline Water Conversion", a Program to develop a newsource of fresh water, Superintendent of Documents, U.S. Government printing office, Washington 25, D. C.(1962).
Office of Saline Water, U. S. Dept. of the Interior,"Saline Water Conversion Report for 1962", Washington25, D. C. (January 1962).
Perry, J. H., "Chemical Engineers' Handbook", McGraw-Hill Book Co., New York, 3rdEditjon (1950).
Spiegler, K. S., "Salt Water Purification", John Wileyand Sons, Inc., New York, London (1962).
Staley, K. A., "Fundamentals of Light and Lighting",Large Lamp Dept., General Electric Co., Bulletin LD-2,(August, 1960).
Telkes, M., Fresh Water from Sea Water by Distillation,"J. Industrial and Engineering Chemistry", Vol. 45 *5,pp. 1108-1114 (May, 1953).
Urquhart, Leonard, Church, "Civil Engineering Handbook",McGraw-Hill Book Co., Inc., New York, Toronto, London,1st Edition (1950).
Zaitsev, D. V., "Demjneralization of Water (1948)", Atranslation from the Russian, for the office of SalineWater, U. S. Dept. of the Interior; gift from Shneiderov,A. 3., (April 17, 1958).

XIII. APPENDIX
102

TABLE vii
DATA FROM TEST RUNS AT STEADY-STATE
Run 1 2 3Date 8/9/63 8/12/63 8/13/63Time of Start 12 noon 8:45 AM 9:15 AMRoom Temperature (°F.) 79 80 82Atm. Pressure (in. H ) 27.52 27.51 27.54Wt. of Water Feed (g 1180 1180 1180Total Time of Run (minutes) 385 346 300Total Vacuum Inside System
(in. Hg) 23.45 17.36 26.6Wind Velocity on Top of Plex.
Surface (mph) 1.5 1.5 1.5Steady-State Time (minutes) 135 46 90Wt. of water evaporated &
collected in CondenserChamber Corresponding to 25.9 5.2 108Steady State Time (g)
Temp. of the Outside Surfaceof Plexiglas Cover (°F.) 119 121 116
Temp. of the Underside ofPlexiglas Cover (°F.) 179 185 169.5
Ave. Flange Surface Temp.(°F.) 99 98.5 96
Temp. of Flange InsulationOuter Skin (°F.) -- -- 86
Basin Water Temperature (°F.) 126 141 78Temp. From Thermocouple No. 1
(OF.) 130 149 88
Temp. From Thermocouple No. 2(°F.) 144 162 114
Temp. From Thermocouple No. 3(°F.) 153 165 135
Temp. From Thermocouple No. 4(F.) 93 95.5 85.5
Temp. From Thermocouple No. 5(°F.) 95 98 87.5
Temp. From Thermocouple No. 6(°F.) 99.5 102 94
Temp. From Thermocouple No. 7(°F.) 111 122 79
Temp. From Thermoc. No 8 (OF.) 89 92.5 82
103

104
TAStE VII(Continued)
DATA FROM TEST RUNS AT STEADY-STATE
RunDate
4
8/13/635
8/14/636
8/14/63Time of Start 7:00 PM 10:30 AM 6:40 PMRoom Temperature (°F.) 81 81 81Atm. Pressure (in. Hq) 27.48 27.55 27.46Wt. of Water Feed (g 1180 1180 1180Total Time of Run (minutes) 185 302 192Total Vacuum Inside System
(in. Hg) 26.54 26.13 24.86Wind Velocity on Top of Plex.
Surface (mph) 1.5 1.5 1.5Steady-State Time (minutes) 40 72 30
Wt. of water evaporated &collected in CondenserChamber Corresponding to 50.5 84.6 27.5Steady-State Time (g)
Temp. of the Outside Surfaceof Plexiglas Cover (°F.) 115.7 119.7 120.3
Temp. of the Underside ofPlexiglas Cover (°F.) 169.5 175 175.5
Ave. Flange Surface Temp.(°F.) 97 97 100
Temp. of Flange InsulationOuter Skin (°F.) 86 85 91
Basin Water Temperature (°F.) 78 90 110
Temp. From Thermocouple No. 1(°F.) 88 99.5 118
Temp. From Thermocouple No. 2(°F.) 114.5 123 138
Temp. From Thermocouple No. 3(°F.) 135 141.5 148.5
Temp. From Thermocouple No. 4(°F.) 85.5 89 91.5
Temp. From Thermocouple No. 5(°F.) 87.5 91 95
Temp. From Thermocouple No. 6(OF.) 94 98 100

TABLE vii(Continued)
105
DATA FROM TEST RUNS STEADY-STATE
Run 4 5 6
Temp. From Thermocouple No. 7(°F.) 79 93 105
Temp. From Thermocouple No. 8(°F.) 82 86 99

TABLE VIII
DATA FROM NUMBER
Date
Time of Start
Room Temp. (°F.)
Atmospheric Pressure(in. Hg) 27.54
Wt. of Water feed(g) 1180
Total time of run(minutes) 300
Total Vacuum insidethe system (in. Hg) 26.6
Wind velocity on topof the Plexiglassurface (mph) 1.5
Steady-State time(minutes) 90
Wt. of Water Evaporatedand collected in theCondenser Chamber 108
corresponding to steadystate time (g)
Water Flow Rate Through The Condenser
Time Elapsed (mm.) lb/mm.0 2819 26.5
212 235297 20.0
106
August 13, 1963
9:15 AM
82

Temperature of Outside Surface of Plexiglas Top
Center 3' from Center 6" from Center
Exposed Flange Temperatures
TABLE VIII(Continued)
Cooling Water Temperatures at Inlet and Outlet
107
T. Elapsed(minutes)
Temp.(°F.)
T. Elapsed(minutes)
Temp.(°F.)
T. Elapsed(minutes)
Temp.(°F.)
2 105 2½ 105 2½ 100
22 111 22½ 111 23 105
73 121 73½ 118 74 106
104 121 104½ 118 105 106
203 122 203½ 119 204 106
215 122 215½ 119 216 106
293½ 122 294 119 294½ 106
Temp. of Flanqe Surface Temp. of Insulation Outer SkinTime Elapsed Temperature Time Elapsed Temperature(minutes) (°F.) (minutes) (°F.)
9½ 90 8½ 85
26 91 26½ 86
78 92 77 86
706 97 205 86
218 97 217 86
293 97 298½ 86
Inlet to Condenser Outlet from CondenserTime Elapsed Temperature Time Elapsed Temperature(minutes) (°F.) (minutes) (°F.)
0 80.5 8 81.4
7 80.9 32 81.1
33 80.5 214 82.9
213 82.3 292 83.1

TABLE VIII(Continued)
108
Basin Water Temperature Underside Temp. of Plexiqias
Time Elapsed TemperatureCover
Time Elapsed Temperature(minutes) (°F.) (minutes) (°F.)
0 82 0 137
4 82 3½ 140
13 80 13½ 150
38 78 40 160
63 78 64 163
75 78 76 163
80½ 78 81 163
130½ 78 95 165
162 78 102 166
222 78 123 167
283 78 127 168
157½ 168
162 169
173 169.5
187 169.5
207 169.5
223 169.5
283 169 5

TABLE VIII(Continued)
Thermocouple No. 4P. Elapsed Temp.(minutes) (°F.)
Thermocouple No. 5P. Elapsed Temp.(minutes) (°F.)
109
Thermocouple No.6P. Elapsed Temp.(minutes) (°F.)
16 84 16½ 85 17 89
33 85 33½ 86 34 90
83 85 83½ 87 84 92
134 85 134½ 87 135 93.5
94
94
94
Thermocouple No. 1 Phermocoup1e No. 2 Thermocouple No. 3T. Elapsed Temp.(minutes)
C F.)T. Elapsed Temp.(minutes) (°F.)
T. Elapsed Temp.(minutes) (°F.)
14½ 87 15 101 15½ 10931½ 87 32 105 32½ 11981½ 87 82 109 82½ 126
131½ 88 132 112 133 132
189 88 189½ 114 190 135
225 88 225½ 114 226 135
284 88 284½ 114 285 135
191 85.5 197 87.5 198
226½ 85.5 227 87.5 227½
285½ 85.5 286 87.5 286
Thermocouple No. 7 Thermocouple No. 8T. Elapsed Temp.(minutes) (°F.)
T. Elapsed Temp.(minutes) (°F.)
17½ 79.3 18 82.5
34½ 79 35 82
84½ 79 85 82
135¼ 79 136 82
228 79 228½ 82
287 79 288 82

GENERAL APPROACH FOR HEAT AND MASS BALANCE AROUND A
REGULAR DEEP BASIN SOLAR STILL
The following is assumed:
A glass covered distiller is used.
Total productivity of the distiller each month is the
monthly average as determined by use of mean values of
solar radiation and atmospheric temperatures.
Absorption in the transparent cover, and temperature
drop across the two surfaces of the cover are neglected.
Assume a period of 24 hour operation.
The cover area is equal to the basin area.
The brine effluent rate is equal to the distillate rate.
Sea water is preheated to distillate temperature.
Effective sky temperature for radiation is equal to
atmospheric temperature.
Conduction heat losses from the basin to the surround-
ings are 50 Btu/ft2-day.
A heat balance around the transparent cover, based on one
square foot of cover area gives:
110

or,
Where,
h Convection heat transfer coefficient fromc,o
cover to atm. (Btu/hr-ft2-°F).
hr,o = Radiation heat transfer coefficient from cover
to atm. (Btu/hr-ft2-°F).
tg = TempeZature of transparent cover assumed equal
to distillate temperature (°).
ta = Atmospheric temperature (°F.).
tb = Temperature of salt water in basin (°F.).
E = Water evaporation and condensation rate
(lb/ft2-hr).
Latent heat of condensation at basin tempera-
ture (+ difference in sensible heat of con-
densate at basin and cover temperatures)
approximately = 1050 (Btu/l.
111
(hc,o + hr,o) (tg ta)
Iatmosherevapor side glass Cover
(hc,i + hr,i) (tb - tg) +
(hc,o + hr,o) (tg - ta) (hci + hri) (tb - tg)
+ (24)

112
hj Coefficient of convection heat transfer from
salt water surface to cover of still (Btu/hr-
ft2-°F).
hri = Radiation heat transfer coefficient, from
salt surface to cover of still (Btu/hr-ft2-°F).
Reference temperature = tg (1)
Overall Energy Balance:
0sh Net solar radiation absorbed on basin bottom,
(Btu/ft2) = (incident radiation _[reflection
from cover + reflection from salt water surface +
reflection from basin bottomj
Basis: one hour:
sh(hc,o+hr,o) (tgta) + E(tbtg) + L (25)
L = Net miscellaneous heat loss: (Btu/hr-ft2).
E(tbtg) = Sensible heat of condensate.
Wda Wda Heat transfer by convection
(_ Ha,b - - Ha,g) E = from salt water surface to
WH2O WH2O the cover of the still (Btu).
Wda = lb dry air circulating inside the still/hr.
WH2O lb H20 distilled/hr.
Enthalpy of dry air at basin temperature (Btu/lb).
Enthalpy of dry air at cover temperature (Btu/lb).

113
Assuming saturation at basin and cover surfaces
the following equation was concluded:
E hc,i(tbtg)
Wda
WH2OUlab - Ha,g)
E is a function of tb rind tg.
Substitute E in Equations (24) and (25), solve for tb and
tg and then solve for (E) using Equation (26). Solve for
the unknowns in Equation (24).
hc,0 = 0.99 + 0.21 V (under practical conditions
subject to wind) (4)
V = wind velocity, ft/sec, (reference (21) page
140).
hlr,o = is found by using the Stefan-Boltzmann Law:
q=oT4 (27)
Total radiant energy = (Btu/ft2-hr)- (Unit area) (Unit time)
Where,
(= Stefan-Boltzmann constant = 0.1713 x 10⁸
(Btu/ft2-hr- (°R)4).
(26)
Emissivity of the glass cover.
hr,o (tgta) 0.1713 x io_8 (TgTa4) x 0.937 (28)

For ordinary glass, 0.937 (taken from reference (1)
page 162).
For black bodies E = 1
= 0.256 (tbtg)°2 (29)
Representing convection transfer between two closely spaced
horizontal surfaces.
Internal Radiation:
hr,i (tbtg) 0.1713 X 1O (Tb4Tg4) x 0.9 (30)
0.9 = effective emissivity of the basin bottom and
the salt water surface.
(Ha,b a,g) Cp(tbtg) (31)
And from Equation (26), replace hj and (nab - Hag) by
their respective equivalents to get:
0.256 (tbtq)025(tbtg)
Wda Cp(tbtg)W20
Thus,
0.25 (WH2O) 1/Cr (32)E = 0.256 (tbtg)Wda
Average for air = 0.24 and,
114

E 0256(tb_tg)°25 wH2o
°24Wda
Replace E and other unknowns by their equivalents, in Equa-
tions (24) and (25) to get:
(3.1) (tgta) + 0.162 X l0_8(Tg4_T4)
0256(tb_tg)125 + 0.156 10_8 (Tb4Tg) +
)07(tbtg)°25o
(34)
- 3.1 (tgta) + 0.162 1o_8Tg4_Ta4 +
1.25 :(W2O + 50l.O7(tbtg) (35)
0sh is determined from Weather Bureau Records.
Replace 0sh and ta by their values in Equations (34) and
(35). Equations (34) and (35) are solved by trial and
error for the mean tb and tg Substitute tb and tg in
Equation (26) to find E (rate of distillation).
115
(33)

NONENCLTURE
right angles (ft2).
c = Specific heat of stream at constant pressure
(Btu/th-°F).
E = Water evaporation and condensation rate (lb/ft2-hr).
F12 = Black surface overall interchange factor, defined
as the fraction of the radiation leaving black
surface A1 in all directions which reaches and is
absorbed by A2, directly and by aid of reflection
and/or reradiation.
= Overall interchange factor, representing the
radiation reaching surface A3 due to orginal
emission from A1 only, but including assistance
given by reflection at other source - sinks.
116
Symbol Definition
A1 = Area of surface (1) (ft2).
A2 = Area of surface (2) (ft2).
A3 = Area of surface (3) (ft2).
Am = Logarithmic mean area through which heat flows at

Symbol Definition
h'0 = Convection heat transfer coefficient from the sur-
rounding air to the glass cover (Btulhr-ft2-°F).
h = Local coefficient of heat transfer (Btu/hr-ft2-°F).
he = Convection heat transfer coefficient from the out-
side Plexiglas surface to the surrounding atmosphere
(Btu/hr-ft2-°F).
hci = Coefficient of convection heat transfer from salt
water surface to cover of still (Btu/hr-ft - F).
= Convection heat transfer coefficient from the glass
cover to the atmosphere (Btu/hr-ft2-°F).
hr,o = Radiation heat transfer coefficient from the glass
cover to the atmosphere (Btu/hr-ft2-°F).
Ha,b = Enthalpy of dry air at water basin temperature
(Btu/lb).
FIa,g = Enthalpy of dry air at cover temperature (Btu/lb).
j = Dimensionless ordinate.
Ic Thermal conductivity of fluid (Btu/ft-hr-°F).
km Mean thermal conductivity of the insulation
(Btufhr-ft-°F).
= Length of heat transfer surface, heated length,
(ft).
117

118
Symbol Definition
q = Heat loss or gain by conduction (Btu/ft2-hr).
= Net rate of heat transfer by convection from the
air to the glass cover (Btu/ft2-hr).
= Net rate of radiation interchange from the air
to the glass cover (Btu/ft2-hr).
= Rate of heat absorbed by the cover from the in-
cident solar energy (Btu/ft2-hr).
= Net rate of convection heat transfer from glass
cover to the vapor inside the still (Btu/ft2-hr).
qj = Incident radiation on the glass cover
(Btu/ft2-hr).
Net rate of radiation interchange from the glass
cover to the water basin (Btu/ft2-hr).
= Rate of heat available for evaporation (Btu/hr).
= Rate of heat loss by conduction through the
water basin (Btu/hr).
Rate of heat loss by convection from the Plex-
iglas surface to the surroundings (Btu/hr).
Qg = Rate of heat transfered to the vapors passing
along the underside of the Plexiglas surface
(Btu/hr).

119
Symbol Definition
Q1 = Rate of incident radiation on the Plexiglas
cover (Btu/hr-O.785 ft2).
= Rate of heat loss by conduction from the evap-
orator walls (Btu/hr).
refl Rate of heat reflected from the outside surface
of the Plexiglas cover (Btu/hr).
Net radiation interchange between the Plexiglas
cover and the surrounding atmosphere (Btu/hr).
0s = Rate of radiation transmitted through the Plex-
iglas cover (Btu/hr).
0sh = Net solar radiation absorbed on basin bottom,
(Btu/ft2).
= incident radiation- (reflection from cover +
reflection from salt water surface + reflection
from basin bottom)
Qt = (Rate of available heat for evaporation trans-
mitted through the Plexiglas) + (rate of heat
gain to the water basin by conduction from the
evaporator walls), (Btu/hr).
= Rate of heat losses due to vapor absorption by
radiation, and other unaccounted for heat losses

= Absolute temperature of surface (1), (°R.).
120
Symbol Definition
(Btu/hr).
LIi2= Net rate of radiation heat interchange between
surfaces (1) and (2), (Btu/hr).
Q1-3= Net rate of radiation heat interchange between
surfaces (1) and (3), (btu/hr).
Net rate of radiation heat interchange between
surfaces (3) and (2), (Btu/hr).
= Rate of heat loss to the walls by convection from
the heat transmitted to the inside of the evap-
orator (Btu/hr).
Rate of heat loss by convection from the bare
flange (Btu/hr).
Temperature of the air surrounding the still (°R.).
Equilibrium temperature of the water in the basin
(°F.).
Average glass cover temperature (°F.).
Absolute temperature of the surrounding air (°R.
solute temperature of the water basin (°R.).
Average absolute temperature of the glass cover
=
ta =
tb =
tg =
Ta
Tb =
Tg =

121
Symbol Definition
= Absolute temperature of surface (2),(°R.).
V = Wind velocity (ft/sec).
Approach velocity of strewn (ft/hr).
Wda = Rate of dry air circulating inside the still
(lb/hr).
WH2O = Rate of water distilled (lb/hr).
X = Dimensionless abcissa.
Greek
= Absorptivity of the Plexiglas cover.
= Temperature gradient (°F.).
= Insulation thickness (ft).
= Emissivity of glass.
A = Latent heat of condensation at basin temperature
including difference in sensible heat of conden-
sate at basin and cover temperatures, approx-
imately = 1050 (Btu/l.
= Absolute viscosity of stream at bulk temperature
(lbm/fthr).
= Stefan-Boltzmaflfl constant = 0.1713 x io8
(Btu/ft2-hr- (OR)4)
Plexiglas reflectivity.

Symbol
Greek
'1=
Definition
Density of stream of great depth (lbm/ft3).
Transmissivity of the Plexiglas.
122