thesis modeling of whiplash injuries using cfd · whiplash which has been defined as an...
TRANSCRIPT

Modeling of Whiplash Injuries using CFD
FENG LIU JUNFENG YANG Department of Applied Mechanics Division of Fluid Dynamics / Division of Vehicle Safety
CHALMERS UNIVERSITY OF TECHNOLOGY Göteborg, Sweden 2008 Master’s Thesis 2008:38


MASTER’S THESIS 2008: 38
Modeling of Whiplash Injuries using CFD
Master’s Thesis in Automotive Engineering
by
FENG LIU
and
JUNFENG YANG
Department of Applied Mechanics Division of Fluid Dynamics / Division of Vehicle Safety
CHALMERS UNIVERSITY OF TECHNOLOGY Göteborg, Sweden 2008

Modeling of Whiplash Injuries using CFD
FENG LIU , JUNFENG YANG
© FENG LIU, JUNFENG YANG, 2008
Master’s Thesis 2008: 38 ISSN 1652-8557 Department of Applied Mechanics Division of Fluid Dynamics / Division of Vehicle Safety
Chalmers University of Technology SE-412 96 Göteborg Sweden Telephone: + 46 (0)31-772 1000
Cover:
Printer/ Department of Applied Mechanics Göteborg, Sweden 2008

i
ABSTRACT
Whiplash injuries occur usually in low-speed rear-end collision and often cause pain in the neck region as well other neurological symptoms. Aldman (1986) proposed a pressure gradient injury mechanism. The experiment study using pig indicates that the peak pressure transient is found at the middle of the cervical spinal canal, and nerve tissues injuries are detected as well.
Present study models a volunteer test carried out by Ono et al (2000), to investigate the pressure change in the cervical spinal canal of human using CFD simulation. The internal vertebral venous plexus is modeled as a 3-D pipe, which is radically rigid but axially flexible. The inner volume change of the spinal canal is analyzed based on the kinematics model of the whiplash motion, which is built on the measured cervical vertebral rotational angle in the volunteer test. With the help of Fluent, the CFD simulation shows that the negative pressure can be found at the middle of the cervical spinal canal when the neck reaches the maximal S-shape.
The setup of the boundary conditions and the flow type of the blood is discussed in the report. The top of the internal vein should be assumed no blood exchanging during the whiplash. Moreover, the value of the pressure transient increases the loss coefficient of the intervertebral veins. Though the blood flow is modeled as laminar flow, the turbulent flow model also gives a reasonable result. Thus, boundary conditions and flow type of the blood in the cervical venous plexus are two valuable further works. Moreover, the geometry model and kinematics model should be refined in the future.
Key words: rear-end collision, whiplash injury, pressure transient, CFD

ii
LIST OF ABBREVIATIONS
AIS Abbreviated Injury Scale C1-C7 Cervical Vertebrae, Number from the top downwards CFD Computational Fluid Dynamics CNS Central Nerve System CSD Computational Structure Dynamics CSF Cerebro Spinal Fluid CT Computed Tomography g Acceleration of gravity (1g = 9.8 m/s2) HUMOS HUman Model for Safety MADYMO MAthematical DYnamic Models MRI Magnetic Resonance Imaging NIC Neck Injury Criterion PMHS Post-Mortem Human Subjects QTF Quebec Task Force Re Reynolds number SKN Spinal Canal Key Node T1 First Thoracic Vertebrae THUMS Total Human Model for Safety DRG Dorsal Root Ganglion UDF User Defined File VKN Vertebral Key Nodes WAD Whiplash Associated Disorders

iii
ACKNOWLEDGMENTS
This thesis has been performed as a cooperation project between the Fluid Dynamics Division and the Vehicle Safety division, Department of Applied Mechanics, Chalmers University of Technology, Göteborg, Sweden. Without successful cooperation between two divisions, this thesis would not have been possible. Financial support from Chalmers University of technology is acknowledged gratefully. Computers, open landscape office and FLUENT software provided at Division of Fluid Dynamics are also acknowledged.
We would like to express our sincere gratitude to our supervisors, Lars Davisson, for sharing some of his profound knowledge in computational fluid dynamics; Mats Svensson, for sharing profound knowledge and documents in whiplash field at any time. Their enthusiastic guidance and encouragement pushed this thesis in correct direction.
Fredrik Carlsson, who comes from Fluent Sweden AB and provide forceful technical support, deserved special appreciation.
The administrative staff, Ulla Lindberg-Thieme and Monica Vargman recognized with gratitude for managing nice tea/coffee break, cake break, and delicious fruit every day. That gives us a 'come back home' feeling.
Our warm thanks go out to the rest of colleagues and friends at Division of Fluid Dynamics who contributed to a very pleasant work atmosphere.
Special gratitude goes to our respective families for their understanding and selfless care in life.
Feng Liu Junfeng Yang

iv
Contents
ABSTRACT............................................................................................................................................... i LIST OF ABBREVIATIONS................................................................................................................... ii ACKNOWLEDGMENTS ....................................................................................................................... iii 1. Introduction........................................................................................................................................... 1
1.1 Whiplash injuries and symptoms................................................................................................. 2
1.2 Anatomy of Human Neck............................................................................................................ 3 1.2.1 Structure of Spinal Cord ....................................................................................................... 4 1.2.2 Structure of Cervical Venous System ................................................................................... 6 1.2.3 Structure of Cervical Vertebrae................................................................................................. 8
1.3 Hypotheses and previous researches ......................................................................................... 10 2. Aims .................................................................................................................................................... 13 3. Methodology ....................................................................................................................................... 14
3.1 Theoretical model .......................................................................................................................... 14
3.2 Geometric Model ........................................................................................................................... 15
3.3 Kinematics Model.......................................................................................................................... 17
3.4 CFD simulation.............................................................................................................................. 23 4. Results................................................................................................................................................. 24 5. Discussion ........................................................................................................................................... 26
5.1 Compared with experimental results ............................................................................................. 26
5.2 Boundary conditions...................................................................................................................... 27
5.3 Flow type ....................................................................................................................................... 30
5.4 Cadaver case .................................................................................................................................. 31 6. Conclusion .......................................................................................................................................... 33 7. Further Work....................................................................................................................................... 34 8. Reference ............................................................................................................................................ 35 9. Appendix............................................................................................................................................. 38
Appendix A User Defined File(UDF) .............................................................................................. 38
Appendix B Simulation Results...................................................................................................... 41

CHALMERS, Applied Mechanics, Master’s Thesis 2008: 38
1
1. Introduction
Whiplash is defined as the lash or lash-like motion of a whip. This phenomenon usually occurs in flexibly connected systems when loads are applied on it. In vehicle safety and clinical fields, it specifies to the acceleration-deceleration motion of head-neck system and neck injury followed this motion. Whiplash which has been defined as an acceleration-deceleration mechanism of energy transfer to neck, usually occurs during various vehicle collisions, including front-end collision, rear-end collision, side collision, combined, and other types of collision (1995, Quebec Task Force).
Figure 1 Whiplash motion ( Svesson M.Y., 1993; Erik E.S., et al., 2005)
During rear-end vehicle collision, the struck vehicle with seat and seat back accelerates forward, as a result of the force applied by a striking vehicle. The occupants who sit in the struck vehicle will be push forward by seat back. The push force only applies on the torso while head and neck do not sustain any lateral force. According to Newton's First Law, and the Law of inertia, the object will only change its velocity when acted upon by an outside force. So head will remain stationary, relative to the trunk, until the moment of collision. Since no head angular rotation occurs, linear lag motion places the lower cervical segments in flexion, and upper cervical segments shortly thereafter begin to extend. Viewing from the lateral aspect, cervical spine adopts an elongated S-shape curve. When both parts reach their limits for maximum flexion and extension respectively, head starts rotating rearwards. The lower cervical spine goes from maximum flexion into extension and simultaneously upper cervical spine goes from full extension into a less extension position. This process looks like an extension wave propagates from the lower to upper part of neck. This motion is usually stopped by the structure of neck or head restraint if applicable. We call this duration as whiplash-extension (see Figure 1).
Following extension motion, head and neck return to their upright position and finally goes into flexion

CHALMERS, Applied Mechanics, Master’s Thesis 2008: 38
2
by contracting force generated by the stretched muscle of neck. Some theories (Svensson M. 1993; Ono et al., 1999; Yang et al., 1996) suggest that whiplash injuries take place during the early stage of extension. Aldman (1985) hypothesis that pressure transient in the central nervous system (CNS) during the whiplash motion may be a reason for whiplash injuries. Furthermore, Svensson (1993) investigated the pressure transient phenomenon in spinal canal by pig experiments. Therefore, this thesis focused on the pressure transient during the extension motion only.
The economic cost related to whiplash injury, include medical care, disability, sick leave, and lost work productivity. In U.S, the average cost of whiplash injuries for one person was US$9,994 (which includes US$6,843 in economic costs and US$3,151 in quality of life impacts, but not property damage), resulting in a total annual cost of approximately US$2.7 billion (Economic and Social Council, United Nations, 2005). In Australian, the average total cost of a neck injury is $18,114 including 31.1% general damage, i.e., pain and suffering, 15.9% legal and investigation costs, 14.4% wages loss and 8.8% hospital and medical cost. The total cost of the Whiplash Associated Disorder (WAD) could be $540 million each year (Ryan G.A, 2000). In UK, the estimated economical cost of WAD is at least £1 billion annual (Barnsley L., 2000). More than 1 million European citizens suffer neck injuries implying tremendous societal cost roughly at least 10 billion Euro annually (Svensson, 2002).
1.1 Whiplash injuries and symptoms
Whiplash injuries include bony fracture, muscle lesion, disc tear and joint dislocated that usually occur in high speed vehicle collision and could be detected by CT, MRI and X-ray. Nevertheless, usually no clear objective evidences could be discerned at low speed vehicle collision. The potential injury sites could be nerve cell dysfunction, zygoapophyscal joint impingement and facet joint capsule stretch (Svensson M., 1993; Ono et al., 1999; Yang et al., 1996).
In earlier studies, Abbreviated Injury Scale (AIS) has been widely cited to rank the severity of whiplash injury (AIS1 neck injury, which excludes fracture or dislocation to the cervical spine)(Compton C., 1994). It classifies severity on the basis of the body region injured and the magnitude of the injury in that body region. Since no whiplash injuries proof could be provided in most instances, AIS usually gives a misleading answer.
In 1995, Quebec Task Force (QTF) adapted a generic term 'Whiplash Associated Disorders (WAD)' to describe clinical syndromes and poorly defined symptoms associated with the low speed rear-end impact. According to QTF (1995), WAD is classified into five categories based on clinical symptoms and signs, shown in Table 1.
This classification is mostly used to classify WAD in the acute phase. Beside common symptom neck pain, WAD includes subjective weakness or abnormal response in the neck, shoulders and upper back as well as vision disorders, dizziness, headaches, tinnitus and neurological symptoms in upper torso (Gay et al., 1953; Macnab, 1971; Evans RW, 1996).

CHALMERS, Applied Mechanics, Master’s Thesis 2008: 38
3
Table 1 QTF injury degrees, the Quebec classification of WAD (QTF, 1995)
QTF Grade Clinical Presentation
0 No complaint about the neck; No physical signs;
1 Neck complaint of pain, stiffness or tenderness only; No physical signs;
2 Neck complaint and musculoskeletal signs;
Limited range of motion, point tenderness;
3 Neck complaint and neurological signs;
Decreased deep tendon reflexes, sensory deficits;
4 Neck complaint and fracture or dislocation.
WAD is often delayed, from several hours to 24 hours, and usually recovers in some days or couple of weeks, regardless of the treatment or type of care provided (QTF, 1995). A well-designed prospective study reported the following percentages of patients with complaints of neck pain and headaches, respectively, at various times after the injury: 92% and 57% – 1 week, 38% and 35% – 3 months, 25% and 26% – 6 months, 19% and 21% – 1 year, and 16% and 15% – 2 years (Radanov BP.,1994b and 1995 ).Whiplash injuries recover period usually varies with treatment strategy, gender, age, and health condition. Based on the duration length, WAD has been divided into acute symptoms with 0-12 weeks duration and chronic symptoms with more than 12 weeks duration or disability (Nachemson and Jonsson, 2000).
Unfortunately, about 10 to 20 percent of the whiplash patients have the risk to develop to chronic disease and disabilities (Kischka U., 1991). In a study of patients with chronic symptoms after a whiplash injury, cognitive, psychological, and somatic symptoms occurred in the following percentages: nervousness and irritability, 67%; cognitive disturbances, 50%; sleep disturbances, 44%;fatigability, 40%;disturbances of vision, 38%; symptoms of depression, 37%; headache, 85%; neck pain, 100%; vertigo, 72%; and brachialgia, 60% (Kischka U., 1991). Symptoms present two years after injury are still present ten years after the injury (Gargan MF., 1990). It is chronic WAD that constitutes the problem in medical and biomechanical sense.
Since the common WAD (neck pain and headache) occur at the low speed (<20 km/h) range, all rear-end collision discussed in this thesis are refer to the low velocity collision.
1.2 Anatomy of human neck
To duplicate the whiplash motion and setup an accurate geometry model, it's necessary to identify the essential parts of the neck (cervical vertebrae, ganglion nerve, and venous plexus). Fundamental knowledge about human anatomy should be illuminated. Moreover correct and systematic understanding to human biological system enhances understanding of potentially injurious events and allows prediction of safety-related problem.
The basic mechanical elements of neck include spinal cord, venous plexus, cervical vertebra,

CHALMERS, Applied Mechanics, Master’s Thesis 2008: 38
4
ligaments, intervertebrae disc, muscle and skin. However, this thesis only focuses on cervical vertebrae, which relate to the whiplash motion, vertebral venous system, which could be potential injury causation, and cervical nerves, where injuries can always be found. Although Cerebro Spinal Fluid (CSF) also can flow in and out the cervical spinal canal, due to the greater flow resistance in the subarachnoid space, the volume compensation of the CSF has been considered as minor importance (Svensson M.Y., et al., 1993). The essential hypothesis of this thesis is that the great pressure gradient generated during the whiplash could damage the nerve ganglion. Ligament, muscle and disc are also potential injury sites following the whiplash motion. However, they are not the main points in this thesis
1.2.1 Structure of spinal cord
The spinal cord, enclosed within the vertebral column, extends from the foramen magnum of the skull (where it merges imperceptibly with the medulla of the brain stem) to the level of the first or second lumbar vertebra, just inferior to the ribs. As CNS, spinal cord provides a two-way conduction pathway to and from brain.
Spinal cord is protected by vertebral body, cerebrospinal fluid, and meninges. The single layered dura mater of the spinal cord, called the spinal dural sheath, is not attached to the bony walls of the vertebral column. Between the bony vertebrae and the dural sheath is a rather large epidural space filled with a soft padding of fat and a network of veins. CSF fills the subararchnoids space between the arachnoid and pia mater meninges, shown in Figure 2.
Figure 2 Cross-Section of Cervical Spinal (Sances et al., 1984)

CHALMERS, Applied Mechanics, Master’s Thesis 2008: 38
5
Each spinal ganglion connects to the spinal cord by two roots, the dorsal and ventral roots. Each root forms from a series of rootlets that attach along the whole length of the corresponding spinal cord segment. The ventral roots contain motor fibers, arising from anterior horn motor neurons, which extend to and innervate the skeletal muscles. Dorsal roots contain sensory neurons in the dorsal root ganglion, which conduct impulses from peripherally located receptors to the spinal cord. The spinal roots pass laterally from the cord and unite just distal to the dorsal root ganglion to form a spinal nerve before emerging from the vertebral column via their respective intervertebral foramen. Numerous other nervous tissues and many tiny muscles are situated in the neck around the spine, as well as large and small blood vessel.
a b
Figure 3 Spinal nerves distribution (Schnuerer A. et al., 2003)

CHALMERS, Applied Mechanics, Master’s Thesis 2008: 38
6
As illustrated in Figure 3(a), eight pairs of spinal nerves in neck, each containing thousands of nerve fibers, arise from the spinal cord and are buried deep in the neck. The spinal nerves are named according to their point to issue from the spinal cord. The first seven pairs of cervical nerves exit the vertebral canal superior to the vertebrae for which they are named. C8, on the other hand, emerges inferior to the seventh cervical vertebrae (between C7 and T1). Below the cervical level, each spinal nerve leaves the vertebral column inferior to the same-numbered vertebra.
Most nerve branches transmit sensory impulses from the skin of the neck, the ear area, and the shoulder. Other branches innervate muscles of the anterior neck. They give rise to virtually all the nerves that innervate the upper limb as Figure 3(b) displaying.
Since nervous tissues are soft and delicate, the irreplaceable neurons are injured by even slight pressure. Damage to the ventral root results in a flaccid paralysis of the skeletal muscles served. Because the lower motor neurons are damaged, nerve impulses do not reach these muscles, which consequently can not move either voluntarily or involuntarily. Transaction of the spinal cord at any level results in total motor and sensory loss in body regions inferior to the site of damage. If the nerves injury occurs in the cervical region, all four limbs are affected and quadriplegia occurs.
Table 2 indicates any localized damage to the spinal cord or spinal roots associated with some form of function loss, either paralysis or paresthesias. Irritation of the phrenic nerve causes spasms of the diaphragm, or hiccups. If both phrenic nerves are severed, or if the C3-C5 region of the spinal cord is crushed or destroyed, the diaphragm is paralyzed and respiratory arrest occurs. It is clear that the symptoms of cervical nerve injury could be parts of the WAD. Cervical nerves injury could be one of the main causation of the whiplash injury.
Table 2 Cervical spinal nerves and pains distributions (Schnuerer A., et al., 2003)
Disc Level
Nerve Root
Sensory Distribution Radicular Pain Distribution
C2/C3 C3 Posterior upper neck, occiput, ear Posterior upper neck, occiput
C3/C4 C4 Base of neck, medial shoulder Neck, upper scapula
C4/C5 C5 Lateral upper arm Scapula border, lateral upper arm
C5/C6 C6 Bicep area, lateral forearm, thumb and 1st finger
Lateral forearm, thumb and 1st finger
C6/C7 C7 Posterior forearm, middle finger Scapula, posterior arm. Dorsum of forearm, 3rd finger
C7/T1 C8 Ulnar forearm and 5th finger Shoulder, ulnar forearm, 5th finger
1.2.2 Structure of cervical venous system
The vertebral venous system is composed of three intercommunicating networks: the external vertebral

CHALMERS, Applied Mechanics, Master’s Thesis 2008: 38
7
venous plexus, the internal vertebral venous plexus that surrounds the dura mater within the vertebral canal, and the bridging veins (see Figure 4). The vertebral venous system constitutes the major drainage pathways to return venous blood from the cranial structures towards the heart (see Figure 5).
Throughout the vertebral column, internal vertebral venous plexus are located inside the vertebral canal between the dura mater and the epidural space. Its channels are embedded in the epidural fat and consist of anterior plexus and posterior plexus. The internal vertebral venous plexus communicates rostrally with the intracranial basilar venous plexus. Evidence of the internal vertebral venous plexus was the presence of interarcuate veins that jointed the internal vertebral venous plexus at the vertebral arch. Numerous transverse connections exist between these longitudinal networks (Edward and Barton, 2006).
The external venous plexus that encloses the outer portion of the vertebral body is formed by the main trunk of the external jugular vein and vertebral veins joining with the plexus. It is located along anterior and posterior aspects of the vertebrae. External jugular veins and vertebral veins terminate in the subclacian veins and the brachiocephalic vein respectively. The vertebral veins located inside the transverse channel of the vertebrae C1 through C6. They communicate with the internal vertebral venous plexus via segmental intervertebral veins and also receive tributaries from the deep and anterior cervical veins. These longitudinal venous trunks deviate laterally at the level of each intervertebral disc and converge medially at the mid-point of the vertebral body, where they unite with the basivertebral veins.
Figure 4 Cervical vertebral venous plexus : 3, intervertebral veins ; 5, basivertebralis veins ; 4 and 6, external cervical venous plexus ; 7, internal cervical venous plexus (Clemens, 1961 )
As mentioned above, external and internal venous plexus communicate through bridging veins: intervertebral veins, which exit through the intervertebral foramen on both sides of the vertebral body, and the basivertebral veins, which extend in radial direction through the vertebral body.

CHALMERS, Applied Mechanics, Master’s Thesis 2008: 38
8
Figure 5 Course of the cranial and cervical veins.( Elaine R.N., 1998)
Due to extensive communications and the nonvalvular nature, vertebral venous plexus could serve as regulator to balance the volume and pressure changes the cervical spine. This ability has been amply demonstrated by the experiments that compress the jugulars veins, causes an increase in the CSF pressure through dural compression from expansion of the collaterally loaded internal plexus (Richard H.R., et al., 1981). Cervical venous system is evidently capable of passing large quantities of blood without developing varies. Since external and internal plexus of veins are associated with the vertebral column, the volume change of the plexus will induce the pressure transient in spinal canal. This pressure transient could generate great shear stress that damage ganglion root around the transverse foramen.
1.2.3 Structure of cervical vertebrae
The cervical spine has seven cervical vertebrae named as C1, C2 ...C7 from the top downward the bottom (Figure 6). They are connected flexibly by ligament, discs and muscle tissue. To provide a firm support and multi-direction motion for head, cervical curvature is concave posteriorly. This curvature increases the resilience and flexibility of neck, making it function like a spring rather than a rigid rod. Additionally, cervical vertebrae provide attachment points for muscles, ligament and other soft tissue in cervical section. It also protects the delicate spinal cord which runs through the vertebral foramen.

CHALMERS, Applied Mechanics, Master’s Thesis 2008: 38
9
Figure 6 Structure of cervical vertebrae (Keiser C., 2002)
C1 and C2 have unique structure and require special notation. C1 is a bony ring without body and spinous process, consisting of an anterior and posterior arch (Figure 7). The distinctive characteristic of C2 is the odontoid process (dens), which articulates with the posterior surface of the anterior tubercle of C1.The heat rests on C1, with C1 pivoting around the dens. Dens serves as a pivotal restraint against horizontal displacements of C1.Together C1 and C2 form a complex articular system that permits both the nutational and rotational movements of the head. Since there is not intervertebral disc between the first two vertical vertebrae, they are regarded as an integrate entity.
C1 C2 C1/C2 circular Figure 7 Structure C1 and C2 (Schnuerer A., et al., 2003)

CHALMERS, Applied Mechanics, Master’s Thesis 2008: 38
10
Figure 6 A typical cervical vertebral body (C3) (Schnuerer A., et al., 2003)
The 'typical' cervical vertebrae (C3-C7) have a common structural pattern (Figure 8). Each vertebra consist of a body anteriorly and vertebral arch posteriorly. Together, the body and vertebral arch enclose the vertebral foramen. Successive vertebral foramina of the articulated vertebrae form the vertebral canal, or spinal canal. To either side of the body lies a small transverse process and transverse foramen that vertebral vein travels through. The superior articular processes are lateral to transverse foramen. These processes are connected the anterior and posterior portion of the vertebrae via pedicles. The pedicles have notches on their superior and interior borders, providing lateral opening between adjacent vertebrae called intervertebral foramina. The spinal nerves which issue from the spinal cord, and intervertebral veins which connect vertebral veins and internal vertebral venous plexus, pass through these foramina.
1.3 Hypotheses and previous researches
Whiplash injury research could be tracked back to 1950s. After decades of study, there are least five different hypotheses of injury mechanism. Most of these mechanisms are based on observed kinematics of the neck in impacts on animals, cadaveric specimens, or volunteers (King H Yang and Albert King, 2003). Principally, these five hypotheses could be divided into three classes, which are hyper extension related hypothesis, facet joint related hypothesis, and pressure gradient hypothesis.
Earlier studies have suggested that neck hyper extension may be responsible for WAD, based on the large extension angle of the neck in the later stages of a rear-end impact (Macnab 1965). However, current automotive head restraints were not effective in reducing the frequency of this problem (Deng et al, 2001). Nygren et al. (1999) found only a 20% decrease in neck injuries after the introduction of the head-restraint. This means that the hyper-extension injury mechanism model needs to be re-examined.
Another hyper extension related theory is muscle injury during the whiplash, where the anterior cervical muscles undergo an eccentric contraction. That is, the muscles are contracting as they are being stretched. It has been shown by Garrett et al. (1997) that muscles can only be injured during

CHALMERS, Applied Mechanics, Master’s Thesis 2008: 38
11
eccentric contraction. However, in the case of these anterior muscles, they tend to hurt for a few days after the impact but are not a chronic problem. The difficulty appears to be located in the back of the neck where the extensor muscles are located. These muscles undergo concentric contraction and are not likely to be injured. Tencer et al. (1999) proposed that the injury to the extensor muscles occurred during rebound of the head and neck as the undergone eccentric contraction. The mechanism is biomechanically consistent with the results of Garrett et al. (1997) but the hypothesis flies in the face of many more frontal impacts in which there is hyper flexion due to severe crashes and there not a large number of complaints of neck ache from these crash victims.
Ono et al. (1997) and Yoganandan et al. (1998) both propose a facet joint impingement injury mechanism. Specifically, Ono et al. (1997) theorized that a portion of the facet capsule can be trapped between the facet joint surfaces and pinched, causing pain. There is no biomechanical evidence that the capsule is loose enough to be trapped between the facet joint and even if it was trapped, evidence is lacking to show that nociceptors are present in the trapped portion of the capsule and are indeed set off by the pressure. The proposition that compression of the surfaces can produce pain is also untenable since cartilage is devoid of nociceptors and there is no neurophysiological evidence that the nociceptors in the subchondral bone can be made to fire by this presumed compression.
Another hypothesis related to the facet joint was proposed by Yang et al. (2000). The authors claimed that the combination of axial compressive force and posterior shear of the cervical spine induced a large stretch of the facet joint capsule. In a rear-end impact, the motion of the torso precedes that of the neck due to the fact that the force is first applied to the torso by the seat back. In order for the head to remain attached to the torso, a shear force is generated at each cervical level from C7 until it reaches the occipital condyles before the head can move forward. Because the cervical facet joint is inclined at an angle that is approximately 45 degrees from the antero-superior to postero-inferior position, this configuration makes it easier for the facet joint capsule to be stretched in a rear-end impact compared to that in frontal impact. The axial compressive force is due to straightening of the kyphotic thoracic spine and/or upward tamping of the torso on the seat back. Later, the hypothesis was modified to include the tensile force generated between the torso, which has been slowed down or stopped by the lap belt, and the head that is still moving in the superior-posterior direction (Yang KH and King Albert 2003).
Aldman (1986) proposed a pressure change hypothesis, which is based on an increase in pressure in the spinal canal during whiplash causing compression on the nerve roots. Subsequent experimental studies using pigs reveal that the pressure of inter-vertebral canals had the largest values in the lower half of the cervical spine, and the injuries to the ganglia, which are situated in the intervertebral foramina, were most severe at the lower half of the cervical as well (Svensson, 1993). Not only the pressure increase and the ganglia injuries location is correlated, but those injuries to the cervical spinal ganglia are also corroborated by many of the known whiplash extension symptoms: Pain and sensory disturbances to the parts of the body that are associated with the cervical dorsal nerve-roots are common (Nygren, 1984; Watkinsson, 1991) and vision disorders could for instance be caused by disturbance to the proprioception associated with the sensory function involving the upper cervical spinal ganglia (Hildingsson, 1991). Sensory dysfunction of trigeminal skin area combined with cervical soft injury could possibly be caused by injury to the trigeminal ganglia due to the same pressure mechanism as suggested by Aldman (1986) for the cervical spinal ganglia (Svensson, 1993). Headaches could also be an effect of injuries to the nerve root region (Hildingsson, 1991).

CHALMERS, Applied Mechanics, Master’s Thesis 2008: 38
12
However, Yang (2003) commented that the pressure change hypothesis does not fit clinical symptoms, because stimulation or pressure on the nerve roots and dorsal root ganglion (DRG) can produce radicular symptoms and not pain in the neck. Moreover, Cavanaugh (2000) suggested that the cervical facet joints are a significant source of whiplash pain source, the clinical studies conducted in Australia by Barnsley et al. (1995) and Lord et al. (1996) have the similar conclusion. But it is not the only source of the whiplash injury. As indicated in Table 1, WAD can be divided into five QTF grades. Hell et al (2000) suggested that the QTF grades should mirror the cervical spine distortion (CSD) severity, and estimated for QTF1 to QTF3, as shown in Table 3. With the estimation given by Hell et al (2000), joint facet and neurological injury can be classified into different QTF grades. Although the pressure change theory could not cover all the whiplash injury symptoms, it is a non-negligible hypothesis for whiplash injuries mechanism.
Table 3 Estimated pathology of cervical spine distortion (Hell et al., 2000)
Estimated Pathology of Different QTF Degrees
QTF1 Microscopic or multi-microcopic lesion. Lesion is too small to cause muscular spasm.
QTF2 Distortion and soft tissue bleeding (joint capsules, ligaments, tendons and muscles).Secondary muscle spasm after soft tissue injury.
QTF3 Injuries of the neurological system caused by mechanical damage or secondary irritation caused by bleeding or inflammation.

CHALMERS, Applied Mechanics, Master’s Thesis 2008: 38
13
2. Aims
Present study includes three purposes:
•••• Setup a 3-D model for vertebral venous plexus;
•••• Model the whiplash motion using MATLAB;
•••• Investigate pressure transient during the whiplash motion via CFD.

CHALMERS, Applied Mechanics, Master’s Thesis 2008: 38
14
3. Methodology
3.1 Theoretical model
The length of the cervical spinal canal alters when the neck is flexed or extended; it increases at flexion and decreases at extension (Breig, 1978), see Figure 9. While the total cervical canal area is on average 4% smaller in the retracted position than in the neutral position, the area occupied by the spinal cord remains unchanged (Siegmund et al., 1998). This means that the inner volume of the spinal canal decreases during neck extension and increases during flexion of the neck. However, all the tissues and fluids (fat, blood, CSF) inside the spinal canal are virtually incompressible (Estes and McElhaney, 1971). Since the CSF flow was thought to be of minor importance regarding this type of volume compensation, this means that blood transportation, to and from the cervical spinal canal, must take place to compensate the volume change during the flexion-extension motion of the cervical spine.
Figure 7 Extension and flexion of the spinal cord (Svensson, 1993)
Therefore, the venous blood, which forced flows in the vertebral venous plexus and its bridges, will be subjected to rapid velocity changes and generate pressure gradient. Such pressure gradient is expected to increase the shear stress to the soft tissue in the intervertebral canals and cause injuries.

CHALMERS, Applied Mechanics, Master’s Thesis 2008: 38
15
3.2 Geometric model
To simplify the complex problem, the vertical vein of the venous plexus was lumped into single flexible pipe which radius is regarded as constant. First, only one vertical vein with seven intervertebral veins has been reproduced. Since the internal vein descents along the central line of spinal canal, it can be regarded as a long and straight pipe. The intervertebral veins, which go through the intervertbral foramen in transversal direction, connect the internal venous plexus with external venous plexus. Moreover, conjoint angle between intervertebral venous vessel and internal venous vessels are regarded as 90 degree. The vertical distance between each intervertebral vein equals the vertical distance of each vertebral body centre.
Dimension of cervical vertebrae and discs have been documented and results were quoted in millimeters. Vertebral height is defined as the average of anterior and posterior heights, and each of them has been measured from the radiographs of 35 male subjects (Vasavada, A.N., et al.,2007) (see
Figure 10).
Figure 8 Definition of the parameters: A, anterior vertebral height; B, posterior vertebral height; C, anterior disc height; D, posterior disc height; E, vertical distance of each vertebral centre. Only mean value (exclude standard deviation) of the vertebral measurements has been adopted. The empirical ratio of intervertebral disc height to vertebral height in cervical region is 2:5 permitting greatest motion. Based on this ratio, the disk height could be calculated out as shown in Table 4.
Since only the internal venous plexus in cervical region has been considered, its length is about 118.8 mm, including half the height of T1 (Figure 11 and 12). These dimensions are stable during whiplash motion and provide rotation center for C7. The vertical vertebral vein and intervertebral veins are given the radii 1.5mm and 1mm respectively (Clemens, 1961)

CHALMERS, Applied Mechanics, Master’s Thesis 2008: 38
16
Table 4 Measurements of the vertebral body and intervertrbal discs height
Vertebral body Height(mm) Discs Height(mm)
C1/C2 17.56 C1/C2 none
C3 13.5 C2/C3 7.02
C4 12.6 C3/C4 5.4
C5 12.2 C4/C5 5.04
C6 12 C5/C6 4.88
C7 13 C6/C7 4.8
T1 13 C7/T1 4.3
Figure 10 Schematic illustration of measurements on the midline longitudinal sections of the subaxial cervical spine
Figure 9 Geometric model : one vertical vein which descents along the central line of spinal canal, with seven intervertebral veins which go through the intervertrbral foramen in transversal direction

CHALMERS, Applied Mechanics, Master’s Thesis 2008: 38
17
3.3 Kinematics model
To reproduce the whiplash motion of the neck during the rear-end collision, data which describe the relative movement of cervical vertebra is required. Ono et al. (2000) carried out a series of volunteer sled tests to analyze human cervical vertebral motion in low-speed rear-end impacts. Thus, kinematics model is based on the experimental data presented by Ono et al. (2000).
Figure 13 Time histories of accelerations of the sled, head, thorax, and pelvis (Ono et al, 2000)
Figure 14 Time histories of the angular motion of the head, torso, and neck (Ono et al, 2000)
The test represents an 8kph rear impact. The volunteer was sitting in a rigid seat without headrest and was restrained by a seat-belt. Figure 13 illustrates the measured accelerations in the test. The peak acceleration of the sled, which represents the peak acceleration of the target vehicle in real collision, is approximately 4g, while the peak head acceleration is approximately 7.5g. The maximum rotational angle of the head is approximately 76 degrees. It occurred at 250ms after the collision, and then the head rebounded about 8 degrees in the following 50ms, see Figure 14.

CHALMERS, Applied Mechanics, Master’s Thesis 2008: 38
18
Figure 11 Rotational angle of each vertebra from the horizontal (Ono et al, 2000)
Figure 12 The interpolation results of the rotational angle of each vertebra
Figure 15 demonstrates the time history of the rotational angle of each vertebra. The definition of the rotational angles is illustrated in Figure 18, in which the volunteer is supposed facing to the right side and the direction of cervical spine extension is defined as the positive rotational direction, and the upward motion was designated as the positive vertical distance (Ono et al, 1997). The rotational angle of each vertebral segment is defined as the angle between the horizontal plane and the line, which is determined by the inferior anterior and posterior points of each vertebral body (β2 to β6 in Figure 18). The cervical vertebra's real pattern of flexion-extension motion is a combination of translation and rotation (Jofe et. al, 1983).

CHALMERS, Applied Mechanics, Master’s Thesis 2008: 38
19
Figure 13 Centers of flexion-extension motion C2-C7 (Penning 1983)
Figure 14 Definition of the rotational angle (Ono et al, 2000)

CHALMERS, Applied Mechanics, Master’s Thesis 2008: 38
20
Penning (1983) suggested that the flexion-extension motion follows a circular path, and defined a center of motion, which is a so-called "instantaneous" center. The instantaneous axes of rotation for the cervical spine motion segments were placed in different locations by various researchers. Suggested locations include the body of the subadjacent vertebra, in the center of the vertebral body, in the disc, and also, specifically, the nucleus pulposus. Penning (1983) compared the mean location of the flexion-extension center of motion in a group of subjects at different levels between C2 and T1, and showed that at C2-C3 the mean location of the center is in the dorsocaudal part of the body of C3, and at C7-T1 about halfway to the cranial end-plate of T1. At the intermediate levels, the center gradually shifts from one extreme position to the other, shown in Figure 17. Thus, it is reasonable to simplify the whiplash motion as each vertebra is rotating around its instantaneous center, which is placed at the center of its sub-vertebral body.
The rotational angle defined in Figure 18 is equal to the angle rotated around its instantaneous center. The movement in starts at 45ms. Considering the real test condition, it is impossible that the volunteers could keep their neck without any movement in the first 45ms. It means that Ono did not present the minor movement of the neck in the first 45ms. To make the kinematics model more closed to the real test, as well as to smooth the movement, we added some slight movement to each vertebra, allowing the neck to move starting at 0ms instead of 45ms. For each curve in Figure 15, we picked seven rotational angles located at 50ms, 65ms, 100ms, 150ms, 200ms, 250ms, and 300ms respectively. Assuming the rotational angle to be zero at the beginning, the overall movement of each vertebra can be predicted by interpolation of the selected points with the help of cubic spline function in MATLAB. The results of the interpolation are shown in Figure 16. Although the desired analyzing range of the cervical vertebral motions is cover the entire range from C1 to T1, due to the limited cineradiographic field of vision (Ono et al, 1997), two assumptions are necessary before applying the volunteer data.
(1) As mentioned in Chapter 1.2.3, C1 and C2 have been regarded as an integrate entity. This means there is no relative rotational motion between them.
(2) The movement of C6 is modeled as rotating around its instantaneous center, which is placed at the center of C7 vertebra body center. But, Ono (2000) failed to record the motion of C7, so we placed the instantaneous center of C6 between C7 and T1, see in Figure 18. This assumption induces an error to the results. However, it has not changed the pattern of the results.
In Figure 18, five squares, which are the so called instantaneous centers of the rotation of C2-C6, were defined as vertebral key nodes (VKN). While, seven triangles are the key nodes on the central line of the spine canal, defined as spine canal key nodes (SKN). The SKN was seen as connected with its adjacent VKN as a rigid body. The relative distance between SKN and VKN is about 20 mm. When a VKN rotates a given angle around its instantaneous center, the SKN follows the same movement as the VKN. For each time step, the positions of VKN were calculated based on the interpolation results of the rotational angle history. The position of SKN is depending on its adjacent VKN. Thereby, the inner volume of the spinal canal can be increased or compressed when the neck is flexed or extended.
The head-neck-torso motion and cervical vertebrae motion of the volunteer in Ono's test is shown in Figure 19. Together with Figure 13 and Figure 15, from the head-neck motion point of view, the whole rear-end collision could be divided into four phases (Ono, 2000):

CHALMERS, Applied Mechanics, Master’s Thesis 2008: 38
21
Figure 15 Head-neck-torso motion by high-speed video (a) and cervical vertebrae motion by X-ray Cineradiography (b) (Ono, 2000)
Phase I (0 to 50ms, Initial Response): No significant motion of head or neck is found in this phase.
Phase II (50 to 100ms, Flexion): The head moves backward in parallel to the torso and the neck shows an s-shape deformation. The head acceleration becomes maximum around 80ms; C6 shows a slight initial flexion and then starts an extension. The extension of upper vertebrae starts later on.
Phase III (100 to 150ms, Flexion-Extension): The head rotation angle starts becoming larger than that of neck around 110ms. Around 130ms, the extension angle of the sixth cervical vertebra becomes maximum. The whole neck shows in extension motion.
Phase IV (150 ms, Final Response Phase: Maximum Extension Motion): The rotational extension angles of the head and neck become maximum around 250ms and then starts resuming the original positions thereafter. The upper vertebrae maintain nearly the same extensional alignment and keep on rotating in line with the 6th vertebra.

CHALMERS, Applied Mechanics, Master’s Thesis 2008: 38
22
Figure 16 Whiplash movement history of the neck, kinematics modeling results (squares represent SKNs; triangles
represent VKNs)
Figure 20 shows the calculated key frames of the whiplash motion. It depicts that the neck flexed slightly in the first 50ms, and then, the head moves backward parallel to the torso in the following 50ms. The whole neck shows extension in the remaining time, the rotational angle of C6 gets maximal at around 130ms. And then, the upper vertebra angles become larger than C6 after 150ms. The maximal S-shape is found at around 80ms. The modeling result matches both Ono's x-ray photos and his description for the whiplash motion. Thus, kinematics model principally duplicated the whiplash motion undergone in Ono's test.
Cadaver test is another efficient way to study the whiplash injuries, especially for higher speed situations. Because there is no soft tissue response in cadaver, the movement of cadaver's neck is unique. Thus, the kinematics model for a cadaver test (Deng B., et al., 2000) have been reproduced using the same way as volunteer test model.

CHALMERS, Applied Mechanics, Master’s Thesis 2008: 38
23
3.4 CFD simulation
The development of commercial CFD software provides us with a convenient way to model the blood pressure change in the vein-plexus. In this thesis, Fluent is used for CFD simulation. The movement of the 3-D neck model is included by means of the User Defined Files (UDF).
The kinematics model solves the position of SKN for every time step. Based on the position of SKN, with the help of MATLAB Curve Fitting Toolbox, a series of fifth-order polynomial equations are generated to describe the motion of the central line of spinal canal at each time step. Since the vertical vein in geometric model descent along this central line, the motion of the vertical vein also can be describe by these equations. Here, the geometric model and the kinematical model are coupled in FLUENT. Any deformation and collapse of the vein are omitted, thus the coordinates of an arbitrary position on the vein model can be determined by keeping its vertical position and changing its horizontal coordinates by adding its offset corresponding to the blood vessel central line.
The vein model was meshed into 53573 cells by Gambit. The blood was simplified to incompressible laminar Newtonian flow, its density is 1050kg/m3, and viscosity is 0.0035kg/(m*s). The cranial end of the model extends to the foramen magnum. The net flow through the cavity is zero (Svensson et al, 1989). Thus, the cranial end of the spinal canal, the foramen magnum can be considered as a rigid wall. The boundary condition at the top of the model was implemented as a wall. As described in Chapter 1.2.2, there is no valve in the vein-plexus. The blood can flow freely through veins in both directions. Therefore, the boundary condition for other ports is outlet vent. To simulate the resistance of veins, each ports has been set a loss coefficient, 0.1 for the bottom of the vein, and 10 for the intervertebral veins. The values of the loss coefficient do not have much theoretical or experimental support. The boundary condition of the wall of the model was set as no-slip wall. The time step size was 0.1ms. 100 iterations for each time step were selected to reduce the influence of the residual. Effect of the boundary condition will be discussed in Chapter 5.2.
The settings of the case described above is called the baseline case. In addition, the boundary conditions and flow type also have been varied to investigate the sensitivity.
In this thesis, the blood flow direction is defined as positive when blood flow upward along vertical vein , and flow out from intervertebral veins.
.

CHALMERS, Applied Mechanics, Master’s Thesis 2008: 38
24
4. Results
As described in Chapter 3.1, the inner volume change of the spinal canal causes the blood to flow in or out of the vertical vein in the cervical spinal canal. Consequently a pressure gradient between the inside and outside of the modelled vein is generated which may damage the nerve tissue in the intervertebral canals. Thereby, the inner volume change of the modelled internal vein plays a significant role on the blood pressure transient. Since the cross-sectional area of the spinal canal was assumed to be constant during the whiplash motion, the volume of the vein is in proportion to the spinal canal length. Figure 21 shows the length change of the spinal canal for each segment. According to the positions of SKN, the spinal canal was divided into six segments, from the top to the bottom named S1 to S6 respectively. Besides S6 represents the part of the spinal canal adjacent to the vertebrae C6 and C7 as a whole segment, S1 to S5 represents the part of the spinal canal adjacent vertebra C1 to C5 respectively. Since the modeled movement of vertebra C6 was based on our assumption (2), the inner volume change of the S6 area may be over-estimated.
a b
Figure 17 The length change of the spinal canal during the whiplash motion: a, absolute length change of each segment(∆L); b, relative length change of each segment(∆L/L)
From 0 to 50ms, the volume change is minor. Thus the variation of the blood pressure in the vein should be very small. Then, from 50 to 100ms, S6 shortens rapidly, while the sum of the increased length in S3, S4, and S5 approximately equals to the decreased length in S6. This means that the blood flows out from S6 region, but flows into S3-S5 region. Moreover, relatively slow blood flow velocity in the S3, S4, and S5 intervertebral veins can be expected in this period. The shortening of S6 continues until 160ms, while the length of middle region decreases after 100ms. From 160- 300ms, the length of S6 becomes longer, and similar increase can be found at S5 after 220ms, while the upper regions

CHALMERS, Applied Mechanics, Master’s Thesis 2008: 38
25
continue shorten. Consequently, positive peak blood pressure can be expected between 160 and 300ms in upper region.
The CFD simulation results of the baseline case are shown in Figure 22. At 50ms, the blood flow downward (negative flow velocity) because the pressure is higher in the upper region than in the lower region. The negative peak pressure is approximately -150Pa, which is found at C3 and C4 around 80ms. Also, the positive pressure is found after 150ms. The blood flows upward (positive flow velocity) before 150ms, and then goes downward orderly. The maximal positive velocity in the vein is found at C4, following with C5 and C6, occurs at around 100ms; While, the peak velocity of C1, C2 and C3 happens at about 120ms. The peak velocity in the intervertebral veins occurs at between 100 to 150ms, and the highest velocity is reached in the upper region of the neck. In summary, the peak negative pressure and peak velocity of the vein are found at C3 and C4, when neck reaches the maximum S-shape. This causes large acceleration upwards and pressure gradients.
a b
c d
Figure 18 CFD simulation results of the baseline case. a, pressure transient in the vertical vein; b, blood velocity transient in the vertical vein (positive value means flow upward); c, blood velocity transient in the intervertebral veins (positive value
means flow out); d, shear stress transient of the intervertebral veins

CHALMERS, Applied Mechanics, Master’s Thesis 2008: 38
26
5. Discussion
5.1 Compared with experimental results
Svensson (1993) measured the pressure change in the pig spinal canal during the extension, shown in Figure 23. According to experiment results, both the peak negative and positive pressure can be found at the middle of the neck. In Figure 22(a), the pressure transient result shows that the peak negative pressure is located at C3 and C4, however, the peak positive pressure occurs at C1. Due to anatomy and movement difference between the volunteer and the pig, the simulation results which are based on the volunteer test could not be exactly the same as the pig test. But, the essential feature of these two results, which is peak negative pressure located at the middle of neck, validates that our result is reasonable. This indicates that geometric and kinematical models are correct and the CFD simulation is a powerful tool for whiplash injuries mechanism study.
Figure 19 The pressure in the CNS versus time, 1mmHg = 133 Pascal (Svensson, 1999)
CHALMERS, Applied Mechanics, Master’s Thesis 2008: 38
27
5.2 Boundary conditions
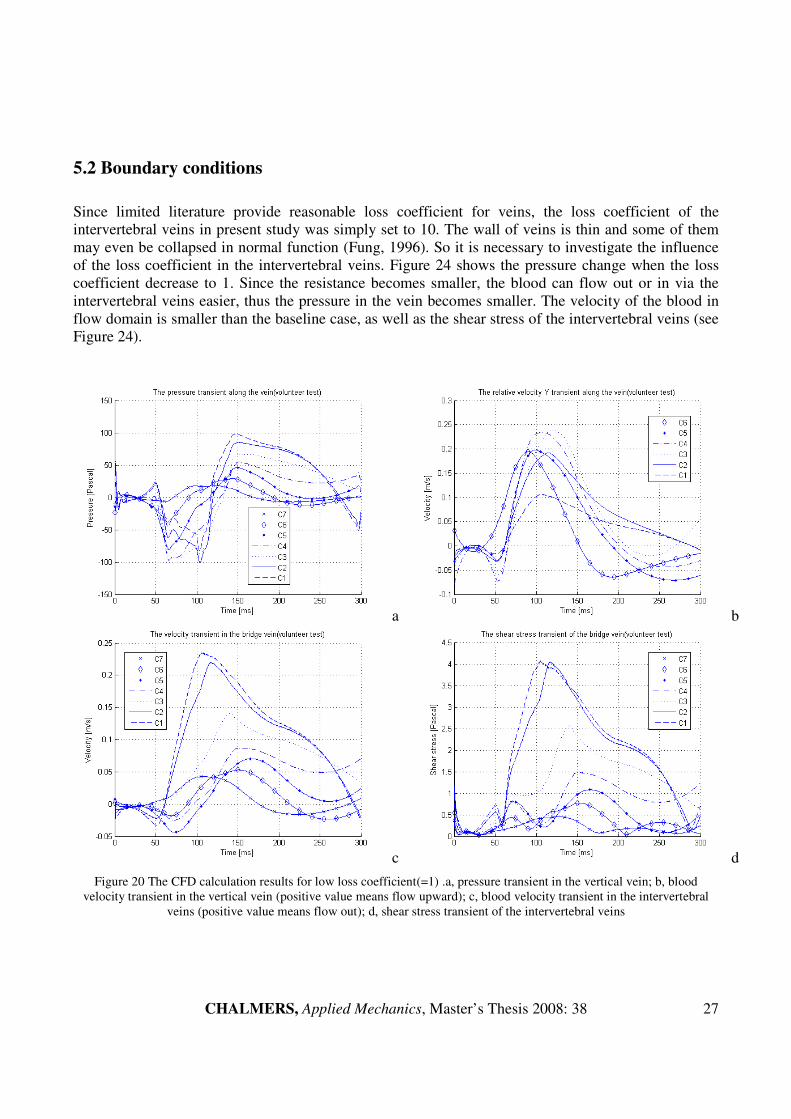
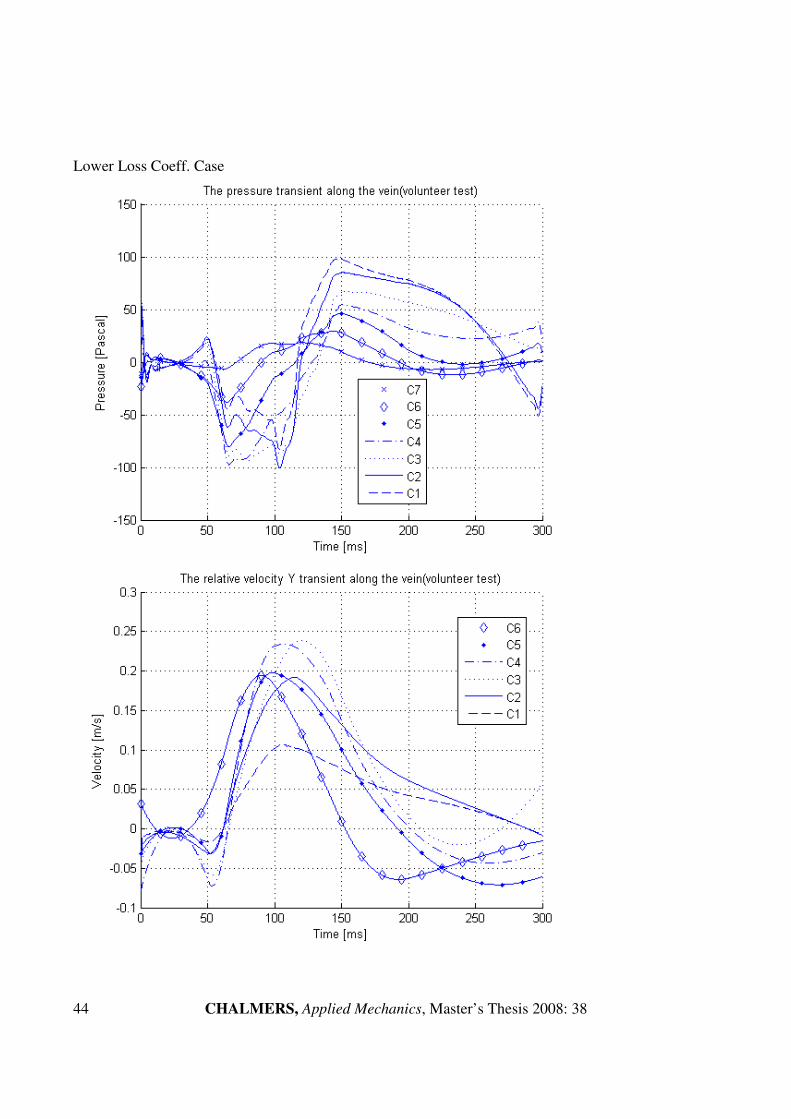
Since limited literature provide reasonable loss coefficient for veins, the loss coefficient of the intervertebral veins in present study was simply set to 10. The wall of veins is thin and some of them may even be collapsed in normal function (Fung, 1996). So it is necessary to investigate the influence of the loss coefficient in the intervertebral veins. Figure 24 shows the pressure change when the loss coefficient decrease to 1. Since the resistance becomes smaller, the blood can flow out or in via the intervertebral veins easier, thus the pressure in the vein becomes smaller. The velocity of the blood in flow domain is smaller than the baseline case, as well as the shear stress of the intervertebral veins (see Figure 24).
a b
c d
Figure 20 The CFD calculation results for low loss coefficient(=1) .a, pressure transient in the vertical vein; b, blood velocity transient in the vertical vein (positive value means flow upward); c, blood velocity transient in the intervertebral
veins (positive value means flow out); d, shear stress transient of the intervertebral veins

CHALMERS, Applied Mechanics, Master’s Thesis 2008: 38
28
If the loss coefficient of the intervetebral veins is raised to 100, due to the higher resistance, the blood pressure, velocity, and shear stress in both vertical vein and intervertebral vein become larger (shown in Figure 25).
a b c
c
d
Figure 21 The CFD calculation results for high loss coefficient(=100). a, pressure transient in the vertical vein; b, blood velocity transient in the vertical vein(positive value means flow upward); c, blood velocity transient in the intervertebral
veins(positive value means flow out); d, shear stress transient of the intervertebral veins
All the plots of the pressure are filtered by a digital filter in MATLAB. The original pressure transient of the baseline case and two additional cases are shown in Figure 26. The oscillation between each time step is significant at C1 and C2. The average magnitude of the oscillation is independent on the time step size and iterations of each time step, as well as calculation schemes. However, increasing the loss coefficient of the intervertebral veins reduces of oscillations remarkably.

CHALMERS, Applied Mechanics, Master’s Thesis 2008: 38
29
a b
c
Figure 22 Pressure oscillations for different loss coefficient cases. a, baseline case; b, lower loss coefficient; c, higher loss coefficient
In baseline case simulation, the net flow through the cavity is assumed to be zero. Thereby, the boundary condition of the top vent is a wall, which means no blood flows in or out from the top of the vein. However, it is interesting to run another simulation when replacing the boundary condition by a high resistance outlet vent (loss coefficient=100), called open-top case. The pressure transient history is shown in Figure 27. From the top to the bottom, the peak pressure decreased with the height of the location, the maximal pressure occurs at C1, while the minimal is found at C7. The pressure transient does not follow the prediction based on volume change analysis.

CHALMERS, Applied Mechanics, Master’s Thesis 2008: 38
30
Figure 23 Pressure transient for the open-top case
5.3 Flow type
In the baseline case, the blood flow is modeled as laminar flow, The Reynolds number, Re, based on the maximum instant flow speed in the veins is about 200. Rapid flow change in short time might cause turbulence. Therefore, it is interesting to see the difference if the blood flow is modeled as turbulent flow during the whiplash. Figure 28 shows the pressure transient in the vein using the k-ε turbulence model. Comparing to the baseline case result shown in Figure 22, the peak negative pressure is still found at C3 and C4 around 80ms, but the magnitude of the pressure is smaller, and changes more rapidly. The time, when pressure goes from negative to positive, is earlier in the turbulence case.
Figure 24 Pressure transient of the baseline model (turbulence flow)

CHALMERS, Applied Mechanics, Master’s Thesis 2008: 38
31
5.4 Cadaver case
As mentioned in Chapter 3.3, a cadaver model was created using the same method as the volunteer model. The recorded vertebral rotational angle for cadaver test is shown in Figure 29 (Deng et al., 2000). The impact speed of the cadaver test is 4.46km/h, and the peak sled acceleration is 5.18g. Comparing with the volunteer test, the impact speed of cadaver test is 3.54km/h slower, but its peak sled acceleration is approximately 1g higher. Without the contraction force generated by the cervical muscle and ligament, the rotational angle of each vertebra is similar. The kinematics modelling result and spinal canal length change analysis result are shown in Figure 30 and Figure 31 respectively. The largest spinal canal length decrease in volunteer test and cadaver test both occur at S6. But in the cadaver test, the length varying at S2, S4 and S5 are slight, the only remarkable length increasing can be found at S1 and S3. The CFD simulation result (shown in Figure 32) demonstrates that the peak negative pressure occurs at C3 at approximately 180ms, followed by C2, C1 and C4. The pressures at all positions become positive after 210ms. The maximum pressure is found at C1, followed by C3, C2 and C4. Though the movement of cervical vertebrae between the cadaver test and the volunteer test are different, a negative peak pressure is found at the middle of the neck.
Figure 29 Absolute rotation of the head and each cervical vertebra (Deng et al., 2000)

CHALMERS, Applied Mechanics, Master’s Thesis 2008: 38
32
Figure 30 Kinematics modelling result of the cadaver test (squares represent SKNs; triangles represent VKNs.)
a b Figure 31 CFD simulation result for cadaver test : a, spinal canal length change of each segment; b, pressure transient in the
vertical vein

CHALMERS, Applied Mechanics, Master’s Thesis 2008: 38
33
6. Conclusion
A simplified kinematics model of neck whiplash motion is created in this thesis. It principally duplicated the swift whiplash motion undergone in the volunteer rear-end collision test. Furthermore, the inner volume change of the spinal canal is calculated as well. For this specific case, the S-shape occurs approximately at 80ms, inner volume increases at S6, and it decreases in the upper cervical region. To verify Aldmen’s hypothesis, CFD simulation is used to find out the pressure transient in the spinal canal. As estimated by the volume change analysis, the peak negative pressure is found at the middle of the neck around 80ms in the CFD simulation results. Moreover, it is the maximal pressure for the whole whiplash duration as well. The rotational angle of the head at this moment is less than 15 degree. Furthermore, the relative rotational angle of each vertebra is less than 10 degree when the S-shape is formed. This is a probable explanation for the phenomena, which after the introduction of the head-restraint, the WAD injuries is only decreased by 20 percent (Nygren et al., 1999). The pressure transient, potentially causing neck injuries, occurs at the beginning of the whiplash motion. It is not until recently that efficient injury avoidance system has been developed for this stage. By the use of new anti-whiplash systems that limit S-shape motion, it has been possible to develop new safety devices for mitigating pressure transients that may cause whiplash injuries.
Since the knowledge of spinal canal blood circulation in the veins is limited, the settings of boundary conditions for the CFD simulations still need experiments and theoretical studies support. From the investigation of the influence of the boundary conditions, some principal can be concluded as follow: No blood flowing through the foremen magnum is a reasonable assumption for the pressure calculation for CFD simulation; within the loss coefficient between 1 to 100 in the intervertebral veins, higher resistance causes higher pressure in the veins, and smaller oscillation between each time step.
Cadaver test is an efficient alternative method for biomechanical engineering study. But, without the response of the soft tissue, under the similar peak head acceleration level, the rotated angle of each vertebra is different compared with the volunteer test. Furthermore, the peak pressure obtained in the cadaver case is approximately three times higher than that of the volunteer test. Even though the cadaver test could provide much larger impact speed and acceleration tolerance, the whiplash movement data recorded from the cadaver test can not be used for predicting the real pressure directly.

CHALMERS, Applied Mechanics, Master’s Thesis 2008: 38
34
7. Further Work
Since the boundary conditions affect the CFD simulation result significantly, more reasonable and physical boundary condition should be put at the most top-priority. Moreover, as the fundamental assumption of this project, the blood flow is laminar flow in the modeled vein during the simulated period. Hence it is valuable to investigate the influence if the blood flow is modeled as turbulent flow.
The kinematics rigid body model used in this project is simple and efficient. Yet, a reliable FEM neck model will provide more details of the whiplash movement, and more accurate results. Especially, the movement of C7 is never recorded in any present tests, but it is very important for the pressure gradient injuries hypothesis studies. The vein is modeled as a pipe which radically rigid but axially flexible, so a fully flexible vein model should be setup to refine the current model. To study the magnitude of the pressure change during the whiplash, a venous plexus model is needed rather than to combine several vertical veins into a big pipe..
To find out reasonable boundary condition, more animal experiments are needed. X-ray cineradiography should be applied to record the movement of vertebrae from C1 to T1. FEM model should be created for kinematics study. Varying the CFD simulation parameters until the results could match the experiment results.
Since the cadaver test provides the possibility for more extreme test, it is necessary to apply the cadaver test data for whiplash pressure change study. But due to the huge difference between cadaver test results and volunteer test results, the relationship between the calculated pressure for cadaver test and the real pressure suffered during the impact should be derived.

CHALMERS, Applied Mechanics, Master’s Thesis 2008: 38
35
8. Reference
Aldman, B. (1986): An analytical approach to the impact biomechanics of head and neck injury. 30th Proceedings of the Association for the Advancement of Automotive Medicine, pp. 439-454. American Association for Automotive Medicine, Arlington Heights, IL
Baston, O. V. (1956): The Vertebral Vein System, Caldwell Lecture. The American Journal of
Roentgenology, 1956, vol.48, no. 2, pp. 195-212
Borochgrevink, G., Smevik, O., Haave, I.(1997): MRI of cerebrum and cervical column within two days after whiplash neck sprain injury. Journal of Injury. 1997;28:331–335.
Boström, O., Svensson, M.Y., Aldman, B., Hansson, H.A., Håland, Y., Lövsund, P., Seeman, T., Sunesson, A., Säljö, A., Örtengren, T.(1996): A new neck injury criterion candidate-base on injury finding the cervical spinal ganglion after experimental neck extension trauma. IRCOBI 1996
Brain, D. S., Narayan, Y., Frank, A.P.(2003): Gender dependent cervical spine segmental kinematics during whiplash. Journal of Biomechanics, 36, 1281-1289, 2003
Breig, A.(1978): Adverse Mechanical Tension in the Central Nervous System. Almquist & Wiksell Int., Stockholm, Sweden, ISBN 91-2200126-3
Compton, C.(1993): The use of public crash data in biomechanics research. Accident injury biomechanics and prevention. New York: Springer, 1993. p. 49± 66.
Deans, G.T., Mcgalliard J.N., Rutherford W.H.(1986): Incidence and duration of neck pain among patients injured in car accidents.Br Med J, 1986; 292:94–5.
Deng, B.(2000): Kinematics of Human Cadaver Cervical Spine During Low Speed Rear-end Impacts, 44th Stapp Car Crash Conference, 2000
Edward, J.E., Barton, F.B.(2006): It’s Not a Cervical Lymph Node, It’s a Vein: CT and MR Imaging Findings in the Veins of the Head and Neck. RadioGraphics, 2006; 26:1501–1515
Eichberger, A., Darok, M., Steffan, H.(2000): Pressure measurements in the spinal canal of post-mortem human subjects during rear-end impact and correlation of results to the neck injury criterion.Accid Analysis Prev. 2000;32:251–260.
Eric, E.S., Floyd, R.T., Mike, C.(2005): Cervical Spine Functional Anatomy and the Biomechanics of Injury Due to Compressive Loading. Journal of Athletic Training, 2005;40(3):155-161
Feng, Y.C. (1984): Biodynamics: Circulation. Springer Verlag, New York Inc., ISBN 0-387-90867-6
Gargan, MF, Bannister, GC.(1990): Long-term prognosis of soft tissue injuries of the neck. J Bone Joint Surg 1990;72B:901–3.
Jason, C.E., Scott, D.H., Humphreys, S.C.(2001): Whiplash: A Review of a Commonly Misunderstood
Injury. Excerpta Medica, Inc(2001). PII S0002-9343(01)00680-5

CHALMERS, Applied Mechanics, Master’s Thesis 2008: 38
36
Kischka, U., Ettlin, T.H., Heim, S(1991): Cerebral symptoms following whiplash injury. Eur Neurol 1991;31:136–40.
Macnab, I.(1971): The whiplash syndrome. Orthop Clin North Am 1971;2:389–403.
Nygren, Å.(1984): Injuries to Car Occupants – Some Aspects of the Interior Safety of Cars. Akta Oto-Laryngologica, Supplement 395, Almqvist & Wiksell, Stockholm, Sweden, ISSN 0365-5237
Nygren, Å., Gustafsson, H., Tingvall, C.(1985): Effects of Different Types of Headrests in Rear-End Collisions. SAE paper no. 856023, 10th Int. Conference on Experimental Safety Vehicles, pp. 85-90, NHTSA, USA.
O’Neill, B., Haddon,W., Kelley, A.B.(1972): Automobile head restraints – frequency of neck claims in relation to the presence of head restraints. Am J Public Health 1972;62:403.
Ono, K., Kaneoka K., Wittek, A., Kajzer, K.(2000): Cervical Injury Mechanism Based on the Analysis of Human Cervical Vertebral Motion and Head-Neck-Torso Kinematices During Low Speed Rear Impacts, Frontiers in Whiplash Trauma 2000,vol 38, p372-p388
Penning, L.(1995): Kinematics of cervical spine injury: a functional radiological hypothesis. Eur Spine
J 1995; 4:126-132
Petterson, K., Hildingsson, C., Toolanen, G.(1994): MRI and neurology in acute whiplash trauma. No correlation in prospective examination of 39 cases. Acta Orthop Scand 1994;65:525–528.
Radanov, B.P., Sturzenegger M., Di Stefano G.(1995): Long-term outcome after whiplash injury. A 2-year follow-up considering features of injury mechanism and somatic, radiologic, and psychosocial findings. Medicine 1995;74:281–97.
Richard, H.R., Frederick, A.S.(1982): The Spine, Second Edition, vol 1, p47
Ryan, G.A., Gibson, T.(2000): Field Studies of whiplash in Australia. Frontiers in Whiplash Trauma 2000, P164-169
Sances, Jr.A., Maiman, D.J., Myklebust, J.B., Larson, S.J, Cusick, J.F. (1984): Biodynamics of
Vehicular Injuries. In: Automotive Engineering and Litigation, Garland Law Publishing Inc., New York, pp.449-550
Schmitt, K.-U., Muser, M., Niederer, P., Walz, F.(2001): Pressure Aberrations Inside the Spinal Canal
During Rear-End Impact. Pro. International Congress on Whiplash Associated Disorders.
Severy, D.M., Mathewson J.H., Bechtol C.O.(1955): Controlled automobile rear-end collisions, an investigation of related engineering medical phenomena.Can Services Med J 1955;11:727–59.
Siegmund, G.P., Wheeler J.B., Brault J.R.(1998): Volume Changes in the Human Cervical Spinal
Canal Between the Neutral and Retracted Head Positions, Proc of Whiplash '98 Symposium, 1998
Svensson, M.Y.(1993): Neck-Injuries in Rear-End Car Collisions – Sites and biomechanical causes of
the injuries, test methods and preventive measures. Doctor Thesis at Crash safety division at Chalmers University of Technology, Gothenburg, Sweden.

CHALMERS, Applied Mechanics, Master’s Thesis 2008: 38
37
Vasavada, A.N.(2007): Head and neck anthropometry, vertebral geometry and neck strength in height-matched men and women. Journal of Biomechanics 2007, doi:10.1016/j.jbiomech.2007.07.007
Yang, K.H., Begeman, P.C.(1996): A Proposed Role for Facet Joints in Neck Pain in Low to Moderate Speed Rear End Impacts Part I: Biomechanics, 6th
Injury Prevention Through Biomechanics
Symposium: 59-63, 1996
Yang, K.H., Albert, K.(2003): Neck kinematics in rear-end impacts. Pain Res Mange Vol 8 No 2 Summer 2000

CHALMERS, Applied Mechanics, Master’s Thesis 2008: 38
38
9. Appendix
Appendix A User Defined File(UDF)
#include"udf.h" DEFINE_GRID_MOTION(vessel, domain, dt, time, dtime) { Thread *tf = DT_THREAD(dt); face_t f; Node *node_p; real P[3000][6], Y[3000][7]; /*P: coefficient Y: coordinate*/ real x, y, z; real delta_1=0, delta_2=0, delta_x=0; real J=0.0, K=0.0; real up_nod0,dw_nod0,up_nod1,dw_nod1; /*0=last timestep; 1=current timestep*/ int update_y,section_id; int N=time/dtime; /*N is time step; time is [0.001 0.255]*/ int i, n, m, v; FILE *file_1; FILE *file_2; file_1=fopen("vessel_motion_3000.mat", "r"); file_2=fopen("vessel_node_y_3000.mat", "r"); for(m=0;m<3000;++m){ for(v=0;v<6;++v){ fscanf(file_1, "%f",&P[m][v]); } } fclose(file_1); for(m=0;m<3000;++m){ for(v=0;v<7;++v){ fscanf(file_2, "%f",&Y[m][v]); } } fclose(file_2);

CHALMERS, Applied Mechanics, Master’s Thesis 2008: 38
39
begin_f_loop(f,tf){ f_node_loop(f,tf,n){ node_p=F_NODE(f, tf,n); if(NODE_POS_NEED_UPDATE(node_p)){ update_y=0; section_id=-1; NODE_POS_UPDATED(node_p); z= NODE_Z (node_p); y= NODE_Y (node_p); x= NODE_X (node_p); if (y<0 && update_y==0){ /*deal with y<0 section*/ update_y=1; section_id=0; J=0; delta_x=x-(P[N-1][0]*pow(y,5)+P[N-1][1]*pow(y,4)+P[N-1][2]*pow(y,3)+P[N-1][3]*pow(y,2)+P[N-1][4]*pow(y,1)+P[N-1][5]); } for(i=1;i<=6;++i){ /*N is time step, i is node index and section index*/ up_nod0=Y[N-1][i]; /*last time step*/ dw_nod0=Y[N-1][i-1]; up_nod1=Y[N][i]; /*current time step*/ dw_nod1=Y[N][i-1]; if(y>=dw_nod0 && y<=up_nod0 && update_y==0){ /*IN section 1~6*/ update_y=1; section_id=i; delta_1=up_nod0-dw_nod0; delta_2=up_nod1-dw_nod1; delta_x=x-(P[N-1][0]*pow(y,5)+P[N-1][1]*pow(y,4)+P[N-1][2]*pow(y,3)+P[N-1][3]*pow(y,2)+P[N-1][4]*pow(y,1)+P[N-1][5]); J=(y-dw_nod0)*delta_2/delta_1+dw_nod1; break; } } /*in section 0*/ /*if(update_y==0 && y<=0.0065){ update_y=1; section_id=0; delta_x=x-(P[N-1][0]*pow(y,5)+P[N-1][1]*pow(y,4)+P[N-1][2]*pow(y,3)+P[N-1][3]*pow(y,2)+P[N-1][4]*pow(y,1)+P[N-1][5]); J=y; } */

CHALMERS, Applied Mechanics, Master’s Thesis 2008: 38
40
if(update_y==0){ /*IN higher then section 6 part*/ update_y=1; section_id=7; J=Y[N][6]; delta_x=x-(P[N-1][0]*pow(y,5)+P[N-1][1]*pow(y,4)+P[N-1][2]*pow(y,3)+P[N-1][3]*pow(y,2)+P[N-1][4]*pow(y,1)+P[N-1][5]); } if(update_y){ K= P[N][0]*pow(J,5)+P[N][1]*pow(J,4)+P[N][2]*pow(J,3)+P[N][3]*pow(J,2)+P[N][4]*pow(J,1)+P[N][5]; /* calculate X value from motion equation */ NODE_Z (node_p) = z; /* update z value */ NODE_Y (node_p) = J; /* update Y value */ NODE_X (node_p) = delta_x+K ; /* update X value */ } else{ Message("find a un-updated point: (%g,%g)",x,y); Error("un-updated point error!"); } } } } end_f_loop(f,tf) ; }

CHALMERS, Applied Mechanics, Master’s Thesis 2008: 38
41
Appendix B Simulation Results
Test Matrix Boundary Conditions
Case Name Kinematics
model Flow Type
Bottom Top Side
Baseline Case
Volunteer Laminar Outlet vent loss_coeff.=0.1
Wall Outlet vent loss_coeff.=10
Lower Loss Coeff. Case
Volunteer Laminar Outlet vent loss_coeff.=0.1
Wall Outlet vent loss_coeff.=1
Higher Loss Coeff.
Case Volunteer Laminar
Outlet vent loss_coeff.=0.1
Wall Outlet vent
loss_coeff.=100
Open Top Case
Volunteer Laminar Outlet vent loss_coeff.=0.1
Outlet vent loss_coeff.=100
Outlet vent loss_coeff.=10
Turbulent Case
Volunteer Turbulence Outlet vent loss_coeff.=0.1
Wall Outlet vent loss_coeff.=10
Cadaver Case
Cadaver Laminar Outlet vent loss_coeff.=0.1
Wall Outlet vent loss_coeff.=10

CHALMERS, Applied Mechanics, Master’s Thesis 2008: 38
42
Baseline case

CHALMERS, Applied Mechanics, Master’s Thesis 2008: 38
43
CHALMERS, Applied Mechanics, Master’s Thesis 2008: 38
44
Lower Loss Coeff. Case

CHALMERS, Applied Mechanics, Master’s Thesis 2008: 38
45

CHALMERS, Applied Mechanics, Master’s Thesis 2008: 38
46
Higher Loss Coeff. Case

CHALMERS, Applied Mechanics, Master’s Thesis 2008: 38
47

CHALMERS, Applied Mechanics, Master’s Thesis 2008: 38
48
Open Top Case

CHALMERS, Applied Mechanics, Master’s Thesis 2008: 38
49

CHALMERS, Applied Mechanics, Master’s Thesis 2008: 38
50
Turbulence Case

CHALMERS, Applied Mechanics, Master’s Thesis 2008: 38
51

CHALMERS, Applied Mechanics, Master’s Thesis 2008: 38
52
Cadaver Case

CHALMERS, Applied Mechanics, Master’s Thesis 2008: 38
53